Embed Size (px)
Citation preview

1
THE MOLECULAR BASIS OF THE EFFECT OF TEMPERATURE ON ENZYME ACTIVITY
Roy M. Daniel*, Michelle E. Peterson*, Michael J. Danson†, Nicholas C. Price‡, Sharon M. Kelly‡, Colin R. Monk*, Cristina S. Weinberg*, Matthew L. Oudshoorn*, and Charles K.
Lee* * Department of Biological Sciences, University of Waikato, Private Bag 3105, Hamilton, New
Zealand, † Centre for Extremophile Research, Department of Biology and Biochemistry, University of
Bath, Bath, BA2 7AY, UK, ‡ IBLS Division of Molecular and Cellular Biology, University of Glasgow, Glasgow, G12 8QQ,
UK. Address correspondence to: Charles K. Lee, PhD, Department of Biological Sciences, University of Waikato, Private Bag 3105, Hamilton, New Zealand 3240. Fax +64-7-8384324; E-mail: [email protected]/[email protected] Running title; Molecular basis of temperature effects on enzyme activity Keywords: adaptation; equilibrium model, molecular, enzyme, temperature, evolution Abbreviations used: Eact, active enzyme; Einact, inactive enzyme; Teq, temperature at which the concentrations of Eact and Einact are equal; AAA, aryl acylamidase; ACP, acid phosphatase; AKP, alkaline phosphatase; DHFR, dihydrofolate reductase; FUM, fumarase; GCS, citrate (si)-synthase; GDH, glutamate dehydrogenase; γ-GTP, γ-glutamyltransferase; α-GLU, α-glucosidase; ß-GLU, ß -glucosidase; IPMDH, isopropylmalate dehydrogenase; MDH, malate dehydrogenase; PAL, phenylalanine ammonia lyase; Succ-AAPA-pNA, succinyl-AlaAlaProAla-p-nitroanilide; Succ-AAPL-pNA, succinyl-AlaAlaProLeu-p-nitroanilide; Succ-AAPNle-pNA, succinyl-AlaAlaProNorleucine-p-nitroanilide; Succ-AAPV-pNA, succinyl-AlaAlaProVal-p-nitroanilide; Succ-AAA-pNA, succinyl-AlaAlaAla-p-nitroanilide; Succ-AAPF-pNA, succinyl-AlaAlaProPhe-p-nitroanilide; pNP, p-nitrophenol. SYNOPSIS
Experimental data show that the effect of temperature on enzymes cannot be adequately explained in terms of a two-state model based on increases in activity and denaturation. The Equilibrium Model provides a quantitative explanation of enzyme thermal behaviour under reaction conditions by introducing an inactive (but not denatured) intermediate in rapid equilibrium with the active form. The temperature mid-point (Teq) of the rapid equilibration between the two forms is related to the growth temperature of the organism, and the enthalpy of the equilibrium (∆Heq) to its ability to function over various temperature ranges. We show here that the difference between the active and inactive forms is at the enzyme active site. The results reveal an apparently universal mechanism, independent of enzyme reaction or structure, based at or near the active site, by which enzymes lose activity as temperature rises, as opposed to denaturation which is global. Results show that activity losses below Teq may lead to significant errors in the determination of ∆G*cat made on the basis of the two-state ("Classical") model, and the measured kcat will then not be a true indication of an enzyme’s catalytic power. Overall the results provide a molecular rationale for observations that the active site tends to be more flexible than the enzyme as a whole, and that activity losses precede denaturation, and a general explanation in molecular terms for the effect of temperature on enzyme activity.

2
INTRODUCTION
The way enzymes respond to temperature is fundamental to many areas of biology. Until recently the effect of temperature on enzyme activity has been understood in terms of raised temperature increasing activity and at the same time causing activity to be lost by denaturation (e.g., [1-3]). However, it is now clear that these two opposing effects are insufficient to explain the effect of temperature, and that the effect of temperature on enzymes over time cannot be predicted from the ∆G*cat and ∆G*inact of the enzyme [4-8]. The Equilibrium Model [4-7] has provided a quantitative explanation of enzyme thermal behaviour by introducing an intermediate inactive (but not denatured) form that is in rapid equilibrium with the active form.
Eact
Keq Einactkinact⎯ →⎯⎯ X
where Eact is the active form of the enzyme, which is in equilibrium with the inactive form, Einact; Keq is the equilibrium constant describing the ratio of Einact/Eact; kinact is the rate constant for the Einact to X reaction; X is the irreversibly-denatured form of the enzyme.
Table 1 shows a variety of enzymes for which Equilibrium Model parameters have been determined; all fitted the Model. The enzymes cover most reaction classes and could all be measured directly and continuously, ensuring rapid and accurate collection of Vmax data. It is apparent from the range of structures, from monomeric to hexameric, and including a citrate synthase where the active site is at a subunit interface [6, 7, 9-14], that conformity with the Equilibrium Model is apparently independent of quaternary structure as well the reaction concerned. The data suggest that the Equilibrium Model is universally applicable to all enzymes where Vmax data can be obtained.
Using the Equilibrium Model, the variation of enzyme activity with temperature can be expressed by:
Vmax = kcatE0e−kinactKeq t1+Keq
1+ Keq
where Keq = eΔHeqR
1Teq
−1T
⎛
⎝⎜
⎞
⎠⎟
kcat =kBThe−ΔGcat
*
RT
and kinact =kBThe−ΔGinact
*
RT
where kcat = enzyme catalytic rate constant; t = assay duration; [E0] = enzyme concentration; ∆Heq = the change in enthalpy associated with the Eact/Einact equilibrium; Teq = the temperature mid-point of the Eact/Einact equilibrium; kB = Boltzmann's constant; R = Gas constant; T = temperature; h = Planck's constant; ΔG*cat = activation energy of the catalysed reaction; ΔG*inact = activation energy of the thermal inactivation process.
The experimental data (Fig. 1A) fit the Equilibrium Model (Fig. 1B), but not a simpler two-state model that only considers ΔG*cat and ∆G*inact (The "Classical Model", Fig. 1C). The new parameters associated with the model provide tools for understanding and quantifying the temperature dependence of enzyme activity and the adaptation of enzymes and organisms to temperature, and to ranges of temperature. Teq, the temperature of the mid-point of the

3
equilibrium between the active and reversibly-inactive forms of the enzyme, is an evolved property of enzymes related to the organism's growth temperature, being more closely correlated with the environmental temperature of the enzyme than is its stability [9]. ∆Heq, the enthalpic change associated with the equilibrium, governs the temperature range over which the equilibrium occurs and thus the ability of the enzyme to function at different temperatures and temperature ranges [9].
The Equilibrium Model quantitatively explains the effect of temperature on all enzymes for which Vmax can be measured over a range of temperatures [4-7, 9, 11-13, 15, 16] and has predicted and explained the counterintuitive behaviour of enzyme reactors at some temperatures ([15] and Oudshoorn & Daniel, personal communication). We cannot exclude the possibility that more complex models for the dependence of enzyme activity will fit experimental data, but none have been demonstrated.
The Equilibrium Model in itself does not offer an explanation of the molecular basis of these effects, or the physical nature of Einact. We provide evidence here that the difference between the active and inactive forms is at the enzyme active site, and confirm that Keq and its components Teq and ∆Heq are independent of global stability. This enables a general explanation in molecular terms for the effect of temperature on enzyme activity and reveals a new structurally-localised and apparently universal mechanism for enzyme activity loss with increasing temperature, additional to denaturation. EXPERIMENTAL
Continuous Enzyme assays Continuous spectrophotometric enzyme assays were carried out as previously described [9,
14, 16] using a Thermo Spectronic Helios γ-spectrophotometer equipped with a Thermo Spectronic single-cell Peltier-effect cuvette holder. Assays were performed across a suitable range of temperatures for each enzyme, and spectrophotometric data were collected at half-second or one-second intervals for three to five minutes using Vision32 (version 1.25, Thermo Spectronic Inc.) on a Windows XP PC connected to the spectrophotometer.
All reactions were started by rapidly adding no more than 10 µl of enzyme solution (kept at 0ºC) to ≤1000 µl of temperature-equilibrated reaction mixture (containing substrate/cofactor and reaction buffer) in a quartz cuvette. Data collection started within 3 seconds after enzyme addition, and the temperature of the reaction remained within ± 1ºC of the desired temperature. Where possible, substrate concentrations were set to at least ten times Km to approach Vmax; where it was not possible to do so (e.g., high Km, poor substrate solubility), Km values were determined and used to compensate for the deviation from Vmax. Blank rates were measured and used to correct reaction rates if necessary. All criteria required for accurate and valid determination of Equilibrium Model parameters [14] were met.
All enzymes shown in Table 1 have been assayed directly and continuously to allow rapid and accurate data collection and temperature control.
Bacillus subtilis subtilisin A (Cat. No. P5380, Sigma-Aldrich Co., St. Louis, MO, USA) was assayed in 50 mM phosphate buffer, pH 7.3, using the following substrates (purchased from Bachem AG, Bubendorf Switzerland; S0 = substrate concentration, E0 = enzyme concentration): 10 mM succinyl-AlaAlaProAla-p-nitroanilide (E0 = 118 nM); succinyl-AlaAlaProLeu-p-nitroanilide (7 mM at 60 to 65ºC, 10 mM at 70 to 75ºC, 15 mM at 80 to 85ºC; E0 = 4.53 nM); 10 mM succinyl-AlaAlaProPhe-p-nitroanilide (E0=2.28 nM); 10mM succinyl-AlaAlaProNle-p-nitroanilide (E0 = 3.37 nM); succinyl-AlaAlaProVal-p-nitroanilide (25 mM at 30 to 70ºC, 50 mM at 75 to 85ºC; E0 = 337 nM). The assay volume was 400 µl in a quartz cuvette of 2 mm

4
pathlength. Enzyme activity was measured by monitoring the production of p-nitroaniline at 400 nm (absorption coefficient = 9290 M-1cm-1).
Caldicellulosiruptor saccharolyticus β-glucosidase, expressed recombinantly in E. coli, was purified using chromatography following heat treatment [17]. It was assayed as described previously [9] using various substrates (purchased from Sigma-Aldrich Co., St. Louis, MO, USA), including 30 mM p-nitrophenyl β-D-glycopyranoside, 20 mM p-nitrophenyl β-D-galactopyranoside, 20 mM p-nitrophenyl β-D-fucopyranoside, and 52 mM p-nitrophenyl β-D-xylopyranoside. 50 mM Na+ phosphate buffer, pH 6.3, was used as reaction buffer, and the concentration of enzyme in the assay was 0.586 µM for all substrates except pNP-β-D-xylopyranoside, which was 0.293 µM. The assay volume was 400 µl in a quartz cuvette of 2 mm pathlength. Enzyme activity was measured by monitoring the production of p-nitrophenol at 410 nm (absorption coefficient = 7930 M-1cm-1).
Bos taurus glutamate dehydrogenase (L-glutamic dehydrogenase from bovine liver, cat no. G7882, Sigma-Aldrich Co., St. Louis, MO, USA) was assayed in 90mM phosphate buffer, pH 7.3, with 0.05 mM EDTA, 160 mM ammonium acetate, 10 mM 2−οxoglutarate, and 0.5 mM NADPH or NADH. The assay volume was 1 ml in a 10 mm pathlength quartz cuvette; enzyme activity was measured by monitoring absorbance at 340 nm (absorption coefficient = 6220 M-
1cm-1). Bacillus strain AK1 proteinase was cloned and expressed in E. coli; cells were harvested and
lysed by sonication, and the enzyme purified using phenyl sepharose [18]. The enzyme was assayed in 100 mM HEPES/NaOH with 5 mM CaCl2, pH 7.5, using 22.5 mM succinyl-AlaAlaAla-p-nitroanilide and 50 mM succinyl-AlaAlaProPhe-p-nitroanilide. The assay volume was 400 µl in a quartz cuvette of 2 mm pathlength. The final enzyme concentration was 30.4 nM. Enzyme activity was measured by monitoring the production of p-nitroaniline at 410 nm (absorption coefficient = 7930 M-1cm-1). The enzyme was pre-treated by incubation in buffer in the absence and presence of 10 mM DTT for 60 min at room temperature, then diluted 1:1 before adding to the reaction mix.
Data processing The processing of enzyme assay data was performed as described in detail in [14] using the
MATLAB-based Equilibrium Model data processing application on a Compact Disc (CD-ROM), available on request from the corresponding author. In short, absorbance data from Vision32 were first converted to progress curves of product concentration (M) versus time (seconds) in Excel, which were then loaded into the Equilibrium Model application, which performs the facile derivation of Equilibrium Model parameters from the experimental data. The application employs a fitting algorithm based on a least squares approximation run over multiple iterations to identify a set of thermodynamic parameters that best describe the experimental data within the confines of the Equilibrium Model. The resulting parameters were used to generate a simulated 3D plot of enzyme activity profile (activity versus temperature versus time) that is then compared to the corresponding 3D plot generated from smoothed raw assay data to ensure the validity of the final Equilibrium Model parameters. The figures in brackets in the tables are the standard deviations of the fit of the data to the model [14].
Circular dichroism Saccharomyces cerevisiae α-glucosidase (E-SUCR, Megazyme International Ltd, Wicklow,
Ireland) was chosen for its prominent circular dichroism (CD) responses in the near UV spectrum, which in turn are caused by the distinct characteristics of Trp residues, especially those

5
near its active site (data not shown); however, it should be noted that the CD spectrum cannot be considered a quantitative measure of the overall conformation of the enzyme. CD time-course observations were performed at 292 nm, the wavelength at which the CD signal is maximal. Time-course experiments and CD spectral scans performed in the presence of substrate (i.e. under assay conditions) were carried out using 0.5 mg·ml-1 of S. cerevisiae α-glucosidase in the presence of 300 mM maltose (SigmaUltra, Cat No. M9171, Sigma-Aldrich Co., St. Louis, MO, USA). A high concentration of maltose was used to avoid significant substrate depletion during measurement and thus to mirror the conditions used for the collection of Equilibrium Model data. Neither maltose nor its product glucose absorb significantly in the near UV range, regardless of temperature (data not shown). The buffer used was 20 mM sodium phosphate buffer, pH 7.5, and the total volume for each reaction was 2 ml. All CD measurements were done using a quartz cuvette of 10 mm path-length. For CD spectral data, approximately 60 seconds passed between enzyme addition and the completion of the CD spectral scan. For CD time-course experiments, data recording started immediately (i.e., within 6 seconds) after enzyme was added to a pre-temperature equilibrated reaction mix.
S. cerevisiae α-glucosidase (4.84 nM) was assayed discontinuously using 300 mM maltose as substrate in 18 mM phosphate buffer, pH 7.0. Aliquots (100 µl) of the reaction were transferred at desired intervals to screw-capped tubes containing 100 µl of 50 mM phosphate buffer, pH 7.0, at 100ºC. The tubes were capped and placed in a water bath at 100ºC for 7 min to terminate the α-glucosidase reaction, and then transferred to an ice-water bath until samples for the full time-course had been collected (8.5 min at 30-second intervals). To each 200 µl stopped reaction mix, 3 units of glucose dehydrogenase (Cat. No. G5059, Sigma-Aldrich Co., St. Louis, MO, USA) and β-NADP+ to a final concentration of 4.5 mM were added and incubated at 35ºC for 35 min. The concentrations of NADPH were calculated from absorbance data at 340 nm (5 mm pathlength cuvette). RESULTS
Eact/Einact transition timescale The timescale for the Eact/Einact equilibration is clearly rapid, since all the variation of activity
at zero time (e.g., Fig. 1A, [4-7]) occurs as a result of changes in the Eact/Einact equilibrium, and is thus attained over timescales shorter than the mixing process, probably <2 s. The implication is that for every enzyme tested (Table1) the Eact/Einact equilibration timescale is of this order or faster whereas most proteins take very much longer than this to unfold [19, 20]. This is particularly the case given the relatively low temperatures at which some Eact/Einact equilibrations take place. The results shown below demonstrate that many enzymes are only partially active at physiological temperatures, depending on the value of ∆Heq. For enzymes with low ∆Heq values, the Eact/Einact conversion takes place over a broad temperature range, beginning at relatively low temperatures. For example, 10% of the P. dulcis β-glucosidase enzyme (∆Heq=100 kJ·mol-1) is already in the Einact form at 36ºC. On the other hand, for E. coli MDH (∆Heq=619 kJ·mol-1), 10% Einact is not reached until 67ºC.
Magnitude of ΔHeq
The enthalpic change associated with the Eact/Einact equilibrium, ΔHeq, is much smaller than
that associated with denaturation (ΔHunfold) per amino acid residue. For example, the ΔHeq for subtilisin at 60°C (i.e., at Teq) is approximately 110 kJ·mol-1 (Table 2), whereas the ΔHunfold at

6
this temperature has been determined to be approximately 1350 kJ·mol-1 [21]. For ten single-subunit enzymes with Teq values between 53ºC and 75ºC, the average ΔHeq per residue is 0.47 kJ·mol-1·residue (S.D. 0.40 kJ·mol-1·residue, range 0.08-1.51 kJ·mol-1·residue). Similar values apply to multi-subunit enzymes. An estimate for the average ΔHunfold per residue in this temperature range is 3.0-4.3 kJ·mol-1·residue [22, 23]. While this is at best an approximation, it confirms that the expected ΔHunfold for these enzymes is about an order of magnitude greater than their ΔHeq.
Structural studies We have used circular dichroism (CD) to probe the extent and timing of the structural
changes associated with the Eact–Einact equilibrium and with denaturation in the α-glucosidase from S. cerevisiae under assay conditions. Near UV CD spectral features specific to the native (non-denatured) enzyme were observed at 15ºC in the presence of 300 mM maltose (Fig. 2, solid line), whereas at 43ºC in the absence of substrate (i.e., non-Equilibrium Model condition), where the enzyme is denatured, no distinct features can be seen (Fig. 2, dotted line). Similar observations were made from CD time-course experiments monitoring CD signals at 292 nm (Fig 3). At 15ºC in the presence of substrate, the initial CD signal of the enzyme at 292 nm is very similar to the value seen in Fig. 2 (Fig. 3, dashed line) and changes only slightly over the duration of the experiment (25 min); this is expected since under such conditions the enzyme exists mostly in its active form ([Eact]>99.95%) and undergoes very limited denaturation. By contrast, at 43ºC in the absence of substrate, the CD signal at 292 nm decreases quickly (Fig. 3, dotted line) and irreversibly (data not shown) reflecting both the absence of any stabilizing effect of substrate, and the buffering effect of the Eact/Einact equilibrium against denaturation [4, 5, 13]. The initial CD signal under this condition is also considerably lower than that at 43ºC in the presence of substrate (Fig. 3, solid line), where about 50% of the enzyme exists as Einact and where the initial CD signal is itself significantly reduced compared with that at 15ºC (dashed line). Furthermore, the decrease of CD signal at 43ºC in the presence of substrate over the course of the experiment is comparable to the rate of enzyme denaturation in the assay (see Fig. 4).
CD time-course experiments suggest that the changes in tertiary structure occur in at least two stages, over different timescales. The first stage (the Eact/Einact transition) can be seen in the difference between the initial CD signals at 15ºC and 43ºC in the presence of substrate (Fig. 3, dashed and solid lines, respectively), which corresponds to a shift from ~100% Eact (15ºC) to approximately 50% Eact:50% Einact (43ºC); this shift is rapid since the time-course was started at near zero-time, i.e., within 6 seconds of addition of the enzyme to substrates and buffer. The second and time-dependent change is thermal denaturation, which occurs at a rate comparable with that of the conversion from Einact to X (Fig. 3, solid and dashed-dotted lines and Fig. 4, changes along the rate/time axes at 43ºC) and is slower than the rate of decrease in the absence of substrate (Fig. 3, dotted line). Furthermore, one enzyme-substrate mixture was incubated at 43ºC for an additional 30 min after the time-course experiment and monitored again for another 25 min (dashed-dotted line), after which its CD signal is essentially identical to that of the fully denatured enzyme (Fig. 3, dotted line). It is likely that the enzyme denatured fully during the extended incubation and exists solely as the denatured form.
Substrate effects Teq and ∆Heq are substrate specific; i.e., different enzyme-substrate combinations have their
own characteristic values of Teq and ∆Heq (Table 2). These are often markedly different from one

7
another, with some relationship between the size of the differences in Teq and ∆Heq and the extent of the structural differences.
In the case of subtilisin, the effect is evident at the S1 site since the only difference in the substrates is at the P1 position. The change from leucine to norleucine at the P1 position of the substrate has relatively little effect on ∆G*cat or ∆G*inact but marked changes can be seen for Teq and ∆Heq; the change from norleucine to alanine does not significantly affect stability, but there are major differences in Teq and ∆Heq as well as in ∆G*cat. For phenylalanine the stability and the Teq are the same as for valine, but the ∆Heq is higher than for any of the other substrates.
For β-glucosidase the effect of the 6-deoxyhexose, fucose, is to lower stability and raise Teq and ∆Heq compared with the aldohexose substrates galactose and glucose. These two have the same Teq and similar stabilities. The pentose substrate xylose substantially lowers Teq while maintaining high stability.
In the case of glutamate dehydrogenase, cofactors affect Teq and ∆Heq in the same way as substrates, with substantial differences in the absence of any significant effect on ∆G*cat or ∆G*inact.
Km changes often coincide with the Eact/Einact transition. There have been a number of general observations that enzyme Km values often increase with temperature [24]. We find that these increases are relatively common and often coincide with the shift from Eact to Einact. For example, Fig. 5 shows the sharp increase in the Km of malate dehydrogenase for oxaloacetate coincident with a sudden increase in the proportion of Einact, and a slower increase in Km of glutamate dehydrogenase for NADPH coincident with an increase of Einact spread over a larger temperature range.
An active site change affects Teq. The AK1 protease is unusual in that it has a disulphide bond in the active site, between
Cys137 and Cys139. Cleavage of this bond has a significant impact on the active site since residues 133-136 form a promontory that projects between the S1 and S4 sites, and the chain displacement arising from cleavage affects the Km and kcat values of the enzyme, depending upon the temperature and substrate [18, 25]. As shown in Table 3, reductive cleavage of this disulphide bond using dithiothreitol results in significant changes in Teq and ∆Heq, without significant changes in ∆G*cat or ∆G*inact. This is found with both substrates used, showing that a point change at a well-defined position in the active site of an enzyme has an effect on the Equilibrium Model parameters describing the Eact/Einact equilibrium.
Effect of ∆Heq on the determination of ∆G*cat and kcat In addition to the known effect of ∆Heq on the temperature range over which enzymes operate
(9), Fig. 6 shows that for enzymes with a low ∆Heq, such as the β-glucosidase, a significant proportion of the enzyme can be in the inactive form at temperatures well below Teq. This leads to a relatively straighter shape of the ascending limb of the temperature-activity curve for the P. dulcis β-glucosidase, because the effect of Teq is imposed upon that of ∆G*cat. In this case, attempts to determine ∆G*cat from a simple plot of the increase in activity with temperature for this enzyme will be open to significant errors, as will measurements of kcat if made over the affected temperature range.
DISCUSSION
8
A variety of evidence presented here indicates that the Eact/Einact transition involves relatively
little unfolding, and that Einact is not significantly denatured; i.e., the results show that the Einact form of an enzyme is relatively similar to the Eact form, rather than to the denatured/unfolded form, or to a molten globule form. The speed of the Eact/Einact equilibration is much faster than denaturation, and consistent with the conformational switching time between the sub-states of the myoglobin binding site [26]. The ∆Heq values are much lower than that expected for denaturation and are consistent with conformational changes, very limited unfolding, and/or changes in solvent interactions. However, the range of values for ΔHeq, from less than 80 kJ·mol-
1 to more than 800 kJ·mol-1, and less than 0.1 kJ·mol-1·residue (e.g., B. taurus AKP, P. dulcis β-glucosidase) to more than 1.2 kJ·mol-1·residue (B. cereus DHFR, B. taurus MDH) is large, and it seems likely that different events are involved in different enzymes. Earlier work has shown that a low concentration of a denaturing agent or stabilizing agent can affect temperature stability without affecting Teq and ∆Heq, also indicating that these parameters are independent of enzyme global stability [15]. A statistical analysis of a number of enzymes [9] has already shown a stronger correlation of the growth temperature of the source organism with Teq than with ∆G*inact (stability); the correlation of ∆G*inact with Teq is weaker and predictable given that both correlate with growth temperature. The CD data support the notion that the Eact/Einact transition occurs very rapidly compared with denaturation, is temperature-dependent, and is physically distinct from the slower denaturation process. Overall, these findings provide an explanation for the results of Tsou et al. [20, 27] showing that thermally-induced loss of enzyme activity occurs at lower temperatures and much more rapidly than denaturation [20, 27-29]. It may be that the change from Eact to Einact is the first, but very limited, step in a pathway leading to complete unfolding, but this is not a necessary consequence of these results.
Other evidence indicates that changes at the active site are responsible for the Eact/Einact equilibration. The parameters defining the transition, Teq and ∆Heq, are substrate-specific, with similar substrates often giving similar parameters for a given enzyme, and structurally-different substrates giving rise to significant differences in the parameters, often without significant changes in ∆G*cat (Succ-AAPL-pNA/Succ-AAPNle-pNA; pNP-fucose/pNP-galactose; NADH/NADPH) or ∆G*inact (Succ-AAPL-pNA/Succ-AAPNle-pNA; Succ-AAPNle-pNA/ Succ-AAPA-pNA; Succ-AAPF-pNA/ Succ-AAPV-pNA; pNP-glucose/pNP-xylose) (Table 2).
A point change at the active site, in this case cleavage of a disulphide bond that produces insignificant changes in the global structure [25] but that gives rise to a structural change at the active site, can also produce changes in the parameters Teq and ∆Heq, providing direct evidence for involvement of the active site in Eact/Einact equilibration (Table 3). The general observation that Km tends to rise with temperature [24], and that these changes are often associated with shifts in the Eact/Einact equilibrium, are both consistent with changes at the active site from an optimum configuration for substrate binding to a less optimum one, coincident with a shift in the Eact/Einact equilibrium towards the Einact form. We would not expect this to be invariably the case, since in some enzymes shifts in the Eact/Einact equilibrium might depend on active site residues that do not affect Km. Overall, the results show that the active sites of enzymes dictate the effect of temperature on enzyme activity. This is entirely consistent with, and may provide part of the rationale for, observations that the active site tends to be more flexible than the enzyme as a whole [20, 27-34]. The exact nature of the physical changes involved are not clear, and given the range of reactions and structures covered by the Model, seem likely to be different in different enzymes, but it would be very surprising if some type of conformational change was not involved.

9
The inference from Fig. 6 is that for enzymes with a low ∆Heq, such as the β-glucosidase shown, attempts to graphically determine ∆G*cat, without taking account of Teq, are likely to have significant errors. Any determination of kcat will only be a true measure of the enzyme’s catalytic power if it is made at temperatures where none of the enzyme is in the inactive form. Since the average ∆Heq of the enzymes for which it has been determined is 226 kJ·mol-1, and 150 kJ ·mol-1 for single subunit enzymes (Table 1), this may often be at surprisingly low temperatures.
As discussed elsewhere [15], the Equilibrium Model has significant applications for the effects of temperature on enzyme evolution and adaptation [9, 15, 16]. The several-fold lower initial rate that is observed for the Equilibrium Model compared with the Classical Model (Fig. 1) is a direct consequence of the values assigned to the thermodynamic parameters in the former, in particular the value of Teq being lower than the temperature bringing about significant irreversible thermal inactivation. The initial rate observed thus increases as the value of Teq is increased. This may help explain why thermophilic enzymes only achieve catalytic rates equivalent to those found with mesophilic enzymes, despite the higher temperature of assay. That is, a thermophilic enzyme may have a high global stability that results in low rates of thermal inactivation, but the active site structure may not be optimised for thermal stability but for effective catalysis, and thus of necessity may comprise a more flexible portion of the protein. As the temperature of the enzyme is raised, the flexible active site region may be deformed and Eact thus converted to Einact with a concomitant reduction in catalytic activity. However, as the major portion of the protein molecule is optimised for stability and can act as a stable scaffold, the temperature-induced conformation change at the active site can be prevented from leading to total unfolding and the conversion of Eact to Einact is consequently reversible at potentially destabilising temperatures. However, this effect does lead to lower catalytic rates and a lower Teq than would be expected from the global thermal stability as measured for the whole enzyme molecule.
The results imply that evolution of the enzyme active site is likely to be constrained by its temperature dependence. Manipulation of stability by mutation, whether naturally or by directed mutagenesis, may not allow activity at higher temperatures unless Teq is also raised; since the basis of Eact/Einact equilibration is at the active site, this may lead to changes in Km and/or kcat. This may explain the difficulty of engineering enzymes to operate at higher temperatures.
Of particular interest is the discovery of a localised and apparently universal mechanism by which enzymes lose activity as temperature rises, as opposed to denaturation which is global [35]. The Einact state of the Equilibrium Model is clearly different from a fully unfolded or molten globule state and is thus distinguishable from the Lumry-Eyring [36] and other models [15]. The molecular basis of any specific Eact/Einact equilibration seems likely to be as diverse as the enzymes themselves. The precise details of the local changes occurring in any specific enzyme as the equilibrium shifts from Eact to Einact have yet to be determined. This determination may not be simple since the structural difference between the two forms is evidently small, and the temperature required to yield a dominating proportion of Einact will cause rapid denaturation of most enzymes.
The applicability across such a wide range of enzyme reactions and structures, the active site location, and the association with growth temperature [9], all strongly indicate that the Equilibrium Model describes an important natural phenomenon. ACKNOWLEDGEMENTS

10
We thank the Royal Society of New Zealand Marsden Fund for financial support [UOW0501]. We thank Alan Cooper for helpful discussions, and Martin Seefeld and Andreas Pickl for technical assistance. AUTHOR CONTRIBUTIONS Roy Daniel and Michael Danson conceived the general hypothesis and, with Charles Lee, wrote the paper. Roy Daniel planned the experiments and interpreted the data. Michelle Petersen, Charles Lee, Cristina Weinberg, Matthew Oudshoorn, and Colin Monk planned and carried out the experiments to determine the Model parameters and analysed the data. Colin Monk carried out much of the data processing and prepared the figures. Nicholas Price and Charles Lee planned the CD experiments and interpreted the data. Sharon Kelly and Charles Lee carried out the CD experiments. All of the authors contributed to a critical review of the paper, and approved the final version. REFERENCES 1 Copeland, R. A. (2000) Enzymes: A Practical Introduction to Structure, Mechanism and
Data Analysis. Wiley-VCH, New York 2 Dixon, M. and Webb, E. C. (1979) Enzymes. Longman Group. Ltd, London 3 Garrett, R. H. and Grisham, C. M. (2010) Biochemistry. Brooks/Cole - Cengage, Boston 4 Daniel, R. M., Danson, M. J. and Eisenthal, R. (2001) Erratum: The temperature optima of
enzymes: a new perspective on an old phenomenon. Trends Biochem. Sci. 26, 401 5 Daniel, R. M., Danson, M. J. and Eisenthal, R. (2001) The temperature optima of enzymes:
a new perspective on an old phenomenon. Trends Biochem. Sci. 26, 223-225 6 Peterson, M. E., Eisenthal, R., Danson, M. J., Spence, A. and Daniel, R. M. (2004) A new
intrinsic thermal parameter for enzymes reveals true temperature optima. J. Biol. Chem. 279, 20717-20722
7 Peterson, M. E., Eisenthal, R., Danson, M. J., Spence, A. and Daniel, R. M. (2005) Additions and Corrections: A new intrinsic thermal parameter for enzymes reveals true temperature optima. J. Biol. Chem. 280, 41784
8 Thomas, T. M. and Scopes, R. K. (1998) The effects of temperature on the kinetics and stability of mesophilic and thermophilic 3-phosphoglycerate kinases. Biochem. J. 330, 1087-1095
9 Lee, C. K., Daniel, R. M., Shepherd, C., Saul, D., Cary, S. C., Danson, M. J., Eisenthal, R. and Peterson, M. E. (2007) Eurythermalism and the temperature dependence of enzyme activity. FASEB J. 21, 1934-1941
10 Moore, V. (2008) PhD Thesis. University of Bath 11 Daniel, R. M., Danson, M. J., Eisenthal, R., Lee, C. K. and Peterson, M. E. (2007) New
parameters controlling the effect of temperature on enzyme activity. Biochem. Soc. Trans. 35, 1543-1546
12 Daniel, R. M., Danson, M. J., Eisenthal, R., Lee, C. K. and Peterson, M. E. (2008) The effect of temperature on enzyme activity: new insights and their implications. Extremophiles. 12, 51-59
13 Daniel, R. M., Danson, M. J., Hough, D. W., Lee, C. K., Peterson, M. E. and Cowan, D. A. (2008) Enzyme stability and activity at high temperatures. In Protein Adaptation in Extremophiles (Siddiqui, K. S. and Thomas, T., eds.), Nova Publishers, New York

11
14 Peterson, M. E., Daniel, R. M., Danson, M. J. and Eisenthal, R. (2007) The dependence of enzyme activity on temperature: determination and validation of parameters. Biochem. J. 402, 331-337
15 Eisenthal, R., Peterson, M. E., Daniel, R. M. and Danson, M. J. (2006) The thermal behaviour of enzyme activity: implications for biotechnology. Trends Biotechnol. 24, 289-292
16 Lee, C. K., Cary, S. C., Murray, A. E. and Daniel, R. M. (2008) Enzymic approach to eurythermalism of Alvinella pompejana and its episymbionts. Appl. Environ. Microbiol. 74, 774-782
17 Plant, A. R., Oliver, J. E., Patchett, M. L., Daniel, R. M. and Morgan, H. W. (1988) Stability and substrate specificity of a beta-glucosidase from the thermophilic bacterium Tp8 cloned into Escherichia coli. Arch. Biochem. Biophys. 262, 181-188
18 Toogood, H. S., Smith, C. A., Baker, E. N. and Daniel, R. M. (2000) Purification and characterization of Ak.1 protease, a thermostable subtilisin with a disulphide bond in the substrate-binding cleft. Biochem. J. 350, 321-328
19 Fulton, K. F., Devlin, G. L., Jodun, R. A., Silvestri, L., Bottomley, S. P., Fersht, A. R. and Buckle, A. M. (2005) PFD: a database for the investigation of protein folding kinetics and stability. Nucleic Acids Res. 33, D279-283
20 Tsou, C. L. (1995) Inactivation precedes overall molecular conformation changes during enzyme denaturation. Biochim. Biophys. Acta. 1253, 151-162
21 Arroyo-Reyna, A., Tello-Solis, S. R. and Rojo-Dominguez, A. (2004) Stability parameters for one-step mechanism of irreversible protein denaturation: a method based on nonlinear regression of calorimetric peaks with nonzero deltaCp. Anal. Biochem. 328, 123-130
22 Creighton, T. E. (1993) Proteins. W H Freeman, New York 23 Privalov, P. L. and Khechinashvili, N. N. (1974) A thermodynamic approach to the
problem of stabilization of globular protein structure: a calorimetric study. J. Mol. Biol. 86, 665-684
24 Daniel, R. M. and Danson, M. J. (2001) Assaying activity and assessing thermostability of hyperthermophilic enzymes. Methods Enzymol. 334, 283-293
25 Smith, C. A., Toogood, H. S., Baker, H. M., Daniel, R. M. and Baker, E. N. (1999) Calcium-mediated thermostability in the subtilisin superfamily: the crystal structure of Bacillus Ak.1 protease at 1.8 A resolution. J. Mol. Biol. 294, 1027-1040
26 Ishikawa, H., Kwak, K., Chung, J. K., Kim, S. and Fayer, M. D. (2008) Direct observation of fast protein conformational switching. Proc. Natl. Acad. Sci. USA. 105, 8619-8624
27 Tsou, C. L. (1993) Conformational flexibility of enzyme active sites. Science. 262, 380-381
28 Lin, Y. Z., Liang, S. J., Zhou, J. M., Tsou, C. L., Wu, P. Q. and Zhou, Z. K. (1990) Comparison of inactivation and conformational changes of D-glyceraldehyde-3-phosphate dehydrogenase during thermal denaturation. Biochim. Biophys. Acta. 1038, 247-252
29 Zhang, Y. L., Zhou, J. M. and Tsou, C. L. (1993) Inactivation precedes conformation change during thermal denaturation of adenylate kinase. Biochim. Biophys. Acta. 1164, 61-67
30 Liu, Z. J. and Zhou, J. M. (1995) Spin-labeling probe on conformational change at the active sites of creatine kinase during denaturation by guanidine hydrochloride. Biochim. Biophys. Acta. 1253, 63-68
31 Shu, Q. and Frieden, C. (2005) Relation of enzyme activity to local/global stability of murine adenosine deaminase: 19F NMR studies. J. Mol. Biol. 345, 599-610

12
32 Xiao, G. S. and Zhou, J. M. (1996) Conformational changes at the active site of bovine pancreatic RNase A at low concentrations of guanidine hydrochloride probed by pyridoxal 5'-phosphate. Biochim. Biophys. Acta. 1294, 1-7
33 Yang, H. J. and Tsou, C. L. (1995) Inactivation during denaturation of ribonuclease A by guanidinium chloride is accompanied by unfolding at the active site. Biochem. J. 305, 379-384
34 Zhou, H. M., Zhang, X. H., Yin, Y. and Tsou, C. L. (1993) Conformational changes at the active site of creatine kinase at low concentrations of guanidinium chloride. Biochem. J. 291, 103-107
35 Matthews, B. W. (1993) Structural and genetic analysis of protein stability. Annu. Rev. Biochem. 62, 139-160
36 Lumry, R. and Eyring, H. (1954) Conformation changes of proteins. J. Phys. Chem. 58, 110-120

13
FIGURE LEGENDS
Fig. 1. Comparison of experimental data with the predictions of the Equilibrium and Classical models; the effect of temperature on β-glucosidase from Caldicellulosiruptor saccharolyticus with 30 mM p-nitrophenyl β-D-glucopyranoside as substrate.(A) Experimental data. (B) Simulation of the effect of temperature using parameters derived from fitting the experimental data to the Equilibrium Model [ΔG*cat = 78kJ·mol-1; ΔG*incat = 105kJ·mol-1; ∆Heq = 119 kJ·mol-1; Teq = 72°C] (C) Simulation of the effect of temperature using only the values of ΔG*cat and ΔG*incat from fitting the experimental data to the Classical Model.
Fig. 2. CD spectra of S. cerevisiae α-glucosidase. S. cerevisiae α-glucosidase was scanned at 15ºC in the presence of 300 mM maltose (solid
line) and, after a 10-minute incubation at 43ºC, in the absence of substrate (dotted line). Fig. 3. Time-dependent changes in CD signals at 292 nm of S. cerevisiae α-glucosidase. S.
cerevisiae α-glucosidase CD time course experiments were performed at 15ºC in the presence of 300 mM maltose (dashed line), at 43ºC and in the presence of 300 mM maltose (solid line), at 43ºC in the absence of substrate (dotted line), and after a 30-minute incubation at 43ºC following the time-course experiment at 43ºC in the presence of 300 mM maltose (dashed-dotted line).
Fig. 4 An experimental time/temperature/activity plot of the S. cerevisiae α-glucosidase. (ΔG*cat = 63.5 kJ·mol-1; ΔG*inact = 96.9 kJ·mol-1; ΔHeq = 215 kJ·mol-1; Teq = 316.5K)
Fig. 5. Effects of temperature on the Eact/Einact equilibrium and Km. The solid line represents the initial (zero-time) activity of the enzyme at various temperatures
based on its Equilibrium Model parameters derived from experimental data. The percentage figures refer to the proportion of Einact relative to the total enzyme population at temperatures indicated by arrows. The dashed line represents the effect of temperature on the Km of the enzyme. (standard error represented by the error bars).
A. E. coli malate dehydrogenase; Km values are for oxaloacetate; B. Alvinella pompejana epibionts glutamate dehydrogenase; Km values are for NADPH. Fig. 6. Effect of ∆Heq on the temperature sensitivity of enzymes via the Eact/Einact
equilibrium. The solid line shows the zero-time activity of E. coli malate dehydrogenase (∆Heq = 619 kJ·mol-1), and the dotted line that of P. dulcis β-glucosidase (∆Heq = 100 kJ·mol-1). The vertical arrows show the percentage of the enzyme existing as the inactive form.
14
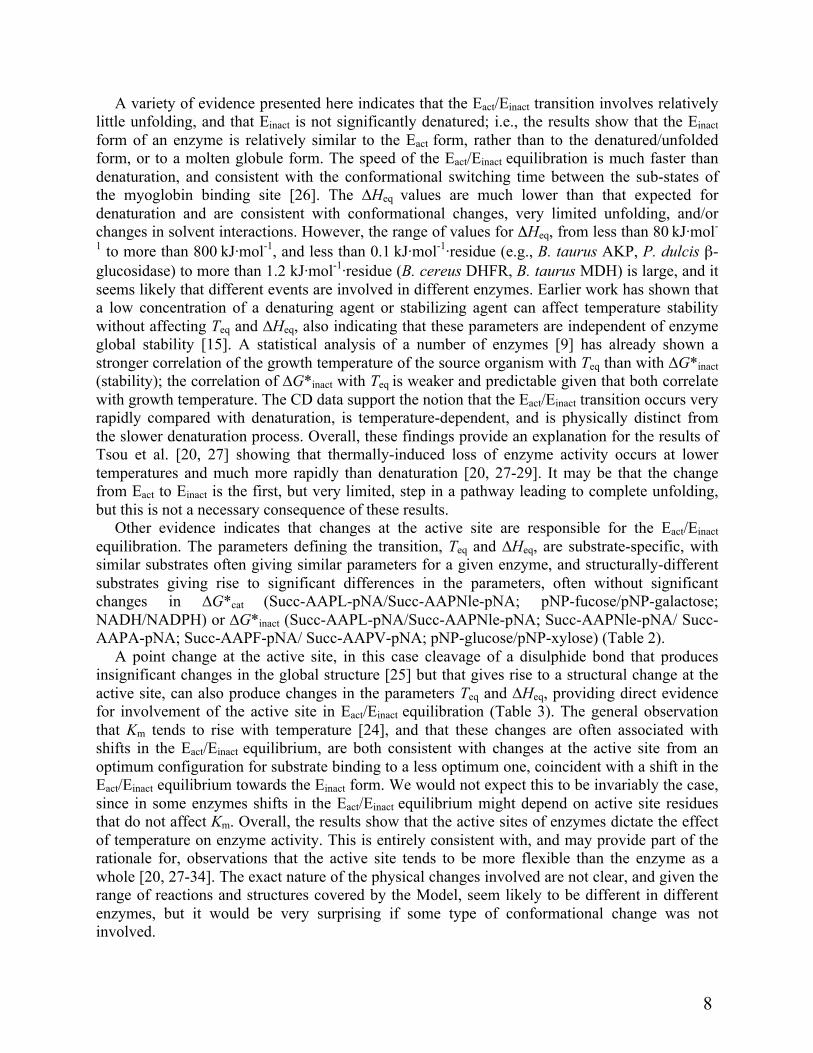
TABLES Table 1. Thermodynamic parameters for 28 enzymes fitted to the Equilibrium Model. The parameters of all enzymes were derived by fitting assay data to the Equilibrium Model and thus relate to active enzymes in the presence of substrate and cofactor. The exceptions are the growth temperature optima (Tgrowth) of the source organism, which are cited from various sources [9] and are included here only to give a broad approximation of the expected "working" temperature of the enzyme.
Organism Enzyme Tgrowth (°C) ∆G*cat
(kJ·mol-1)
∆G*inact (kJ·mol-1)
∆Heq (kJ·mol-1)
Teq (°C) Number of
subunits
Thermus sp. RT41a AKP 75 72 99 305 90 2 Thermus aquaticus α-GLU 70 88 103 149 74.4 1 Bacillus caldovelox IPMDH 70 76 101 573 63.9 2 Caldocellulosiruptor
sacchrolyticus ß-GLU 70 78 105 119 72 1
Bacillus str Ak1 protease 65 72 102 134 75 1 Thermoplasma
acidophilum GCS 60 77 103 164 87.8 2
G. stearothermophilus α-GLU 55 64 96 225 67.8 1 G. stearothermophilus DHFR 55 67 97 96 53.9 1 Bacillus licheniformis Subtilisin A 50 61 98 106 62.6 1
Escherichia coli AKP 40 68 99 121 70 2 Escherichia coli MDH 40 55 96 619 70.7 4
Bos taurus MDH 39 53 85 826 67.4 2 Bos taurus AKP 39 57 97 86 59.6 2 Bos taurus GDH
(EC1.4.1.3) 39 63 93 264 53 6
Bos taurus γ-GTP 39 63 98 109 52 2 Sus scrofa FUM 39 60 92 378 59.1 4
Candida utilus GDH (EC1.4.1.4)
31 57 94 409 59.5 6
Bacillus subtilis IPMDH 30 73 94 255 52.8 2 Bacillus cereus DHFR 30 66 90 261 58.5 1 Bacillus cereus MDH 30 51 86 243 40 4
S. cerevisiae α-GLU 28 71 90 272 39.4 1 P. fluorescens AAA 25 74 92 115 35.8 1
Rhodotorula glutinis PAL 24 80 97 181 56.5 4 Wheat germ ACP 20 79 95 142 63.9 1
Prunus dulcis ß-GLU 20 63 95 100 55.9 1 Bacillus psychrophilus IPMDH 20 72 100 123 56.7 2
Antarctic bacterium HK47
AKP 15 55 79 139 29.3 1
Moritella profunda DHFR 2 67 93 104 54.6 1
15
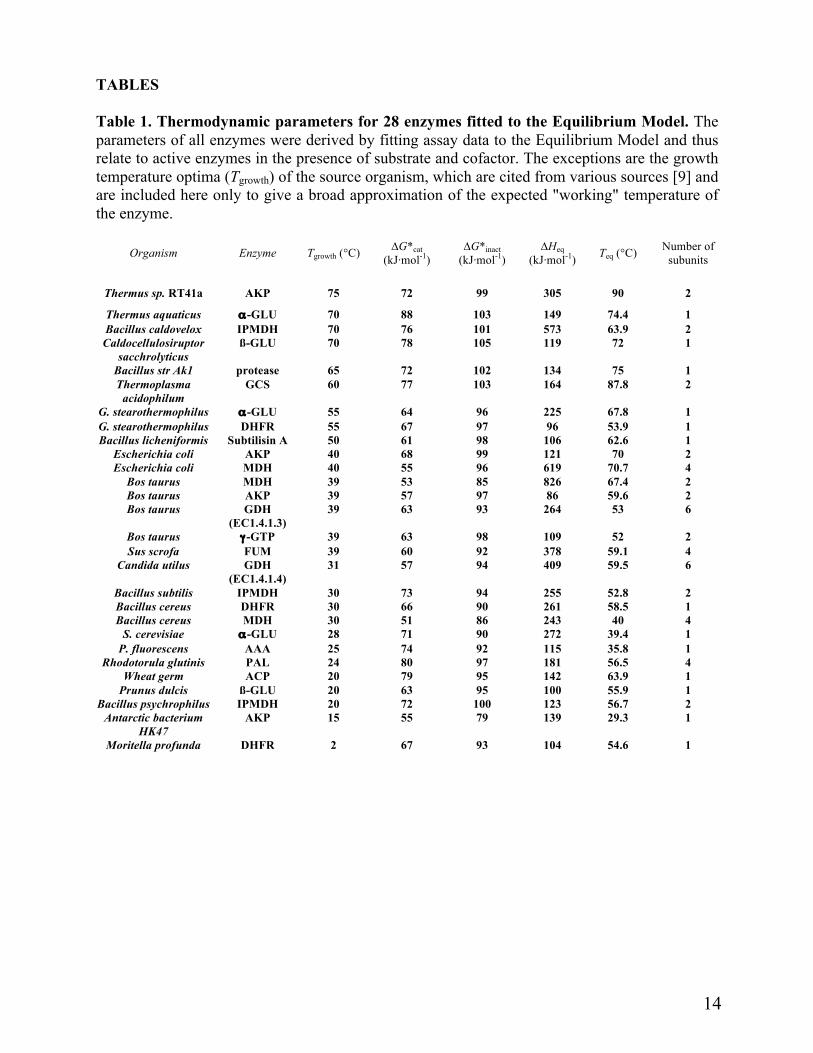
Table 2. Effect of substrate on the Equilibrium Model parameters of 4 enzymes Enzymes were assayed using different substrates and the Equilibrium Model parameters derived as outlined in Experimental. Data is presented to 3 significant figures. Figures in brackets are the standard deviation of the fit of the data to the Model
Enzyme Substrate
ΔG*cat (kJ·mol-1)
ΔG*inact (kJ·mol-1)
∆Heq (kJ·mol-1) Teq (K)
Subtilisin Succ-AAPL-pNA (B. subtilis) Succ-AAPNle*-pNA
Succ-AAPF-pNA Succ-AAPA-pNA Succ-AAPV-pNA
61.4 (0.1) 61.5 (0.1) 68.1 (0.1) 71.0 (0.1) 76.6 (0.1)
98.4 (0.1) 98.7 (0.1) 96.8 (0.3) 99.0 (0.6) 96.8 (0.1)
106 (2) 78.6 (0.6)
142 (3) 107 (3) 110 (1)
336 (1) 323 (1) 333 (1) 338 (1) 332 (1)
β-glucosidase pNP-fucose (C. saccharolyticus) pNP-galactose
pNP-glucose pNP-xylose
77.0 (0.1) 77.0 (0.1) 78.0 (0.1) 84.0 (0.1)
101 (1) 103 (1) 105 (1) 105 (1)
141 (2) 123 (2) 119 (1) 112 (1)
349 (1) 345 (1) 345 (1) 338 (1)
Glutamate dehydrogenase NADH (B. taurus) NADPH
62.6 (0.1) 62.6 (0.1)
92.5 (0.1) 91.6 (0.1)
264 (2) 144 (2)
326 (1) 319 (1)
Table 3. Effect of disulphide bond cleavage at the active site on the Equilibrium Model parameters of AK1 protease with two different peptide substrates Data is presented to 3 significant figures. Figures in brackets are the standard deviation of the fit of the data to the Model
Enzyme; Substrate ΔG*cat (kJ·mol-1)
ΔG*inact (kJ·mol-1)
∆Heq (kJ·mol-1) Teq (K)
AK1 protease; Succ-AAA-pNA 76.0 (0.1) 105 (1) 94.0 (0.6) 337 (1)
AK1protease; Succ-AAA-pNA +DTT 76.2 (0.2) 106 (1) 115 (2) 342 (1)
AK1 protease; Succ-AAPF-pNA 71.5 (0.1) 102 (1) 134 (2) 348 (1)
AK1protease; Succ-AAPF-pNA +DTT 71.5 (0.1) 100 (1) 123 (2) 342 (1)

16
Figure 1
Figure 2
Figure 3

17
Figure 4
Figure 5
Figure 6