Embed Size (px)
Citation preview

Forging aheadThe mining industry in British Columbia 2011

2 | The Mining Industry in British Columbia 2011
2011 results reflect the ongoing resurgence of mining in BC, particularly in the coal sector. Revenues have grown by an unprecedented $2 billion to $9.9 billion in 2011.

The Mining Industry in British Columbia 2011 | 3
Preface
PricewaterhouseCoopers LLP (“PwC”) is pleased to present our latest annual BC Mining Survey, the 44th year of publication. This year’s report summarizes the 2011 financial results and major trends in British Columbia’s mining industry. This survey has been independently prepared by PwC with the cooperation and assistance of companies with mining operations in the province. We are extremely grateful for the continued support of the participants, a testament to the commitment and dedication of the stakeholders in this important sector. The PwC report has gained a reputation as a carefully compiled, independent and reliable snapshot of the state of BC’s mining industry and is relied upon and extensively used by industry, government and academia.
The survey continues to benefit from high levels of participation from mining companies—the 2011 survey includes 17 operating metal and coal mines (including 1 smelter operation), 13 operations in the permitted or active permitting stage, 8 advanced exploration stage properties and 3 mines in the reclamation stage, for a total of 41 participants for 2011.
Methodology
Data was gathered from participants online by means of a comprehensive, confidential questionnaire. PwC independently reviewed the survey responses for reasonableness and consistency; however, no attempt has been made to align the companies’ accounting policies.
Consistent with the previous surveys, this survey does not include information about the significant number of exploration stage and operating mining companies which have a head office in BC but carry out activities outside the province.
For the purpose of the PwC’s survey, mining activity is defined as the exploration, extraction, and processing of metals and coal. Processing includes processing of raw materials through to refined metals, but does not include fabrication.
The principal products of the companies surveyed are coal, copper, zinc, molybdenum, lead, gold, and silver. In addition, Teck Resources’ Trail smelter has participated in this survey and its operating results may include concentrates which are mined outside BC.
Since 1968, many mines have opened and closed in BC, and companies are not always consistent in their participation and presentation. Consequently, the historical figures are not fully comparable from year to year, but we consider the results to be representative of the overall industry in British Columbia.
This report has been published by PwC BC Region Mining Practice. We would like to extend our gratitude to the participating companies, the Government of British Columbia, the Mining Association of BC and the Association of Mineral Exploration BC for their continued support.
PricewaterhouseCoopers LLP Vancouver, BC May 15, 2012
Cov
er a
nd fa
cing
pho
to D
anie
l Hen
shaw
, cou
rtes
y of
Imp
eria
l Met
als
Cor
por
atio
n

4 | The Mining Industry in British Columbia 2011
Operating
Brule (Walter Energy Corp.)
Coal Mountain (Teck Resources Limited)
Copper Mountain (Copper Mountain Mining Corp.)
Elkview (Teck Resources Limited)
Endako (Thompson Creek Metals Company)
Fording River (Teck Resources Limited)
Gibraltar (Taseko Mines Limited)
Greenhills (Teck Resources Limited)
Highland Valley Copper (Teck Highland Valley Copper Partnership)
Huckleberry (Huckleberry Mines Ltd.)
Line Creek (Teck Resources Limited)
Max Molybdenum (Roca Mines Inc.)3
Mount Polley (Imperial Metals Ltd.)
Quinsam Coal (Quinsam Coal Corporation)
Trail Metal Smelter Operations (Teck Resources Limited)
Willow Creek (Walter Energy Corp.)
Wolverine (Walter Energy Corp.)
Development stage — Permitted or Active Permitting
Afton Ajax (KGHM Ajax Mining Inc.)
Berg (Thompson Creek Metals Company)1
Galore Creek (NovaGold Resources Inc.)
Kitsault (Avanti Mining Inc.)1
Mount Klappan (Fortune Minerals Ltd)
Mount Milligan (Thompson Creek Metals Company)
New Afton (New Gold Inc.)
Prosperity (Taseko Mines Limited)
Red Chris (Imperial Metals Ltd.)
Schaft Creek (Copper Fox Metals Inc.)
Table Mountain (China Minerals Mining Corp.)
Turnagain Nickel Project (Hard Creek Nickel Corp.)
Yellowjacket (Eagle Plains Resources Ltd.)
Exploration
Catface (Imperial Metals Ltd.)
Davidson Moly (Thompson Creek Metals Company)
Foremore (Roca Mines Inc.)1
Harper Creek (Yellowhead Mining Inc.)1
Spanish Mountain (Spanish Mountain Gold Ltd.)1
Teck Resources Limited (Head Office)
Teck Resources Limited (Exploration)
Tulsequah Chief (Chieftain Metals Inc.)1
Reclamation2
Bell (Xstrata Plc.)
Brenda (Xstrata Plc.)
Sullivan (Teck Resources Limited)
Participants
Notes
1. New participants for 2011
2. Participants in the reclamation phase are different than in
the prior year and therefore results may not be comparable
3. Operations currently suspended
Highland ValleyCopper
Bell
BrendaSullivan
New Afton
Line Creek
Endako
Gibraltar
Prosperity
Elkview
Greenhills
Fording RiverMaxMolybdenum
CoalMountain
Quinsam Coal
Trail MetalOperations
Mount Polley
Willow Creek
Wolverine
Galore Creek
Kitsault
Schaft Creek
CopperMountain
MountMilligan
Turnagain
Table MountainYellowjacket
Tulsequah Chief
Foremore
Red Chris
Berg
Mount Klappan
Huckleberry
Afton-Ajax
Catface
DavidsonMoly
Spanish Mountain
Brule
Harper Creek
Teck(Head Office & Exploration)
Operating
Permitted or Active Permitting
Highway 37
Exploration
Reclamation
TrailOperations

The Mining Industry in British Columbia 2011 | 5
Participant locations in 2011
Highland ValleyCopper
Bell
BrendaSullivan
New Afton
Line Creek
Endako
Gibraltar
Prosperity
Elkview
Greenhills
Fording RiverMaxMolybdenum
CoalMountain
Quinsam Coal
Trail MetalOperations
Mount Polley
Willow Creek
Wolverine
Galore Creek
Kitsault
Schaft Creek
CopperMountain
MountMilligan
Turnagain
Table MountainYellowjacket
Tulsequah Chief
Foremore
Red Chris
Berg
Mount Klappan
Huckleberry
Afton-Ajax
Catface
DavidsonMoly
Spanish Mountain
Brule
Harper Creek
Teck(Head Office & Exploration)
Operating
Permitted or Active Permitting
Highway 37
Exploration
Reclamation
TrailOperations

6 | The Mining Industry in British Columbia 2011
Highlights
Gross mining revenues
Gross mining revenues increased 25% from 2010, to $9.9 billion in 2011 (2010: $7.9 billion). The $2.0 billion increase was almost all attributable to higher metallurgical coal prices and increased coal shipments.
Net income (before tax)
Net income before taxes was consistent with 2010 at $3.7 billion. The $2 billion increase in gross revenues did not translate to an increase in net income for the following reasons:
The 2010 results included $0.8 billion in non-recurring gains mainly related to asset disposals. In 2011, direct purchases, including concentrate purchases by smelting operations increased by $0.6 billion, and labour and administrative costs increased by $0.3 billion.
On a normalized basis, net income before taxes increased by approximately $0.8 billion. The increases in gross mining revenues and net income before taxes are largely driven by production increases in the coal sector (59% of net revenues in 2011) as well as increases in the commodity prices of coal, silver and lead.
Reporting of income taxes is not consistent among participants: some of the earnings reported are generated by joint ventures and do not include income taxes. Consequently, to provide consistency in results, earnings are presented on a pre-tax basis.
Foreign exchange
The Canadian dollar strengthened in 2011, averaging 0.9891 CAD$/US$ compared to 1.0299 CAD$/US$ in 2010. The stronger Canadian dollar resulted in an estimated negative impact of $409 million on total gross revenues, excluding the effect of any hedging. In the first quarter of 2012, the Canadian dollar weakened, averaging 0.9988 CAD$/US$ which favours the export of BC metals and coal.
Direct employment
The average number of individuals employed by BC mining companies increased in 2011, from 8,195 employees to 9,310 employees and continues to be an area of focus for the resource industry. Average 2011 employee earnings increased 7% to $115,700 per employee, up from $108,100 in 2010.
Return on shareholders investment
Pre-tax return on shareholders’ investment decreased significantly from 62.9% in 2010 to 46% in 2011 reflecting the significant increase in shareholders’ investment in the year.
Cash flows
Cash flows from operations increased by 40% from $2.9 billion in 2010 to $4.0 billion in 2011, reflecting the increased net income generated in the year, after adjusting for the impact of non-recurring asset disposal gains.
Capital expenditures
Capital expenditures increased by 135%, from $1,252 million in 2010 to $2,943 million in 2011. Expenditures primarily added to machinery and equipment assets and surface construction, another encouraging indicator of positive expectations for the BC mining industry. Projects under construction account for almost $1.0 billion of the total capital expenditures.
Exploration activities
Exploration spending by survey participants, which includes greenfield exploration and exploration on developing and producing properties, increased 113% from $203 million in 2010 to $431 million in 2011. Of these expenditures, $339 million were focused on properties under development, $15 million on producing properties, and $77 million on greenfield exploration. Total mineral exploration expenditures in British Columbia, estimated at $322 million in 2010, increased to $463 million1 in 2011, an increase of 44%.
Coal
Shipments of metallurgical coal increased 10% from 22.3 million tonnes in 2010 to 24.5 million tonnes in 2011, while realized coal prices increased from an average of US$181/tonne in 2010 to US$257/tonne in 2011. Total coal revenues increased from $3.4 billion in 2010 to $5.2 billion in 2011 and comprise 59% of the total BC mining revenues reported.
Copper
Shipments of copper concentrate decreased from 712,000 tonnes in 2010 to 668,000 tonnes in 2011. Copper concentrate contributed 16% of net revenues in 2011 (2010:21%) as the decline in shipments was partially offset by an increase in average price from US$3.40/lb in 2010 to US$4.00/lb in 2011. Total copper revenues decreased from $1,377 million in 2010 to $1,320 million 2011. In the first quarter of 2012 copper’s average realized price decreased to US$3.78/lb.
Zinc
Zinc and zinc concentrates accounted for $693 million of the total BC mining revenues in 2011, a decrease of 8% from the $755 million reported in 2010. Zinc prices remained relatively stable in 2011, averaging US$0.99/lb compared to US$0.98/lb in 2010. Zinc shipments decreased 13%, from 332,000 tonnes in 2010 to 289,000 tonnes in 2011. In the first quarter of 2012, zinc prices dropped to an average of US$0.92/lb.

The Mining Industry in British Columbia 2011 | 7
Precious Metals
Net mining revenues from gold fell in 2011 from $224 million in 2010 to $154 million, a decrease of $70 million or 31%. The average price of gold increased by 28% from US$1,227/oz in 2010 to US$1,572/oz in 2011. Gold prices continued to climb through the first quarter of 2012 averaging US$1,690/oz.
Net mining revenues for silver nearly doubled, rising from $416 million in 2010 to $811 million in 2011. The average price increased from US$20.22/oz in 2010 to US$35.31/oz in 2011, an increase of 75%. The average silver price in the first quarter of 2012 was down from 2011 at US$32.62/oz.
Molybdenum
The average molybdenum price saw minimal changes, average of US$15.45/lb in 2011, compared to US$15.80/lb in 2010. Net mining revenues from molybdenum were consistent at $256 million, up from $255 million in 2010. In the first quarter of 2012, molybdenum prices declined, averaging US$14.21/lb.
Lead
Shipments of lead and lead concentrates rose 20%, from 70,000 tonnes in 2010 to 84,000 tonnes in 2011. The increase in shipments was accompanied by an increase in average price of US$0.12/lb, from US$0.97/lb in 2010 to US$1.09/lb in 2011. The effects of higher prices and shipments created a 36% increase in net mining revenues from lead to $213 million in 2011 (2010:$157 million). In the first quarter of 2012 lead prices averaged US$0.95/lb.
2011 2010 2009
Gross mining revenues $ 9,886 $ 7,905 $ 7,019
Net revenues 8,747 6,574 5,733
Net income (pre-tax)2 3,690 3,718 2,250
Cash flow from operations 4,013 2,855 2,1693
Industry spending 9,053 6,089 5,675
Payments to governments3 805 691 411
Exploration and development expenditures 431 203 157
Capital expenditures 2,943 1,252 568
Pre-tax return on shareholders’ investment (%) 46.0 62.9 44.3
Direct employment (number of employees) 9,310 8,195 7,688
Shipments (000’s tonnes) 26,014 24,937 21,303
New capital raised 3,268 2,156 6,6104
Statistical outlook summary ($CAD millions, except where otherwise noted)
Notes
1. Mining and Mineral Exploration in British Columbia, Overview 2011
2. Some of the earnings reported are generated by trusts and joint ventures and do
not include income taxes. Consequently, to provide consistency in results, net
earnings have been collated and reported on a pre-tax basis
3. Includes direct taxes, other levies and payments related to employment
4. Includes $6.3 billion of debt refinancing
8 | The Mining Industry in British Columbia 2011
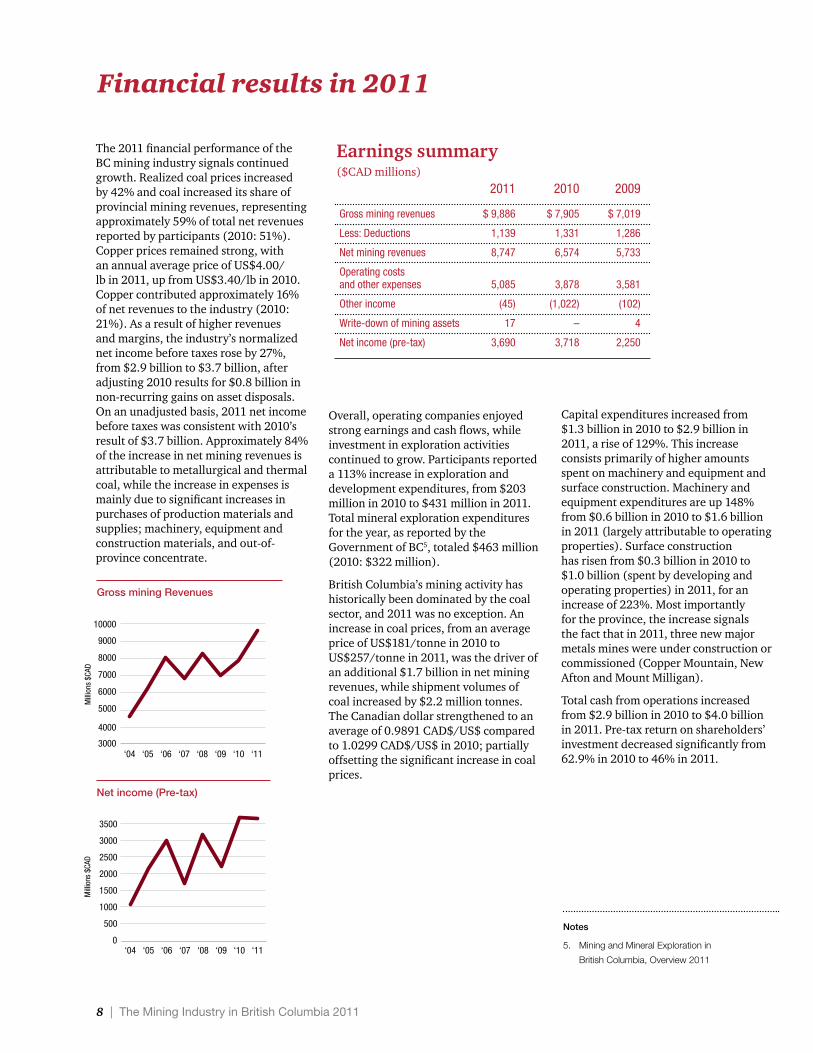
Financial results in 2011
The 2011 financial performance of the BC mining industry signals continued growth. Realized coal prices increased by 42% and coal increased its share of provincial mining revenues, representing approximately 59% of total net revenues reported by participants (2010: 51%). Copper prices remained strong, with an annual average price of US$4.00/lb in 2011, up from US$3.40/lb in 2010. Copper contributed approximately 16% of net revenues to the industry (2010: 21%). As a result of higher revenues and margins, the industry’s normalized net income before taxes rose by 27%, from $2.9 billion to $3.7 billion, after adjusting 2010 results for $0.8 billion in non-recurring gains on asset disposals. On an unadjusted basis, 2011 net income before taxes was consistent with 2010’s result of $3.7 billion. Approximately 84% of the increase in net mining revenues is attributable to metallurgical and thermal coal, while the increase in expenses is mainly due to significant increases in purchases of production materials and supplies; machinery, equipment and construction materials, and out-of-province concentrate.
Overall, operating companies enjoyed strong earnings and cash flows, while investment in exploration activities continued to grow. Participants reported a 113% increase in exploration and development expenditures, from $203 million in 2010 to $431 million in 2011. Total mineral exploration expenditures for the year, as reported by the Government of BC5, totaled $463 million (2010: $322 million).
British Columbia’s mining activity has historically been dominated by the coal sector, and 2011 was no exception. An increase in coal prices, from an average price of US$181/tonne in 2010 to US$257/tonne in 2011, was the driver of an additional $1.7 billion in net mining revenues, while shipment volumes of coal increased by $2.2 million tonnes. The Canadian dollar strengthened to an average of 0.9891 CAD$/US$ compared to 1.0299 CAD$/US$ in 2010; partially offsetting the significant increase in coal prices.
Capital expenditures increased from $1.3 billion in 2010 to $2.9 billion in 2011, a rise of 129%. This increase consists primarily of higher amounts spent on machinery and equipment and surface construction. Machinery and equipment expenditures are up 148% from $0.6 billion in 2010 to $1.6 billion in 2011 (largely attributable to operating properties). Surface construction has risen from $0.3 billion in 2010 to $1.0 billion (spent by developing and operating properties) in 2011, for an increase of 223%. Most importantly for the province, the increase signals the fact that in 2011, three new major metals mines were under construction or commissioned (Copper Mountain, New Afton and Mount Milligan).
Total cash from operations increased from $2.9 billion in 2010 to $4.0 billion in 2011. Pre-tax return on shareholders’ investment decreased significantly from 62.9% in 2010 to 46% in 2011.
Earnings summary($CAD millions) 2011 2010 2009
Gross mining revenues $ 9,886 $ 7,905 $ 7,019
Less: Deductions 1,139 1,331 1,286
Net mining revenues 8,747 6,574 5,733
Operating costs and other expenses 5,085 3,878 3,581
Other income (45) (1,022) (102)
Write-down of mining assets 17 – 4
Net income (pre-tax) 3,690 3,718 2,250
Notes
5. Mining and Mineral Exploration in
British Columbia, Overview 2011
Gross mining RevenuesGross Mining Revenues
Net Income (Pre-tax)
0
500
1000
1500
2000
2500
3000
3500
‘11‘10‘09‘08‘07‘06‘05‘04
Mill
ions
$CA
D
3000
4000
5000
6000
7000
8000
9000
10000
‘11‘10‘09‘08‘07‘06‘05‘04
Mill
ions
$CA
D
Net income (Pre-tax)
Gross Mining Revenues
Net Income (Pre-tax)
0
500
1000
1500
2000
2500
3000
3500
‘11‘10‘09‘08‘07‘06‘05‘04
Mill
ions
$CA
D
3000
4000
5000
6000
7000
8000
9000
10000
‘11‘10‘09‘08‘07‘06‘05‘04
Mill
ions
$CA
D

The Mining Industry in British Columbia 2011 | 9
“ We’re of course very happy with the recent budget announcements for harmonizing the two processes (the environmental approvals). It’s been something that politicians of all stripes have been trying to do for at least a decade, because it makes sense. If you have two watches, you never know what time it is. If you have one watch, you can usually tell what time it is.”
Pho
to D
anie
l Hen
shaw
, cou
rtes
y of
Imp
eria
l Met
als
Cor
por
atio
n
Pierre Lebel, Chairman, Imperial Metals Corp.

10 | The Mining Industry in British Columbia 2011
Overview
Gross mining revenues in 2011 amounted to $9.9 billion, while net mining revenues were $8.7 billion, increases over 2010 of $2.0 billion and $2.2 billion, respectively. Combined, metallurgical and thermal coal generated 84%, or $1.8 billion, of the increase in net mining revenue. Net mining revenues from metallurgical and thermal coal increased 47% from $3.4 billion in 2010 to $5.2 billion in 2011.
Coal is the most significant commodity for the province’s mining industry, representing 59% of total net revenues in 2011. With $1.3 billion (16% of total) in net revenues, copper concentrates remained the second most important contributor. Silver ($811 million), zinc ($693 million), molybdenum ($256 million), and lead ($213 million) combined for 22% of total net revenues at $1,973 million.
Metallurgical Coal revenues increased due to an increased average coal price and shipment volumes in 2011. Shipments increased 10% from 22.3 million tonnes to 24.5 million tonnes and the average coal price increased 42%, up from US$181/tonne in 2010 to US$257/tonne in 2011. These effects resulted in net mining revenues from metallurgical coal of $4.7 billion, an increase of 57% from the prior year’s reported amount of $3.0 billion. The realized price of coal fell to an average of US$223/tonne in the first quarter of 2012.
Copper concentrates experienced decreased shipment volumes in 2011, falling to 668,000 tonnes from 712,000 tonnes in 2010. The average price of copper increased from US$3.40/lb in 2010 to US$4.00/lb in 2011, an increase of 18%. Net mining revenues contributed by copper concentrates amounted to $1.3 billion in 2011, a decline of 5% from the prior year. In the first quarter of 2012 the average price of copper decreased to US$3.78/lb. On April 1st, 2012, copper futures contracts expiring in May 2013 were priced at US$3.88/lb.6
Mineral revenues, shipments and market prices
Copper (LME Grade A)
Coal
Zinc (LME Cash)
Lead (LME Cash)
Gold (London Final)
Silver (London Spot)
Molybdenum (Dealer Oxide)
Copper (LME Grade A)
Zinc (LME Cash)
Silver (London Spot)
Gold (London Final)
Lead (LME Cash)
Molybedenum (Dealer Oxide)
1.5
2.0
2.5
3.0
3.5
4.0
‘11‘10‘09‘08‘07‘06‘05
0.6
0.9
1.2
1.5
‘11‘10‘09‘08‘07‘06‘05
5
10
15
20
25
30
35
40
‘11‘10‘09‘08‘07‘06‘05
Coal (West Coast)
50
100
150
200
250
300
‘11‘10‘09‘08‘07‘06‘05
0
500
1000
1500
2000
‘11‘10‘09‘08‘07‘06‘05
0.4
0.6
0.8
1.0
1.2
‘11‘10‘09‘08‘07‘06‘05
10
15
20
25
30
35
‘11‘10‘09‘08‘07‘06‘05
1.5
2.0
2.5
3.0
3.5
4.0
Copper (LME Grade A)
Zinc (LME Cash)
Silver (London Spot)
Gold (London Final)
Lead (LME Cash)
Molybedenum (Dealer Oxide)
1.5
2.0
2.5
3.0
3.5
4.0
‘11‘10‘09‘08‘07‘06‘05
0.6
0.9
1.2
1.5
‘11‘10‘09‘08‘07‘06‘05
5
10
15
20
25
30
35
40
‘11‘10‘09‘08‘07‘06‘05
Coal (West Coast)
50
100
150
200
250
300
‘11‘10‘09‘08‘07‘06‘05
0
500
1000
1500
2000
‘11‘10‘09‘08‘07‘06‘05
0.4
0.6
0.8
1.0
1.2
‘11‘10‘09‘08‘07‘06‘05
10
15
20
25
30
35
‘11‘10‘09‘08‘07‘06‘05
1.5
2.0
2.5
3.0
3.5
4.0Copper (LME Grade A)
Zinc (LME Cash)
Silver (London Spot)
Gold (London Final)
Lead (LME Cash)
Molybedenum (Dealer Oxide)
1.5
2.0
2.5
3.0
3.5
4.0
‘11‘10‘09‘08‘07‘06‘05
0.6
0.9
1.2
1.5
‘11‘10‘09‘08‘07‘06‘05
5
10
15
20
25
30
35
40
‘11‘10‘09‘08‘07‘06‘05
Coal (West Coast)
50
100
150
200
250
300
‘11‘10‘09‘08‘07‘06‘05
0
500
1000
1500
2000
‘11‘10‘09‘08‘07‘06‘05
0.4
0.6
0.8
1.0
1.2
‘11‘10‘09‘08‘07‘06‘05
10
15
20
25
30
35
‘11‘10‘09‘08‘07‘06‘05
1.5
2.0
2.5
3.0
3.5
4.0
Copper (LME Grade A)
Zinc (LME Cash)
Silver (London Spot)
Gold (London Final)
Lead (LME Cash)
Molybedenum (Dealer Oxide)
1.5
2.0
2.5
3.0
3.5
4.0
‘11‘10‘09‘08‘07‘06‘05
0.6
0.9
1.2
1.5
‘11‘10‘09‘08‘07‘06‘05
5
10
15
20
25
30
35
40
‘11‘10‘09‘08‘07‘06‘05
Coal (West Coast)
50
100
150
200
250
300
‘11‘10‘09‘08‘07‘06‘05
0
500
1000
1500
2000
‘11‘10‘09‘08‘07‘06‘05
0.4
0.6
0.8
1.0
1.2
‘11‘10‘09‘08‘07‘06‘05
10
15
20
25
30
35
‘11‘10‘09‘08‘07‘06‘05
1.5
2.0
2.5
3.0
3.5
4.0

The Mining Industry in British Columbia 2011 | 11
Notes
6. Obtained from the London Metal Exchange via Bloomberg
Zinc and Zinc concentrate shipment volumes decreased from 332,000 tonnes in 2010 to 289,000 tonnes in 2011, a decline of 13%. The average price of zinc was US$0.98/lb in 2010 and rose insignificantly in 2011, averaging US$0.99/lb. The effect of decreased shipments and minimal price increases resulted in an 8% fall in zinc net mining revenues, from $755 million in 2010 to $693 million in 2011. In the first quarter of 2012 the average price of zinc decreased to US$0.92/lb. As of April 2012, zinc futures expiring in May 2013 were priced at US$0.95/ lb.6
Silver prices increased from an average of US$20.22/oz in 2010 to US$35.31/oz in 2011, up 75%. The price change led to a near doubling of net mining revenue, which rose 95% from $416 million in 2010 to $811 million in 2011. In the first quarter of 2012 silver prices averaged US$32.62/oz. As of April 2012, silver futures expiring in May 2013 were priced at $32.60/oz.6
Molybdenum remained relatively flat, averaging US$15.80/lb in 2010 and US$15.45/lb in 2011, a decline of 2%. Molybdenum net mining revenue increased from $255 million in 2010 to $256 million in 2011, an increase of 1%. As of April 2012, molybdenum futures expiring in June 2013 were priced at US$14.29/lb.6
Gold prices experienced another surge in market price, increasing 28% from an average of US$1,227/oz in 2010 to US$1,572/oz in 2011. For BC mines, gold is a byproduct that is primarily derived from copper mining activities, and comprises a small proportion of total revenues. In 2011, net mining revenues from gold moved downward 31%, from $224 million in 2010 to $154 million. Gold prices continued to strengthen in 2012, reaching an average of US$1,690/oz for the first quarter. As of April 2012, gold futures expiring in April 2012 were priced at US$1,671/ oz.6
Lead and Lead concentrate contributed $213 million to net mining revenues in 2011, up from $157 million in 2010. The average lead price increased 12%, at US$1.09/lb in 2011 compared to US$0.97/lb in 2010. Lead experienced a 20% increase in shipment volumes from 70,000 tonnes in 2010 to 84,000 tonnes in 2011. The price of lead fell slightly in the first quarter of 2011, averaging US$0.95/lb. As of April 2011, lead futures expiring in May 2012 were priced at US$0.95/lb.6
2010 2011Net Revenue by Product
MetallurgicalCoal46%
MetallurgicalCoal54%
Thermal coal5%
Thermal coal5%
Copper21%
Copper16%
Zinc12%
Zinc8%
Molybdenum4%
Molybdenum3%
Silver6%
Gold3%
Lead2%
Silver9%
Gold2%
Lead2%
Misc.1%Misc.
1%
2010 2011Net Revenue by Product
MetallurgicalCoal46%
MetallurgicalCoal54%
Thermal coal5%
Thermal coal5%
Copper21%
Copper16%
Zinc12%
Zinc8%
Molybdenum4%
Molybdenum3%
Silver6%
Gold3%
Lead2%
Silver9%
Gold2%
Lead2%
Misc.1%Misc.
1%
Net revenue by product 2010
Net revenue by product 2011

12 | The Mining Industry in British Columbia 2011
Notes
7. Based on averages of between 5 and 11 estimates of
analysts at various financial firms. Source: Bloomberg
Pricing Forecasts
While futures markets currently price June 2013 contracts near today’s spot rates, analysts’ consensus forecasts for the coming year are bullish, with the exception of copper.
Outlook on Commodities
Gold $1660.30/oz 1,668.00 (June ‘13) 0% 1,823.50 10%
Silver $31.23/oz 31.47 (May ‘13) 1% 37.92 21%
Zinc $0.9175/lb 0.9344 (Dec ‘13) 2% 1.0179 11%
Lead $0.9603/lb 0.9775 (Dec ‘13) 2% 1.0322 7%
Copper $3.8219/lb 3.6990 (Dec ‘13) -3% 3.8177 0%
Metal Spot price at April 26, 2012
LME 2013 Futures Price at April 26, 2012
Expected Change Based on Futures
Q2 2013 Analysts’ Consensus Estimate7
Expected Change Based on Analysts

The Mining Industry in British Columbia 2011 | 13
Exploration and development
Mineral exploration and development activities in British Columbia as reported by survey participants, increased significantly from the prior year. In 2011, survey participants reported $431 million in expenditures, up 113% from the prior year expenditure amount of $203 million. Of the total reported spending in exploration and development, $339 million was incurred on properties under development, $77 million was greenfield exploration, and $15 million was development on producing properties within the province.
As noted earlier in the survey, reported results do not take into consideration all of the junior exploration companies and individuals solely involved in exploration activities in the Province and also exclude many exploration activities of mining companies domiciled outside of British Columbia. Thus, the reported results from the survey understate total actual expenditures. The Government of British Columbia estimates total mineral exploration expenditures in British Columbia of $463 million8 for 2011 (2010: $322 million).
Total claims tenured in 2011 covered 5.1 million hectares, an increase of 19% from the $4.3 million hectares of claims staked in 2010. In the first quarter of 2012, 1.3 million hectares were registered, consistent with the 1.2 million hectares in the first quarter of 2011.
Exploration and Development Expenditures in the Province
Claims Staked in BC9 (millions of hectares)
Notes
8. Mining and Mineral Exploration in British Columbia, Overview 2011
9. Obtained from the Mineral Titles Branch of the Ministry of Energy,
Mines and Petroleum Resources
100
200
300
400
500
'11'10'09'08'07'06'050
50
100
150
200
250
'11'10'09'08'07'06'05
Greenfield Exploration
Properties under Development
Development on Producing Properties
According to Ministry of Energy, Mines and Petroleum Resources
Exploration and Development Expenditures in the Province
0
1
2
3
4
6
5
‘11‘10‘09‘08‘07‘06‘05
Claims Staked in BC (millons of hectares)
100
200
300
400
500
'11'10'09'08'07'06'050
50
100
150
200
250
'11'10'09'08'07'06'05
Greenfield Exploration
Properties under Development
Development on Producing Properties
According to Ministry of Energy, Mines and Petroleum Resources
Exploration and Development Expenditures in the Province
0
1
2
3
4
6
5
‘11‘10‘09‘08‘07‘06‘05
Claims Staked in BC (millons of hectares)

14 | The Mining Industry in British Columbia 2011
Highway 37 and Northwest Transmission LineThe Northwest Transmission Line (“NTL”) project involves the construction of a 344 km transmission line on Highway 37 from Skeena to a new substation to be constructed near Bob Quinn Lake. The aim of this project is to provide long term clean electricity supply to potential industrial developments in the area; provide a secure interconnection point for clean power generation project and assist certain northwest communities to access the electricity grid, rather than obtaining their power from diesel generators.10
This transmision line is an important channel for the mining activity in the area. The NTL project will provide low cost power for mines at all stages including Galore Creek, Davidson, Kitsault, Mount Klappan, Sustut, Turnagain and the up and coming Red Chris and Table Mountain Projects.
In February 2011, BC Hydro received an environmental assessment certificate from the province for the proposed NTL project. Federal environmental approval from the Ministry of Energy and Mines was received in May 2011, permitting construction to commence. BC Hydro has awarded construction contracts to design and build the NTL to the team of Valard Construction and Burns & McDonnell. Their responsibilities will include the design, materials procurement and construction of the transmission line.11
Right of way clearing and construction of the access roads began in January, 2012. The NTL project is scheduled to be in service in spring 2014.
In addition, several impact benefit agreements were signed with a Nisga’a Nation and First Nations potentially affected by the project, as follows:
• Tahltan Nation
• Lax Kw’alaams Indian Band
• Metlakatla First Nation
• Gitanyow Wilps
• Gitxsan Wilps
• Kitsumkalum First Nation
• Kitselas First Nation
• Skii km lax Ha
This project will provide electricity to parts of northwest B.C. that are not yet part of the grid. It will enable the development of new mines, power projects and other resource projects which will help fuel BC’s economy and increase the number of jobs and opportunities for both individuals and companies.12
Sources
10. http://www.th.gov.bc.ca/popular-topics/driver_info/route-info/hwy37/hwy37.htm
11. http://www.bchydro.com/energy_in_bc/projects/ntl.html
12. http://www.mining.bc.ca
Patty Moore, Chair, Mining Suppliers Association of BC
“ With all the new mining projects coming on board in the province, we need to improve our infrastructure.”

The Mining Industry in British Columbia 2011 | 15
Expenditures to the government encompass various types of payments, primarily:
• Direct taxes represent both federal and provincial income taxes based on taxable income, municipal property taxes, federal and provincial sales tax, and a provincial mineral tax based on operating profit.
• Payments related to employment consist of employee income tax deductions, Workers’ Compensation premiums, and amounts relating to Canada Pension Plan and Employment Insurance.
In 2011, the BC mining industry, as reported by the participants in this survey, made total payments to the government of $805 million, an increase of $114 million from the payments of $691 million made in 2010. As indicated under Industry Expenditures above, direct tax payments rose by $81 million from $509 million in 2010 to $590 million in 2011, largely due to increases in coal mineral taxes.
The BC government provides assistance to individuals and corporations in the BC mining industry which incur certain qualifying “grass-roots” exploration through two special mining exploration tax credit programs:
• BC Mining Exploration Tax Credit “BCMETC” – a 20% refundable provincial income tax credit program for individuals, active members of partnerships, and corporations carrying out grass-roots exploration for qualifying resources in BC; and
• BC Mining Flow Through Share Tax Credit “BC MFTS” – a non-refundable 20% provincial income tax credit program for individuals investing in flow-through shares that finance qualifying grass-roots exploration by companies in BC
The refundable tax credit program was previously The refundable tax credit program was previously extended to 2016 and the non-refundable flow-through credit program was extended to December 31, 2013 in the 2010 budget.
In order to assist companies in raising capital for mineral exploration, the March 2011 Federal Budget extended the 15% “super flow-through share program” for another year to flow through share agreements entered into before April1, 2012. Therefore, the credit is available for expenditures that are incurred before 2013, or in 2012 with respect to funds raised with the credits in the first three months of 2012 pursuant to the look-back rules. This program combined with the 20% provincial tax credit program described above, should continue to support investor interest in early stage grass-roots exploration in BC in the near future. Survey participants reported flow-through share funding totalling $250 million in 2011 compared with no flow-through share funding reported in 2010.
In its February 20, 2007 provincial budget, the BC government introduced legislation to provide an enhanced refundable provincial tax credit of 30% for qualified mineral exploration undertaken in prescribed Mountain Pine Beetle affected areas. The enhanced refundable provincial tax credit is available for individuals, active members of partnerships, and corporations carrying out grass-roots mineral exploration in BC in the prescribed affected areas. The prescribed Mountain Pine Beetle affected areas are defined by Regulation.
The BC government also announced in its 2007 provincial budget that it would extend the “new mine allowance” provided to operators subject to the BC Mineral Tax. The new mine allowance was intended to encourage the development of new mines by allowing for an enhanced 133% deduction of capital costs incurred to bring a new mine into production between December 31, 1994 and January 1, 2016.
The provincial sales tax on certain production mining machinery and equipment was eliminated with the introduction of Harmonized Sales Tax (“HST”) on July 1, 2010.
Mining and the Government
Direct Tax Payments in Relation to Net Income (Pre-tax)Direct Tax Payments in Relation to Net Income
0
500
1000
1500
2000
2500
3000
3500
'11'10'09'08'07'06'05
4000
3500
3000
2500
2000
1500
1000
500
02005
BC (excluding property tax) Net Income (Pre-tax)
BC Property Tax
Canada
2006 2007 2008 2009 2010 2011
0
500
1000
1500
2000
2500
3000
3500
'10'09'08'07'06'05'04

16 | The Mining Industry in British Columbia 2011
Indirect Tax in British Columbia - Update for the mining industry
In 2011, the Province of British Columbia held a referendum that resulted in a decision by voters to eliminate participation in the federal HST regime and reinstate the BC Provincial Sales Tax (“PST”) as it existed on June 30, 2010 (prior to the implementation date of the HST). Following the release of the referendum results, the BC Ministry of Finance announced its plan to reinstate the PST on April 1, 2013.
Reinstatement of BC PST
For the mining industry, a return to PST will result in additional costs associated with production and overhead. However, the BC Ministry of Finance has also announced that the permanent PST exemptions that were in place as of June 30, 2010 will continue to be in effect after April 1, 2013. This means the PST exemptions relating to the mining industry, for example, the exemption for production machinery or equipment used in exploration for minerals or development of mines or for manufacturing will likely be reinstated. Generally, these particular exemptions reduce the cost of PST for the mining industry in BC but there are still various costs associated with the purchase of taxable tangible personal property and/or taxable services that will not qualify for an exemption, such as electricity typically used to operate machinery or for lighting etc., software licences/hardware and office equipment. In the HST regime, mining companies are generally eligible to recover all or a portion the HST paid on such costs. In particular, under HST, mining companies that produce in BC are eligible to recover a significant portion of the HST paid on electricity (or other energy) consumed in the course of manufacturing activities. Under PST, the 7% portion of the tax that was previously recoverable under HST will not be recoverable and will result in an increased cost of production.
In addition to the reinstatement of PST, other taxes and levies (such as levy on tires, tax on propane, 10% tax on alcohol, passenger vehicle rental tax, etc.) that were eliminated with the harmonization of GST on July 1, 2010 will also be reinstated on April 1, 2013. In particular, the Innovative Clean Energy (“ICE”) Fund levy of 0.4 per cent of the purchase price on residential and commercial energy purchases of natural gas, fuel oil and propane sold on a grid will be reinstated in the same manner as before harmonization.
In summary, the result of returning to the PST will likely result in an overall increased cost to operate in BC for the mining industry.
The BC Ministry of Finance also announced that it has established an independent panel to study the impact of various taxes in the province of BC and make recommendations in the summer of 2012 which may result in other changes to the current tax structure in BC.
Impact of HST Referendum

The Mining Industry in British Columbia 2011 | 17
Administrative Issues for Reinstating PST
The Federal Department of Finance has published some general transitional rules to outline the process for eliminating the HST at 12% in BC. The general rules are summarized in the table below:
Amounts typically become payable (i.e. due) on the earliest of:
• when the supplier actually issues an invoice for the supply;
• the date of that invoice;
• the day the supplier would have issued the invoice but for an “undue delay”; and
• the day the recipient is required to pay pursuant to an agreement in writing.
There are also specific transitional provisions for specific areas such as imported goods and taxable supplies, pension plans, taxable benefits, and refunds/rebates. The Federal Department of Finance and BC Ministry of Finance have announced that additional transition provisions will be released over the next year.
Carbon Tax
Carbon taxes were introduced in BC in an effort to reduce greenhouse gas emissions, effective July 1, 2008, on the retail purchase or use of fossil fuels within BC, including fuels such as gasoline, diesel, natural gas, heating fuel, propane, and coal, and to peat and tires when used to produce energy or heat. All industries, businesses and individuals who buy or use fossil fuels within BC pay carbon tax.
The carbon taxes are administered and audited by the BC Ministry of Finance. Over the past year, there has been an increase in audit activity and also with submissions made to the Ministry to voluntarily disclose on carbon tax compliance matters (registration and payment of security).
The carbon tax will increase to $30 per tonne of carbon dioxide equivalent on July 1, 2012; and as announced in the 2012 BC Budget, the carbon tax rate per tonne of carbon dioxide equivalent will be fixed at this rate after June 30, 2013.
Applicable tax rate
When tax is: Paid or payable before April 1, 2013 12% BC HST
Paid and payable after March 31, 2013 5% GST

18 | The Mining Industry in British Columbia 2011
The PricewaterhouseCoopers’ survey of mining companies in the province shows the total salary and benefits were $1,077 million in 2011, which is a 22% increase over the 2010 level of $886 million. The average number of employees increased from 8,195 in 2010 to 9,310 in 2011 (increase of 14%).
Total training hours have risen from 67,500 in 2010 to 77,790 in 2011 (an increase of 15%). In contrast, the amount of training dollars has decreased from $6,740 million to $6,047 million, or 10%. The training cost per hour has then fallen from $100 in 2010 to $78 in 2011.
Submitted by The Mining Industry Human Resources Council and the BC Mining HR Task Force
The Mining Industry Human Resources Council (“MiHR”) produces an annual study examining the prevailing labour market trends affecting the mining industry in Canada. MiHR’s latest national report (2011) estimates that the industry will be required to hire or replace over 112,000 workers by 2021, under a baseline scenario. Clearly, the future-competitiveness of the industry will depend on its ability to attract and retain people. A greater challenge emerges if there are not enough workers available to support the industry’s expanding hiring requirement, and ultimately its promising future (See MiHR’s 2010 and 2011 National reports).
This summer, MiHR and the BC Mining HR Task Force (Exploration, Mining, Sand & Gravel) will create a specialized report focusing on the future of BC’s mining labour force. Preliminary analysis using labour supply and demand models to forecast industry needs for the next 10 years reveals that a gap will emerge between the amount of new labour supplied to core mining occupations and the demand for new labour. This gap is forecast to widen with every year.
MiHR’s forecasting model is divided into two main components: hiring requirements and available talent:
• Hiring requirements is described as labour demand plus the demand to replace workers due to retirement and labour-force-separation.
• Available talent considers the new entrants available to the industry (i.e. school-leavers, migrators, etc.)
Employment
Average Salary and Benefit Cost per Employee
Direct Employment(Number of employees)
Average Salary and Benefit Cost per Employee
0
2000
4000
6000
8000
10000
‘11‘10‘09‘08‘07‘06‘05‘04‘03‘02
Average Number of Direct EmployeesAverage Benefits per EmployeeAverage Salary per Employee
Aver
age
Num
ber o
f Em
ploy
ees
(000
’s)
000’
s $C
AD
0204060
80
100
'11'10'09'08'07'06
20060
20
40
60
80
100 10
120
2007 2008 2009 2010 2011
Direct Employment (Number of employees)
Direct Employment(Number of employees)
Average Salary and Benefit Cost per Employee
0
2000
4000
6000
8000
10000
‘11‘10‘09‘08‘07‘06‘05‘04‘03‘02
Average Number of Direct EmployeesAverage Benefits per EmployeeAverage Salary per Employee
Aver
age
Num
ber o
f Em
ploy
ees
(000
’s)
000’
s $C
AD
0204060
80
100
'11'10'09'08'07'06
20060
20
40
60
80
100 10
120
2007 2008 2009 2010 2011
Rod Shier, CFO Copper Mountain Mining Corporation
“ Bringing a new mine to an area has a significant impact to that area, and the province, with spin-off jobs.”

The Mining Industry in British Columbia 2011 | 19
The forecast for labour demand is created by first forecasting the industry’s production level. The production forecast is based on specific drivers that are related to BC’s mining industry (i.e. commodity prices). Employment is then estimated by linking GDP to employment. The difference between GDP and employment is attributable to a change in labour productivity, defined as the changing capacity of workers (labour inputs) to produce output. Figure 1 illustrates the relationship between GDP growth and employment growth in the mining industry in Canada from 1988 to 2010.
As the demand for BC minerals is expected to grow over the next 10 years, so too is the demand for labour inputs. Projected results in Figure 2 show a clear trend: there will be a declining supply of workers available to BC mining occupations, but there will also be a growing demand for workers. Specifically labour demand in the industry will be 29 per cent higher in 2021 compared to the demand in 2011, while labour supply will be 4 percent lower in 2021 compared to where it was in 2011.
The complete BC labour market report is expected to be released in summer 2012 by MiHR and the BC Mining HR Task Force (Exploration, Mining, Sand & Gravel). The analyses will further be broken-down by industry sectors (i.e. mining, exploration and aggregate production), and will provide occupational and regional outlooks.
FIgure 1: Relationshiop between GDP growth and employment growth in Canada’s mining industry
Figure 2: Gap in supply and demand for workers to widen (Cumulative percent change from 2011)
Sources
Fig. 1. MiHR; The Conference Board of Canada
Fig. 2. MiHR; The Conference Board of Canada; Statistics Canada

20 | The Mining Industry in British Columbia 2011
The Changing Landscape
Last year, more than one-third of employees at companies surveyed would be eligible to retire within the next five years, and even though there is an anticipated decline in mining jobs as a result of factors such as productivity gains. It is still forecasted that there will be hiring requirements of more than half of the current industry workforce by 2020. This could mean recruitment initiatives to fill up to 100,000 jobs nationwide.
In BC, close to half of the mining labour force could be eligible for retirement by 2020. With more than 20 major operating mines, 300 mineral exploration projects and 30 new aggregate mines, at least 15,000 new workers might be needed to meet the labour requirements.
The good news is that a growing labour market resource already exists in close proximity to active mines and development sites: a young and rapidly expanding Aboriginal population. According to the 2006 census,13 48% of Aboriginal people are less than 25 years old, compared to 31% for the non-Aboriginal cohort. Between 2001 and 2026, more than 600,000 Aboriginal youth will be entering the labour market. In particular, the 15-29 age group is projected to grow by 37% compared to 6% for the general Canadian population.
The census also found that Aboriginal employment in the mining industry is increasing rapidly:
• 4,515 Aboriginal people worked in the mining industry in 2006. This represents a 43% increase from 1996 and is likely to have increased again between 2006 and 2012. The largest Aboriginal workforces were reported in Saskatchewan (20.7%), Ontario (17.2%) and British Columbia (14.4%)
• Aboriginal workers accounted for an estimated 7.5% of the mining workforce in 2006 versus 3.6% in 1996, a growth trend that is also expected to continue.
With this booming demographic, and given that over 1,200 Aboriginal communities are located within 200 miles of mineral properties, many mining companies are taking steps to promote Aboriginal inclusion in mining by increasing Aboriginal employment and training opportunities:
• Respondents to MiHR’s 2010 National Employer Survey indicated that, on average, 12% of their workforces self-identify as being of Aboriginal descent.
• Over half of respondents specifically target Aboriginal peoples in their attraction, recruitment, retention and advancement activities.
• Approximately 40% of respondents said that they had agreements in place that commit the organization to specific levels of employment or targeted business development and spending on Aboriginal communities.
Mining companies are not only entering into agreements with individual Aboriginal communities, they are participating with Aboriginal organizations and other partners in efforts to recruit, train and place Aboriginal workers in mining projects. For example, The BC Aboriginal Mine Training Association (“BCAMTA”) develops and delivers skills training and staffing programs, with a focus on matching local workers with local mining jobs. This collaborative effort with Aboriginal communities, mining and exploration companies, industry associations, government and educational institutions has already resulted in over 900 Aboriginal people enrolled in training and 230 employed.
First Nations and the mining industry
Sources
13. Statistics Canada. Aboriginal Peoples in Canada in
2006: Inuit, Métis and First Nations, 2006 Census.
Pho
to D
anie
l Hen
shaw
, cou
rtes
y of
Imp
eria
l Met
als
Cor
por
atio
n
The Mining Industry in British Columbia 2011 | 21
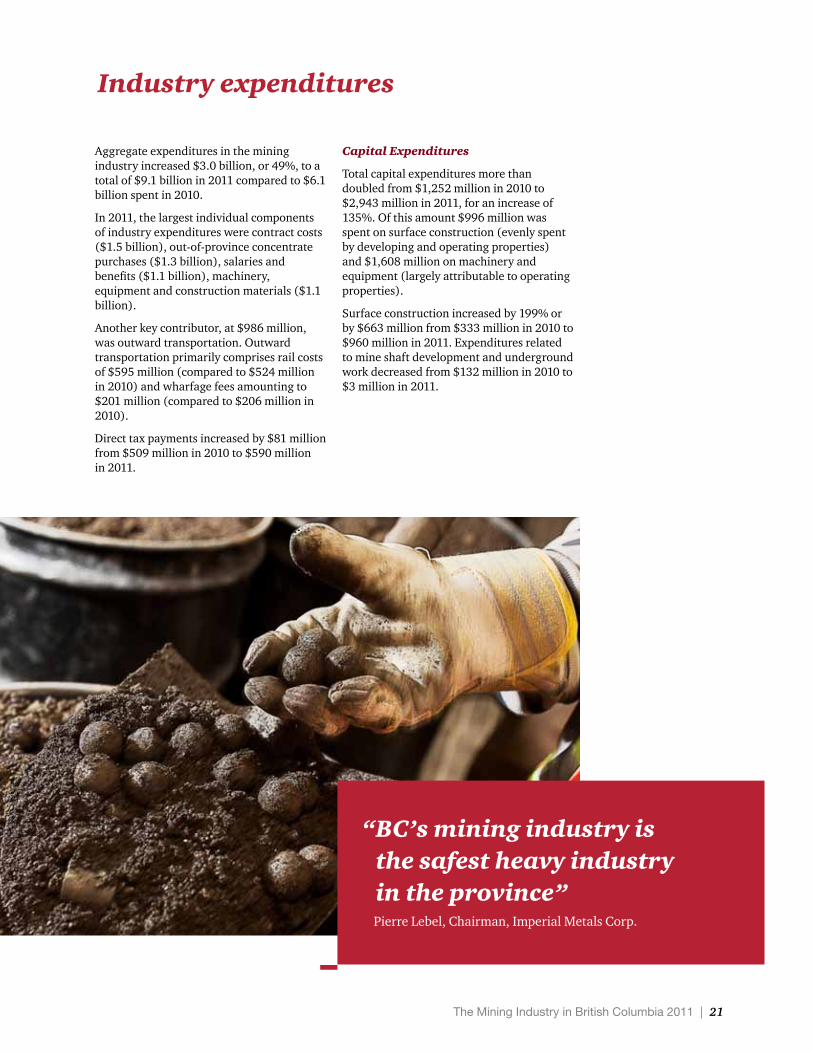
Aggregate expenditures in the mining industry increased $3.0 billion, or 49%, to a total of $9.1 billion in 2011 compared to $6.1 billion spent in 2010.
In 2011, the largest individual components of industry expenditures were contract costs ($1.5 billion), out-of-province concentrate purchases ($1.3 billion), salaries and benefits ($1.1 billion), machinery, equipment and construction materials ($1.1 billion).
Another key contributor, at $986 million, was outward transportation. Outward transportation primarily comprises rail costs of $595 million (compared to $524 million in 2010) and wharfage fees amounting to $201 million (compared to $206 million in 2010).
Direct tax payments increased by $81 million from $509 million in 2010 to $590 million in 2011.
Capital Expenditures
Total capital expenditures more than doubled from $1,252 million in 2010 to $2,943 million in 2011, for an increase of 135%. Of this amount $996 million was spent on surface construction (evenly spent by developing and operating properties) and $1,608 million on machinery and equipment (largely attributable to operating properties).
Surface construction increased by 199% or by $663 million from $333 million in 2010 to $960 million in 2011. Expenditures related to mine shaft development and underground work decreased from $132 million in 2010 to $3 million in 2011.
Industry expenditures
“ BC’s mining industry is the safest heavy industry in the province”
Pierre Lebel, Chairman, Imperial Metals Corp.

22 | The Mining Industry in British Columbia 2011
As metal and coal prices are quoted in US dollars, the CAD$ to US$ foreign exchange rate has a major impact on mining revenues for BC mines.
The CAD has fluctuated over the past 7 years from 1.2116 CAD$/US$ to 0.9891 CAD$/US. During 2011 the dollar strengthened from 1.0299 CAD$/US$ in 2010 to 0.9891 CAD$/US$ in 2011, representing an increase of 4%.
The revenue change due to a 1 cent change in value of the CAD versus US dollar would cause a fluctuation of approximately $100 million in 2011 gross mining revenues. The effect of a 1 cent change in CAD$/US$ in 2010 was $77 million in gross revenues. In 2011, the strengthening of the CAD negatively affected net revenues by an estimated $409 million.
In the first quarter of 2012, the average exchange rate weakened slightly to 0.9980 CAD$/US$. One negative impact of a strengthening CAD is that it will decrease revenues as reported in this survey as they are driven by US$ based commodity prices. The one-year forward bid exchange rate for May 2012 was $0.9966 CAD$/US$. If the rate of $0.9966 CAD$/US$ had been in effect through the whole of 2011, it would have decreased gross mining revenues reported by approximately $34 million.
Foreign exchange
$CAD/US$ Exchange Rate vs. Selected Base Metal Prices
In 2011, the strengthening of the Canadian dollar negatively affected net revenues reported by an estimated $409 million.$CAD/US$ Exchange Rate vs.
Selected Base Metal Prices
Base
Met
al P
rice
$USD
per
pou
nd
Exch
ange
Rat
e
1.0
1.1
1.2
1.3
1.4
1.5
1.6
1.7
1.8
'11'10'09'08'07'06
0.5
1.0
1.5
2.0
2.5
3.0
3.5
4.0
'11'10'09'08'07'06
$CAD per US$
Copper (LME Grade A)
Zinc (LME Cash)
0.5
1.0
1.5
2.0
2.5
3.0
3.5
4.0
20061.0
1.1
1.2
1.3
1.4
1.5
1.6
1.7
1.8
2007 2008 2009 2010 2011

The Mining Industry in British Columbia 2011 | 23
Reclamation is the process that includes, but is not limited to:
• maintaining water and air quality
• minimizing flooding, erosion and damage to wildlife and aquatic habitats caused by surface mining
• topsoil replacement and re-vegetation with suitable plant species
• restoring of mine site and removal of infrastructure
Our survey participants include three mines that are in the reclamation stage. Reclamation expenditures amounted to $63 million in 2011, increased by $9 million, or 17%, from $54 million in 2010.
It should be noted that these environmental expenditures do not include costs incurred by development stage enterprises in the Environmental Impact Assessment process.
Reclamation Bonding 14
In the last decade, environmental sustainability has become a significant priority for governments as well as mining corporations. Part of this increased importance is signified by the Government of BC’s requirement for reclamation bonding prior to the issuance of a mine permit.
The Ministry of Environment (federal) and the BC Ministry of Mines, Energy and Petroleum Resources (“MEMPR”) have an agreement which requires that the MEMPR ensure that mining properties are reclaimed once the respective mines have ceased operations. While this responsibility is originally assigned to the provincial government, it is distributed to the mining company through the use of reclamation bonds.
The reclamation bond is a type of surety bond whereby the mining company deposits a sum within a mine reclamation fund established by the government. This bond acts as security against the reclamation of the mine site. Once reclaimed, the ministry may draw on the mine reclamation fund and refund the company, including any interest earned on the bond. On the other hand, if not reclaimed, the ministry can draw on all or part of the fund for the purposes of having the site reclaimed.
A company must submit a reclamation plan to the Government of BC for approval during the exploration phase, as part of the mineral exploration application. The bond itself will be submitted once the Assessment Report / Report on Work has been filed with the MEMPR, and collected once commercial production begins. Reclamation securities can only be released by the authority of the Chief Inspector of Mines.
Reclamation and environmental management
Notes
14. http://www.empr.gov.bc.ca/Titles/MineralTitles/Pub/Documents/
general/Mining_Process_BC.pdf
http://www.empr.gov.bc.ca/MINING/PERMITTING-RECLAMATION/
COSTING-SECURITY/Pages/default.aspx
http://www.empr.gov.bc.ca/Mining/HealthandSafety/Documents/
HSRC2008.pdf
Pho
to D
anie
l Hen
shaw
, cou
rtes
y of
Imp
eria
l Met
als
Cor
por
atio
n

24 | The Mining Industry in British Columbia 2011
Corporate Social Responsibility (CSR) / Towards Sustainable Mining (TSM)
Towards Sustainable Mining (“TSM”) is an initiative developed by The Mining Association of Canada (“MAC”) and was adopted by the Mining Association of BC (“MABC”) in 2011. All TSM reporting requirements thus apply to MABC members. The goal of TSM is to improve performance in the area of corporate social responsibility through the alignment of industry actions with Canadian priorities and values. The program is positioned to allow the mining industry to continue as a leading economic contributor while proactively operating in an environmentally and socially responsive manner. TSM focuses on improving performance at the operational level. Performance is evaluated by external verification
companies. Evaluation is based on the quality, comprehensiveness and robustness of management systems under four performance elements with appropriate indicators that are graded from AAA (excellence and leadership) to C (reactive and non-integrated systems). The performance indicators are reported annually for each facility, externally verified every three years, and reviewed by the community of interests (“COI”) advisory panel. The COI advisory panel comprises external stakeholders from various backgrounds. MAC members were mandated to beginning their performance assessment in 2004.
A framework was approved by MAC in 2008 regarding mine closure; however, a working group has not yet determined how to proceed with this protocol.
Two more elements are in consideration for inclusion in the future: mining and water and the international application of TSM. The measurement criteria listed above, along with the newly adopted performance elements, are essential to continually improve CSR in moving towards sustainable mining.15
Notes
15. http://www.mining.bc.ca
Gavin Dirom, President & CEO Association for Mineral Exploration BC
“ Resource revenue sharing is very, very important. It’s a great policy of the BC Governments. It was actually a leading policy in terms of what they’re doing around the world.”

The Mining Industry in British Columbia 2011 | 25
Conclusion and outlook
2011 was a great year that continued to reaffirm how important the mining industry is to the provincial economy. As part of the 2011 survey process, we conducted interviews with some of the key figures in the BC Mining industry. The interviewees without exception saw 2011 as a year which vindicates the often touted “renaissance” in the BC Mining Industry. There were four new major metals mines under construction during 2011. Copper Mountain commenced commercial production in the year and New Afton is expected to come on stream in 2012 while construction is ongoing at Mt. Milligan and Red Chris. But that’s not all. There are a significant number of Projects in the permitting process. Those that have completed or are at an advanced stage of that process include Kitsault, New Prosperity and Ajax.
British Columbia’s mining activity has historically been dominated by the coal sector, and 2011 was no exception. An increase in coal prices and shipment volumes added $1.8 billion in net mining revenues from coal. This is a sector that still has capacity for continued growth and expansion. Followers of copper should also be heartened by the fact that most of the major new mines under construction or in the advanced permitting stage feature copper as their primary metal.
In addition to the record breaking revenue increases in 2011, the provincial mining industry also stimulated the economy with an additional $3 billion in overall direct industry expenditures. This is a significant increase and definitely something to get excited about! In 2011, PricewaterhouseCoopers completed an Economic Impact Analysis for the Mining Association of BC, which used the 2010 BC Mining Survey results as a base. That study suggests that the direct and indirect economic output from mining in BC was $8.9 billion, reflecting the total sum of all economic activity that has taken place in connection with expenditures made through BC mining companies. This further demonstrates how important mining is and will continue to be to the Province.
Prior to 2011, there had not been a major new metal mine constructed and opened in over a decade. The growth and number of projects in the pipeline in 2011 is a testament to the resilience of the industry and its commitment to staying the course and getting things done. Initiatives like the Towards Sustainable Mining program allow the industry to both measure and report their Corporate Social Responsibility actions and contributions. BC continues to lead
the way in consultation with First Nations using innovative programs such as revenue sharing to enable it to move projects forward. Mining continues to be a significant and well paid profession in the province, and as the MiHR numbers suggest, it will continue to be an area ripe with employment opportunities for decades to come.
The industry has recognised its challenges and is working hard to address them. This has translated into the excellent financial results reported in this survey. There is no room for complacency and the BC Mining industry is continuing to address issues like land access rights, educating stakeholders about the nature and benefits of mining, planning for the infrastructure that growth requires and addressing its workforce needs to ensure this growth can be sustained in the future.
The industry has made great strides in 2011 and the outlook for continued growth and construction looks very positive. Work is scheduled to commence on the Northwest Transmission Line, to open up the north west of the Province for business. There is greater investment potential in the province than ever as it continues to bring its projects on line. BC is Forging Ahead.
26 | The Mining Industry in British Columbia 2011
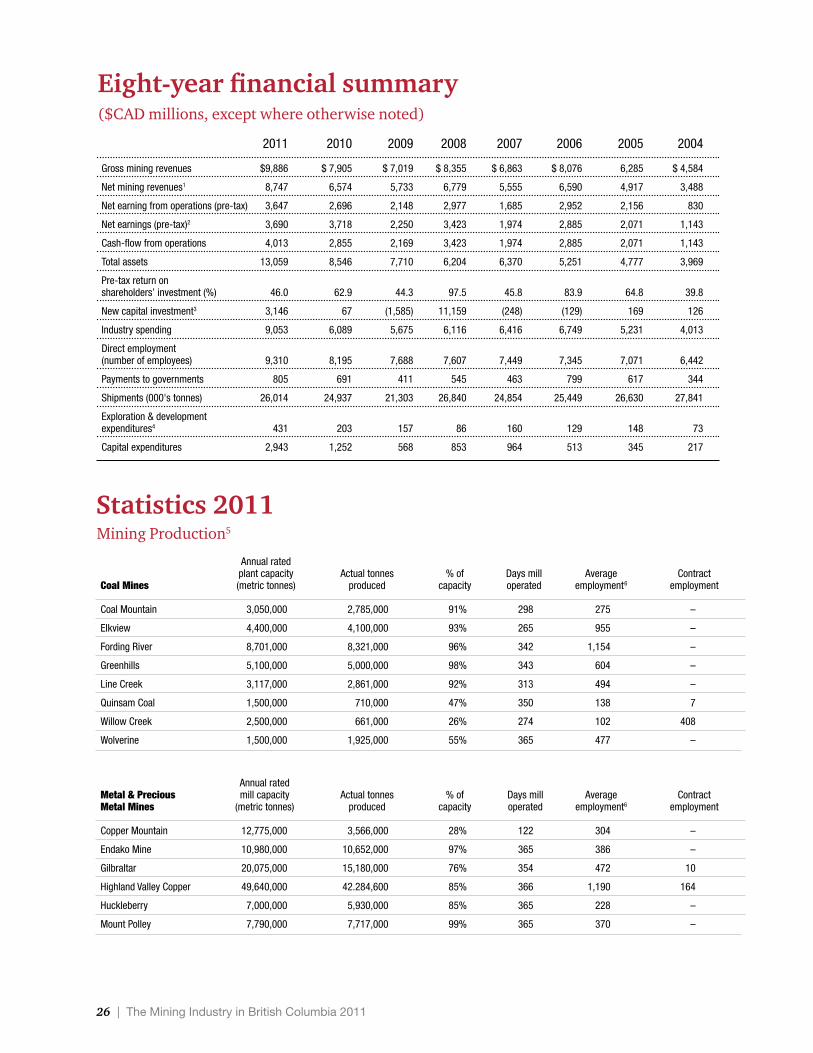
Eight-year financial summary
Statistics 2011 Mining Production5
Annual rated plant capacity Actual tonnes % of Days mill Average ContractCoal Mines (metric tonnes) produced capacity operated employment6 employment
Coal Mountain 3,050,000 2,785,000 91% 298 275 –
Elkview 4,400,000 4,100,000 93% 265 955 –
Fording River 8,701,000 8,321,000 96% 342 1,154 –
Greenhills 5,100,000 5,000,000 98% 343 604 –
Line Creek 3,117,000 2,861,000 92% 313 494 –
Quinsam Coal 1,500,000 710,000 47% 350 138 7
Willow Creek 2,500,000 661,000 26% 274 102 408
Wolverine 1,500,000 1,925,000 55% 365 477 –
Annual rated Metal & Precious mill capacity Actual tonnes % of Days mill Average ContractMetal Mines (metric tonnes) produced capacity operated employment6 employment
Copper Mountain 12,775,000 3,566,000 28% 122 304 –
Endako Mine 10,980,000 10,652,000 97% 365 386 –
Gilbraltar 20,075,000 15,180,000 76% 354 472 10
Highland Valley Copper 49,640,000 42.284,600 85% 366 1,190 164
Huckleberry 7,000,000 5,930,000 85% 365 228 –
Mount Polley 7,790,000 7,717,000 99% 365 370 –
($CAD millions, except where otherwise noted)
2011 2010 2009 2008 2007 2006 2005 2004
Gross mining revenues $9,886 $ 7,905 $ 7,019 $ 8,355 $ 6,863 $ 8,076 6,285 $ 4,584
Net mining revenues1 8,747 6,574 5,733 6,779 5,555 6,590 4,917 3,488
Net earning from operations (pre-tax) 3,647 2,696 2,148 2,977 1,685 2,952 2,156 830
Net earnings (pre-tax)2 3,690 3,718 2,250 3,423 1,974 2,885 2,071 1,143
Cash-flow from operations 4,013 2,855 2,169 3,423 1,974 2,885 2,071 1,143
Total assets 13,059 8,546 7,710 6,204 6,370 5,251 4,777 3,969
Pre-tax return on shareholders’ investment (%) 46.0 62.9 44.3 97.5 45.8 83.9 64.8 39.8
New capital investment3 3,146 67 (1,585) 11,159 (248) (129) 169 126
Industry spending 9,053 6,089 5,675 6,116 6,416 6,749 5,231 4,013
Direct employment (number of employees) 9,310 8,195 7,688 7,607 7,449 7,345 7,071 6,442
Payments to governments 805 691 411 545 463 799 617 344
Shipments (000's tonnes) 26,014 24,937 21,303 26,840 24,854 25,449 26,630 27,841
Exploration & development expenditures4 431 203 157 86 160 129 148 73
Capital expenditures 2,943 1,252 568 853 964 513 345 217

The Mining Industry in British Columbia 2011 | 27
Notes
1. Net mining revenues are reported after deduction of smelting and
charges, freight costs, and marketing deductions.
2. Some of the earnings reported are generated by trusts and joint
ventures and do not include income taxes. Consequently, to provide
consistency in results, net earnings have been collated and reported
on a pre-tax basis.
3. Net new capital investment is calculated as new capital raised minus
loan capital and advances repaid. The 2009 figure includes $6.3
billion of debt refinancing in the calculation.
4. The value of exploration and development expenditures presented
here is the total reported by companies which participated in the
survey and does not include expenditures made by non-participating
exploration companies based in BC, or expenditures by companies
domiciled outside of the province.
Notes
5. Statistics provided for participating mines who responded to these
questions; not all operations provided responses.
6. Average number of employees actually working during fiscal year

28 | The Mining Industry in British Columbia 2011
Mining, with its own laws, taxes, business practices and investment policies, is a complex industry. Add globalization and a growing need for high-tech solutions, and it’s easy to see why mining companies need business advisors with industry experience and expertise in a host of specialized disciplines. That’s where we fit in.
PwC is the leading advisor and professional services provider to the mining industry in BC and around the world. We work with more mineral exploration companies, producers, and service providers than any other professional services firm, and we audit the majority of the large international mining houses, among them the world’s largest metal, industrial mineral and coal producers.
We provide specialized advice to BC mining companies of all types – whether they have mines, mills, or corporate offices in BC.
PwC’s presence in traditional and emerging markets, and experience with private industry, institutions and governments enables us to meet client needs at a moment’s notice in the areas of:
• Audit and assurance
• Merger, acquisition, and business transactions, including corporate finance
• Risk management
• Business process outsourcing
• Environmental services
• Financial advisory
• International, domestic, and transfer pricing tax
• Corporate restructuring, insolvency, and distressed assets
PwC considers the annual British Columbia Mining Survey part of our commitment to this important industry. For more information about our mining services, call one of the contacts listed below, or visit our Web site at www.pwc.com/ca/mining
PwC’s mining services

The Mining Industry in British Columbia 2011 | 29
Audit and Assurance Group and Tax Partners
Michael Cinnamond [email protected] 604 806 7029
John DeLucchi [email protected] 604 806 7575
Dean Larocque [email protected] 604 806 7173
Craig McMillan [email protected] 604 806 7724
Mark Patterson [email protected] 604 806 7160
Mark Platt [email protected] 604 806 7093
Ken Scott [email protected] 604 806 7175
Garry Eng (Tax) [email protected] 604 806 7037
Tim Johnston (Tax) [email protected] 604 806 7831
Sean Wilson (Tax) [email protected] 604 806 7187
Senior Managers
Debbie Carstens [email protected] 604 806 7351
Lana Kirk [email protected] 604 806 7102
Frans Minnaar [email protected] 604 806 7156
Elena Orlova [email protected] 604 806 7358
Vilja Roman [email protected] 604 806 7506
Andrew Slack [email protected] 604 806 7291
Michael Warner [email protected] 604 806 7631
Grace Zheng [email protected] 604 806 7296
Brooke Ko (Tax) [email protected] 604 806 7798
Charmaine Neilsson (Tax) [email protected] 604 806 7573
Managers
Marianne Carroll [email protected] 604 806 7237
Zhe Xuan Choo [email protected] 604 806 7645
Andras Kecskes [email protected] 604 806 7197
Mazin Khan [email protected] 604 806 7566
Timur Lidzhiev [email protected] 604 806 7245
Alejandro Rueda Lopez [email protected] 604 806 7196
James Paterson [email protected] 604 806 7022
Corinne Smit [email protected] 604 806 7019
Len Wadsworth [email protected] 604 806 7085
David Wilcox [email protected] 604 806 7305
Jaimini Amin (Tax) [email protected] 604 806 7038
Pamela Gao (Tax) [email protected] 604 806 7064
Julia Loh (Tax) [email protected] 604 806 7279
Pho
to D
anie
l Hen
shaw
, cou
rtes
y of
Imp
eria
l Met
als
Cor
por
atio
n

30 | The Mining Industry in British Columbia 2011
Please direct any questions about this survey to:
Michael Cinnamond, CA PwC | [email protected] 604 806 7029
or
Marianne Carroll, CA PwC | [email protected] 604 806 7237
For additional copies of this publication, please contact:
Diane Erdstein PwC | [email protected] 604 806 7890
Key contributors to the survey:
Michael CinnamondMarianne CarrollGrant BondCorey IversonDiane Erdstein Jim Nelson Jennifer RobinsonMIHR Charmaine NeilsonShawna HansenSandra ThomsonPaul CoffeyPatrick Gunn

The Mining Industry in British Columbia 2011 | 31
This is a condensed version of results of the 2011 survey.
Complete survey results, including appendices, are available on the PwC website at www.pwc.com/ca/bcminingsurveyand on the MABC website at www.mining.bc.ca
Pho
to D
anie
l Hen
shaw
, cou
rtes
y of
Imp
eria
l Met
als
Cor
por
atio
n

© 2012 PricewaterhouseCoopers LLP. All rights reserved. In this document, “PwC” refers to PricewaterhouseCoopers LLP, an Ontario limited liability partnership, which is a member firm of PricewaterhouseCoopers International Limited, each member firm of which is a separate legal entity. 2652-02 0512
www.pwc.com/ca/mining