Embed Size (px)
Citation preview
The MidThe Mid‐‐Atlantic Coastal Wetland Assessment:Atlantic Coastal Wetland Assessment:Integrated Monitoring of Tidal Wetlands for Water Quality and Integrated Monitoring of Tidal Wetlands for Water Quality and
Habitat Management and Restoration PlanningHabitat Management and Restoration Planning
Danielle KreegerMartha Maxwell‐DoyleMartha Maxwell Doyle
Amy Deller JacobsAngela Padeletti
Tracy QuirkDavid VelinskyTh B ltThomas BeltonDorina Frizzera

White Paper Top Ten1. Contaminants (forms, sources, fates & effects for different classes)
2. Tidal Wetlands (status, trends and relative importance of different types)
3. Ecologically Significant Species & Critical Habitats (benthos, horseshoe crabs)
4. Ecological Flows (effects of flow changes on salt balance & biota)
5. Physical-Chemical-Biological Linkages (e.g., sediment budgets, toxics & biota)5. Physical Chemical Biological Linkages (e.g., sediment budgets, toxics & biota)
6. Food Web Dynamics (key trophic connections among functional dominant biota)
7. Nutrients (forms, concentrations and balance of macro- and micronutrients)
8. Ecosystem Functions (assessment and economic valuation of ecosystem services)
9. Habitat Restoration and Enhancement (science & policy)
10. Invasive Species (monitoring, management & control)
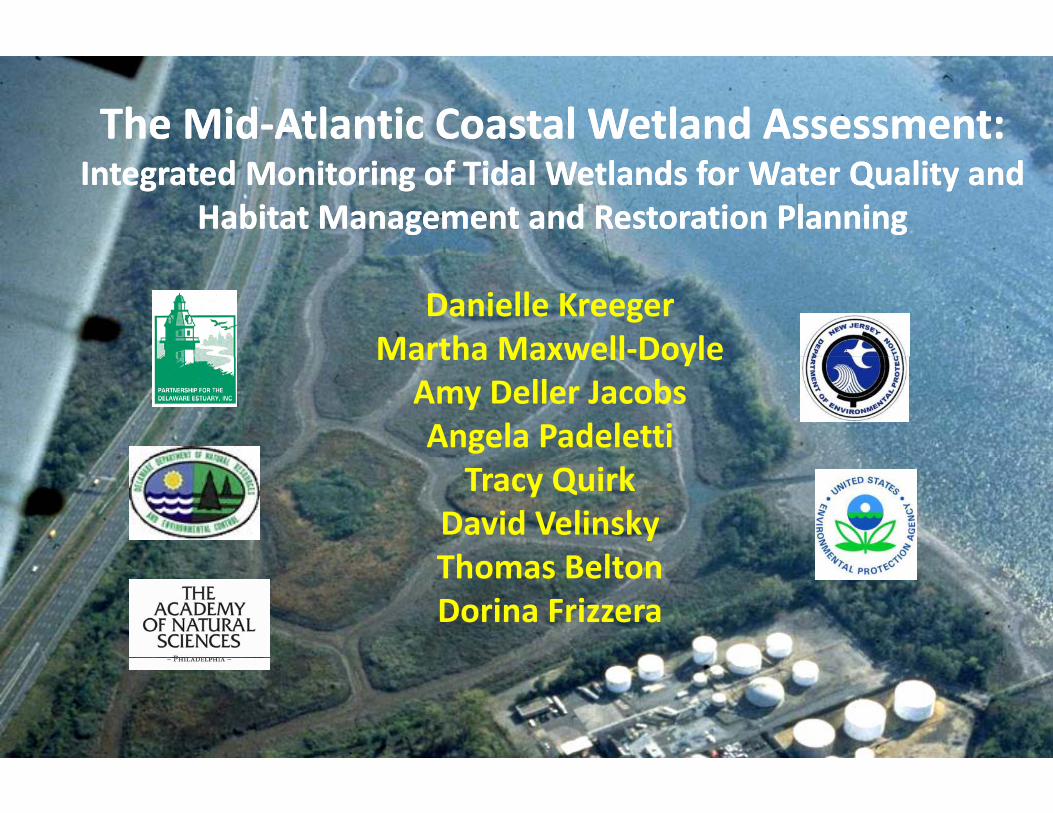
Tidal Wetlands

Tidal Wetlands
A Signature Trait of SystemN C ti B dNear Contiguous BandDiverse: Freshwater Tidal Marshes
Brackish MarshesSalt Marshes
Nature’s Benefitsl dFlood ProtectionFish and WildlifeNatural AreasCarbon SequestrationWater Quality

State of the EstuaryState of the Estuary Report 2008
Acreage?no recent, consistent, , ,high resolution data across the estuary
Condition?no datano data

Tidal Wetland Projections ‐ IEc
2000 2100
SLAMM V6 Fi diSLAMM V.6 Findings:• 26% loss of 42,558 hectares of tidal wetlands• loss of 50,236 hectares of adjacent uplands and non‐tidal wetlands• gain of 106,529 hectares of open water and tidal flats• net loss of >60,000 metric tons/year of primary production services

Will Tidal Wetlands Keep Pace with SLR?Will Tidal Wetlands Keep Pace with SLR?
Sediment SupplySediment SupplyPrimaryPrimary
ProductivProductivity
pp ypp yEnergy,Energy,ErosionErosion
El tiEl ti
Nutrients Sea LevelSea LevelElevationElevationCapitolCapitol
7
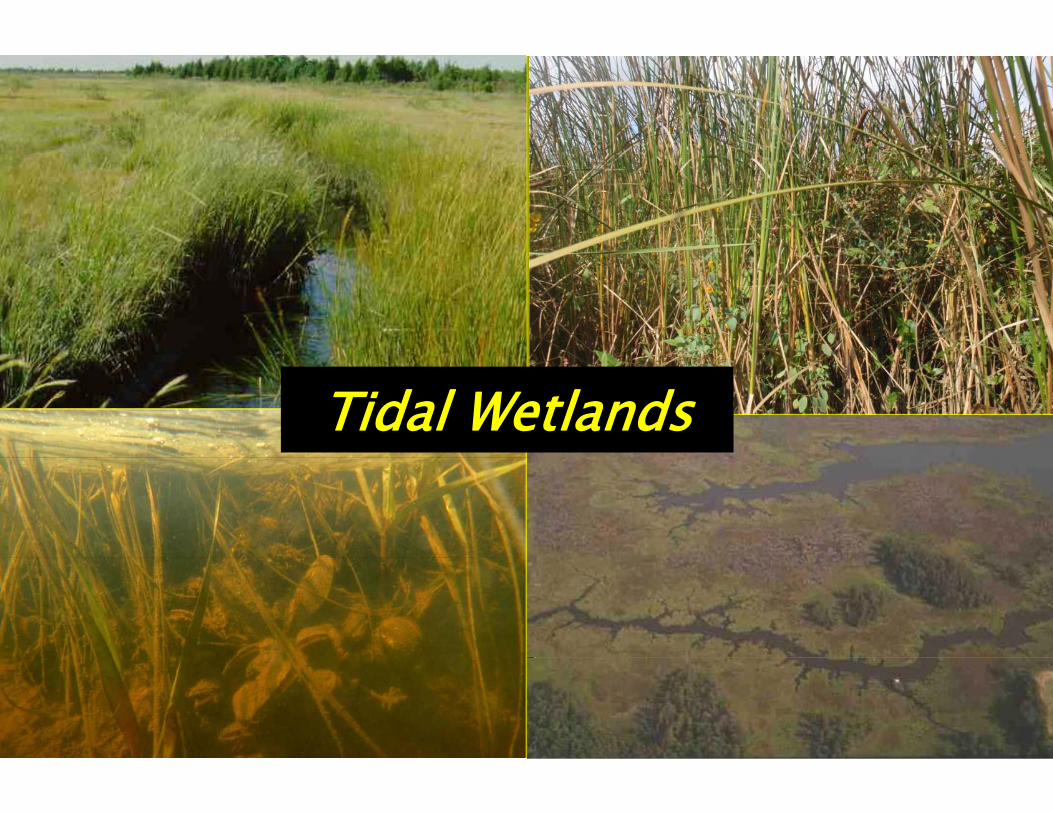
Angola Neck – Rehoboth Bay, DESummer, 2006
Sudden Wetland Dieback Sudden Wetland Dieback –– Marsh BrowningMarsh Browning
Severely
Minimally or Not
Stressed yStressed
35%
St essed17%
Moderately Stressed
48%
Slide from Chris Bason and Amy Jacobs

Tidal Wetlands - NEP Priority
On-the-GroundState of Estuary
Reporting RegulatoryOn-the-GroundProjects
Reporting
Water Quality
RegulatoryDecision-Making
Fish and Wildlife Water QualityManagement
Fish and WildlifeManagement
Climate
MACWAMACWA
RestorationPlanning
ClimateAdaptation
9
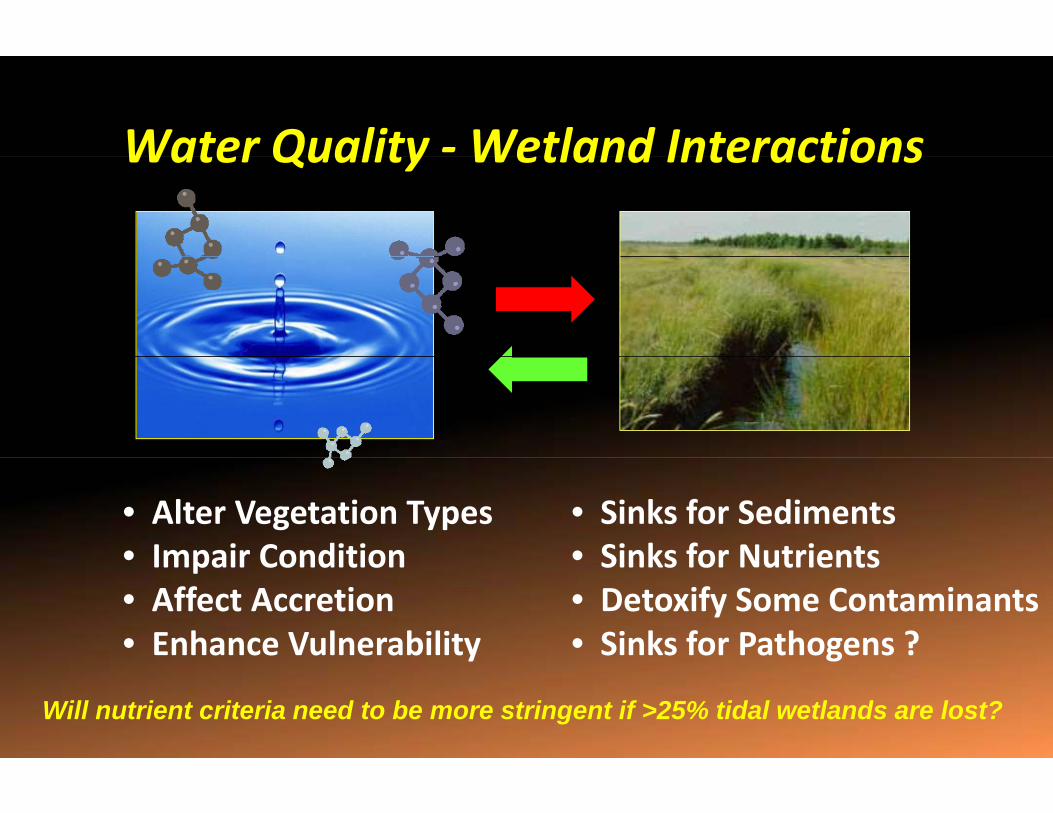
Water Quality ‐Wetland InteractionsWater Quality Wetland Interactions
• Sinks for Sediments• Sinks for Nutrients
• Alter Vegetation Types• Impair Condition • Sinks for Nutrients
• Detoxify Some Contaminants• Sinks for Pathogens ?
• Impair Condition• Affect Accretion• Enhance Vulnerability gy
Will nutrient criteria need to be more stringent if >25% tidal wetlands are lost?

Delaware Estuary Wetland Monitoring & Mid‐Atlantic Coastal Wetland Assessment Assessment Program (DEWMAP)(MACWA)
Freshwater Tidal Marsh
Salt Marsh

AcknowledgementsTidal Wetland Component of the National Water Quality Monitoring Network Delaware Basin Pilot D i ll K d A J b 11/19/07Danielle Kreeger and Amy Jacobs, 11/19/07
Mid‐Atlantic Coastal Wetland Assessment (MACWA)d t a t c Coasta et a d ssess e t ( C )
• Sample Frameall tidal wetlands between coastal New Jersey and coastal Maryland, including the Delaware Estuary
• Subpopulationswetland type (oligohaline, mesohaline, polyhaline)wetland type (oligohaline, mesohaline, polyhaline)state (DE, NJ, PA)estuary (NEPs and vicinity)estuary (NEPs and vicinity)

Guidance from EPA
Level IV Intensive monitoring at fixed stations
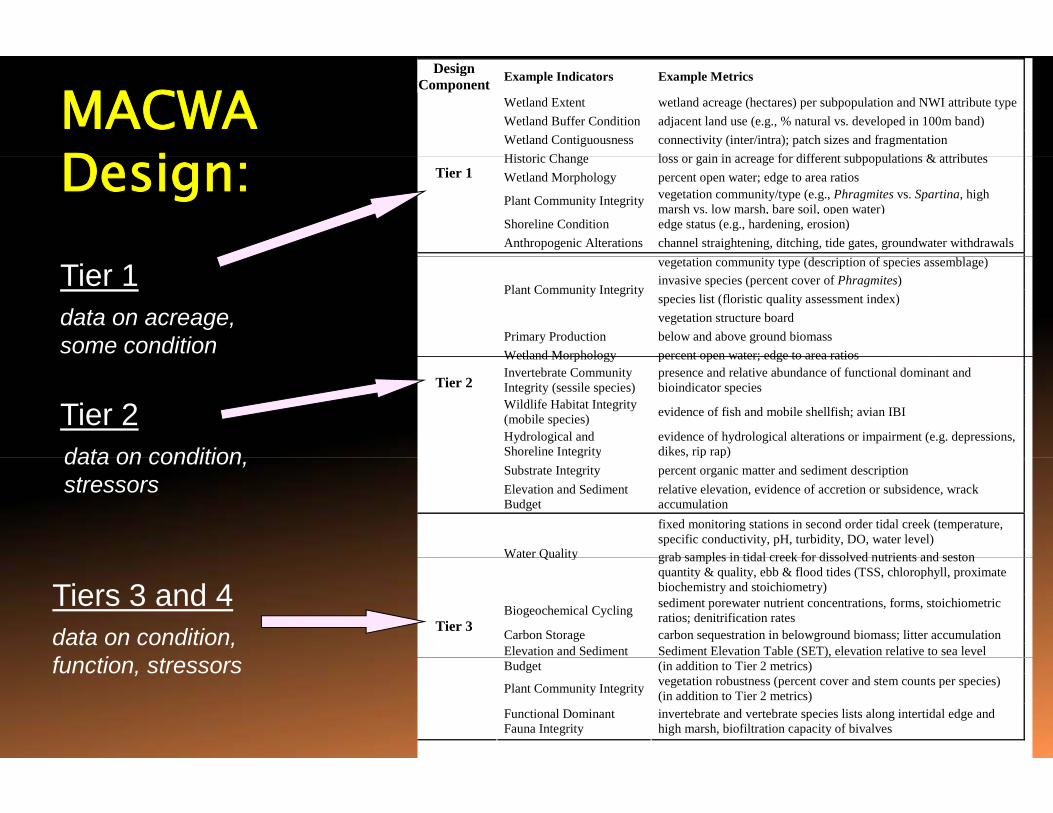
MACWAD i
Design Component Example Indicators Example Metrics
Wetland Extent wetland acreage (hectares) per subpopulation and NWI attribute type Wetland Buffer Condition adjacent land use (e.g., % natural vs. developed in 100m band) Wetland Contiguousness connectivity (inter/intra); patch sizes and fragmentation Hi t i Ch l i i f diff t b l ti & tt ib tDesign: Historic Change loss or gain in acreage for different subpopulations & attributes Wetland Morphology percent open water; edge to area ratios
Plant Community Integrity vegetation community/type (e.g., Phragmites vs. Spartina, high marsh vs. low marsh, bare soil, open water)
Shoreline Condition edge status (e.g., hardening, erosion)
Tier 1
Anthropogenic Alterations channel straightening, ditching, tide gates, groundwater withdrawals vegetation community type (description of species assemblage) invasive species (percent cover of Phragmites) species list (floristic quality assessment index)
Plant Community Integrity
vegetation structure board Primary Production below and above ground biomass Wetland Morphology percent open water; edge to area ratios
Tier 1data on acreage,some condition Wetland Morphology percent open water; edge to area ratios
Invertebrate Community Integrity (sessile species)
presence and relative abundance of functional dominant and bioindicator species
Wildlife Habitat Integrity (mobile species) evidence of fish and mobile shellfish; avian IBI
Hydrological and Shoreline Integrity
evidence of hydrological alterations or impairment (e.g. depressions, dikes, rip rap)
Tier 2
Tier 2data on condition g y , p p)
Substrate Integrity percent organic matter and sediment description Elevation and Sediment Budget
relative elevation, evidence of accretion or subsidence, wrack accumulation fixed monitoring stations in second order tidal creek (temperature, specific conductivity, pH, turbidity, DO, water level)
Water Quality grab samples in tidal creek for dissolved nutrients and seston
data on condition,stressors
Water Quality grab samples in tidal creek for dissolved nutrients and seston quantity & quality, ebb & flood tides (TSS, chlorophyll, proximate biochemistry and stoichiometry)
Biogeochemical Cycling sediment porewater nutrient concentrations, forms, stoichiometric ratios; denitrification rates
Carbon Storage carbon sequestration in belowground biomass; litter accumulation Elevation and Sediment Sediment Elevation Table (SET), elevation relative to sea level
Tier 3
Tiers 3 and 4data on condition, f ti t Budget
( )(in addition to Tier 2 metrics)
Plant Community Integrity vegetation robustness (percent cover and stem counts per species) (in addition to Tier 2 metrics)
Functional Dominant Fauna Integrity
invertebrate and vertebrate species lists along intertidal edge and high marsh, biofiltration capacity of bivalves
function, stressors

Tier 1 Example Percentage Loss of Emergent Tidal Marsh 1996‐2006Percentage Loss of Emergent Tidal Marsh 1996‐2006

Satellite Data – Kearney and Riter Tier 1 1993
Percent vegetation
2006
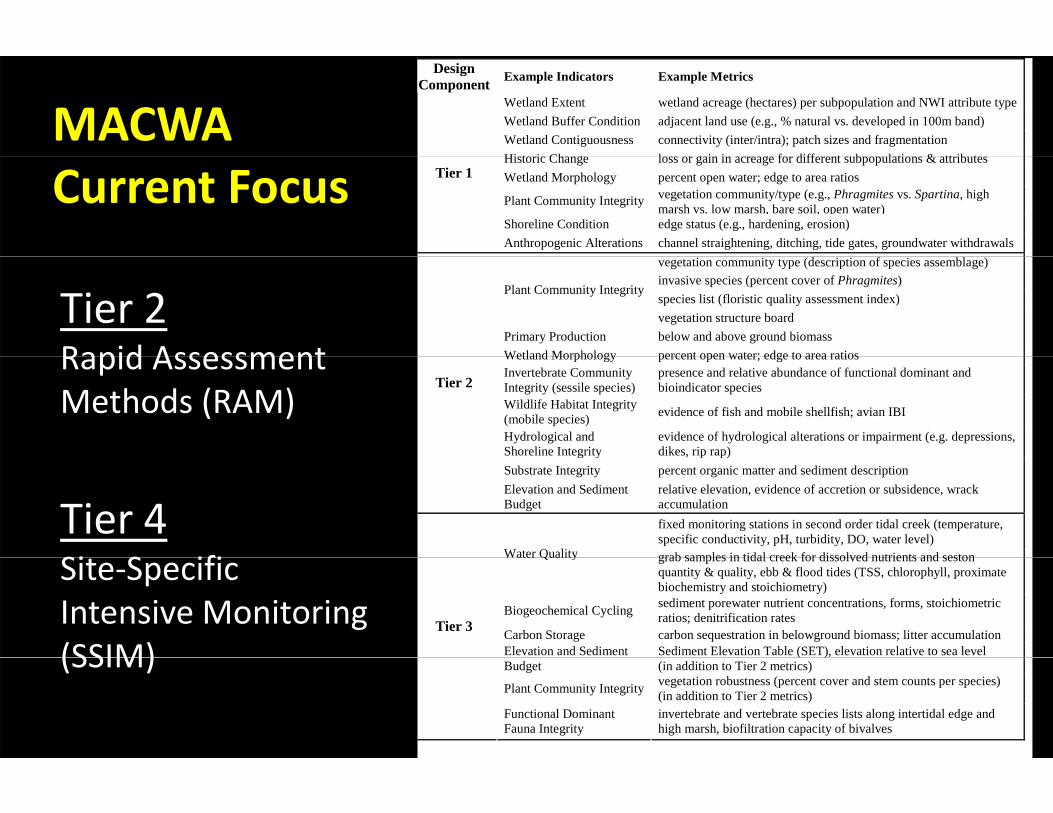
MACWADesign
Component Example Indicators Example Metrics
Wetland Extent wetland acreage (hectares) per subpopulation and NWI attribute type Wetland Buffer Condition adjacent land use (e.g., % natural vs. developed in 100m band) Wetland Contiguousness connectivity (inter/intra); patch sizes and fragmentation Hi t i Ch l i i f diff t b l ti & tt ib t
Current FocusHistoric Change loss or gain in acreage for different subpopulations & attributes Wetland Morphology percent open water; edge to area ratios
Plant Community Integrity vegetation community/type (e.g., Phragmites vs. Spartina, high marsh vs. low marsh, bare soil, open water)
Shoreline Condition edge status (e.g., hardening, erosion)
Tier 1
Anthropogenic Alterations channel straightening, ditching, tide gates, groundwater withdrawals vegetation community type (description of species assemblage) invasive species (percent cover of Phragmites) species list (floristic quality assessment index)
Plant Community Integrity
vegetation structure board Primary Production below and above ground biomass Wetland Morphology percent open water; edge to area ratios
Tier 2Rapid Assessment Wetland Morphology percent open water; edge to area ratios
Invertebrate Community Integrity (sessile species)
presence and relative abundance of functional dominant and bioindicator species
Wildlife Habitat Integrity (mobile species) evidence of fish and mobile shellfish; avian IBI
Hydrological and Shoreline Integrity
evidence of hydrological alterations or impairment (e.g. depressions, dikes, rip rap)
Tier 2 Rapid AssessmentMethods (RAM)
g y , p p)Substrate Integrity percent organic matter and sediment description Elevation and Sediment Budget
relative elevation, evidence of accretion or subsidence, wrack accumulation fixed monitoring stations in second order tidal creek (temperature, specific conductivity, pH, turbidity, DO, water level)
Water Quality grab samples in tidal creek for dissolved nutrients and seston
Tier 4Si S ifi
Water Quality grab samples in tidal creek for dissolved nutrients and seston quantity & quality, ebb & flood tides (TSS, chlorophyll, proximate biochemistry and stoichiometry)
Biogeochemical Cycling sediment porewater nutrient concentrations, forms, stoichiometric ratios; denitrification rates
Carbon Storage carbon sequestration in belowground biomass; litter accumulation Elevation and Sediment Sediment Elevation Table (SET), elevation relative to sea level
Tier 3
Site‐Specific Intensive Monitoring(SSIM) Budget
( )(in addition to Tier 2 metrics)
Plant Community Integrity vegetation robustness (percent cover and stem counts per species) (in addition to Tier 2 metrics)
Functional Dominant Fauna Integrity
invertebrate and vertebrate species lists along intertidal edge and high marsh, biofiltration capacity of bivalves
(SSIM)

MACWADelaware Est arEstuary
Barnegat Bayg y
DE Inland Bays
MD Coastal Bays
Others?Others?Other NJ Coastal

National Wetland Monitoring & A t W k GAssessment Work Group
NWMAWG
Mid Atlantic Wetland Work GroupMid-Atlantic Wetland Work GroupMAWWG
STAC Wetland Work GroupMACWAGMACWAG
• Focus on Tidal Marshes• Link to Adjacent Estuaries (Network)• Link to Adjacent Estuaries (Network)

MACWA Sites in the Delaware EstuaryEstuary
See later slide for updated fixed station locations

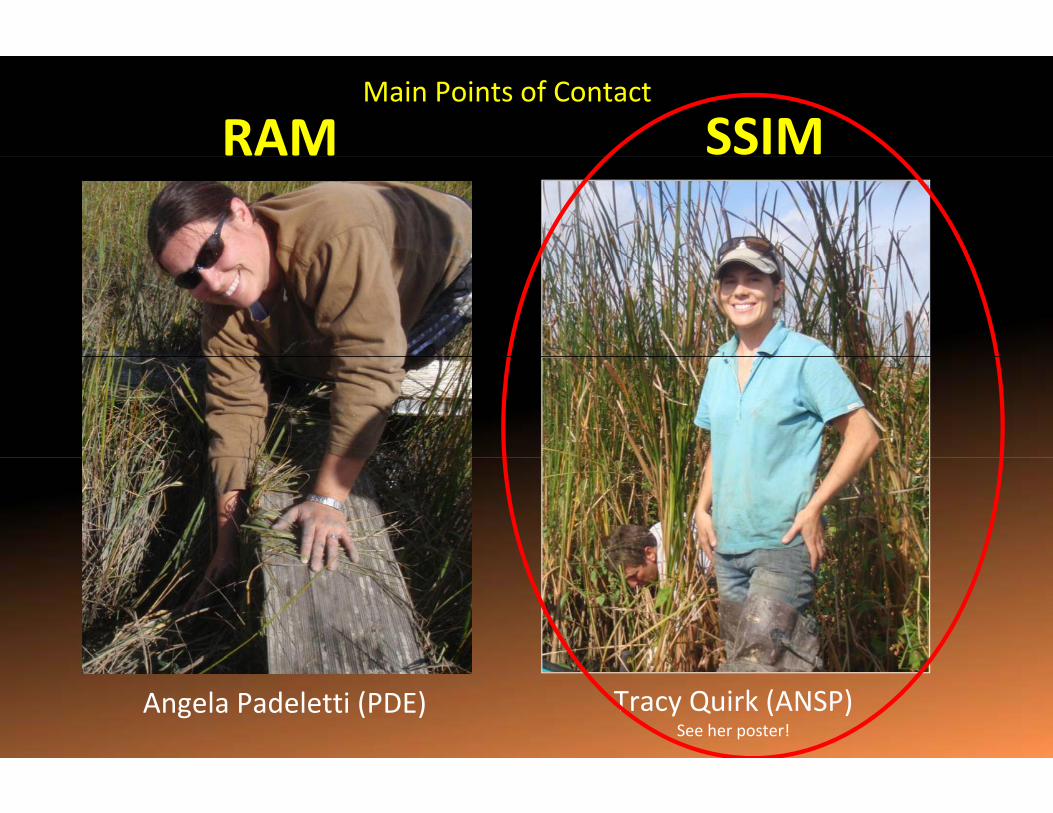
RAM SSIMMain Points of Contact
Angela Padeletti (PDE) Tracy Quirk (ANSP)See her poster!

RAM Attribute Metric Description
Buffer/Landscape Percent of AA Perimeter with 5m-
Buffer
Percent of AA perimeter that has at least 5m of natural or semi-natural condition land cover
Buffer/Landscape Average Buffer The average buffer width surrounding the AA
DE MidTRAM (Jacobs et al )
Buffer/Landscape Average Buffer Width
The average buffer width surrounding the AA that is in natural or semi-natural condition
Buffer/Landscape Surrounding
Development
Percent of developed land within 250m from the edge of the AA
Buffer/Landscape 250m Landscape Landscape condition within 250m surrounding (Jacobs et al.)
3 Attributes:
Condition
the AA based on the nativeness of vegetation, disturbance to substrate and extent of human
visitation
Buffer/Landscape Barriers to Landward Migration
Percent of landward perimeter of wetland within 250m that has physical barriers preventing
wetland migration inland3 Attributes: g
Hydrology Ditching & Draining
The presence of ditches in the AA
Hydrology Fill & Fragmentation
The presence of f ill or wetland fragmentation from anthropogenic sources in the AA
Hydrology Wetland Diking / The presence of dikes or other tidal f low• Buffer Integrity Hydrology Wetland Diking /
Tidal Restriction The presence of dikes or other tidal f low
restrictions
Hydrology Point Sources
The presence of localized sources of pollution
Habitat Bearing Capacity
Soil resistance using a slide hammer
g y
• Hydrologic IntegrityHabitat Vegetative
Obstruction
Visual obstruction by vegetation <1m measured with a cover board.
Habitat Number of Plant
Layers
Number of plant layers in the AA based on plant height
Habitat Percent Co Percent of co dominant invasive species in the
• Habitat/Bio Integrity
Habitat Percent Co-dominant Invasive
Species
Percent of co-dominant invasive species in the AA
Habitat Percent Invasive
Percent cover of invasive species in the AA

RAM Progressg• MidTRAM Training
QAPP• QAPP
• Tests Near SSIM Stations
All Tid l W l d i PA• All Tidal Wetlands in PA
• Broadkill Watershed, DE
2011:
• Maurice Watershed, NJ
• Christina Watershed, DE
2012:
• Barnegat Bay, NJ

PA Tidal Wetlands – Cumulative Distribution

PA Tidal Wetlands – Condition Summary
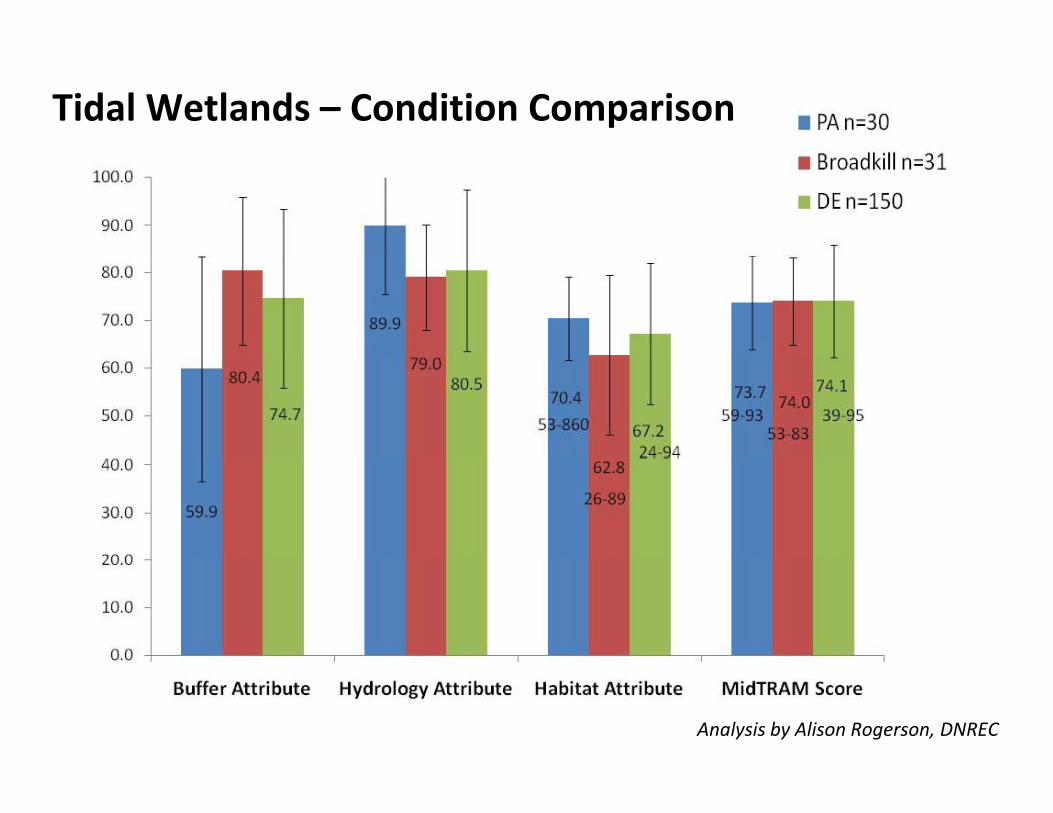
Tidal Wetlands – Condition Comparison
Analysis by Alison Rogerson, DNREC
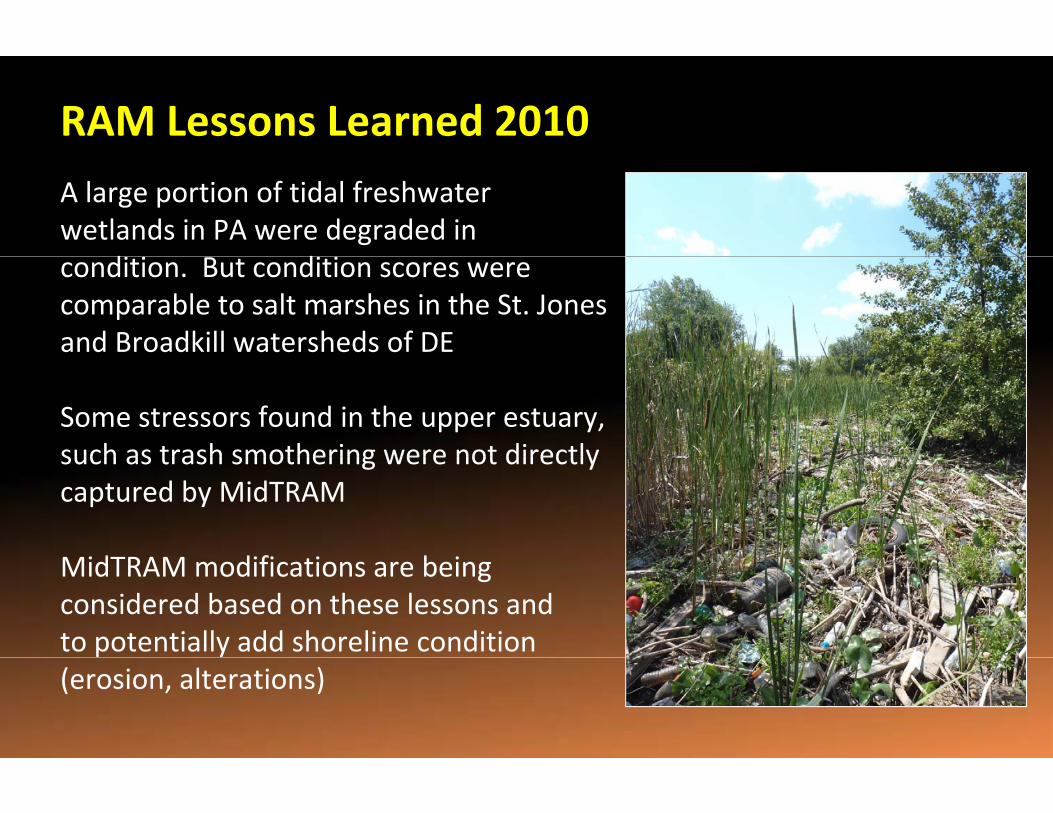
RAM Lessons Learned 2010A large portion of tidal freshwater wetlands in PA were degraded in
d dcondition. But condition scores were comparable to salt marshes in the St. Jones and Broadkill watersheds of DE
Some stressors found in the upper estuary, such as trash smothering were not directlysuch as trash smothering were not directly captured by MidTRAM
MidTRAM difi i b iMidTRAM modifications are being considered based on these lessons and to potentially add shoreline condition (erosion, alterations)

Future RAM Strategy(contingent on funding)
Delaware Estuary2009 20152009 – 2015+
Barnegat BayBarnegat Bay2012+
Delaware Inland Bayscompleted
RAM SSIMMain Points of Contact
Angela Padeletti (PDE) Tracy Quirk (ANSP)See her poster!

SSSIM Efforts
• Site Selection
• QAPP• Coordination‐ ANSP on phys/chem‐ NEPs on bio
• 2010‐ Baseline monitoring‐ SETs Installed
• 2011: Site Expansion‐Water Quality‐ SET Readings, Biological

Tier 4 Example MetricsWater Quality Elevation and Sediment BudgetBiogeochemical Cycling Plant Community IntegrityC b St F ti l D i t F I t it
p
Tier 4 Example Stations
Carbon Storage Functional Dominant Fauna Integrity
Station Location State Lead Entities Description
Tier 4 Example Stations
1 Tinicum NWR PA PADEP/ANSP Oligohaline, freshwater tidal marsh
2 Christina River DE DNREC/ PDE Mesohaline brackish tidal marsh2 Christina River DE DNREC/ PDE Mesohaline, brackish tidal marsh
3 St. Jones River DE DNREC Euryhaline, Spartina salt marsh
4 Maurice River NJ Rutgers Euryhaline, Spartina salt marsh
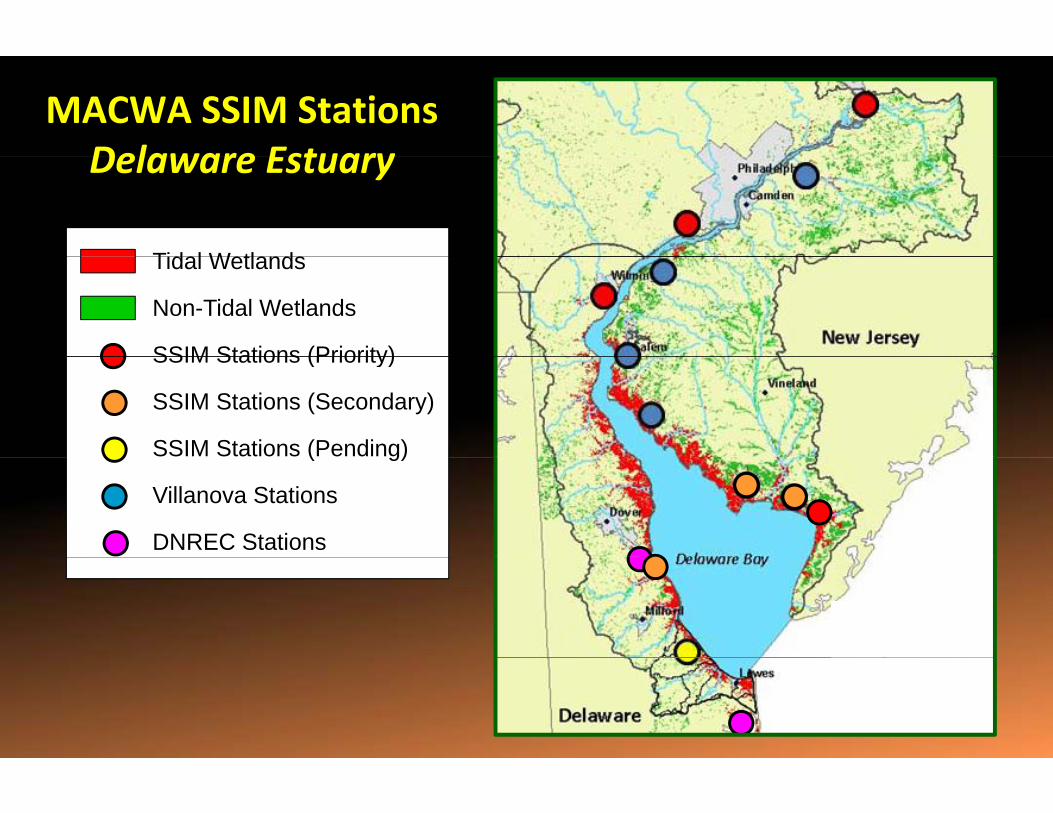
MACWA SSIM StationsDelaware EstuaryDelaware Estuary
Tid l W tl dTidal Wetlands
Non-Tidal Wetlands
SSIM Stations (Priority)SSIM Stations (Priority)
SSIM Stations (Secondary)
SSIM Stations (Pending)( g)
Villanova Stations
DNREC Stations
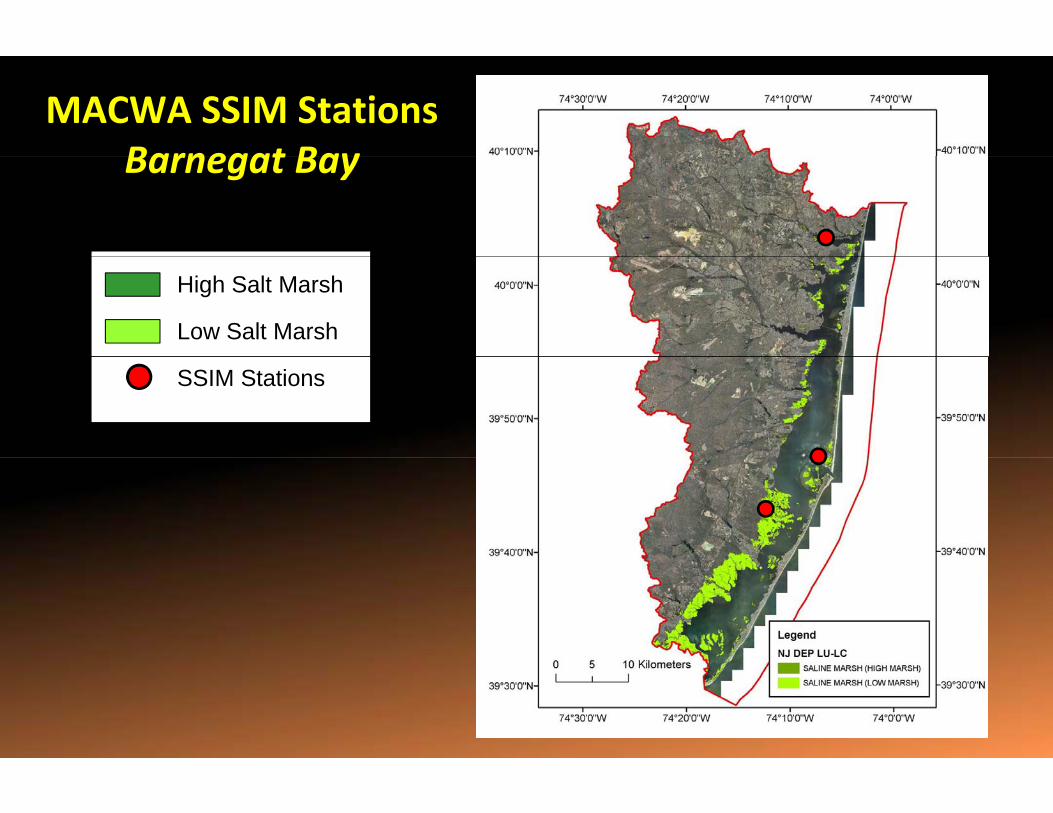
MACWA SSIM StationsBarnegat BayBarnegat Bay
High Salt Marsh
Low Salt Marsh
SSIM Stations
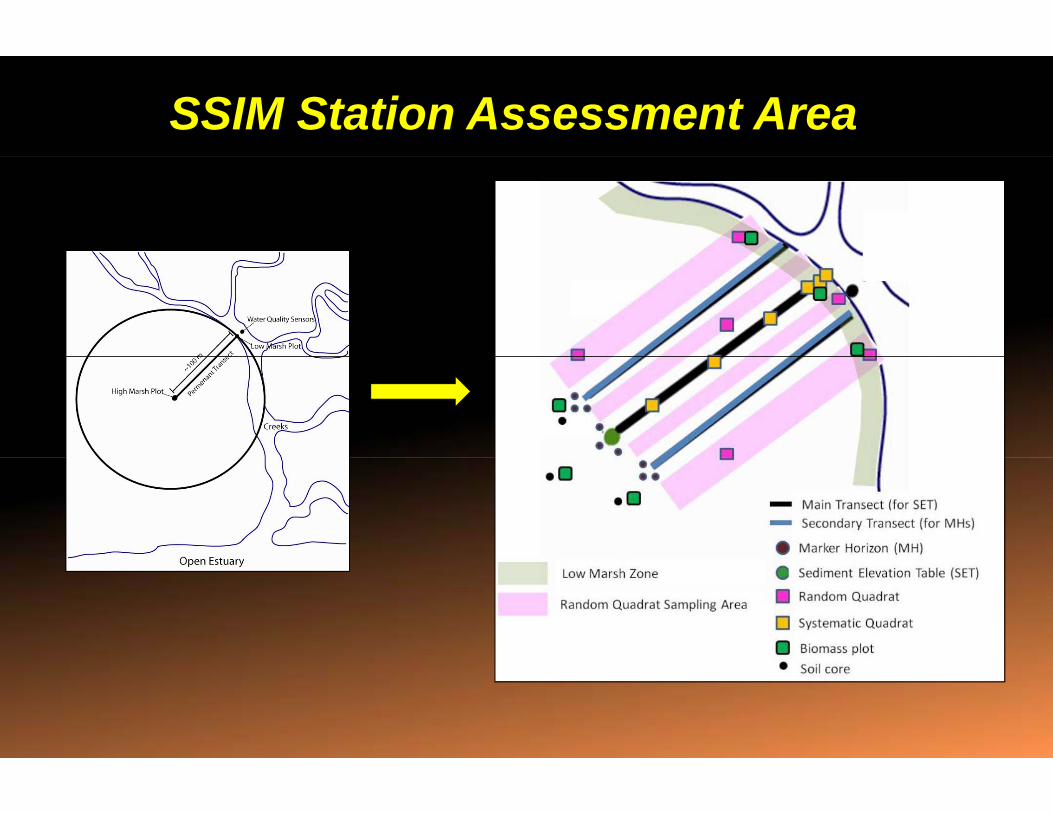
SSIM Station Assessment Area

MACWAMACWAOne size fits all?
No: include both “Core” and “Supplemental” i f b h RAM d i i imetrics for both RAM and station monitoring
‐ Compare only core metrics for climate and other sub‐regionalmonitoring needs
‐ Use core + supplemental metrics for local or watershed specific needs

Barnegat Bay – Parkertown SET Installation

Barnegat Bay – Parkertown Elevation and Vegetation Survey
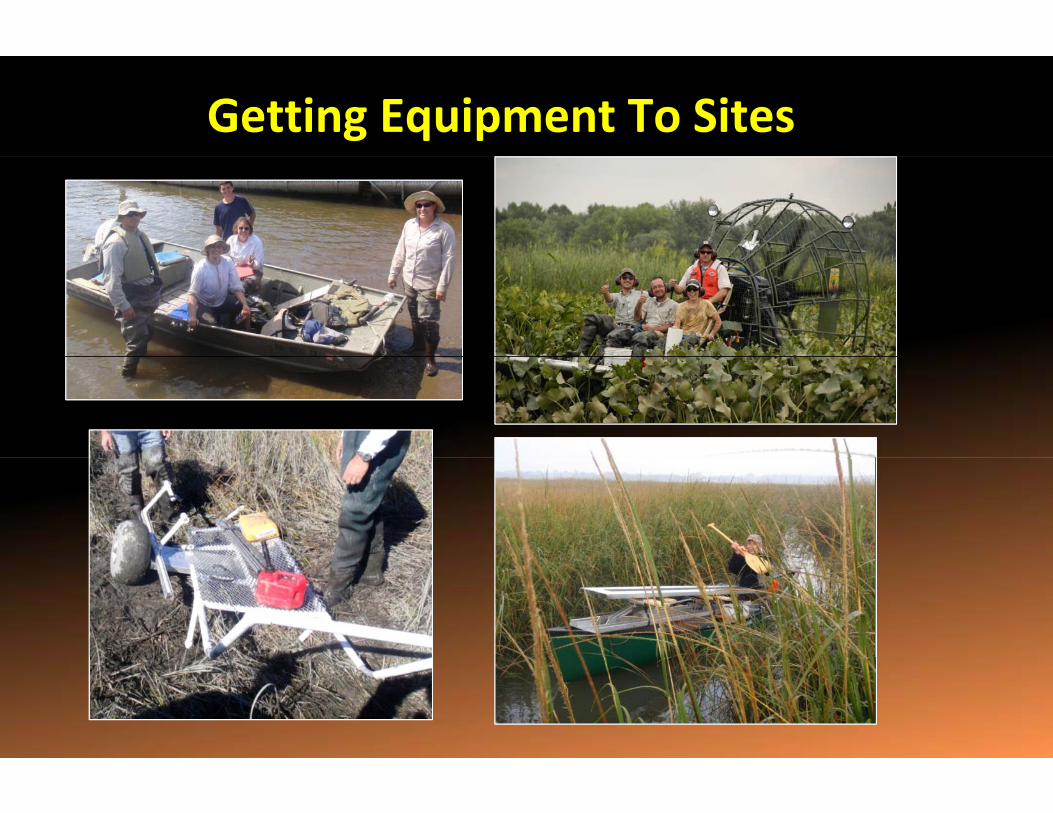
Getting Equipment To Sites

MACWA Partners (so far)C a t e s (so fa )
Academy of Natural SciencesBarnegat Bay Estuary ProgramDNRECEPA HQ, Regions2 and 3NJDEP + NJ Coast Zone ProgramPADEPPDE (Coordinator)Rutgers UniversityVillanova UniversityWetland Associates

Summary• Coastal wetlands are a hallmark feature of the
Delaware Estuary and coastal mid‐Atlantic
• They provide diverse critical goods and services that sustain lives and livelihoods
• They are extremely vulnerable to combined watershed and climate stressors
• Improved efforts to monitor wetland status and trends will assist in managing and sustaining them into the futurethem into the future
• Regional coordination strengthens scientific outcomes, improves management andoutcomes, improves management and leverages more diverse funding
We Thank the Many People Who Have Assisted in We Thank the Many People Who Have Assisted in y py pWorkshops, Workgroups and in the FieldWorkshops, Workgroups and in the Field
And We Are Grateful to Our Funders:And We Are Grateful to Our Funders:
EPA HeadquartersEPA Region 2EPA National Estuary ProgramDE Dept. of Natural Resources Environ. ControlNJ Coastal Management ProgramPA Coastal Management Program

Wetland Benefits (Ecosystem Services)
Millenium Ecosystem Assessment 1º Service 2º Service 3º Service 4º Service
ProvisioningFood
Fisheries Support
Algae and invertebrate productionG ti M t i l Ph it t l h
LivelihoodsProvisioning Genetic Materials Phragmites control research
Biochemical Products Research in Antifungal AgentsFiber and Fuel Cellulose stock
Sequestration Carbon Carbon Caps,
mitigationMeet TMDLs for
Health
Health
Regulating
Sediment Stabilization Erosion controlMeet TMDLs for
sedimentStorm Protection/ Wave Attenuation/
Flood ProtectionProtect Property Values and
infrastructure
Gas Regulation Carbon SequestrationOxygen production
Lives
Water Quality Sequestration, Filtering TMDLs: Nutrients, Pollutants
Cultural/ Spiritual
Recreation Bird watching, hunting, boatingSpiritual and Inspirational Native American Uses
University reasearch & school
Health
HealthHuman Well Being Educational projects/trips
Aesthetic ValueLandscape pictures, paintings,
open spaceHabitat Wildlife, shellfish, insects
Biodiversity Maintain Plant CommunitiesProduction Primary ProductionSupporting Production Primary Production
Water Cycling/Hydrologic RegimeNutrient Cycling/Biogeochemical
ProcessesMaintain trophic cycles, soil
building
Health