Embed Size (px)
Citation preview
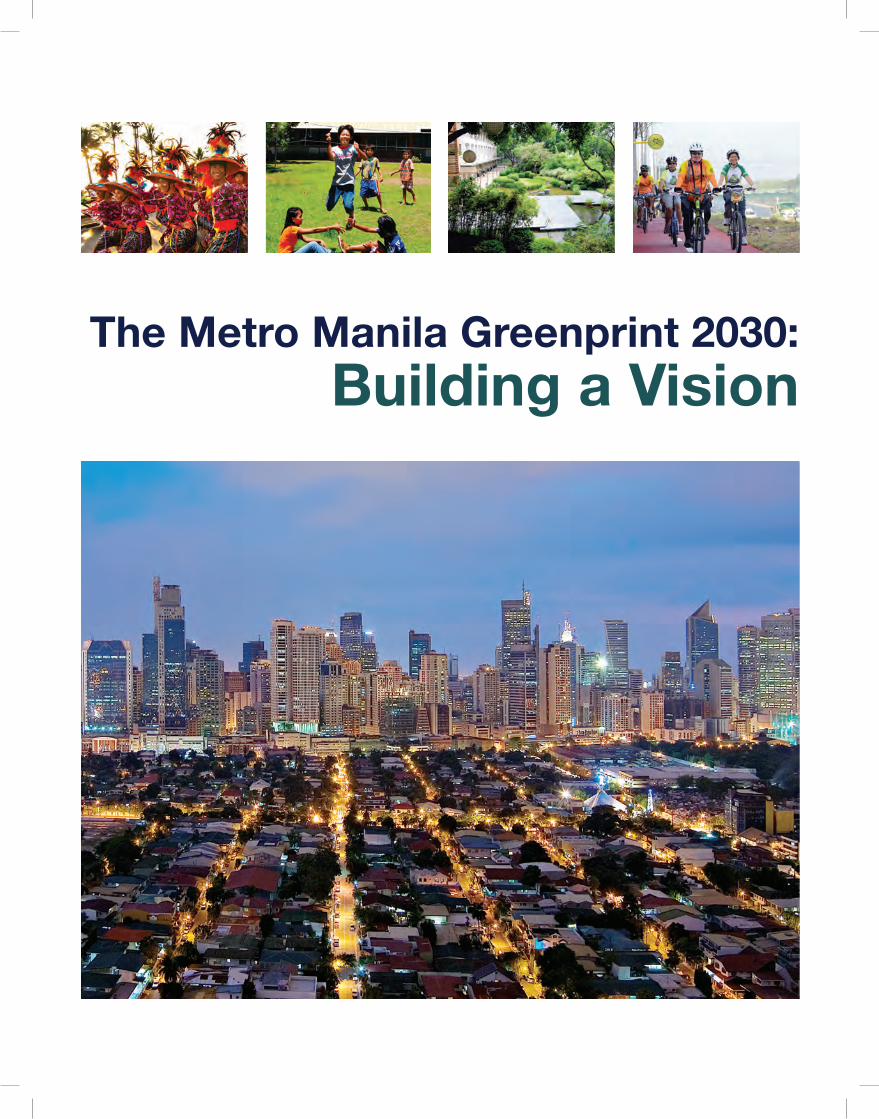
The Metro Manila Greenprint 2030:Building a Vision

The Metro Manila Greenprint 2030:Building a Vision

The findings, interpretations, and conclusions expressed in this work are those of the writers and do not necessarily reflect the views of the World Bank. The information in this work is not intended to serve as legal advice. The World Bank does not guarantee the accuracy of the data included in this work and accepts no responsibility for any consequences of the use of such data.
This report may be reproduced in full or in part for non-profit purposes without prior permission provided proper credit is given to the publisher, the Metropolitan Manila Development Authority.
This report has been prepared by the Metropolitan Manila Development Authority in collaboration with World Bank Country Sector Coordinator Yan Zhang and consultants Douglas Webster, Andrew Gulbrandson, Art Corpuz, Amit Prothi, and Julia Nebrija under the strategic guidance of the MMDA Chairman Francis N. Tolentino.
The team wishes to thank the members from national agencies, local government units, civil society, private sector organizations, and the academe who participated in the learning events, workshops, and consultations that were conducted during the Phase 1 process.
This report is sponsored by the Australian Agency for International Development (AusAID) with additional support from The Cities Alliance.
Acknowledgments
Disclaimer
The Metro Manila Greenprint 2030: Building a Vision
v
Table of Contents
Foreword ......................................................................................................................................iv
Section One : Creating the Greenprint What is the Greenprint? .....................................................................................................................2
Why prepare a Greenprint? ................................................................................................................3How do we create the Greenprint? .....................................................................................................5The Vision ...........................................................................................................................................6
Section Two: Achieving the Vision
Fostering a Metropolis of Opportunity
1. Leveraging Opportunities in Business, Knowledge, and Information .....................................13 Technology and Processing Outsourcing
2. Unleashing Metro Manila’s Tourism Potential and Attracting Newly Rich Neighbors ...........193. Reclaiming High-Value Services and Promoting High-Potential Economic Cluster ..............25
Building a Green Connected, and Resilient Metropolis for All
4. Connecting Metro Manila ...........................................................................................................335. Making Metro Manila Inclusive ..................................................................................................426. Developing a Resilient Metropolis ..............................................................................................47
Section Three: Key Synergies7. Key Synergies ...................................................................................................................................548. Moving Forward ..............................................................................................................................56
Section Four: Background Documentation 9. Phase I Process ..............................................................................................................................5810. Sources ...........................................................................................................................................65

The Metro Manila Greenprint 2030: Building a Vision
vi
The Metro Manila Greenprint 2030 is a timely initiative. The country's economy continues to trend upwards and our cities continue to receive new investments in major infrastructure and industries. Now is the time to plan how we will move forward, and to leverage these investments for positive gains. As we live through the daily challenges, and strive to create a different story for ourselves and our cities, it is also the time to envision the Metro Manila that we want, and set a roadmap on how to achieve that vision.
In 2011, President Benigno Aquino instructed the Regional Development Council in the National Capital Region (RDC-NCR) to craft a long term plan for Metro and Mega Manila. In response, under the leadership of the Metropolitan Manila Development Authority (MMDA), the RDC-NCR has spearheaded a strategic planning process called the Metro Manila Greenprint 2030, which seeks to address the challenges that impede development of the metropolis and make our cities more competitive, resilient, and inclusive in the coming decades.
Foreword
iv

The Metro Manila Greenprint 2030: Building a Vision
vii
What is the Metro Manila of 2030?
• The Metro Manila of 2030 is an economic powerhouse in East Asia: where good policies and investments help us stay economically competitive; where we continue to develop livelihood opportunities for a growing population; and where we can find decent work at home that allows us to utilize our talents and skills to the best of our abilities.
• In the Metro Manila of 2030, we can move safely, affordably, and comfortably between our homes and places of work, education and play, allowing us more time to spend with the ones we love, avoid delays in our day-to-day lives, increase economic productivity, and even explore new places within our cities.
• The Metro Manila of 2030 is a green metropolis; it uses resources more efficiently and provides a livable urban environment for its citizens. Better connectivity and mobility help us use less energy and generate less pollution.
• In the Metro Manila of 2030, we can afford a decent home for our families and access basic services; there will be more public space where we can play, exercise, and relax; where areas of interest, and places of history, culture, and heritage are fostered.
• In the Metro Manila of 2030, our lives, properties, and livelihoods are protected from disasters; we are better prepared to meet the challenges related to climate change; and our infrastructure continues to serve the public, even in the face of adversity.
• Most importantly, Metro Manila of 2030 is a unified metropolis, without borders. Even though the region is made up of many localities, our lives are not limited to any one place; we live, work, study and play in numerous places which make up our metropolis.
We do not have to wait until 2030 to see the vision become a reality, the process has already begun. I am pleased to present this first step towards the Metro Manila of the future, the home where we all enjoy a better quality of life.
Francis n. TolenTinoChairman, The Metropolitan Manila Development Authority
v

The Metro Manila Greenprint 2030: Building a Vision
viii
List of Acronyms aDB Asian Development Bankasean Association of Southeast Asian NationsaUV Asian Utility Vehicle BiD Business Improvement DistrictBPaP Business Processing Association of the PhilippinesBPo Business Process OutsourcingBrT Bus Rapid TransitcaGr Compound Annual Growth RatecalaBarZon Cavite, Laguna, Batangas, Rizal, QuezoncBD Central Business DistrictclUP Comprehensive Land Use PlanscnG Compressed Natural GascoDi Community Organizations Development Institute Dole Department of Labor and EmploymentDoTc Department of Transportation and CommunicationeVaP Electric Vehicle Association of the PhilippinesFar Floor to Area RadioGDP Gross Domestic ProductHlUrB Housing and Land Use Regulatory BoardicT Information and Communications Technologyilo International Labor Organizationsirri International Rice Research Institute iTo Information Technology Outsourcing Jica Japan International Cooperation AgencyKPo Knowledge Processing OutsourcinglGU Local Government UnitlrT Light Rail TransitMice Meetings, Incentives, Conferencing, and ExhibitionsMMDa Metropolitan Manila Development AuthorityMnc Multinational CorporationMrT Metro Rail TransitMVPMaP Motor Vehicle Parts Manufacturers Association of the Philippinesncr National Capital RegionneDa National Economic Development AuthoritynGo Non-Government OrganizationnleX North Luzon ExpresswayoFW Overseas Filipino WorkerPeZa Philippine Economic Zone Authority Pnr Philippine National RailwaysHDa Subdivision and Housing Developers Association sleX South Luzon ExpresswayTesDa Technical Education and Skills Development AuthorityToD Transit Oriented DevelopmentUnesco United Nations Educational, Scientific and Cultural Organization UsD United States Dollar
vi

The Metro Manila Greenprint 2030: Building a Vision
1
SeCTiononeCreating the Greenprint
The Metro Manila Greenprint 2030: Building a Vision
2
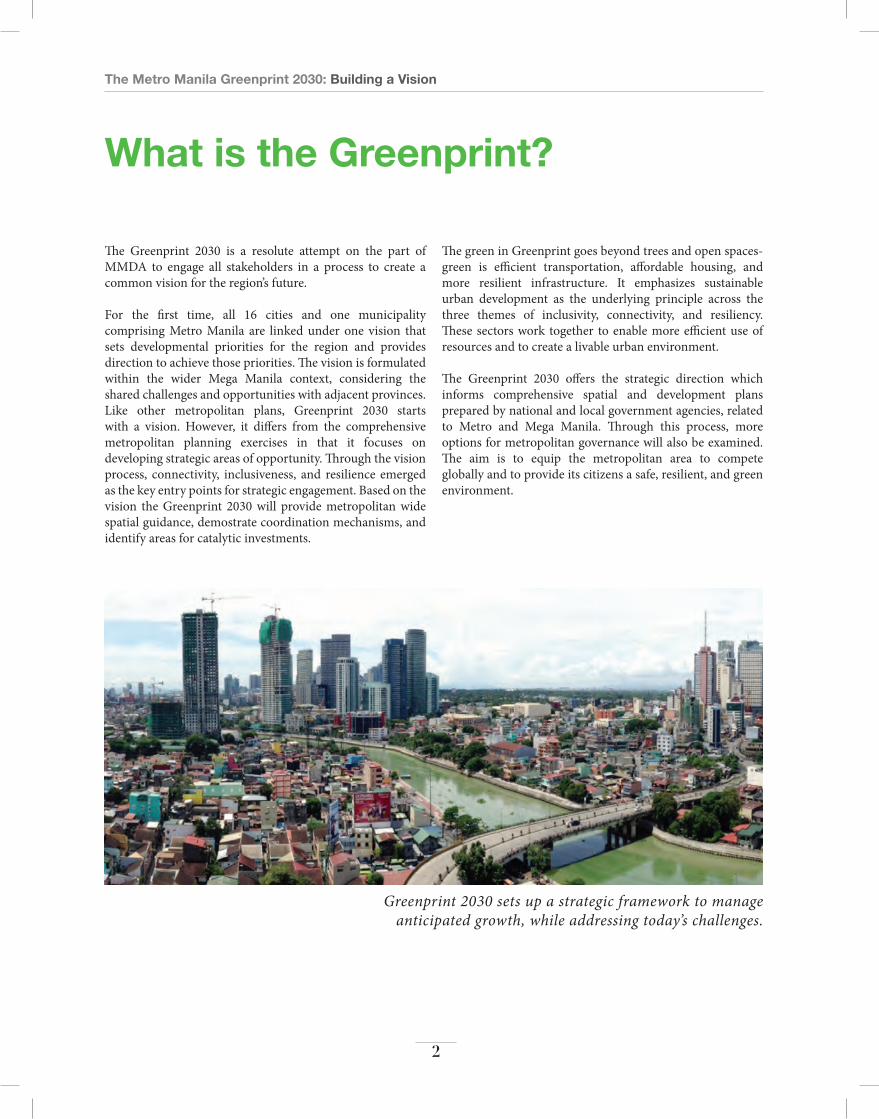
The green in Greenprint goes beyond trees and open spaces- green is efficient transportation, affordable housing, and more resilient infrastructure. It emphasizes sustainable urban development as the underlying principle across the three themes of inclusivity, connectivity, and resiliency. These sectors work together to enable more efficient use of resources and to create a livable urban environment.
The Greenprint 2030 offers the strategic direction which informs comprehensive spatial and development plans prepared by national and local government agencies, related to Metro and Mega Manila. Through this process, more options for metropolitan governance will also be examined. The aim is to equip the metropolitan area to compete globally and to provide its citizens a safe, resilient, and green environment.
Greenprint 2030 sets up a strategic framework to manage anticipated growth, while addressing today’s challenges.
What is the Greenprint?
The Greenprint 2030 is a resolute attempt on the part of MMDA to engage all stakeholders in a process to create a common vision for the region’s future.
For the first time, all 16 cities and one municipality comprising Metro Manila are linked under one vision that sets developmental priorities for the region and provides direction to achieve those priorities. The vision is formulated within the wider Mega Manila context, considering the shared challenges and opportunities with adjacent provinces. Like other metropolitan plans, Greenprint 2030 starts with a vision. However, it differs from the comprehensive metropolitan planning exercises in that it focuses on developing strategic areas of opportunity. Through the vision process, connectivity, inclusiveness, and resilience emerged as the key entry points for strategic engagement. Based on the vision the Greenprint 2030 will provide metropolitan wide spatial guidance, demostrate coordination mechanisms, and identify areas for catalytic investments.

The Metro Manila Greenprint 2030: Building a Vision
3
A strategic plan provides an impetus to address challenges that have a region-wide impact. Today, the region has a fragmented governance structure consisting of 17 different local government units and surrounding provinces that are independently managed. This institutional set up has often led to conflicting development agendas among LGUs and made the task of tackling issues, such as flooding, informal settlements, and traffic congestion, that have a regional dimension more difficult in Metro Manila.
Home to around 12 million people, Metro Manila ranks 15th among the largest global urban agglomerations. Together with its neighboring areas, in what is coined as Mega Manila, it accounts for 30 percent of the country's population and 50 percent of economic output, while occupying less than 4 percent of the national territory. When Metro Manila thrives, so does the country.
Metro Manila is still growing, in particular its suburbs and some neighboring provinces like Cavite and Laguna. If current population growth trends continue, Metro Manila will have a population of 14.1 million by 2020 and 16.9 million by 2030. At the same time, the surrounding provinces that comprise the rest of Mega Manila will see population grow to 23.1 million in 2020 and 30.8 million by 2030, at which point Mega Manila as a whole could have as many as 47 million people.
Much of the population growth in Mega Manila is driven by the availability of good economic opportunities and employment not available elsewhere in the country. With an ample supply of young and English-speaking workforce, Metro Manila has become the destination of the business process outsourcing industry, leading the way for the country to become one of the global leaders in the information technology-business process outsourcing (IT-BPO) services delivery. Over half of the Philippines’ manufacturing (by output) is located in Mega Manila along with more than two-thirds of its business and financial services industry.
With its size and density, Metro Manila possesses considerable economic potential and human talent that, if managed well, can pose enormous economic gains and allow higher standards of living for its citizens. Global experience
Why prepare a Greenprint?
has shown that metropolitan economies, not national or municipal economies, are the front-line competitive units in the global economy. This is true in the Philippines as well, and requires that policy makers acknowledge the importance of addressing some of the most pressing urban problems at the metropolitan scale. To continue being the primary engine of growth for the Philippines, both Metro Manila and the surrounding areas need to perform better.
While Metro Manila led in competitiveness five decades earlier, it now lags behind many other Asian cities in terms of providing high quality products and business services, as well as superior infrastructure and basic services for its firms and citizens. Amongst other challenges, the metropolis has witnessed environmental degradation, traffic congestion, and proliferation of informal settlements. Low coverage of waste water treatment, deteriorating transport, and traffic and inadequate housing conditions are some of the challenges that continue to affect the quality of life of the urban residents and undermine productivity and mobility.
Furthermore, the region is vulnerable to natural disasters, as was witnessed during the onset of typhoons Ondoy and Pepeng in 2009. Aside from being proximate to an active fault, it is subject to intense flooding and landslides, where the high concentration of population and assets in Metro Manila face an increased risk from natural hazards and climate change impacts.
To realize economic gains to their fullest potential and provide a higher quality of life for its residents, Metro and Mega Manila must change how it plans, where individual governing units need to rise above their own scope, and think of Metro and Mega Manila as a collective region. Metro Manila has the potential to be a more inclusive, connected, and resilient metropolis; the Greenprint 2030 offers a roadmap for reaching this potential.
When Metro Manila thrives, so does the country.
The Metro Manila Greenprint 2030: Building a Vision
4
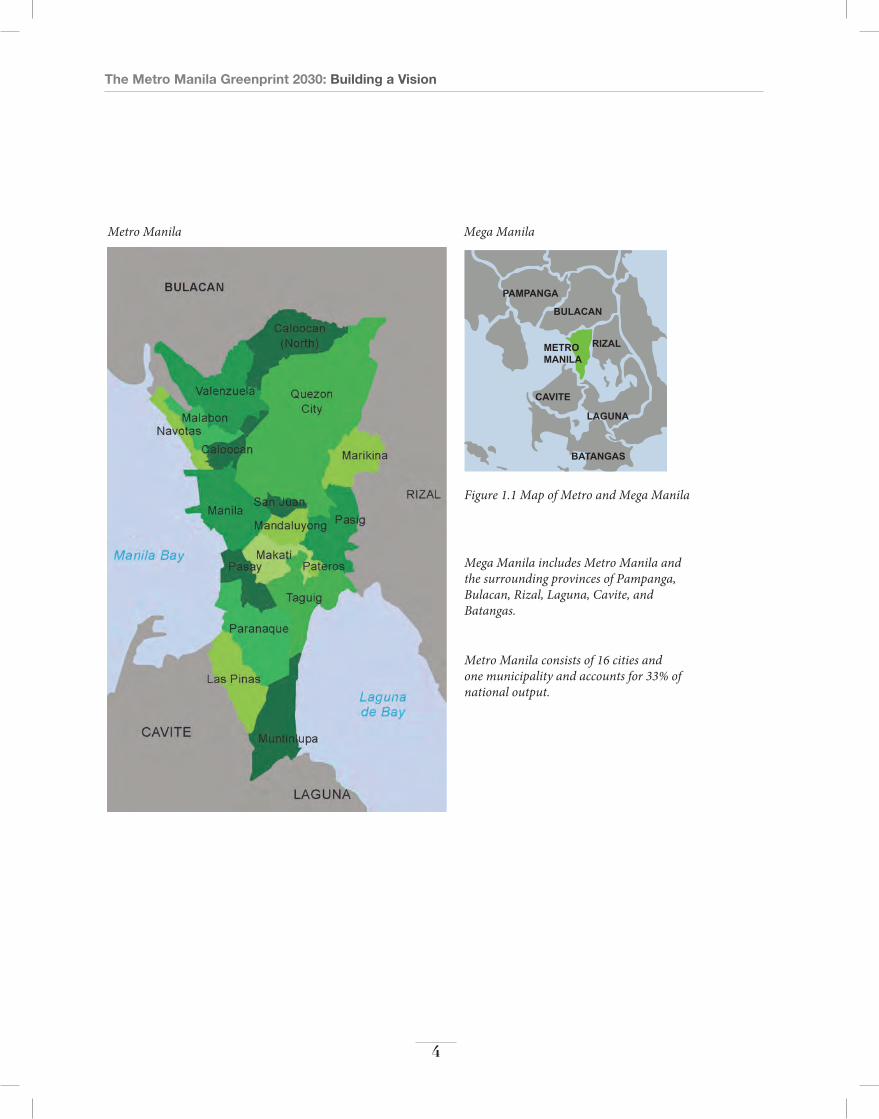
Mega Manila includes Metro Manila and the surrounding provinces of Pampanga, Bulacan, Rizal, Laguna, Cavite, and Batangas.
Metro Manila consists of 16 cities and one municipality and accounts for 33% of national output.
Figure 1.1 Map of Metro and Mega Manila
Mega Manila Metro Manila

The Metro Manila Greenprint 2030: Building a Vision
5
How do we create the Greenprint?
The Greenprint 2030 brings together stakeholders across all sectors to deliberate Metro Manila's many challenges and discuss avenues for moving forward.
Greenprint 2030 is being prepared in two phases:
Phase 1 produced a vision for Metro Manila through a process of stakeholder engagements, knowledge sharing, and consultations. Between March 2012 and February 2013, Metro Manila Mayors, national government agencies, the private sector, civil society organizations (CSO), urban planning professionals, and members of the academia were engaged to provide insight and support for this cross-sectoral initiative. The process is important as it promotes coordination amongst various stakeholders, and espouses shared ownership beyond the MMDA. Part of the process entails establishing multiple avenues of communication and linkages, allowing stakeholders to voice their opinion, share knowledge and resources, contribute ideas, and stay abreast with all developments and milestones.
Phase 2 of the Greenprint 2030, which began in October 2013, will embark on a process to formulate a spatial strategy to realize the vision of Metro Manila formulated during Phase 1. The plan will build upon the Metro Manila Vision, formulated during Phase 1, and provide a strategic framework to direct the future growth of Metro Manila. The process of preparing the strategic plan under Phase 2 will be similar to the process of engagement undertaken in Phase 1.

The Metro Manila Greenprint 2030: Building a Vision
6
Metro Manila for all;
Green, connected, resilient;
offering talent and opportunity;
Processing knowledge and
delivering services at home and abroad.
Vision Statement

The Metro Manila Greenprint 2030: Building a Vision
7
Metro Manila for all;Green, connected, resilient;
Offering talent and opportunity; Processing knowledge and
delivering services at home and abroad.
leveraging opportunities for iT-BPo
• Move up the value chain and increase global market share
• Enhance human resource development• Create world-class urban environments
Unleashing Tourism Potential and attracting newly rich neighbors
• Create a variety of activities and destinations to explore
• Assure visitors of their personal safety• Build high quality infrastructure and ensure high
levels of convenience
reclaiming High-Value services and Promoting High-Potential economic clusters
• Identify and focus on potential areas of comparative and competitive advantage
• Ensure the availability of well-trained, specialized workers for key industries
• Promote economic sectors with high potential for new job creation
connecting Metro Manila
• Focus development around new and existing urban and peri-urban nodes
• Connect nodes via an efficient, sale and reliable multi-modal transport system
Making Metro Manila inclusive
• Ensure that urban and peri-urban nodes are inclusive• Unlock huge land value through in-situ relocation
and catalytic infrastructure development• Upgrade informal settlements city-wide
Developing a resilient Metropolis
• Promote better understanding of disaster risks and their impacts on sustainability and competitiveness
• Accelerate investment in disaster risk reduction programs
• Engage community level participation in adaptation and mitigation efforts
• Implement risk-sensitive land use guidelines• encourage private sector cooperation to prevent
future enroachment
Fostering a Metropolis of Opportunity Building a Green, Connected, and Resilient Metropolis for All

The Metro Manila Greenprint 2030: Building a Vision
8
The vision will be achieved through a two-pronged approach which divides goals into strategic areas. The first strategic area identifies major economic opportunities that could improve livelihoods in Metro and Mega Manila. The second strategic area focuses on physical interventions that will attract and sustain competitive industries and talent by making Metro Manila an inclusive, connected, and resilient metropolis. These strategic areas complement and reinforce each other. Together, they are the foundation for the spatial strategies that will be developed in Phase 2.
The goals in each area are supported by principles established through best global practices, as well as opportunities where the principles can be applied in Metro and Mega Manila. The two strategic areas are discussed in Section Two.
Achieving the Vision
strategic area one: Fostering a metropolis of opportunity
Metro Manila enjoys emerging global competitiveness in three key areas: information technology and business processing outsourcing (IT-BPO), regional tourism, and high-value service industries. These three areas performed exceptionally well in the past few years (2009-2011) and contributed substantially to Metro Manila’s economic growth, which in turn accounted for one-third of the nation’s economy. Achieving the vision will require leveraging opportunities in these key areas to provide continued employment for residents and sustained growth for businesses.
strategic area Two: Building a green, connected, and resilient metropolis for all
The second thematic area focuses on large-scale city-building, particularly in creating a green, connected, and resilient metropolis for all. Under-investment in Metro Manila for decades represents an enormous opportunity both to significantly improve the lives of residents, and also to trigger an economic boom through large-scale city building, such as what Shanghai, Singapore, Seoul, and Bangkok have done over the last several decades. Targeted large-scale investments can go a long way to enhance the region's competiveness, improve mobility and accessibility, create a greener metropolis, provide affordable and accessible housing options for all socio-economic classes, and improve resilience to natural disasters.

The Metro Manila Greenprint 2030: Building a Vision
9
SeCTiontwoAchieving the Vision
• Fostering a Metropolis of Opportunity• Building a Green, Connected, and Resilient Metropolis for All

The Metro Manila Greenprint 2030: Building a Vision
10
The Metro Manila Greenprint 2030: Building a Vision
11
Fostering a Metropolis of Opportunity

The Metro Manila Greenprint 2030: Building a Vision
12
By 2030, Metro Manila's economy will emerge as an economic powerhouse on the back of three economic sectors that have shown great promise for growth in recent years: information technology and business processing outsourcing (IT-BPO), regional tourism, and high-value service industries. Through leveraging these three key sectors, the region can create substantial new job opportunities by 2030 for residents across all levels of income, educational, and experiential backgrounds. Selective manufacturing clusters in the peri-urban region will also play a prominent role in Mega Manila's revival.
1: leveraging opportunities for iT-BPo
• Move up the value chain and increase global market share
• Enhance human resource development• Create world-class urban environments
Achieving the Vision
2: Harnessing Tourism Potential and attracting the newly rich
• Create a variety of activities and destinations to explore• Assure visitors of their personal safety• Build high-quality infrastructure and ensure high levels
of convenience
3: reclaiming High-Value services and Promoting High-Potential economic clusters
• Identify and focus on potential areas of comparative advantage
• Ensure the availability of well-trained, specialized workers for key industries
• Promote economic sectors with high potential for new job creation
The Metro Manila Greenprint 2030: Building a Vision
13
1. Leveraging Opportunities in Information Technology and Business Processing Outsourcing
Goal
Be a global center for knowledge processing, through continuous wide scale upgrading of human resources and the provision of global leading urban environments and infrastructure for information technology and business processing outsourcing (IT-BPO) activities, the combination of which will position Metro Manila to provide world-class services at home and abroad.
Background
Metro Manila and parts of Mega Manila enjoy an undisputed global competitive advantage in terms of the IT-BPO services cluster. Information technology (IT) enabled services and business processing outsourcing (BPO) are broadly defined including voice and non-voice BPO, knowledge process outsourcing (KPO), legal process outsourcing (LPO), government process outsourcing (GPO), and other information and communications technology (ICT) related services.
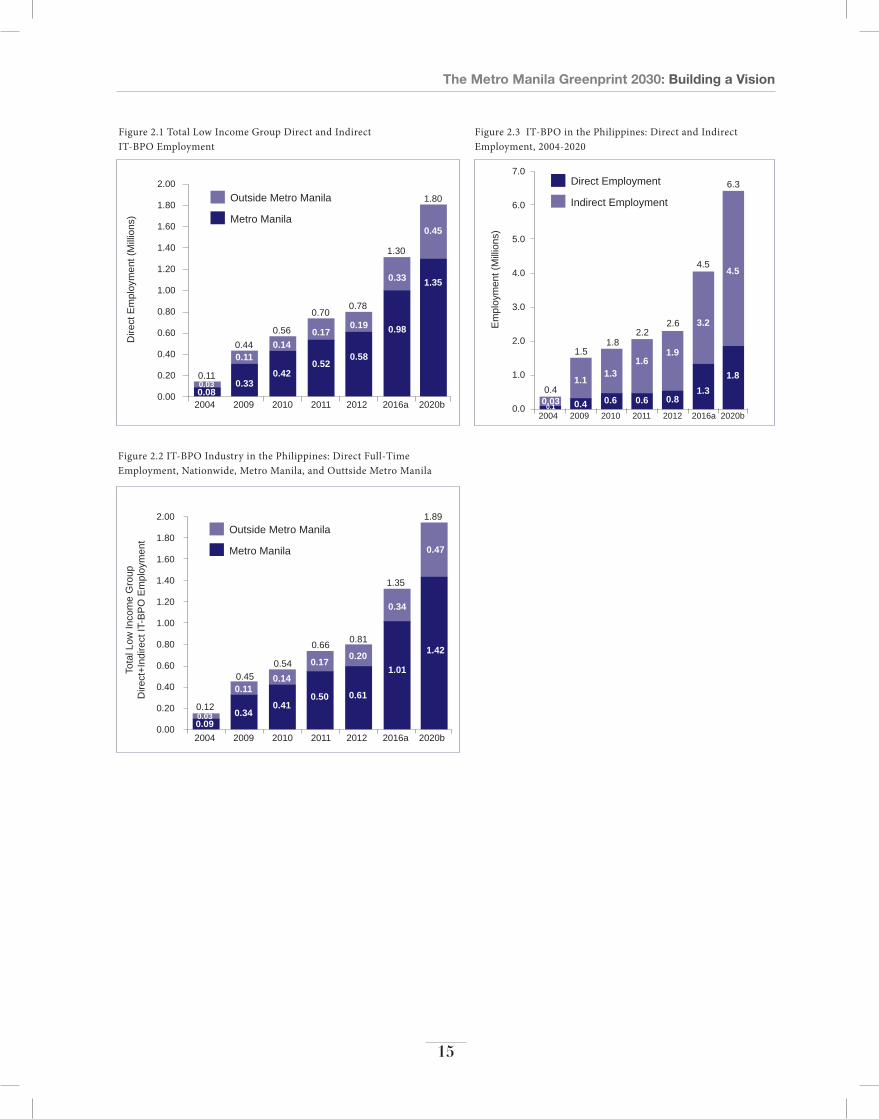
In 2013, Metro Manila had more people employed in the BPO industry than any other city in the world and accounted for 10% of its labor force. The Philippines overtook India in 2011 to become the number one provider of voice-based outsourcing services in the world (by value) and is ranked second globally in non-voiced based outsourcing activities in terms of employment and revenue earnings. The IT-BPO export industry has been a source of new wealth, income, and employment in the Philippines. The IT-BPO sector has a multiplier effect of about 2.5, meaning that for every direct job created in the industry, 2.5 more indirect jobs will be created in supporting service industries. A significant number of these jobs, about 0.8 million in 2012, are employing people in low income groups (Figure 2-1).
The industry is primarily located in Metro Manila (Figure 2-2). The dominance of Metro Manila in IT-BPO industry can be attributed to the concentrated pool of human talent, local and international industry, government, and international communications in the country. As of 2012, this area accounted for 75 percent of all employment and more than 82 percent of total revenues of IT-BPO growth in the Philippines.
This industry cluster has significant potential to continue to boost the economy and provide employment at scale (Figure 2-3). With continued strong support from both the public and private sectors, the IT-BPO industry could generate USD25 billion in revenue and account for as much as 8.6 percent of the country's GDP by 2016.

The Metro Manila Greenprint 2030: Building a Vision
14
Principles
P1. emphasize the importance of Moving up the Value chain and increasing Global Market share
• Multi-national Companies (MNCs) currently dominate the IT-BPO landscape. These firms will continue to grow and create employment. Harness their potential to the fullest extent.
• Through partnerships between the public and private sectors, promote the competitiveness of local firms within the global marketplace. Emphasize the development and capturing of higher-margin activities such as BPO involving analytics, healthcare services, human resources, and financial services.
• Strengthen domestic IT-BPO small and medium enterprises (SME) by improving access to markets and finance, reducing operation costs, and streamlining government procedures.
• Build on existing institutional strengths across the region.
P2. enhance iT-BPo Human resource Development through Public-Private Partnerships (PPP)
• Well-qualified human resources are instrumental to the sustenance and expansion of this economic pillar. Through PPP, establish large-scale training programs for voice outsourcing and BPO personnel.
• Create specialized trainings in sectors such as medicine, finance and accounting, law, research and analysis, engineering design, IT, human resource management and logistic to take advantage of high-value KPO roles.
• In addition to training programs, include programs and/or guidelines that ensure the health and well-being of people employed in the sector.
P3. create World-class Urban environments to support iT-BPo industry Development
• Create world-class supportive urban environments taking into account the industry's 24/7 work cycle. These environments must feature a mix of uses and amenities that cater to local workers and residents, including retail, dining, entertainment, services (e.g., banking), mixed-income residences. Provide a safe and integrated pedestrian system to encourage walkability between the amenities during all hours.
• Include high-quality infrastructure encompassing transmission backbones and distribution networks for electricity, high-speed telecommunications networks, and well-connected transport systems.
• Ensure infrastructure reliability and personal safety in the event of major disruptions caused by natural hazards, such as floods and earthquakes.
Economic Clusters are typically defined as a geographic concentration of interconnected businesses, suppliers and associated / supporting institutions in a particular industry or field, such as IT-BPO, automobile manufacturing, etc.
The Metro Manila Greenprint 2030: Building a Vision
15
Figure 2.1 Total Low Income Group Direct and Indirect IT-BPO Employment
Figure 2.2 IT-BPO Industry in the Philippines: Direct Full-TimeEmployment, Nationwide, Metro Manila, and Outtside Metro Manila
Figure 2.3 IT-BPO in the Philippines: Direct and IndirectEmployment, 2004-2020
2.00
1.80
1.60
1.40
1.20
1.00
0.80
0.60
0.40
0.20
0.00
2.00
1.80
1.60
1.40
1.20
1.00
0.80
0.60
0.40
0.20
0.00
7.0
6.0
5.0
4.0
3.0
2.0
1.0
0.02004 2009 2010 2011 2012 2016a 2020b
2004 2009 2010 2011 2012 2016a 2020b
2004 2009 2010 2011 2012 2016a 2020b
Outside Metro Manila
Metro Manila
Outside Metro Manila
Metro Manila
Direct Employment
Indirect Employment
Dire
ct E
mpl
oym
ent (
Mill
ions
)To
tal L
ow In
com
e G
roup
Dire
ct+I
ndire
ct IT
-BP
O E
mpl
oym
ent
Em
ploy
men
t (M
illio
ns)
0.11
0.440.56
0.700.78
1.30
1.80
1.89
1.35
0.810.66
0.540.45
0.12
6.3
4.5
2.62.2
1.81.5
0.4
0.45
0.47
1.42
0.34
1.010.20
0.61
0.17
0.50
0.14
0.41
0.11
0.340.030.09
4.50.33
0.190.17
0.140.11
1.35
1.81.3
3.2
1.91.6
0.6
1.3
0.6
1.1
0.40.030.1
0.8
0.98
0.580.52
0.420.330.03
0.08
The Metro Manila Greenprint 2030: Building a Vision
16
a. Build Upon successful local and national initiatives that support Human resource Development
Massive training of IT-BPO personnel requires building on ongoing successful programs:
At the national level, institutions such as the Technical Education and Skills Development Authority (TESDA) and private sector actors allocated PHP 25.2 million (USD 600,000) to support talent development in the IT-BPO industries. The funding is primarily devoted to Trainers’ Training programs in cooperation with the Business Processing Association of the Philippines (BPAP). This is part of the government’s commitment to support the IT-BPO industry’s Road Map 2016 through a trainer’s program that offers the best multiplier effect to increase jobs (direct and indirect) from 1.8 million in 2010 to 4.5 million in 2016.
At the local level, efforts such as Quezon City’s excellent pilot program to provide short-term training to disadvantaged youth should be expanded or replicated.
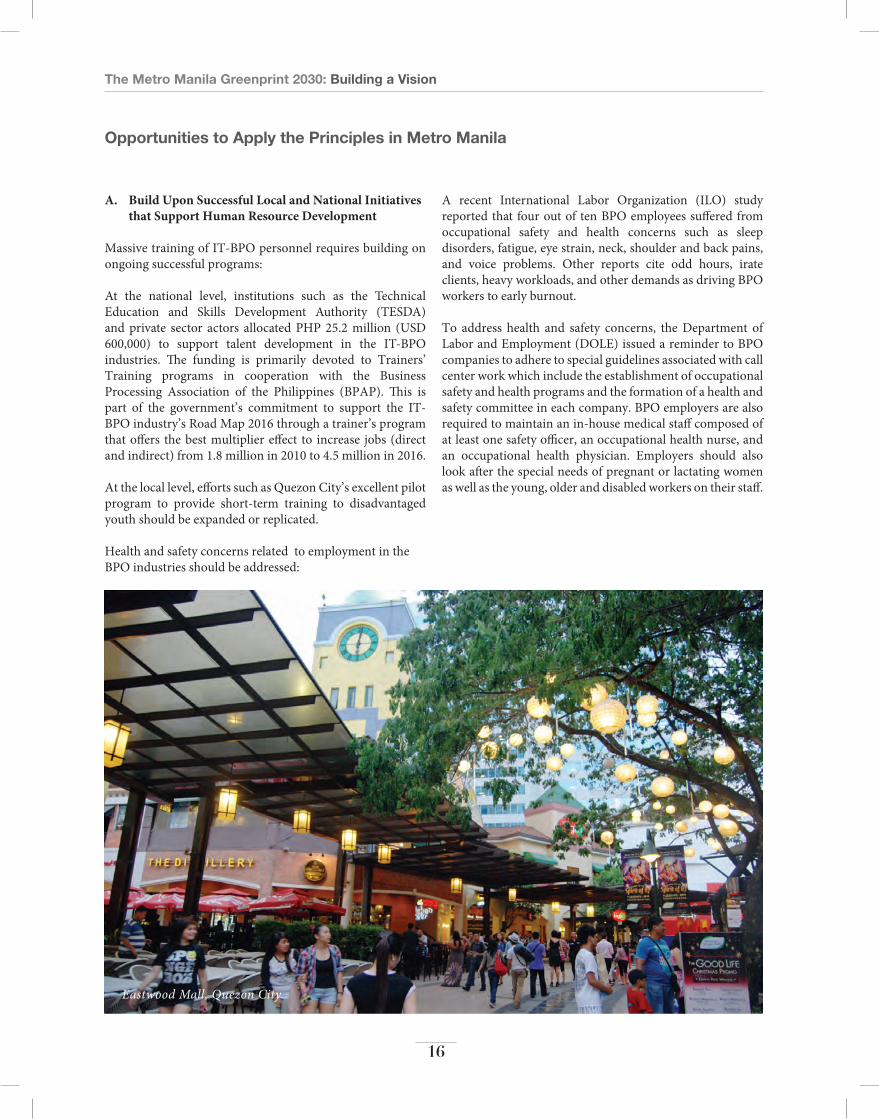
Health and safety concerns related to employment in the BPO industries should be addressed:
A recent International Labor Organization (ILO) study reported that four out of ten BPO employees suffered from occupational safety and health concerns such as sleep disorders, fatigue, eye strain, neck, shoulder and back pains, and voice problems. Other reports cite odd hours, irate clients, heavy workloads, and other demands as driving BPO workers to early burnout.
To address health and safety concerns, the Department of Labor and Employment (DOLE) issued a reminder to BPO companies to adhere to special guidelines associated with call center work which include the establishment of occupational safety and health programs and the formation of a health and safety committee in each company. BPO employers are also required to maintain an in-house medical staff composed of at least one safety officer, an occupational health nurse, and an occupational health physician. Employers should also look after the special needs of pregnant or lactating women as well as the young, older and disabled workers on their staff.
Opportunities to Apply the Principles in Metro Manila
Eastwood Mall, Quezon City
The Metro Manila Greenprint 2030: Building a Vision
17
B. create synergy between Public, Private, and academic institutions to support emerging iT-BPo needs
Put in place policies to incentivize private sector and public institutions, such as universities, to attract catalytic global talent, as other metropolitan areas such as Singapore, Beijing, and Amsterdam are doing, and focus on training graduates in specific areas that align with the needs of Metro Manila’s IT- BPO sector.
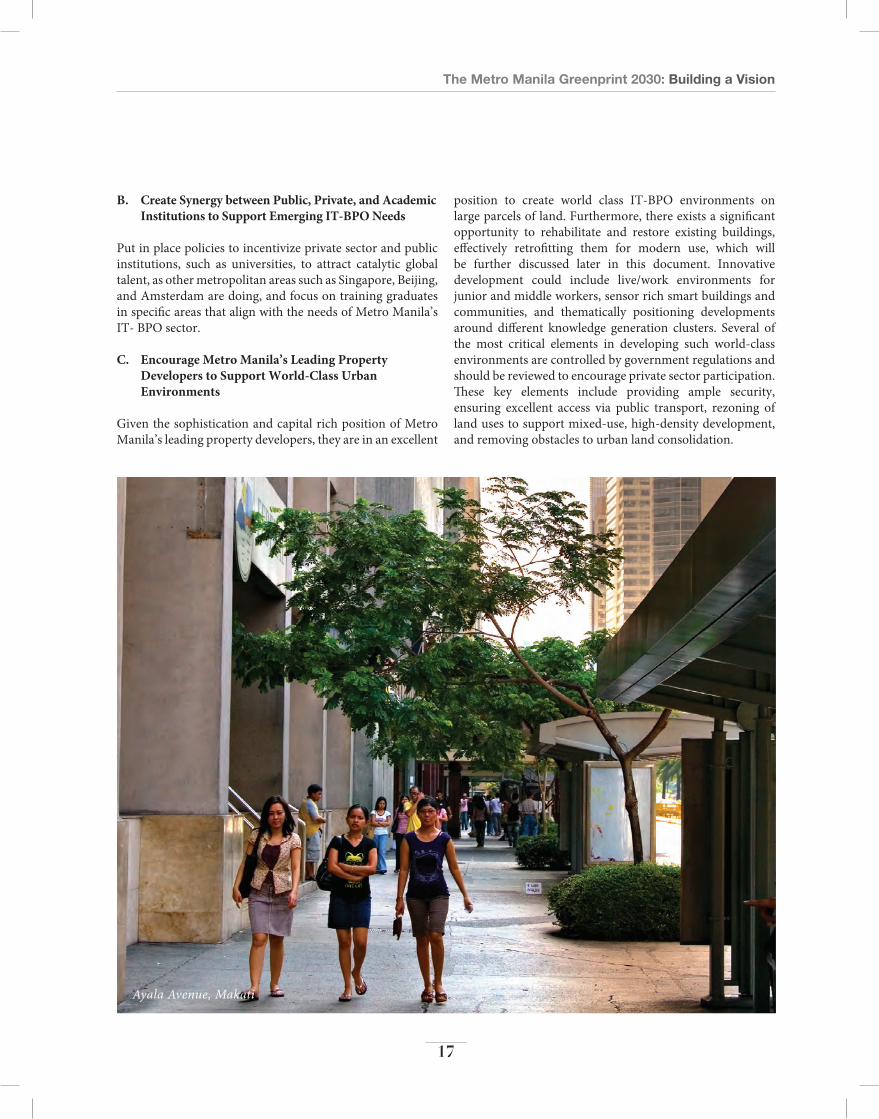
c. encourage Metro Manila’s leading Property Developers to support World-class Urban environments
Given the sophistication and capital rich position of Metro Manila’s leading property developers, they are in an excellent
Ayala Avenue, Makati
position to create world class IT-BPO environments on large parcels of land. Furthermore, there exists a significant opportunity to rehabilitate and restore existing buildings, effectively retrofitting them for modern use, which will be further discussed later in this document. Innovative development could include live/work environments for junior and middle workers, sensor rich smart buildings and communities, and thematically positioning developments around different knowledge generation clusters. Several of the most critical elements in developing such world-class environments are controlled by government regulations and should be reviewed to encourage private sector participation. These key elements include providing ample security, ensuring excellent access via public transport, rezoning of land uses to support mixed-use, high-density development, and removing obstacles to urban land consolidation.

The Metro Manila Greenprint 2030: Building a Vision
18
Eastwood Cyberpark: Leading IT Environment
To meet the needs and demands of IT-BPO industry workers, Megaworld, the developer of Eastwood Cyberpark in Quezon City, has created a world-class urban landscape that includes a number of office towers, residential towers, and a shopping mall complete with a variety of restaurants and service outlets. Many of these retail and service outlets are open 24-hours a day, 7-days a week to cater to the needs of IT-BPO workers’ round-the-clock schedules. At present, IT firms employ more than 17,000 workers in Eastwood, as well as an estimated 13,000 ancillary jobs in addition to thousands of residents, many of whom also work in Eastwood. A free shuttle bus service operates within Eastwood to facilitate access to the development wide range of uses as well as external transfer points.
To further the successful development of new and existing IT-BPO nodes in Metro Manila, both public and private sectors must work together to provide clean, safe, and fun 24/7 environments for workers, similar to the one found in Eastwood Cyberpark.
India's Infosys: Local IT Firm Goes Global in a Big Way
Infosys is one of India’s, and indeed the world’s leading IT firms with a primary focus on IT-BPO activities. Over the three decades since its founding in the early 1980s in Bangalore, one of India’s current IT hotbeds, Infosys now employs more than 157,000 people around the world and has annual revenues approaching USD 7 billion.
While Infosys provides clients with India-based services, the company is well-known for branching out across the world and employing IT-BPO workers in many other countries around the world, including the United States of America, Australia, the Philippines, Brazil, and China, catering to both local and global markets from these bases. Infosys serves as a model example for what domestic IT-BPO firms can achieve from a base in Metro Manila.
The Metro Manila Greenprint 2030: Building a Vision
19
2. Unleashing Metro Manila’s Tourism Potential and Attracting Newly Rich Neighbors
Goal
Make Metro Manila the first-choice destination for the newly emerging affluent citizens of East Asia for shopping, cultural tourism, visits to heritage sites, conventions, meetings, and entertainment.
Background
East Asia, home to the Philippines, is the world’s largest economy, containing the world’s second (China) and third (Japan) largest national economies. The over 600 million people of the Association of Southeast Asian Nations (ASEAN), of which the Philippines is a member, are enjoying an economic resurgence, facilitated by wide-scale implementation of the ASEAN Free Trade Agreement in 2015. Unlike in the West, money is in the hands of the middle-aged (with the exception of Japan) people, with a high propensity to travel, shop, sightsee, eat, gamble, participate in conventions, exhibitions and meetings, and to discover their Asian culture and roots. This mobile affluent East Asian population will total approximately 1 billion people by 2020 and 2 billion by 2030; leading consumer analysts, such as McKinsey & Company, all agree that this traveling consumer class is growing substantially faster than previously forecasted. At present, more than 46 percent of international tourists (nearly two million people) to the Philippines come from the East Asian market, with the largest groups being Koreans, Japanese, and Chinese. For the first months of 2013, the East Asia market increased by almost 15 percent.
Metro Manila in the 1950s to early 1980s was among the leading destinations for Asia’s elite, but has fallen abruptly in attractiveness over the last three decades. Nevertheless, Metro Manila has the potential to bounce back based on the widespread use of English, its unique (to Asia) Spanish-influenced culture, its geo-strategic position (the eastern gateway to East Asia), and the inherent hospitality and cheerfulness of its people.

The Metro Manila Greenprint 2030: Building a Vision
20
Quiapo, Manila
Principles
P1. Provide Visitors with a Variety of activities to Participate in and Destinations to explore
• Identify key activities and destinations that generate substantial interest. Attracting visitors requires identifying key activities and destinations that generate substantial interest. Typically, these activities include cultural and heritage-based tourism, shopping, dining, and entertainment, MICE activities, and serving as a staging area for beach tourism where visitors can spend a few days exploring before heading off to the beach. Destinations often include historical sites, museums, shopping districts, high-end restaurants, bars / night spots and casinos.
P2. assure Visitors of their Personal safety
• Create a real and perceived sense of personal safety which can be achieved through a variety of complimentary
mechanisms including better urban design (e.g., walkability, well-lit sidewalks and streets), user-friendly signage and easily accessible local information, community-based neighborhood watch programs, more visible police presence, and/or the creation of a special tourist police force designed to assist and protect travelers.
P3. ensure Visitors have access to High-Quality infrastructure and High levels of convenience
• Develop multiple public transport modes, including bus, rail, and taxi on which visitors can travel safely, quickly, comfortably, and affordably throughout the metropolis.
• Facilitate the provision of convenient, reliable and safe, privately-run tour bus operations.

The Metro Manila Greenprint 2030: Building a Vision
21
Intramuros
a. identify and Promote Key activities / sectors in which Metro Manila can excel in attracting Visitors
Metro Manila possesses a number of key areas that could be highly attractive to new visitors. These include its Spanish-influenced culture and heritage sites in Manila (something rarely found in neighboring countries), a multitude of major shopping destinations like Trinoma, Greenbelt, Greenhills, Bonifacio High Street, and the SM Mall of Asia, emerging integrated resorts on the Manila Bay waterfront, world-class MICE facilities with English-speaking staff, and a convenient central staging location for beach tourism. The importance of Metro Manila and surrounding areas like Tagaytay, Batangas, and Laguna is underscored by the fact that these areas account for close to 70% of total tourist arrivals. The National Tourism Master Plan suggests that these areas are well positioned to serve global leisure, entertainment, MICE, and resort destination markets, with a broad range of day trip activities. Highlighted in the Plan is the major restoration of Intramuros , which is currently seeking a United Nations Educational, Scientific and Cultural
Organization (UNESCO) listing as an internationally recognized heritage site.
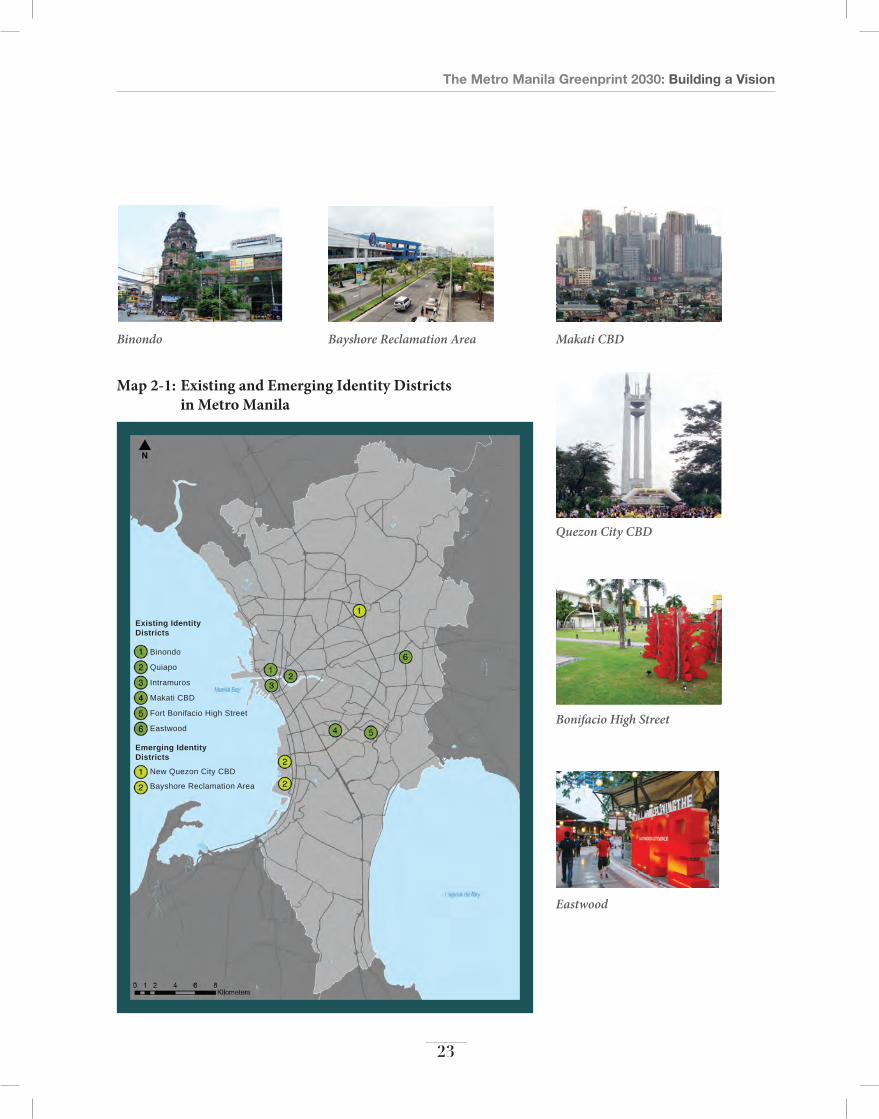
B. identify suitable locations for the creation and Promotion of identity Districts
Identify and establish Identity Districts that highlight note-worthy aspects of Metro Manila. These districts might include the cultural core at Intramuros / Binondo, the emerging MICE and Entertainment district along the waterfront, the popular shopping districts, the economic core districts of Makati, including Fort Bonifacio, as well as emerging areas like the future Quezon City Triangle CBD.
Target investment in these areas that could come through public-private partnerships that encourage a high-quality built environment, or private sector-led Business Improvement Districts (BID) such as the Golden Triangle BID in Washington, DC, a private non-profit organization dedicated to providing a clean, safe, and vibrant community in one of the city’s high-profile areas.
Opportunities to Apply the Principles in Metro Manila

The Metro Manila Greenprint 2030: Building a Vision
22
c. create safe and Highly-accessible Zones that coincide with identity Districts
In line with the creation of Identity Districts, the concept of safe zones for both tourists and residents should be incrementally deployed. These zones could feature well-designed and highly-visible signage, the presence of police or a special tourist police force, friendly, trained tour guides, and high-quality pedestrian areas that include specially-designed street lighting to reduce dark spaces and/or covered walkways in areas with high exposure to natural elements.
D. improve the Usability, attractiveness, comfort, and safety of Metro Manila’s Transport system
First impressions of a city are extremely important. As most new visitors will arrive by air, the existing arrival experience at Ninoy Aquino International Airport (NAIA) should be improved, particularly in terms of the immigration process, baggage handling efficiency, and overall aesthetics of the arrival terminal. In striving to develop local tourism, arrival areas in all four terminals at NAIA could feature visitor information booths, posters, and other promotional materials that make Metro Manila’s destinations and activities highly visible, particularly for first-time visitors.
Beyond the arrival experience, visitors must have easy access to safe, comfortable, reliable, and efficient transport to move around Metro Manila and its peripheries. Possible opportunities to improve visitor experience include reforming and standardizing the public taxi system by enforcing meter usage, establishing a user helpline and upgrading the existing mass rapid transit (rail) network to be more visitor-friendly. Investing in transport infrastructure improvements is a key pre-requisite for improving the overall tourism experience.
e. expand Tourism opportunities by incorporating the Pasig river into the region’s Transport system
One urban asset at the intersection of tourism and transportation is the Pasig River. The Pasig River is a historical waterway, which facilitated trade and growth in early Manila settlements. The river is 27 kilometers in length weaving through Manila, Makati, Mandaluyong, Pasig, Taguig, and the municipality of Taytay in the province of Rizal. Along the river lie areas of interest such as the Malacañang Palace, the National Post Office, Makati City Hall, various Central Business Districts, thirteen bridges, and a host of informal settlements. The waterfront remains largely blighted in light of the loss of industries along the riverbanks, the decline of water transport use, and excessive water pollution. There have been recent efforts to rehabilitate the Pasig River by integrating land use and transportation plans and focusing on riverfront redevelopment. The goal is to transform the river so that it becomes conducive to transport, recreation, and tourism--providing an uninterrupted glimpse of the city from a different angle, something only a small percentage of the population and tourists currently enjoy.
F. Develop a Professional, Metro Manila-oriented Tourism Marketing campaign
Promote Metro Manila in the Asia-Pacific Region based on a catchy tagline, images, etc., in synch with the current highly successful “It’s More Fun in the Philippines” media campaign. Promotional initiatives should be professionally managed and undertaken at a metropolitan scale. Local governments should focus on identifying streets and districts and events organization that can be incorporated into regional campaigns, such as day tours that focus on 2-3 key cities or destinations.
National Post Office along the Pasig River
The Metro Manila Greenprint 2030: Building a Vision
23
Binondo
Eastwood
Bonifacio High Street
Makati CBD
Quezon City CBD
Existing IdentityDistricts
Binondo
Quiapo
Intramuros
Makati CBD
Fort Bonifacio High Street
Eastwood
Emerging IdentityDistricts
New Quezon City CBD
Bayshore Reclamation Area
Bayshore Reclamation Area
Map 2-1: existing and emerging identity Districts in Metro Manila
The Metro Manila Greenprint 2030: Building a Vision
24
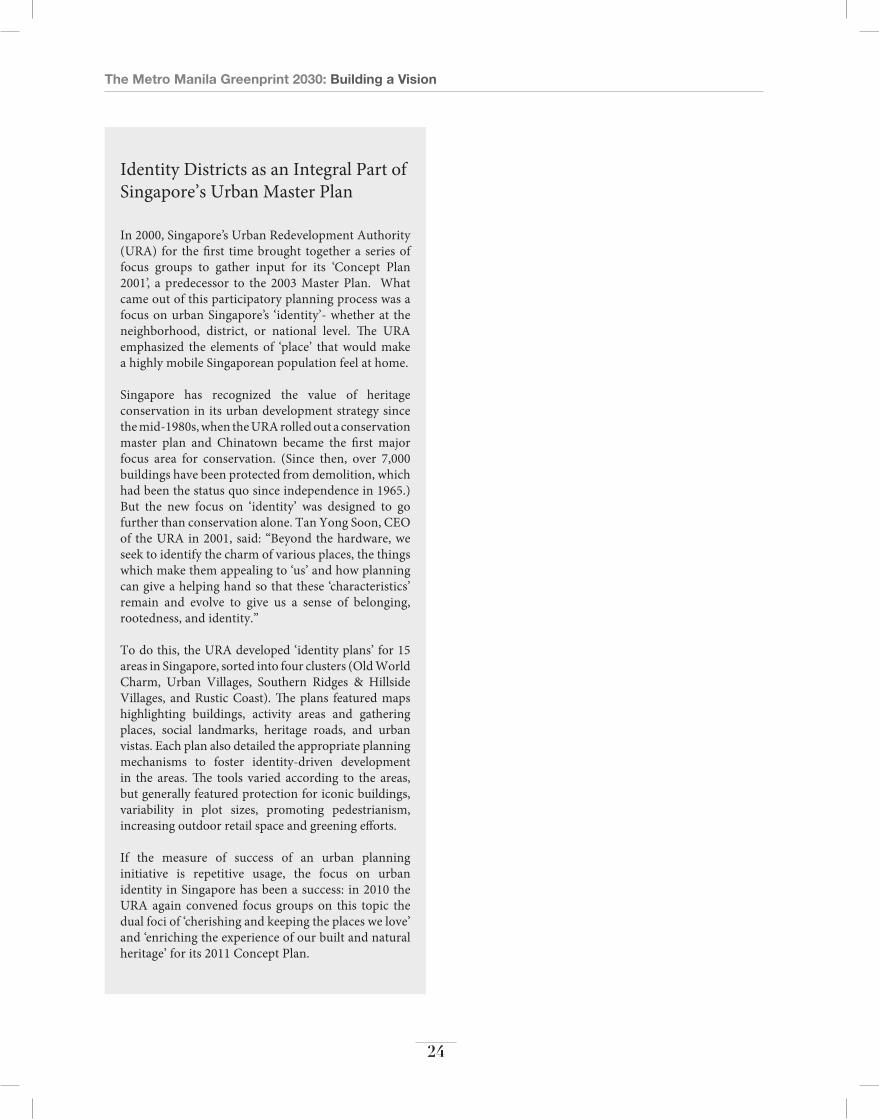
In 2000, Singapore’s Urban Redevelopment Authority (URA) for the first time brought together a series of focus groups to gather input for its ‘Concept Plan 2001’, a predecessor to the 2003 Master Plan. What came out of this participatory planning process was a focus on urban Singapore’s ‘identity’- whether at the neighborhood, district, or national level. The URA emphasized the elements of ‘place’ that would make a highly mobile Singaporean population feel at home.
Singapore has recognized the value of heritage conservation in its urban development strategy since the mid-1980s, when the URA rolled out a conservation master plan and Chinatown became the first major focus area for conservation. (Since then, over 7,000 buildings have been protected from demolition, which had been the status quo since independence in 1965.) But the new focus on ‘identity’ was designed to go further than conservation alone. Tan Yong Soon, CEO of the URA in 2001, said: “Beyond the hardware, we seek to identify the charm of various places, the things which make them appealing to ‘us’ and how planning can give a helping hand so that these ‘characteristics’ remain and evolve to give us a sense of belonging, rootedness, and identity.”
To do this, the URA developed ‘identity plans’ for 15 areas in Singapore, sorted into four clusters (Old World Charm, Urban Villages, Southern Ridges & Hillside Villages, and Rustic Coast). The plans featured maps highlighting buildings, activity areas and gathering places, social landmarks, heritage roads, and urban vistas. Each plan also detailed the appropriate planning mechanisms to foster identity-driven development in the areas. The tools varied according to the areas, but generally featured protection for iconic buildings, variability in plot sizes, promoting pedestrianism, increasing outdoor retail space and greening efforts.
If the measure of success of an urban planning initiative is repetitive usage, the focus on urban identity in Singapore has been a success: in 2010 the URA again convened focus groups on this topic the dual foci of ‘cherishing and keeping the places we love’ and ‘enriching the experience of our built and natural heritage’ for its 2011 Concept Plan.
Identity Districts as an Integral Part of Singapore’s Urban Master Plan

The Metro Manila Greenprint 2030: Building a Vision
25
3. Reclaiming High-Value Services and Promoting High-Potential Economic Clusters
Goal
Reclaim Metro Manila’s past role as a leading high-value services center in Asia in areas such as higher education, medical services, tourism, and the cultural economy, and promote economic clusters having high potential to create jobs for lower-income populations.
Background
In the post-World War II period, Metro Manila was a leading higher-education center in the Asia Pacific Region, known for elite institutions such as the University of the Philippines, the Asian Institute of Management, and the International Rice Research Institute (IRRI). A generation of Asian leaders were educated in the Philippines. Similarly, Metro Manila was once a leading medical center in the Asia Pacific Region, based around a cluster of still functioning quality medical institutions in the area of Quezon Memorial Circle in Quezon City, such as the Philippine Heart Center and the National Kidney Transplant Institute.
Considerable potential exists to revive this golden era of Metro Manila as a center for high-value services, and hopeful signs are already appearing. The advertising and animation industries have maintained their viability over the years, although with diminished Asian market share. There are prospects for development and growth of a serious digital media cluster. Specialized English language education is booming, especially in the case of the South Korean market. The new St. Luke’s hospital in Fort Bonifacio Global City is receiving excellent reviews worldwide (e.g., Business Traveler magazine) and is fully US-accredited.
The Metro Manila Greenprint 2030: Building a Vision
26
Principles
P1. ensure Visitors have access to High-Quality infrastructure and High levels of convenience
• Identify and focus on key areas with existing or potential comparative or competitive advantage. In the case of Metro Manila, these areas may include English language education, selected fields of Higher Education, Creative Services (such as entertainment, advertising, animation, and digital media), nursing and health services, and research (possibilities include bio-pharmaceutical, media, trade, and legal research).
• Identify and support key sub-sectors such as accounting, healthcare (e.g., diagnostics), and data analytics. Importantly, future growth in the IT-BPO sector has the potential to generate hundreds of thousands of new indirect jobs, particularly in the business and financial services subsector.
P2. ensure the availability of Well-trained, specialized Workers to Meet Growing Demand in Key industries
• Create large-scale educational opportunities that cater to specific fields, such as the aforementioned needs of the IT-BPO sector, producing high-quality English-language instructors, and graduates with world-class skills in various creative services and research fields. To support key industries with existing and potential advantages, both public and private sectors must work together.
P3. create industry-specific incubators and Platforms to catalyze Growth in Key areas
• Industry-specific cluster development should be supported through setting up of small firm incubators and/or platforms that allow cross-firm knowledge sharing, ease of access to resources, and “seed” funding from either public and/or private sources. These platforms will provide small business with access to funding and resources that they may not have the capability to obtain independently.
P4. Promote economic clusters, particularly those with High Potential for Job creation
• Promote economic sectors with high potential to create jobs for the basic-skilled, low-income earning segment of the region’s population. Supporting future economic growth and the livelihoods of Metro Manila’s existing and future working age populations, particularly those in lower-income brackets and/or those who are low-skilled, is critical given the relatively high rate of unemployment in Metro and Mega Manila.
• Evaluate existing locations of economic activities to identify potential areas where “clusters” could develop. Economic clusters are concentrations of interrelated companies, suppliers, and institutions located within a geographic area that foster high levels of productivity and innovation.
• Engage the private sector and local institutions to develop policies, incentives, and programs that foster an environment to facilitate the development of clusters.
• Target those activities in particular that offer the most potential for job creation.

The Metro Manila Greenprint 2030: Building a Vision
27
Pasay City
a. recognize and act on rapid Growth among in-Demand High-Value services
Recognize and act on the demand for high value services associated with rapid growth of shopping, MICE, tourism, entertainment, e.g., advertising, exhibition display arts (which includes digital media), holistic and alternative medicine, and cosmetic medicine. The employment potential of these creative clusters is often underestimated. For example, several hundred thousand people work in the exhibition display arts cluster in Shanghai, which increasingly entails digital media applications. B. align initiatives and investment in Higher
education in areas that align with Major economic opportunities in Mega Manila
In higher education, given resource constraints, focus on areas such as IT-BPO that align with Mega Manila economic opportunities. Pursue approaches that improve the overall skills and abilities of the workforce, as well as lead to greater innovation in the targeted industries.
c. engage Highly Talented individuals from the Global Philippines’ Diaspora
Many talented Filipinos working in high-end services industries have chosen to live abroad. Efforts should be made to encourage these expatriates to return and bring
with them knowledge gained abroad. In addition to helping build knowledge capacity in Metro Manila’s key economic industries, successfully repatriating Overseas Foreign Workers (OFW) will boost the size of Metro Manila’s middle-class, creating new opportunities for residential, retail, and commercial development.
D. encourage the creation of subsidized creative industry Platforms
Encourage the creation of subsidized creative industry platforms / zones (e.g., the Shanghai digital media platform) as magnets to cluster creative services, e.g., advertising, enabling small start-ups, who otherwise may not obtain access to needed expensive leading edge technology and equipment.
e. revive the Manufacturing sector and encourage new construction Jobs
As of October 2012, the five largest economic sectors in the Philippines by employment are: (as a percentage of total employed persons) are Agriculture & Forestry (32.3%), Wholesale & Retail Trade (18.7%), Manufacturing (8.7%), Transport & Storage (7.1%), and Construction (5.8%). When compared to successful regional neighbors such as Thailand and Vietnam, it is clear that the Philippines has a much smaller share of manufacturing jobs than its peers with a comparable share of construction jobs.
Opportunities to Apply the Principles in Metro Manila

The Metro Manila Greenprint 2030: Building a Vision
28
In order to fully realize Greenprint objectives that include poverty alleviation and improving livelihoods for the region’s lower-income residents, it is necessary to breathe new life into the manufacturing sector by focusing on key sub-sectors with high job creation potential.
At present, the most obvious opportunities are to target increasing the competitiveness of agri-business, small electronics manufacturing and assembly, and segments of the automotive industry. For example, food processing is the third largest manufacturing subsector (by employment) in the country. With strong public support, the Philippines could rival Thailand as the “Kitchen of the World” by focusing on unique, branded products for export markets. Small electronics manufacturing and assembly is the largest manufacturing subsector (by employment). With new investment in logistics-related infrastructure, initiatives that support skills-upgrading, and national government (e.g., PEZA and BOI) support, the Philippines (largely Mega Manila) could draw foreign investment away from other ASEAN nations. Lastly, the Philippines is emerging as a leader in electric vehicle parts production, which may employ as many as 50,000 people within a few years (with most of the investment planned to take place within Mega Manila).

The Metro Manila Greenprint 2030: Building a Vision
29
Bangkok's Panyapiwat Institute of Management:
Creating High-Quality Graduates in Key Fields
Panyapiwat Institute of Management (PIM) is a private university in Bangkok, fully licensed by the Thai Ministry of Education to award undergraduate and post-graduate degrees, and is owned by the CP All company, one of the largest conglomerates in Thailand (the flagship holding of which is nearly 6,000 7-Eleven convenience stores).
CP All has been running vocational training programs since 1994. In the early 2000s, the company formed a private university to offer Bachelor and Master degree programs focused on coupling traditional theoretical classroom teaching with practical, real-world work experience in the areas of retail, logistics, food services, information technology, and Chinese-related business lines. It does this through paid internship placements within the CP All group, and as the university has grown, other private sector companies have become work placement partners as well, including the Bank of China and the True Telecommunications Group.
In order to maintain the integrity of the degree programs and ensure that the curriculum is aligned with the needs of employers, PIM invites private sector representatives to its Board of Directors. The model seems to be working: since incorporation in March 2007 PIM has grown to now offer 11 bachelor's degrees and an MBA program with four specializations, as well as a series of executive short programs.
Regenerative Medicine, or stem cell-based therapy, is the newest emerging concept for the treatment of illnesses with very little known cure or no cure at all. It uses advanced technologies in cellular and molecular biology, isolating stem cells from a patient's own fat (adipose stroma) or bone marrow and engineering them to preserve, restore, or enhance organ function. The Medical City, a world-class health care complex
Regenerative Medicine in Metro Manila
accredited by the Joint Commission International (JCI) with over forty years of experience in hospital operations and administration, has identified "regenerative medicine" as one of its centers for excellence along with cancer, cardiovascular, and wellness serving Filipino and international patients from the United States, Europe, Russia, and Australia. The National Kidney & Transplant Institute (NKTI) has been applying stem cell transplantation since 1990. The NKTI's Stem Cell Transplantation Program has been performing blood and bone marrow transplantation procedures for years and has improved survival for patients who suffer from diseases like leukemias and lymphomas. The Asian Stem Cell Institute (ASCI) treatment center is based in Manila. St Luke's Medical Center and Makati Medical Center have likewise invested in latest and sophisticated medical equipment in pursuing stem-cell research and regenerative medicine, aggressively collaborating with leading medical institutions around the world.
The Metro Manila Greenprint 2030: Building a Vision
30
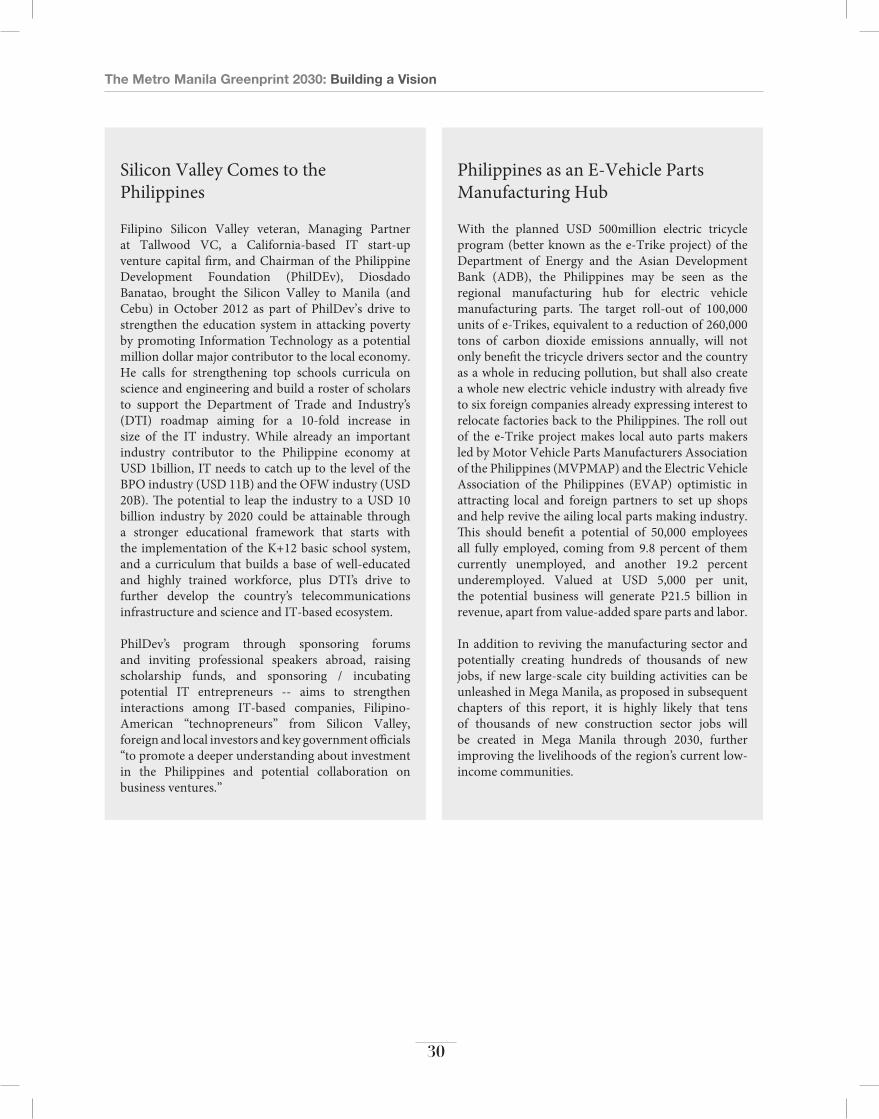
Silicon Valley Comes to the Philippines
Filipino Silicon Valley veteran, Managing Partner at Tallwood VC, a California-based IT start-up venture capital firm, and Chairman of the Philippine Development Foundation (PhilDEv), Diosdado Banatao, brought the Silicon Valley to Manila (and Cebu) in October 2012 as part of PhilDev’s drive to strengthen the education system in attacking poverty by promoting Information Technology as a potential million dollar major contributor to the local economy. He calls for strengthening top schools curricula on science and engineering and build a roster of scholars to support the Department of Trade and Industry’s (DTI) roadmap aiming for a 10-fold increase in size of the IT industry. While already an important industry contributor to the Philippine economy at USD 1billion, IT needs to catch up to the level of the BPO industry (USD 11B) and the OFW industry (USD 20B). The potential to leap the industry to a USD 10 billion industry by 2020 could be attainable through a stronger educational framework that starts with the implementation of the K+12 basic school system, and a curriculum that builds a base of well-educated and highly trained workforce, plus DTI’s drive to further develop the country’s telecommunications infrastructure and science and IT-based ecosystem.
PhilDev’s program through sponsoring forums and inviting professional speakers abroad, raising scholarship funds, and sponsoring / incubating potential IT entrepreneurs -- aims to strengthen interactions among IT-based companies, Filipino-American “technopreneurs” from Silicon Valley, foreign and local investors and key government officials “to promote a deeper understanding about investment in the Philippines and potential collaboration on business ventures.”
Philippines as an E-Vehicle Parts Manufacturing Hub
With the planned USD 500million electric tricycle program (better known as the e-Trike project) of the Department of Energy and the Asian Development Bank (ADB), the Philippines may be seen as the regional manufacturing hub for electric vehicle manufacturing parts. The target roll-out of 100,000 units of e-Trikes, equivalent to a reduction of 260,000 tons of carbon dioxide emissions annually, will not only benefit the tricycle drivers sector and the country as a whole in reducing pollution, but shall also create a whole new electric vehicle industry with already five to six foreign companies already expressing interest to relocate factories back to the Philippines. The roll out of the e-Trike project makes local auto parts makers led by Motor Vehicle Parts Manufacturers Association of the Philippines (MVPMAP) and the Electric Vehicle Association of the Philippines (EVAP) optimistic in attracting local and foreign partners to set up shops and help revive the ailing local parts making industry. This should benefit a potential of 50,000 employees all fully employed, coming from 9.8 percent of them currently unemployed, and another 19.2 percent underemployed. Valued at USD 5,000 per unit, the potential business will generate P21.5 billion in revenue, apart from value-added spare parts and labor.
In addition to reviving the manufacturing sector and potentially creating hundreds of thousands of new jobs, if new large-scale city building activities can be unleashed in Mega Manila, as proposed in subsequent chapters of this report, it is highly likely that tens of thousands of new construction sector jobs will be created in Mega Manila through 2030, further improving the livelihoods of the region’s current low-income communities.
The Metro Manila Greenprint 2030: Building a Vision
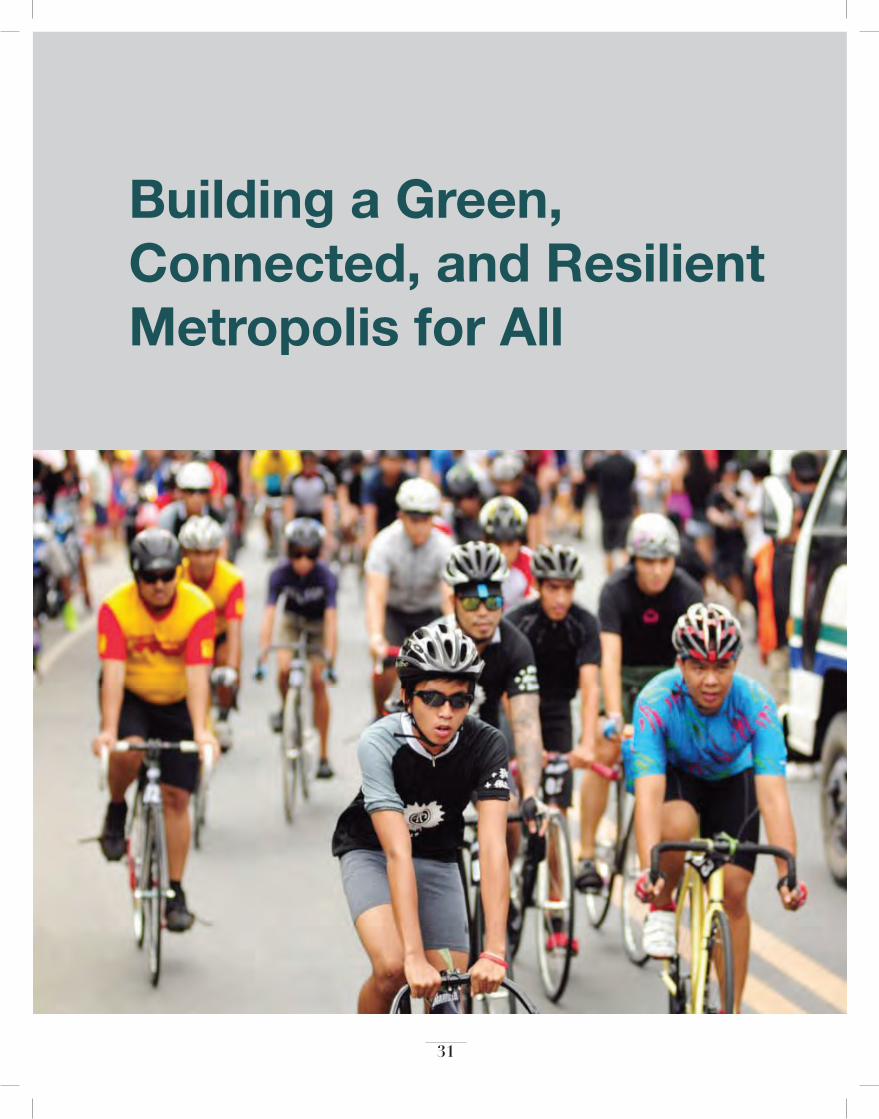
31
Building a Green, Connected, and Resilient Metropolis for All

The Metro Manila Greenprint 2030: Building a Vision
32

The Metro Manila Greenprint 2030: Building a Vision
33
Strategic investments in infrastructure focusing on housing, mobility, and environmental sustainability will lead to an efficient, equitable, inclusive, and resilient region by 2030.
connecting Metro Manila
• Focus major development initiatives around new and existing urban and peri-urban nodes
• Connect urban and peri-urban nodes via an efficient, safe, and reliable multi-modal transport system
• Protect existing and proposed transport rights-of-way
Making Metro Manila inclusive
• Leverage opportunities to unlock huge land values through in-situ redevelopment and catalytic infrastruc-ture development
• City-wide informal settlement upgrading
Achieving the Vision
creating a resilient Metropolis
• Promote better understanding of the risks and their impacts on the overall sustainability and competitive-ness of Metro Manila
• Encourage investment in disaster risk reduction pro-grams
• Engage community-level participation in adaptation and mitigation efforts
• Implement risk-sensitive land use guidelines and encourage private sector cooperation to prevent future encroachment
• Build redundancy in lifeline systems• Promote economic sectors with high potential for new
job creation
The Metro Manila Greenprint 2030: Building a Vision
34
4. Connecting to Metro Manila
Goal
Build on the potential of Metro Manila’s multi-centered spatial structure to be green and time saving, by enhancing connectivity among and within urban centers, and by selectively designating new urban centers as Metro Manila integrates with its peri-urban hinterland.
Background
“Since World War II Metro Manila has seen enormous shifts in its spatial structure, with the pre-War, Manila-centered monocentric spatial structure being replaced by a poly-centric form with Makati as the CBD and EDSA (the former circumferential bypass road) as the main thoroughfare of the metropolis (see Map 3-1). Other centers include Pasig and Alabang, with Fort Bonifacio Global City, Makati, and the immediate Bayshore potentially coalescing into a new CBD. The growth of these centers is being driven by large-scale, private sector-led development, which is emerging as the leading force in shaping the spatial structure of Metro Manila. More recently, large new suburban developments have also sprouted outside of these central areas. Factors leading to the suburban development include cheaper land, proximity to labor pool, and higher levels of congestion in CBD areas.
Traffic congestion is a challenge in most of the region, not only in the urban centers but also the emerging suburban centers (such as Las Piñas and Muntinlupa) and peri-urban areas (such as Cavite and Laguna). The region is in immediate need of a transportation system that provides reliable, efficient, and affordable connectivity among the various centers in Metro Manila, as well as between the core city and the peri-urban areas. Creating such a system, through a well-developed road network integrated with rapid transit, will make a significant contribution towards reducing inefficiencies related to congestion and enhanced livability in the region.
The Metro Manila Greenprint 2030: Building a Vision
35
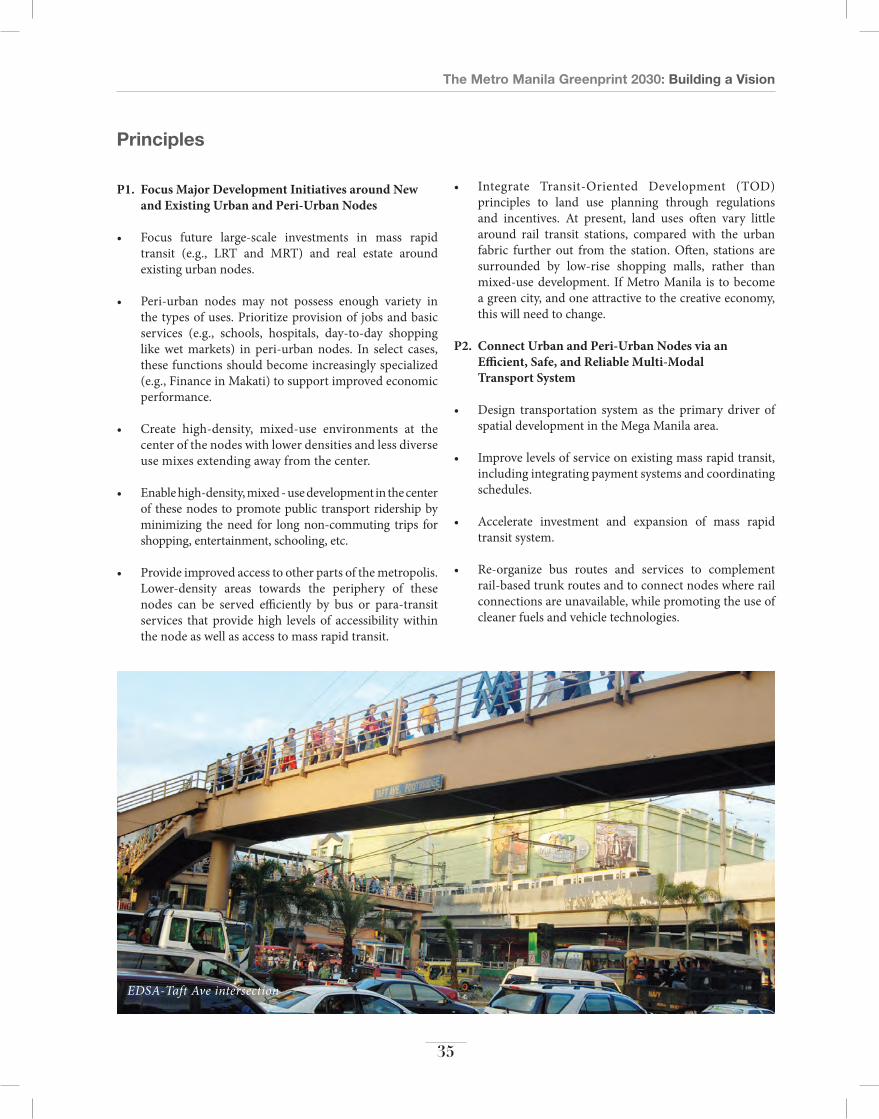
EDSA-Taft Ave intersection
Principles
P1. Focus Major Development initiatives around new and existing Urban and Peri-Urban nodes
• Focus future large-scale investments in mass rapid transit (e.g., LRT and MRT) and real estate around existing urban nodes.
• Peri-urban nodes may not possess enough variety in the types of uses. Prioritize provision of jobs and basic services (e.g., schools, hospitals, day-to-day shopping like wet markets) in peri-urban nodes. In select cases, these functions should become increasingly specialized (e.g., Finance in Makati) to support improved economic performance.
• Create high-density, mixed-use environments at the center of the nodes with lower densities and less diverse use mixes extending away from the center.
• Enable high-density, mixed - use development in the center of these nodes to promote public transport ridership by minimizing the need for long non-commuting trips for shopping, entertainment, schooling, etc.
• Provide improved access to other parts of the metropolis. Lower-density areas towards the periphery of these nodes can be served efficiently by bus or para-transit services that provide high levels of accessibility within the node as well as access to mass rapid transit.
• Integrate Transit-Oriented Development (TOD) principles to land use planning through regulations and incentives. At present, land uses often vary little around rail transit stations, compared with the urban fabric further out from the station. Often, stations are surrounded by low-rise shopping malls, rather than mixed-use development. If Metro Manila is to become a green city, and one attractive to the creative economy, this will need to change.
P2. connect Urban and Peri-Urban nodes via an efficient, safe, and reliable Multi-Modal
Transport system
• Design transportation system as the primary driver of spatial development in the Mega Manila area.
• Improve levels of service on existing mass rapid transit, including integrating payment systems and coordinating schedules.
• Accelerate investment and expansion of mass rapid transit system.
• Re-organize bus routes and services to complement rail-based trunk routes and to connect nodes where rail connections are unavailable, while promoting the use of cleaner fuels and vehicle technologies.
The Metro Manila Greenprint 2030: Building a Vision
36
• Re-organize jeepney and Asian Utility Vehicle (AUV) services to feed (rather than compete with) major trunk routes and key nodes, while providing short-distance intra-nodal travel using cleaner fuels and vehicle technologies.
P3. Protect existing and Proposed Transport rights-of-Way
• Existing and new transport projects, whether they are road, rail, or waterway-based, such as the Pasig River Ferry project, typically have Rights-of-Way built into the project. These Rights-of-Way must be protected to allow for efficient upgrading and expansion of existing infrastructure projects and to prevent the loss of life and property in the event of a major natural disaster.
• As an example, the Philippine National Railways owns the Right-of-Way for its entire work, meaning not only
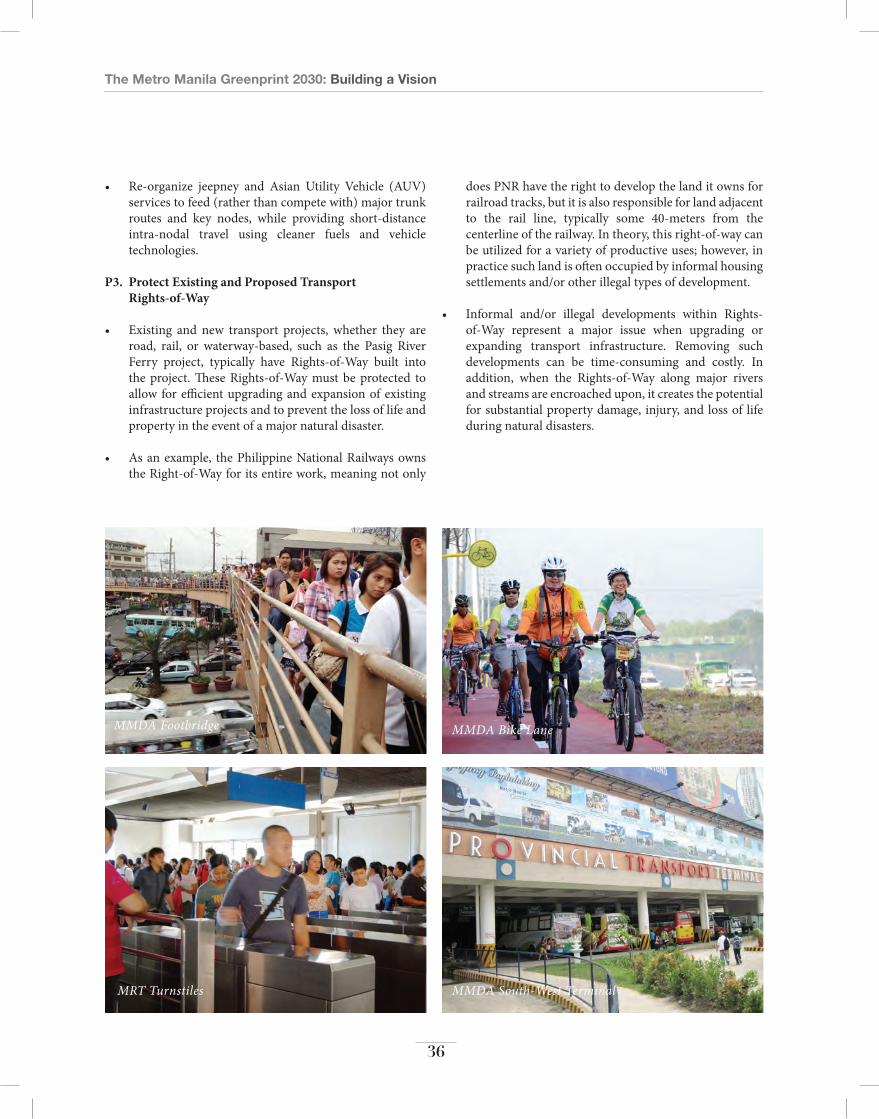
MMDA Footbridge MMDA Bike Lane
MRT Turnstiles MMDA South-West Terminal
does PNR have the right to develop the land it owns for railroad tracks, but it is also responsible for land adjacent to the rail line, typically some 40-meters from the centerline of the railway. In theory, this right-of-way can be utilized for a variety of productive uses; however, in practice such land is often occupied by informal housing settlements and/or other illegal types of development.
• Informal and/or illegal developments within Rights-of-Way represent a major issue when upgrading or expanding transport infrastructure. Removing such developments can be time-consuming and costly. In addition, when the Rights-of-Way along major rivers and streams are encroached upon, it creates the potential for substantial property damage, injury, and loss of life during natural disasters.
The Metro Manila Greenprint 2030: Building a Vision
37
a. capitalize on Metro Manila’s existing Multi-nodal spatial structure by Designating Priority nodes and Urban centers for High-Quality investment
Designate key urban nodes/centers as areas that will drive Metro Manila’s future development. Their growth should be enabled by land use regulations including building codes and zoning ordinances that require and/or incentivize high-density mixed-use development, particularly surrounding mass rapid transit stations.
Focus on improving key existing nodes like Makati and Fort Bonifacio. Once institutional and regulatory capacity is in place to support high-quality investment in these areas, this initiative can be expanded to other nodes with strategic significance such as Ortigas, Quezon City, and the Bayshore area.
Designate, incentivize, and/or create new urban centers, particularly in the peri-urban areas of Mega Manila, in the medium and long term, extending from existing nodes.
Facilitate high-density living to support capitalizing on Metro Manila’s multi-nodal structure. Leading developers have a key role to play in developing innovative urban high-rise communities, not just houses. The financial sector needs to make consumer credit widely available to promote middle class condominium living.
Utilize a range of marketing channels such as television, radio, print, social media, and popular culture content (e.g., television programs), to encourage high-quality, urbane, high-density living environments.
B. Prioritize coordinated large-scale Public investment and institutional cooperation Towards revitalizing Metro Manila’s Public and Private Transport systems
Building on the earlier principles, the following opportunities could be seized to improve Mega Manila’s Transport Systems (though none are explicit recommendations for action):
Upgrade existing Mass Rapid Transit lines to conform to international standards with respect to safety, reliability and comfort. This includes :
• Improving access to station areas, increasing station area amenities (such as covered walkways).
• Increasing capacity during peak periods creating attractive and highly functional inter-modal transfer facilities.
• Coordinating operating schedules to provide more convenience.
• Centralizing and standardizing payment systems into a single common ticket like Hong Kong’s Octopus card, which can be used on all forms of public transport.
• Focusing investment on Highest Feasibility Routes, particularly those that serve key urban nodes and emerging nodes. Examples include extending LRT Line 1 south to Cavite, accelerating construction of Line 7 (or a BRT alternative) north from the center of Metro Manila through Quezon City, and perhaps most importantly, building a new MRT line that connects the Manila Bay waterfront with Makati and Fort Bonifacio. These new lines must be built to international standards and conform to the Department of Transportation and Communication’s (DOTC) rail masterplan.
• Reorganizing existing bus routes to serve key functions including feeding higher-capacity transit lines (e.g., connecting riders with MRT Line 3 along EDSA rather than competing with it) and connecting key nodes where higher-capacity service is unavailable, such as providing trunk service along Alabang-Zapote Road and Quirino Avenue connecting Alabang with LRT Line 1 and the emerging waterfront district.
• Converting existing bus fleets to cleaner fuels, such as the DOTC’s pilot project using Compressed Natural Gas (CNG).
• Realigning jeepney routes to serve intra-nodal trips or short-distance inter-nodal trips.
• Upgrading jeepney drivetrains, moving from polluting diesel and/or petrol to cleaner fuels or electric batteries. For example, e-Jeepneys and hybrid buses are already being used to provide services within Makati while e-trikes service streets of Mandaluyong City and Taguig City.
• Creating viable ferry-based public transport routes that integrate with the existing road and rail network as part of Metro Manila’s flood management investment along the Pasig River and key tributaries such as the Marikina and San Juan Rivers. Waterborne transport has the potential to carry tens of thousands of people per day and alleviate congestion and crowding on buses and jeepneys, if properly implemented with good access (e.g., high-quality piers and walkways) and safe and efficient services.
• Implementing better traffic management practices to improve traffic flows and reduce congestion. Best practices include extensively reviewing traffic signal
Opportunities to Apply the Principles in Metro Manila
The Metro Manila Greenprint 2030: Building a Vision
38
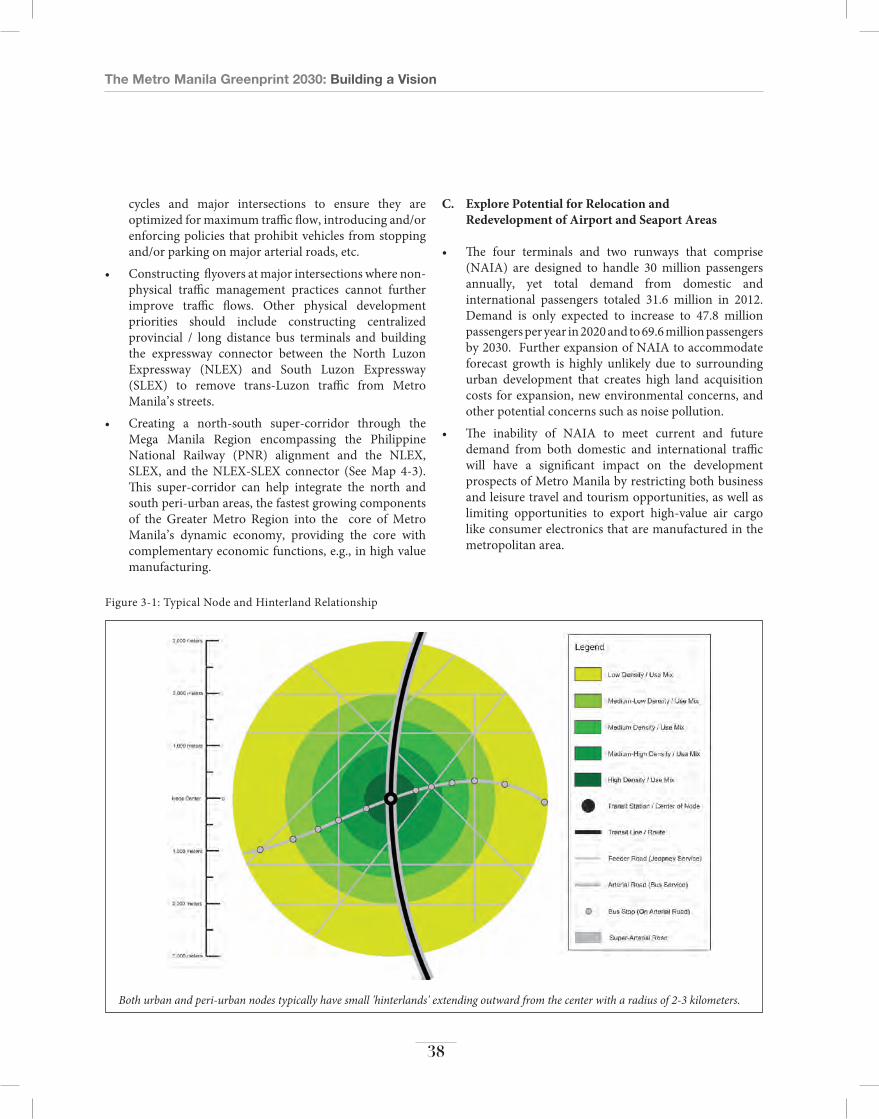
Both urban and peri-urban nodes typically have small 'hinterlands' extending outward from the center with a radius of 2-3 kilometers.
Figure 3-1: Typical Node and Hinterland Relationship
cycles and major intersections to ensure they are optimized for maximum traffic flow, introducing and/or enforcing policies that prohibit vehicles from stopping and/or parking on major arterial roads, etc.
• Constructing flyovers at major intersections where non-physical traffic management practices cannot further improve traffic flows. Other physical development priorities should include constructing centralized provincial / long distance bus terminals and building the expressway connector between the North Luzon Expressway (NLEX) and South Luzon Expressway (SLEX) to remove trans-Luzon traffic from Metro Manila’s streets.
• Creating a north-south super-corridor through the Mega Manila Region encompassing the Philippine National Railway (PNR) alignment and the NLEX, SLEX, and the NLEX-SLEX connector (See Map 4-3). This super-corridor can help integrate the north and south peri-urban areas, the fastest growing components of the Greater Metro Region into the core of Metro Manila’s dynamic economy, providing the core with complementary economic functions, e.g., in high value manufacturing.
c. explore Potential for relocation and redevelopment of airport and seaport areas
• The four terminals and two runways that comprise (NAIA) are designed to handle 30 million passengers annually, yet total demand from domestic and international passengers totaled 31.6 million in 2012. Demand is only expected to increase to 47.8 million passengers per year in 2020 and to 69.6 million passengers by 2030. Further expansion of NAIA to accommodate forecast growth is highly unlikely due to surrounding urban development that creates high land acquisition costs for expansion, new environmental concerns, and other potential concerns such as noise pollution.
• The inability of NAIA to meet current and future demand from both domestic and international traffic will have a significant impact on the development prospects of Metro Manila by restricting both business and leisure travel and tourism opportunities, as well as limiting opportunities to export high-value air cargo like consumer electronics that are manufactured in the metropolitan area.

The Metro Manila Greenprint 2030: Building a Vision
39
• In order to accommodate rising demand for air travel and facilitate continued economic growth in both Metro and Mega Manila, the majority of commercial airport functions at NAIA should be relocated to a site (or sites) that has excellent road and rail access to major urban nodes such as Makati and Fort Bonifacio. Potential relocation options include land reclamation in Manila Bay or Laguna Bay and fully realizing the potential of Clark International Airport near Angeles City.
• If some (or all) of NAIA’s existing airport functions can be successfully relocated, it will create two new major opportunities for economic development: The first opportunity will be in redeveloping part (or all) of the current NAIA site. This land is very valuable and already highly accessible. It could serve a number of functions, including be used to address the existing backlog of affordable and accessing housing in the region. Notably, Metro Manila has already benefited from redeveloping former airports, as the Ayala Triangle in Makati sits on the former site of Nielsen Field, the first airport on Luzon Island.
• The second opportunity would be to create a modern aerotropolis. These types of developments consist of a variety of uses ranging from logistics and manufacturing to offices, residences, and MICE venues. In major global cities, aerotropolis developments can directly employ upwards of 50,000 people, with indirect employment being several times higher. In other Southeast Asian cities like Bangkok and Jakarta, aerotropolis has resulted in substantial job creation and new suburban nodes with more than a million people.
Metro Manila possesses a large number of existing urban and peri-urban centers that can be characterized as 'nodes' or concentrations of various kinds of activities. Urban nodes typically feature dense concentrations of economic activities such as in Makati and Eastwood, cultural activities such as the 'Identity Districts' put forth earlier, and leisure activities, including shopping, dining, and entertainment, such as the node along MRT3 at Trinoma / SM North. Mixed in with these dominant uses are a range of other elements, such as residential areas and community services. In creating a green metropolis, these nodes and hinterlands must feature variable population, job, and activity densities.
Map 3-1: Major Urban centers and Public Transport links in Metro Manila
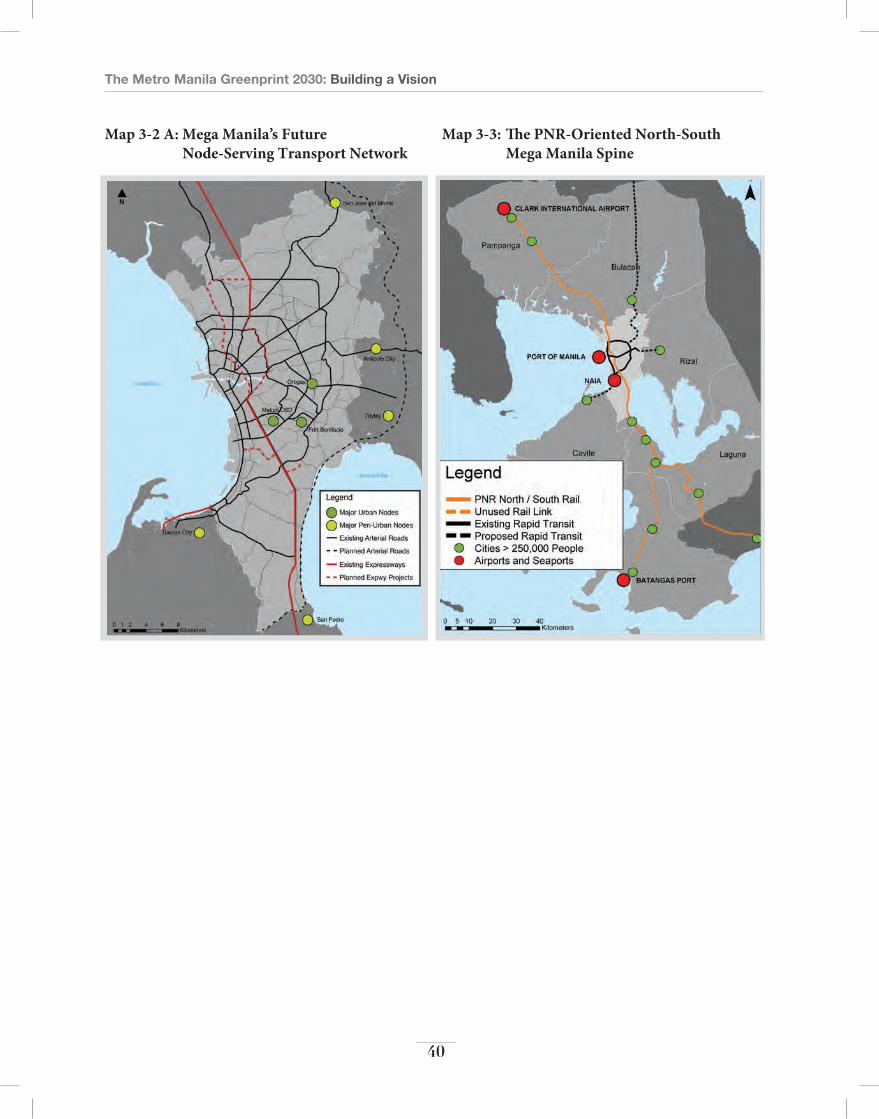
The Metro Manila Greenprint 2030: Building a Vision
40
Map 3-2 a: Mega Manila’s Future node-serving Transport network
Map 3-3: The Pnr-oriented north-south Mega Manila spine

The Metro Manila Greenprint 2030: Building a Vision
41
What is Transit-oriented Development (ToD)?
The guiding principle behind creating TODs is to create a sense of place that serves as a natural draw for people and firms. Typical successful TODs around the world share a number of key characteristics including:
• A pedestrian-friendly environment, with safe, high-quality pavements, excellent wayfinding sig-nage, and adequate protection from climate (e.g., tree shading, building facade overhangs, etc);
• Excellent urban design standards and aesthetics;
• Strong branding and marketing to promote a dis-tinct image for the development that will attract an array of new residents and firms;
• Access to rapid transit (e.g., MRT, LRT, BRT) as the anchor amenity, which provides safe, reliable, and efficient access; and
• A high-density, mixed-use environment.
Map 3-2 B: Mega Manila’s Future node-serving Transport network

The Metro Manila Greenprint 2030: Building a Vision
42
Hong Kong's Causeway Bay MTR High-Density Mixed-Use Development
Hong Kong's Causeway Bay, once a silted bay with a small fishing village on its shores, is now a heavily built-up urban area home to Hong Kong's main shopping district, with retail rents second only to New York City's Fifth Avenue.
As the name implies, much of the land Causeway Bay now encompasses was reclaimed, an effort which began with a causeway in the 1950s (now Causeway Road) and later expanded to include the area that is now Victoria Park. In 1973 the Cross-Harbour Tunnel opened, connecting the area with Kowloon two kilometers away, and in 1985, the Causeway Bay station of the MTR Island line followed.
Causeway Bay today is home to some office space and notable hotel properties (e.g. the Excelsior), but shopping is the primary attraction, much of which is located directly on top of (using air rights) the MTR maintenance depot at the station serving this area. Home to major retail properties like the Japanese-owned Sogo, a 13-storie mall, and the Times Square complex, which mixes retail with office space. Retail rents are so high that some major international retailers setup 'pop-up shops' where they rent space for only a couple of months to test demand before committing to sky-high rents.
Redevelopment Opportunity for the Airport(s) and Port Facilities in Manila
The Port of Manila and its associated facilities such as the Manila International Container Terminal (MICT) account for the majority of domestic and international waterborne freight movements in the country. The presence of heavy trucks serving the Port account for more than 40 percent of traffic on major arterial roads in the area, leading to serious traffic congestion and average road speeds of between 10 and 20 kilometers per hour. With port traffic growing by more than 6 percent annually, much, if not all port functions should be relocated to other major ports in the region such as Subic Bay and Batangas, which are vastly under-utilized at present. Such an initiative is supported by recent research conducted by Japan International Cooperative Agency (JICA) for the Department of Transportation and Communication (DOTC) and the National Economic and Development Authority (NEDA).
Freeing up the existing port area for redevelopment will create inner city development space for city building and reduce traffic congestion created by heavy trucks moving goods to and from the port. In particular, the freed up land should be utilized to develop innovative, green smart, mixed-use urban communities to showcase the fact that Metro Manila is a leading edge player in smart green urbanization.
In sum, if all NAIA and Port of Manila facilities are fully relocated to other parts of Mega Manila, more than 800 hectares of accessible urban space could be made available for redevelopment, representing a key opportunity to promote the social, economic, and environmental objectives of the Greenprint.

The Metro Manila Greenprint 2030: Building a Vision
43
5. Making Metro Manila Inclusive
Goal
To create inclusive communities through mixed-use, mixed-income, and variable density nodal development capitalizing on opportunities to engage stakeholders and utilize land readjustment practices across Metro Manila’s existing socio-economic spatial structure.
Background
Major opportunities lie in redeveloping underutilized lands in Metro Manila. There is an urgent need to improve living conditions for the cities’ urban poor as well as utilize land more efficiently. National agencies are moving towards policies for on-site redevelopment, in line with the global move away from distance relocation approaches. Upgrading informal settlements will provide more decent living conditions for a significant portion of the cities’ population while unlocking value land for other uses. Development of housing and other infrastructure in turn creates a job market that can be an important driver of the urban economy as seen in other countries such as China where nearly 50 percent of the GDP is generated by investment in infrastructure, property, and production facilities. Employment in urban construction activities, particularly during times of rapid city-building, can account for nearly 10-12 percent of employment worldwide. City building efforts on a wide scale will require land readjustment policies. These policies can help unlock around USD200 billion in underutilized land across Metro Manila.
Large-scale in-situ redevelopment has the potential to add hundreds of billions of dollars to the regional economy by unlocking land value through the sale and development of under-utilized land, corresponding jobs that will be created by new construction activities, and the potential industries/services that could locate to these areas. Investment in housing produces high returns; it is estimated that for every PHP1 invested in housing development, the multiplier effect is two times in terms of other investments in related
industries. Redeveloping underutilized land provides an opportunity to address the current housing backlog of more than half a million units by channeling some of the unlocked value back into housing production.
Helping rebuild communities where they already exist, introducing higher densities and alternative uses, and creating more jobs will produce a dynamic, integrated Metro Manila.
The Metro Manila Greenprint 2030: Building a Vision
44
Principles
P1. leverage opportunities to Unlock Huge land Values through in-situ redevelopment and catalytic infrastructure Development
• Maintain the existing spatial intermixing of Metro Manila’s socio-economic classes. Building on the spatial foundation of the existing multi-modal development pattern, nodes and their hinterlands must possess variable densities and land use mixes.
• Promote in-situ redevelopment of low-income neighborhoods. This approach allows these groups to be close to jobs and economic opportunities, rather than being relocated to peri-urban areas, where they are devoid of basic amenities and livelihood opportunities. Higher-densities result from these processes and will generate more vital, urbane, creative human-centered street environments, and vastly improved environmental (green) performance. With additional land created through densification and better land use planning, the private sector will be free to develop high-rise apartments and condominiums that attract middle class residents to new areas.
• Redevelop NAIA to create new housing and other types of land uses. As discussed in the previous section, lands associated with existing airports including areas adjacent to the airports offer significant opportunities for redevelopment. If some (or all) of NAIA’s existing airport functions are relocated in the future, the airport site can be redeveloped for alternative uses. Further, there is a strong potential to foster airport-oriented development, known as an ‘aerotropolis’ which can create tens or even hundreds of thousands of jobs and shift the spatial development trajectory of the metropolis as it has in Bangkok and Jakarta.
• Implement land readjustment to undertake in-situ redevelopment. The basic principle is to organize landowners to act collectively, in cooperation with a municipality and/or private developer to pool their land in order to accomplish a redevelopment project. Land readjustment offers a less challenging alternative to land expropriation, which often encounters strong opposition from landowners, can result in project delays, and potentially higher project costs. Land readjustment was popularized by Japanese urban planners in the 1960s and 1970s and has since been practiced in many countries to achieve policy objectives ranging from farmland consolidation to inner-city revitalization.
P2. city-Wide informal settlement Upgrading
• Move from ad-hoc, project-based approach to a city-wide, programmatic approach. Global experience has shown that city-wide upgrading holds the promise to achieve results at scale. Success stories from Thailand Community Organizations Development Institute (CODI), Ahmadabad, India; Sao Paulo, Brazil; among others, demonstrate how city-wide upgrading leads to more substantial results and wider development impacts than what individual communities or scattered pilot projects are able to achieve. The city-wide approach warrants leadership of the Local Government Units, more voice from broadly based urban poor NGO and people’s organization networks, partnership with all key stakeholders to plan and problem solve together, pooled community saving schemes, and economy of scale in service provision.

The Metro Manila Greenprint 2030: Building a Vision
45
Disiplina Village, Valenzuela City
Land readjustment and corresponding in-situ redevelopment principles have been applied extensively in suburban Tokyo to combat urban sprawl since the 1960s; indeed, in Japanese, land readjustment is referred to as “the mother of all city planning” and it is estimated that one-third of urban areas have been redeveloped through land readjustment.
The concept is that after landowners have pooled their land, roads and infrastructure are added to the combined area. The remaining land is then re-divided to create upgraded plots. Land readjustment has been a largely successful tool to encourage infill development and add density in underutilized areas. Examples abound at both the small and large scales in urban and suburban Tokyo, led both by private consortiums and public (planning) associations.
in-situ redevelopment in the Tokyo Metropolitan area
One such example is Tama New Town. Designed in the 1960s as a planned alternative to the rapid urban sprawl resulting from rising central Tokyo land prices, three different government bodies planned and executed the large scale land readjustment and development process over more than three decades. The result today is 21 neatly divided neighborhoods, each providing its own public facilities and social services (e.g. schools, post offices, etc.), a high degree of transit integration with mixed-use development around the new town’s four transit stations, and praise for the distinct variety of housing options available. The development’s 200,000 residents make it the largest residential development in Japan by population.
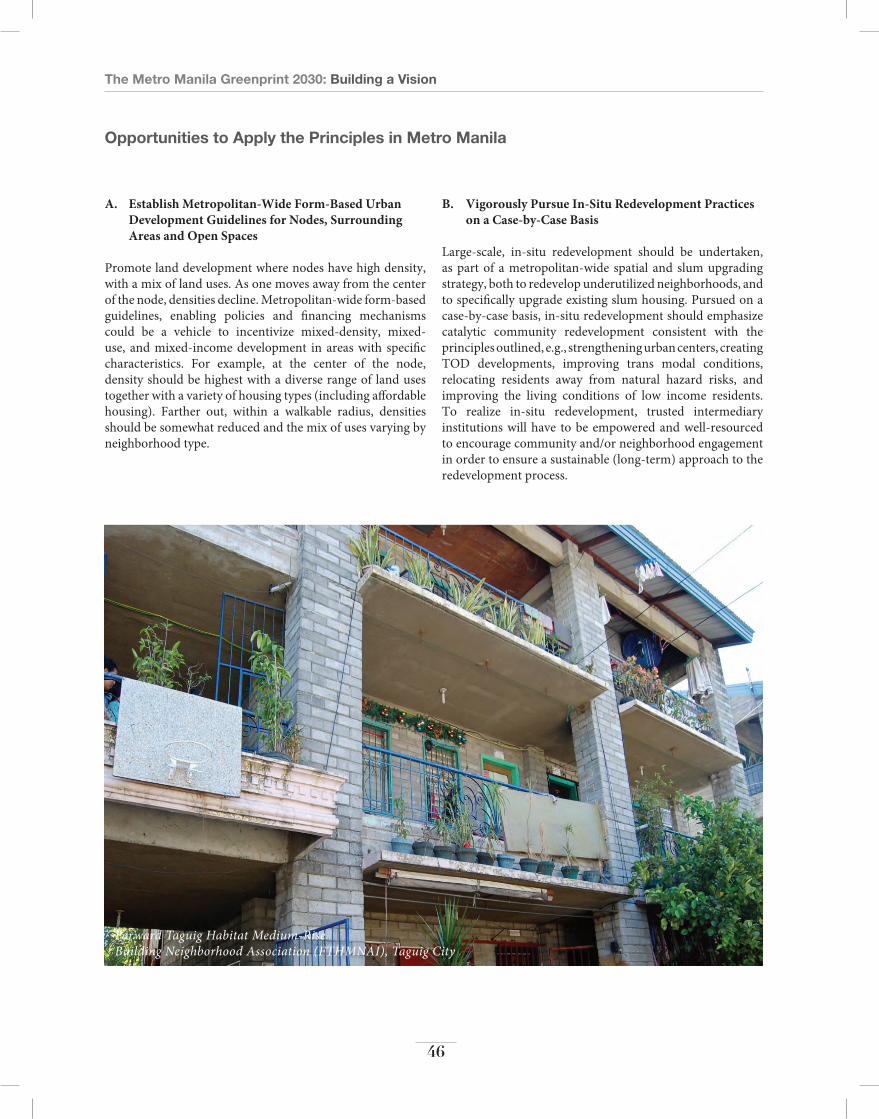
The Metro Manila Greenprint 2030: Building a Vision
46
Forward Taguig Habitat Medium-Rise Building Neighborhood Association (FTHMNAI), Taguig City
a. establish Metropolitan-Wide Form-Based Urban Development Guidelines for nodes, surrounding areas and open spaces
Promote land development where nodes have high density, with a mix of land uses. As one moves away from the center of the node, densities decline. Metropolitan-wide form-based guidelines, enabling policies and financing mechanisms could be a vehicle to incentivize mixed-density, mixed-use, and mixed-income development in areas with specific characteristics. For example, at the center of the node, density should be highest with a diverse range of land uses together with a variety of housing types (including affordable housing). Farther out, within a walkable radius, densities should be somewhat reduced and the mix of uses varying by neighborhood type.
Opportunities to Apply the Principles in Metro Manila
B. Vigorously Pursue in-situ redevelopment Practices on a case-by-case Basis
Large-scale, in-situ redevelopment should be undertaken, as part of a metropolitan-wide spatial and slum upgrading strategy, both to redevelop underutilized neighborhoods, and to specifically upgrade existing slum housing. Pursued on a case-by-case basis, in-situ redevelopment should emphasize catalytic community redevelopment consistent with the principles outlined, e.g., strengthening urban centers, creating TOD developments, improving trans modal conditions, relocating residents away from natural hazard risks, and improving the living conditions of low income residents. To realize in-situ redevelopment, trusted intermediary institutions will have to be empowered and well-resourced to encourage community and/or neighborhood engagement in order to ensure a sustainable (long-term) approach to the redevelopment process.

The Metro Manila Greenprint 2030: Building a Vision
47
The Baan Mankong (secure housing) program, launched by the Thai Government in 2003, centers on providing infrastructure subsidies and soft housing and land loans to low-income communities to support upgrading in-situ wherever possible and, if not, to develop new homes close by. To date, it has implemented upgrading projects in 286 cities and towns, in 72 of the country's 77 provinces, providing secure housing to 93,100 households. The Community Organizations Development Institute (CODI) helps the poor communities work closely with their local governments, professionals, government agencies, universities and NGOs to survey the communities in their individual cities and then plan an upgrading process which attempts to improve the city's poor communities. CODI provides support not only to community organizations formed by the urban poor for projects but also to their networks, to allow them to work with city authorities and with national agencies on city-wide upgrading programs. These city-wide networks also link communities so they can share their experiences, learn from each other, work together, and pool their resources. The city-wide approach, combined with flexible finance, savings groups, and technical support, are the essential elements in the success of the Baan Mankong program.
According to the National Informal Settlement Upgrading Strategy report, over three million of Metro Manila's inhabitants are informal settlers. This means an estimated three million people are living in substandard living conditions with poor sanitation, overcrowding and crude habitation, inadequate water supply and insecurity of tenure. Around half a million of these informal settlers are living in dangerous areas such as waterways, canals or 'esteros' and under the bridges. The Subdivision and Housing Developers Association argues that instead of forcefully evicting or transferring informal communities to far-off locations away from their source of livelihood, in-situ housing is the better option towards slum rehabilitation. SHDA launched October 2012 "The Housing Industry Roadmap 2012-2030" to address the huge backlog on housing (6.5 million units at national level, if unaddressed by 2030), while providing informal settlers with more decent housing through more supportive government policies on in-situ/ on-site settlement, helping speed up housing production, land retitling, public-private partnerships, financial aid package, coupled with supportive public/private/social sectors in making the Roadmap's vision a reality.
The Subdivision and Housing Developers Association (SHDA): The Private Sector Approach to Transforming Informal Settlements and Reducing the Housing Backog
Baan Mankong: Thailand’s Citywide Community-Driven Slum Upgrading and Community Housing Development
The Metro Manila Greenprint 2030: Building a Vision
48
6. Creating a Resilient Metropolis
Goal
Adopt a comprehensive approach to disaster resilience that includes decisive action and investment in risk reduction infrastructures and in improving living conditions and livelihoods of those in danger areas.
Background
The Philippines experiences various types of natural hazards. Due to its physical environment and geographical location along the Pacific Ring of Fire, it is vulnerable to earthquakes, tsunamis and volcanic eruptions.
The country also lies along the Western Pacific Basin, a generator of climatic conditions such as typhoons, monsoons, and severe thunderstorms. Twenty typhoons on average reach the Philippines every year, of which around four to six are destructive. Around four to six typhoons on average make landfall in or near Metro Manila annually.
Metro Manila is highly vulnerable to natural hazards. These events damage properties, causes epidemics and widespread diseases and result in substantial loss of life. Moreover, disasters disrupt economic activities thereby affecting the overall growth and development in the
region. During Typhoon Ondoy in 2009, 450 mm of rainfall was recorded by the Manila Observatory in a single eight hour period, an event that statistically occurs once every 180 years, making Typhoon Ondoy the worst recorded calamity in Metro Manila. The rains caused the Marikina and Pasig Rivers to exceed their carrying capacity and resulted in floods all across Metro Manila as well as the neighboring provinces of Laguna, Bulacan and Rizal.
Metro Manila is also traversed by the Valley Fault System making it prone to strong earthquakes. An earlier study found that in a ‘do nothing’ scenario, a 7.2 magnitude earthquake at the West Valley Fault may result in the death of 34,000 people and injure another 114,000, in addition to destroying or damaging buildings and infrastructure. Further, fires associated with the earthquake may spread through approximately 1,710 hectares of property, injuring and/or killing an additional 18,000 people.

The Metro Manila Greenprint 2030: Building a Vision
49
MMDA Emergency Preparation
Principles
P1. Promote Better Understanding of the risks and their impacts on the overall sustainability and competitiveness of Metro Manila
Metro Manila accounts for over 30 percent of the country’s GDP and is the country’s premier political, economic, and financial center. With the vision to make it at par with its Asian neighbors, understanding the risks it faces is important to motivate decision-makers and investors on the urgency and necessity to mitigate and reduce disaster impacts over time. If fundamental sources of risks are not addressed, disasters can lead to significant infrastructure damages, disrupt economic activities, and adversely impact residents, resulting in billions of dollars of losses and foregone incomes. For example, in the aftermath of Typhoons Ondoy and Pepeng, the World Bank estimated that the total cost of storm-related damages and losses in the Metro Manila region amounted to USD 4.38 billion (PHP 206 billion), or 2.7 percent of national GDP in 2009. Of this total, 43 percent came from the Commerce (services) sector, while housing and transport accounted for a further 17 percent of total damages and losses.
P2. encourage investment in Disaster risk reduction Programs
The vulnerability of Metro Manila is largely a function of its unplanned urbanization, environmental degradation, and inadequate infrastructure related measures. There is an urgent need to reduce vulnerabilities associated with natural hazards, particularly flooding and earthquakes, through a combination of structural and non-structural measures. A recent Master Plan for Flood Management in Metro Manila and Surrounding Areas prepared by Government of Philippines outlines such measures and identifies potential costs of undertaking the measures at USD 8.2 billion. This will be a relatively small investment for a metropolis the size of Mega Manila particularly as it will avoid or reduce future disasters that will be significantly more damaging.
The Metro Manila Greenprint 2030: Building a Vision
50
P3. engage community-level Participation in adaptation and Mitigation efforts
Empowering communities to reduce their own risks is an important feature of any meaningful risk reduction program. Community-based and participatory approaches that engage communities in decision-making, implementation, and monitoring ensure the alignment of centrally-driven investments and bottom-up demands, facilitate speed and quality of implementation, and promote accountability and transparency.
P4. implement risk-sensitive land Use Guidelines and encourage Private sector cooperation to Prevent Future encroachment
Increase coordination among decision makers. The MMDA,HLURB (Housing, and Land Use Regulatory Board), and relevant LGUs should work together to develop an appropriate set of risk-sensitive/responsive land use guidelines and zoning ordinances to mitigate future adverse impacts from natural hazards. These guidelines must be strictly enforced by each LGU.
Establish appropriate arbitration mechanisms for when land use conflicts arise. Insurance companies should be involved, and convinced to issue no new policies in high-risk areas.
Prevent new communities from settling in high-risk areas, including ‘temporary’ informal settlements.
Enforce seismic building codes. Given the high risk of earthquakes, with particular risk along well-identified seismic faults in Metro Manila, it is imperative to follow seismic building codes.
P5. Build redundancy in lifeline systems
Lifeline systems pertain to the network of critical city infrastructure, such as electrical power, gas and liquid fuels, telecommunications, transportation, waste disposal, and water supply. During times of disaster, this critical infrastructure network becomes stressed. It is important that these systems have contingency plans where a failure in any one part during a disaster does not affect the overall network, and services can continue to be delivered to the population.

The Metro Manila Greenprint 2030: Building a Vision
51
Informal settlements along the Pasig River
a. embrace opportunities to Provide affected residents with Better Housing and access to Jobs through in-situ redevelopment and relocation
As indicated by the recent Master Plan for Flood Management in Metro Manila and Surrounding Areas, regular flooding in Mega Manila directly impacts as many as 2.4 million people. Flood management projects outlined in the report indicate that as many as 610,000 people will need to be resettled. Some of these residents will be able to benefit from in-situ redevelopment while the remainder should be encouraged to locate in existing or new urban / peri-urban nodes. Such redevelopment and relocation will require a significant influx of new housing units and upgrading of existing housing units in the region. Both the government and private sector should embrace this opportunity to make major infrastructure investments and to pursue smarter and greener urban planning practices aimed at making the metropolis safer and more livable.
B. invest in resilient infrastructure
Engineers have long tried to design infrastructure to withstand extreme forces, but recently they have begun to address the need for urban infrastructure systems that are resilient to disasters. Conceptually, resilience entails three interrelated dimensions: lower probabilities of failure; less-severe negative consequences when failures do occur;
Opportunities to Apply the Principles in Metro Manila
and faster recovery from failures. New infrastructure can be disaster and climate resilient by ensuring that it will be located, designed, built and operated within the current and future weather conditions in mind. On the other hand, existing infrastructure can be resilient by ensuring that resilience is incorporated in maintenance practices over the life of the asset.
Mega Manila presents a tremendous opportunity for investments that are aimed at addressing the region’s vulnerabilities to existing natural hazards. Investments in improving the conditions of roads, bridges, electrical power systems and other such essential infrastructure will reduce risks related to loss of lives, physical damage and interruptions in critical socio-economic services. Additionally, an influx of funds towards infrastructure improvements can serve as an important driver of the region’s economy and can have a positive effect on the economic resilience of the country as well.
The public sector will need to work on improving infrastructure designs and standards, stringent enforcement of building codes, as well as develop land use and zoning policies to reduce exposure of people and property to natural disasters. The private sector can contribute by raising capital and bringing technical know-how on how to improve resiliency in infrastructure.

The Metro Manila Greenprint 2030: Building a Vision
52
Map 4-1: Master Plan for Flood Management in Metro Manila and surrounding areas
Flood Risk Map by Overflow from Major Rivers-Risk Level on Danger of Casualty
The Metro Manila Greenprint 2030: Building a Vision
53
SeCTionthreeKey Synergies
Rizal Park, Manila City
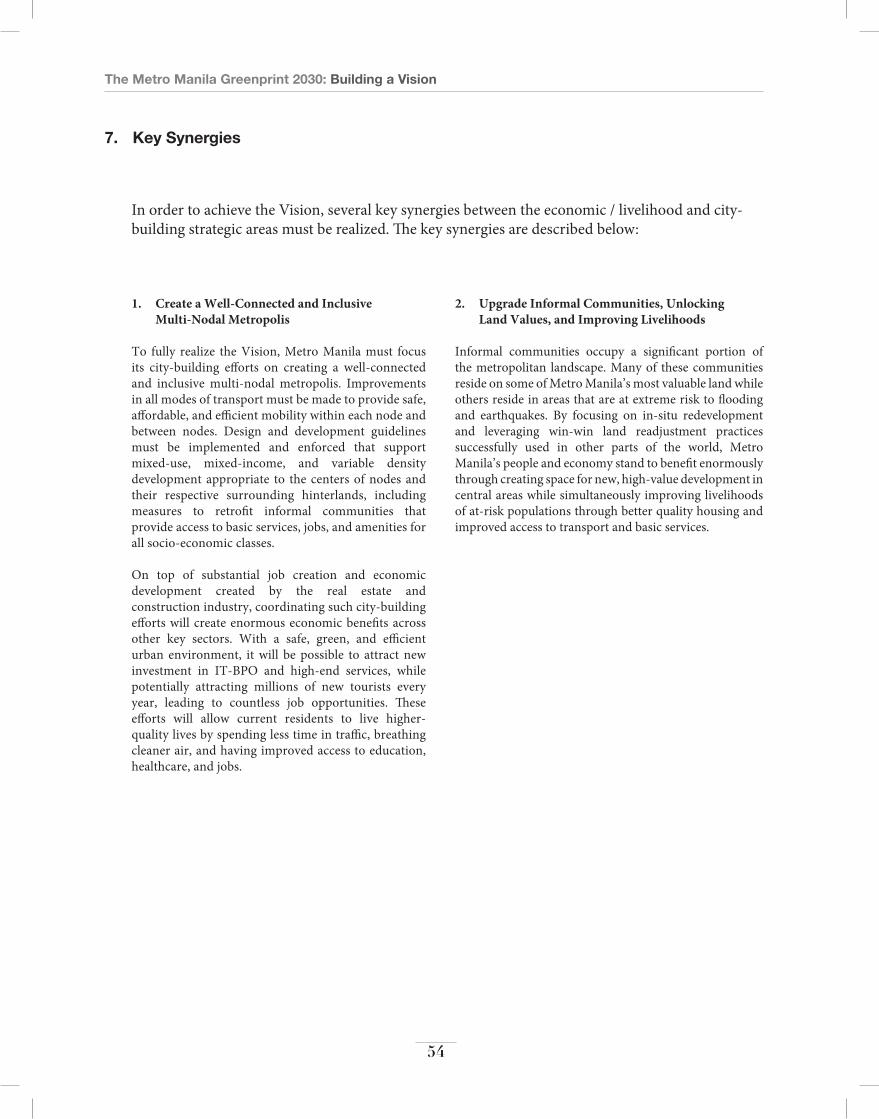
The Metro Manila Greenprint 2030: Building a Vision
54
1. create a Well-connected and inclusive Multi-nodal Metropolis
To fully realize the Vision, Metro Manila must focus its city-building efforts on creating a well-connected and inclusive multi-nodal metropolis. Improvements in all modes of transport must be made to provide safe, affordable, and efficient mobility within each node and between nodes. Design and development guidelines must be implemented and enforced that support mixed-use, mixed-income, and variable density development appropriate to the centers of nodes and their respective surrounding hinterlands, including measures to retrofit informal communities that provide access to basic services, jobs, and amenities for all socio-economic classes.
On top of substantial job creation and economic development created by the real estate and construction industry, coordinating such city-building efforts will create enormous economic benefits across other key sectors. With a safe, green, and efficient urban environment, it will be possible to attract new investment in IT-BPO and high-end services, while potentially attracting millions of new tourists every year, leading to countless job opportunities. These efforts will allow current residents to live higher-quality lives by spending less time in traffic, breathing cleaner air, and having improved access to education, healthcare, and jobs.
2. Upgrade informal communities, Unlocking land Values, and improving livelihoods
Informal communities occupy a significant portion of the metropolitan landscape. Many of these communities reside on some of Metro Manila’s most valuable land while others reside in areas that are at extreme risk to flooding and earthquakes. By focusing on in-situ redevelopment and leveraging win-win land readjustment practices successfully used in other parts of the world, Metro Manila’s people and economy stand to benefit enormously through creating space for new, high-value development in central areas while simultaneously improving livelihoods of at-risk populations through better quality housing and improved access to transport and basic services.
7. Key Synergies
In order to achieve the Vision, several key synergies between the economic / livelihood and city-building strategic areas must be realized. The key synergies are described below:
The Metro Manila Greenprint 2030: Building a Vision
55
3. Target Public Policy and Public investment support to cluster-oriented Globally competitive economic activities
Target public policy / investment support to globally competitive activities. Public sector stakeholders cannot pick winners but should ensure that economic activities, particularly manufacturing and IT-BPO, are provided with competitive incentives and world-class infrastructure, e.g., telecommunications, road transport to ports, etc. This needs to be applied both to potential locators, but also to retain and induce expansion of current firms.
More specifically, the national government needs to take action (regulatory, labor, human resources, energy pricing, etc.) to restore the Philippines’ competitiveness in high-value manufacturing, focusing on economic clusters with potential. To support these actions, the physical quality of industrial zones must be improved to be competitive with leading East Asian production environments- particularly in terms of the supply chain ecosystem like employee access to housing and mass transit, reliable truck access for just-in-time production, access to port and airport facilities, world-class telecommunications, green smart urban and building infrastructure, environmental facilities such as solid waste management and hazardous waste disposal, etc.
4. create resilient communities and industries
Given the importance of Metro Manila within the national social and economic hierarchy, a range of efforts that build on cooperation among between public, private, academic, non-profit, and multi-lateral stakeholders must be pursued to create resilient communities that are safe, comfortable, and accessible places for citizens from all walks of life to live and play, and resilient industries that continue to function efficiently throughout periods of potential disruption caused by natural hazards. These efforts should take place from the bottom-up and from the top-down.
Local residents must be engaged and empowered to improve quality of life in all areas, but particularly those most affected by severe natural hazards. Local businesses should work together to improve the urban environment to attract new tourists, new investment, and to protect themselves from the effects of natural hazards. The metropolitan and local governments should assist residents and firms by providing the knowledge and resources necessary to engage, collaborate, and empower stakeholders in tackling major resiliency issues and should use their authority to ensure a higher-quality, more inclusive, and more risk-sensitive urban form through the development and enforcement of appropriate land use guidelines and zoning ordinances.

The Metro Manila Greenprint 2030: Building a Vision
56
8. Moving Forward
The next step is to develop a spatial strategy to make the Vision a reality.
In the next phase of this project, MMDA will be working with global experts, national agencies, local government units, and the public to develop long-term strategies towards common goals related to inclusivity, connectivity, and resiliency.
Over the next year, MMDA will host workshops, consultations, and events to coordinate with and listen to stakeholders. This process will play an important role in the development of the Greenprint 2030, which will be released in 2015.

SeCTion fourBackground Documentation
• PhaseIProcess
• Sources
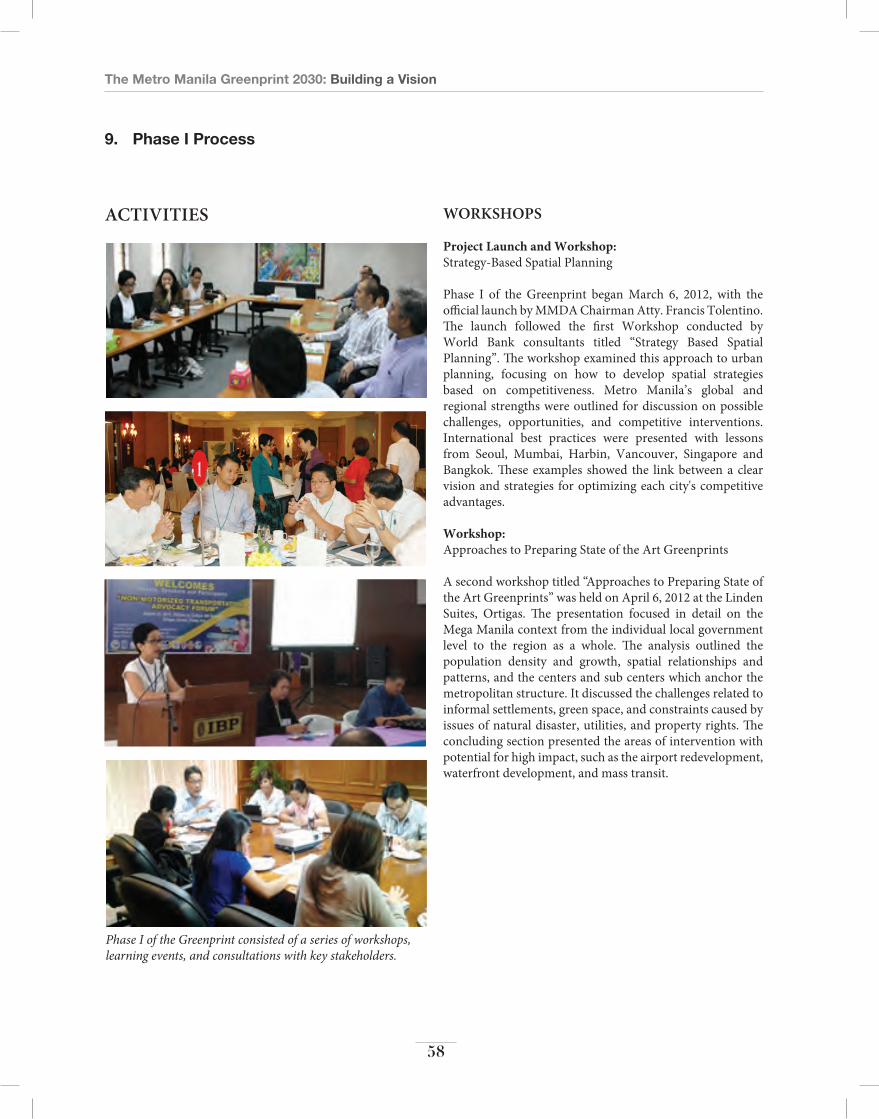
The Metro Manila Greenprint 2030: Building a Vision
58
9. Phase I Process
ActIvItIeS Workshops
Project launch and Workshop: Strategy-Based Spatial Planning
Phase I of the Greenprint began March 6, 2012, with the official launch by MMDA Chairman Atty. Francis Tolentino. The launch followed the first Workshop conducted by World Bank consultants titled “Strategy Based Spatial Planning”. The workshop examined this approach to urban planning, focusing on how to develop spatial strategies based on competitiveness. Metro Manila’s global and regional strengths were outlined for discussion on possible challenges, opportunities, and competitive interventions. International best practices were presented with lessons from Seoul, Mumbai, Harbin, Vancouver, Singapore and Bangkok. These examples showed the link between a clear vision and strategies for optimizing each city's competitive advantages.
Workshop: Approaches to Preparing State of the Art Greenprints
A second workshop titled “Approaches to Preparing State of the Art Greenprints” was held on April 6, 2012 at the Linden Suites, Ortigas. The presentation focused in detail on the Mega Manila context from the individual local government level to the region as a whole. The analysis outlined the population density and growth, spatial relationships and patterns, and the centers and sub centers which anchor the metropolitan structure. It discussed the challenges related to informal settlements, green space, and constraints caused by issues of natural disaster, utilities, and property rights. The concluding section presented the areas of intervention with potential for high impact, such as the airport redevelopment, waterfront development, and mass transit.
Phase I of the Greenprint consisted of a series of workshops, learning events, and consultations with key stakeholders.

The Metro Manila Greenprint 2030: Building a Vision
59
Workshop: Greenprint Vision
The Metro Manila Greenprint Visioning Workshop took place on May 25, 2012 at the Discovery Suites, Ortigas. Following the round of consultations with different stakeholders, the revised Greenprint Vision was presented to participants and final feedback taken pertaining to the vision.
LeArnIngeventS
“Best Practices from Mexico and Brazil”
Learning events complimented the development of the Greenprint vision. On June 28, 2012 at the World Bank Office in Ortigas, MMDA invited stakeholders to hear best practices from Guadalajara, Mexico and Curitiba, Brazil. Osvaldo Navaro Alves an architect, urban planner, and the former President of the Institute for Urban Planning and Research in Curitiba, Brazil shared the Brazilian experience tackling transportation issues, focusing on the process of creating a rapid bus transit system. Luis Felipe Sequeiros a renowned urban planner and practitioner, a national award recipient for best local practices, and the current head of the Guadalajara 2020, shared metropolitan planning experiences in developing the long-term strategy for Guadalajara.
“Metro Manila: Welcome to YoUr Megacity”
Associate Director for Urban Development at the Rockefeller Foundation, Benji de la Peña, gave a talk for a group of government and private sector agencies on August 23, 2013 at the MMDA Office in Makati City. The talk focused on how to solve pressing urban problems through bottom-up innovative processes and reframe them in a dynamic, complex-adaptive context. Pena showed that Metro Manila is not experiencing its urban challenges in a vacuum; other cities around the world are struggling to address transport, informal settlements, and other quality of life issues. Pena advocates for a renewed perspective of how to approach these issues and shared his thoughts on how to make Metro Manila a successful megacity.
conSuLtAtIonS
One-on-one consultations with national government agencies, local government units, private sector leaders, civil society organizations, and academe were faciliated as part of the visioning process. These consultations affirmed the pressing issues and concerns on housing backlogs and informal settlers, mobility and traffic management, accessibility and transportation, and in particular disaster risk management and vulnerability, and the need for a Greenprint to guide Metro Manila’s development.
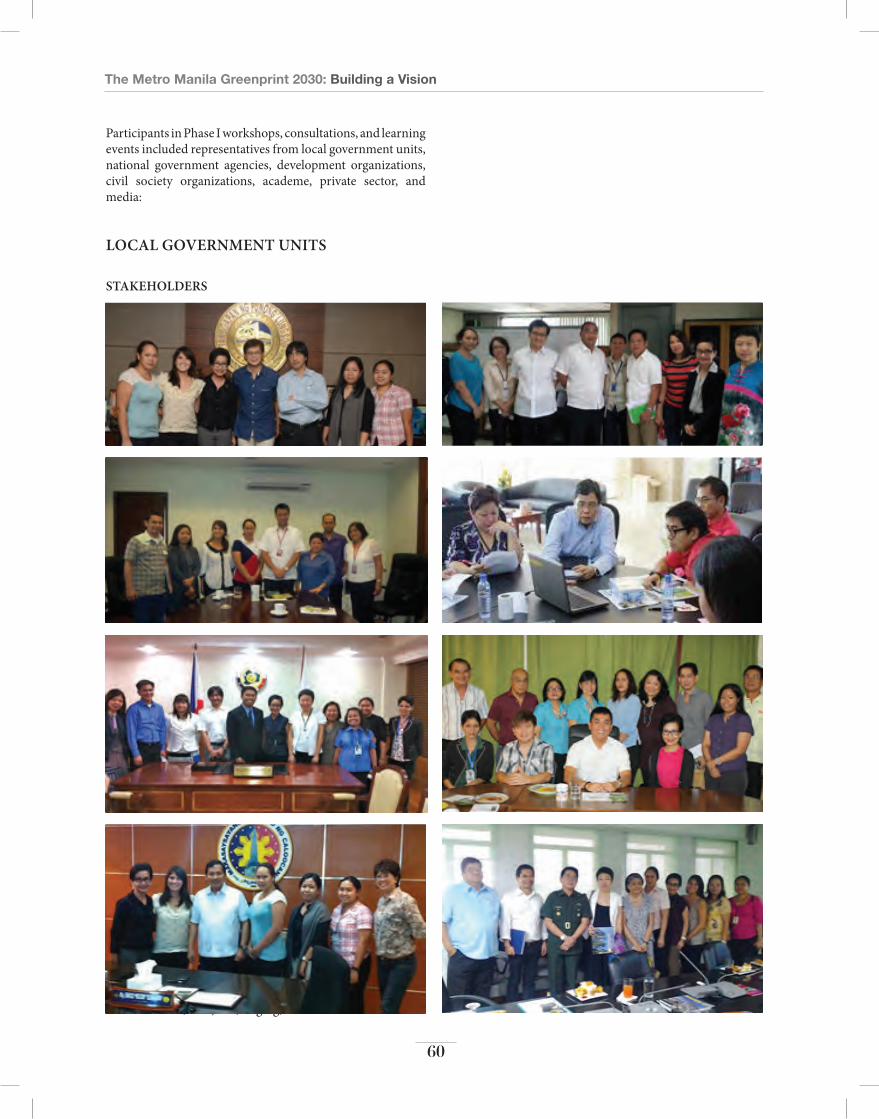
The Metro Manila Greenprint 2030: Building a Vision
60
Caloocan City, Cavite, Makati, Malabon, Manila, Marikina, Muntinlupa, Navotas, Pasay, Pasig, Pateros, Quezon City, Rizal Province, San Juan, Taguig, Valenzuela.
LocALgovernmentunItS
StAKeHoLDerS
Participants in Phase I workshops, consultations, and learning events included representatives from local government units, national government agencies, development organizations, civil society organizations, academe, private sector, and media:

The Metro Manila Greenprint 2030: Building a Vision
61
nAtIonALAgencIeS
Bureau of Immigration (BOI)Center for Industrial Competitiveness (CIC)Department of Education (DepEd)Department of Environment and Natural Resources (DENR)Department of Interior and Local Government (DILG) Department of Public Works and Highways (DPWH)Department of Social Welfare and Development (DSWD)Department of Tourism- National Capital Region (DOT-NCR)Department of Trade and Industry (DTI)Department of Transportation and Communication (DOTC) Home Development Mutual Fund (PAG-IBIG)Housing and Land Use Regulatory Board (HLURB) Housing and Urban Development Coordinating Council (HUDCC)Laguna Lake Development Authority (LLDA) League of Cities (LCP)
Light Rail Transit Authority (LRTA) Metropolitan Manila Development Authority (MMDA)National Anti-Poverty Commission (NAPC) National Competitiveness Council (NCC)National Economic Development Authority (NEDA)Philippine Atmospheric, Geophysical and Astronomical Services Administration (PAGASA)Philippine Chamber of Commerce and Industry (PCCI)Department of Energy (DOE)Philippine Institute of Volcanology and Seismology (PHILVOLCS) Philippine Retirement Authority (PRA) Bases Conversion and Development Authority (BCDA)
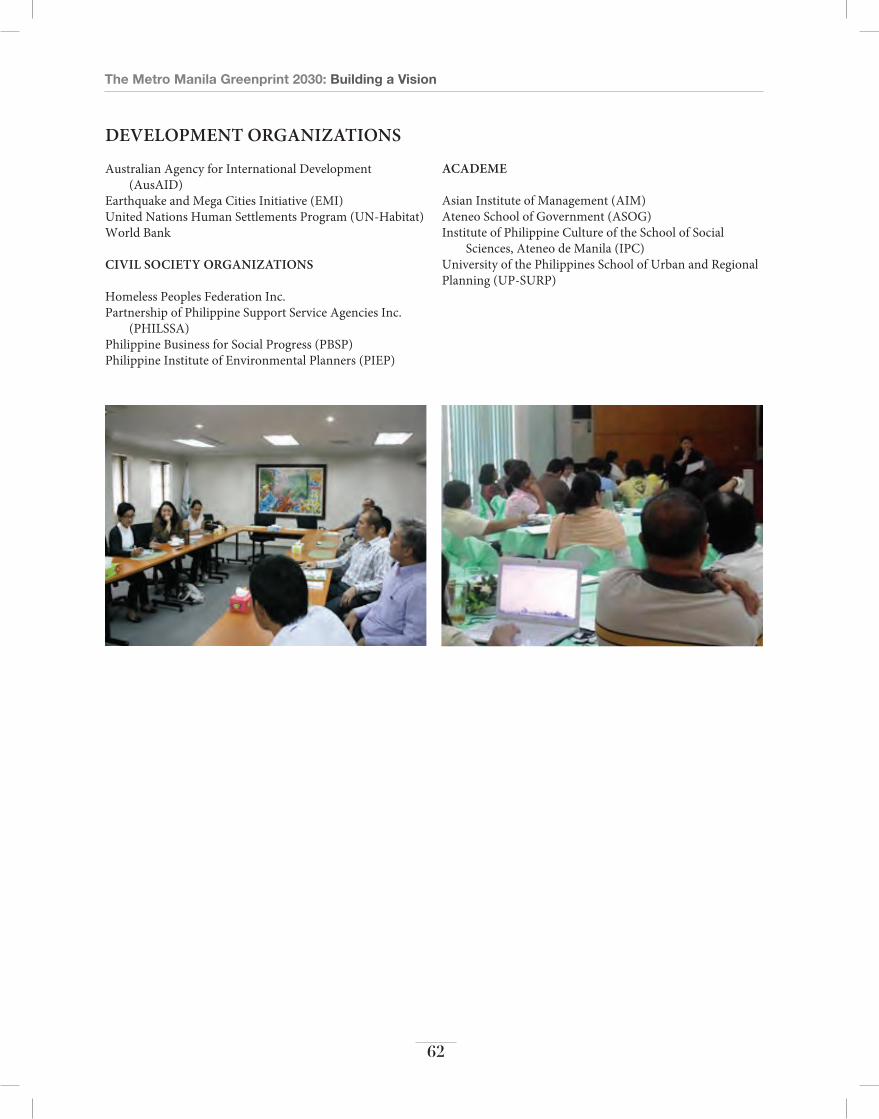
The Metro Manila Greenprint 2030: Building a Vision
62
DeveLoPmentorgAnIzAtIonS
Australian Agency for International Development (AusAID)
Earthquake and Mega Cities Initiative (EMI)United Nations Human Settlements Program (UN-Habitat) World Bank
cIvILSocIetyorgAnIzAtIonS
Homeless Peoples Federation Inc. Partnership of Philippine Support Service Agencies Inc.
(PHILSSA) Philippine Business for Social Progress (PBSP)Philippine Institute of Environmental Planners (PIEP)
AcADeme
Asian Institute of Management (AIM)Ateneo School of Government (ASOG)Institute of Philippine Culture of the School of Social
Sciences, Ateneo de Manila (IPC) University of the Philippines School of Urban and Regional Planning (UP-SURP)
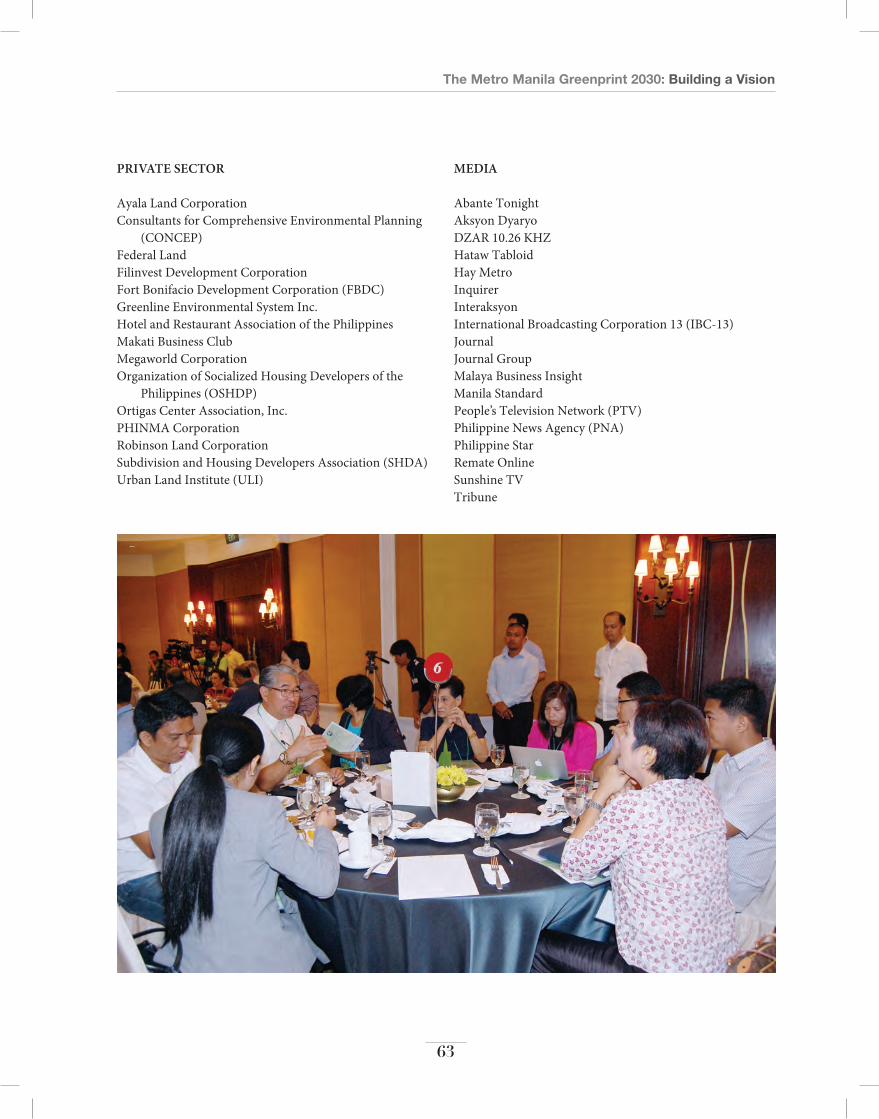
The Metro Manila Greenprint 2030: Building a Vision
63
PrIvAteSector
Ayala Land Corporation Consultants for Comprehensive Environmental Planning
(CONCEP)Federal Land Filinvest Development Corporation Fort Bonifacio Development Corporation (FBDC)Greenline Environmental System Inc. Hotel and Restaurant Association of the PhilippinesMakati Business Club Megaworld Corporation Organization of Socialized Housing Developers of the
Philippines (OSHDP)Ortigas Center Association, Inc. PHINMA Corporation Robinson Land Corporation Subdivision and Housing Developers Association (SHDA)Urban Land Institute (ULI)
meDIA
Abante Tonight Aksyon DyaryoDZAR 10.26 KHZHataw Tabloid Hay Metro Inquirer Interaksyon International Broadcasting Corporation 13 (IBC-13) Journal Journal Group Malaya Business Insight Manila Standard People’s Television Network (PTV)Philippine News Agency (PNA) Philippine Star Remate Online Sunshine TVTribune

The Metro Manila Greenprint 2030: Building a Vision
64
Metro Manila Council passed the MMDA Resolution 12-28 during the Metro Manila Council monthly meeting on November 15, 2012 to express the support for the Greenprint 2030.
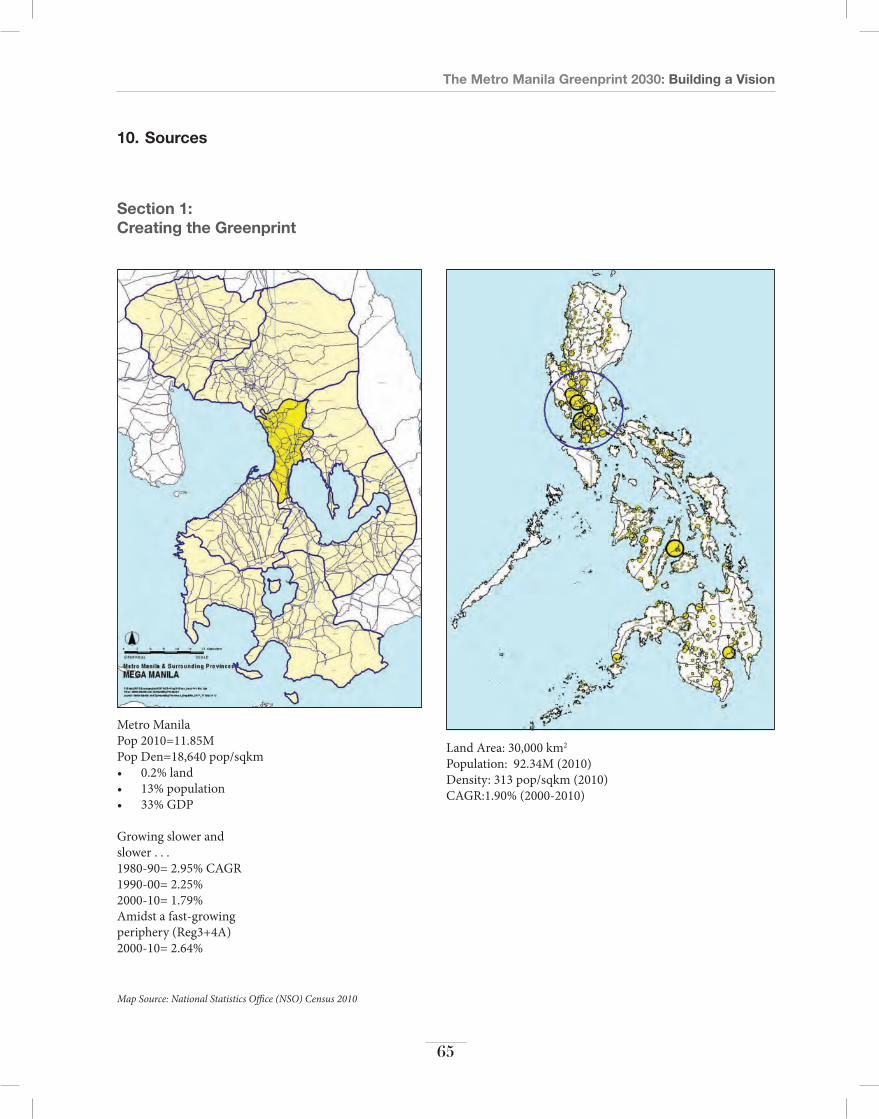
The Metro Manila Greenprint 2030: Building a Vision
65
10. Sources
Section 1: Creating the Greenprint
Metro ManilaPop 2010=11.85MPop Den=18,640 pop/sqkm • 0.2% land• 13% population• 33% GDP
Growing slower and slower . . .1980-90= 2.95% CAGR1990-00= 2.25%2000-10= 1.79%Amidst a fast-growing periphery (Reg3+4A) 2000-10= 2.64%
Land Area: 30,000 km2
Population: 92.34M (2010) Density: 313 pop/sqkm (2010)CAGR:1.90% (2000-2010)
Map Source: National Statistics Office (NSO) Census 2010
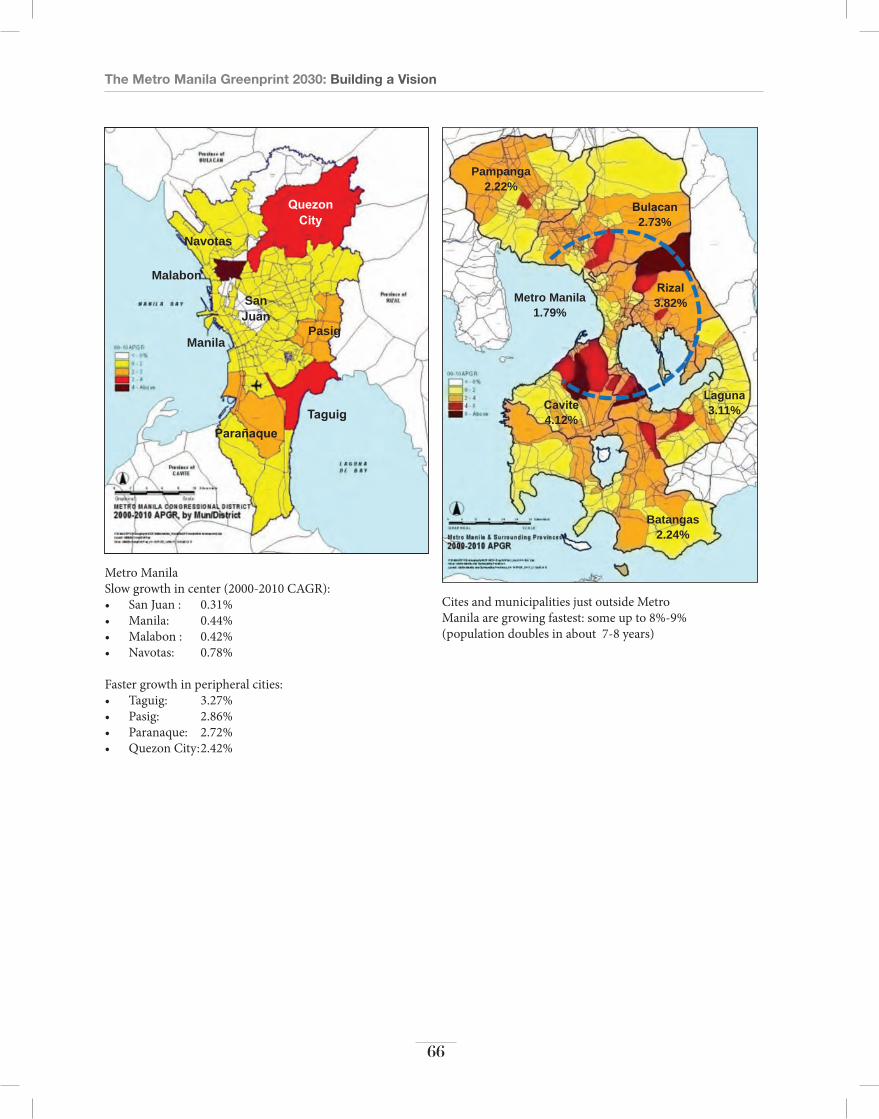
The Metro Manila Greenprint 2030: Building a Vision
66
QuezonCity
Navotas
Malabon
Pasig
TaguigParañaque
Manila
SanJuan
Metro ManilaSlow growth in center (2000-2010 CAGR):• San Juan : 0.31%• Manila: 0.44%• Malabon : 0.42%• Navotas: 0.78%
Faster growth in peripheral cities:• Taguig: 3.27%• Pasig: 2.86%• Paranaque: 2.72%• Quezon City: 2.42%
Pampanga2.22%
Bulacan2.73%
Rizal3.82%Metro Manila
1.79%
Laguna3.11%Cavite
4.12%
Batangas2.24%
Cites and municipalities just outside Metro Manila are growing fastest: some up to 8%-9% (population doubles in about 7-8 years)
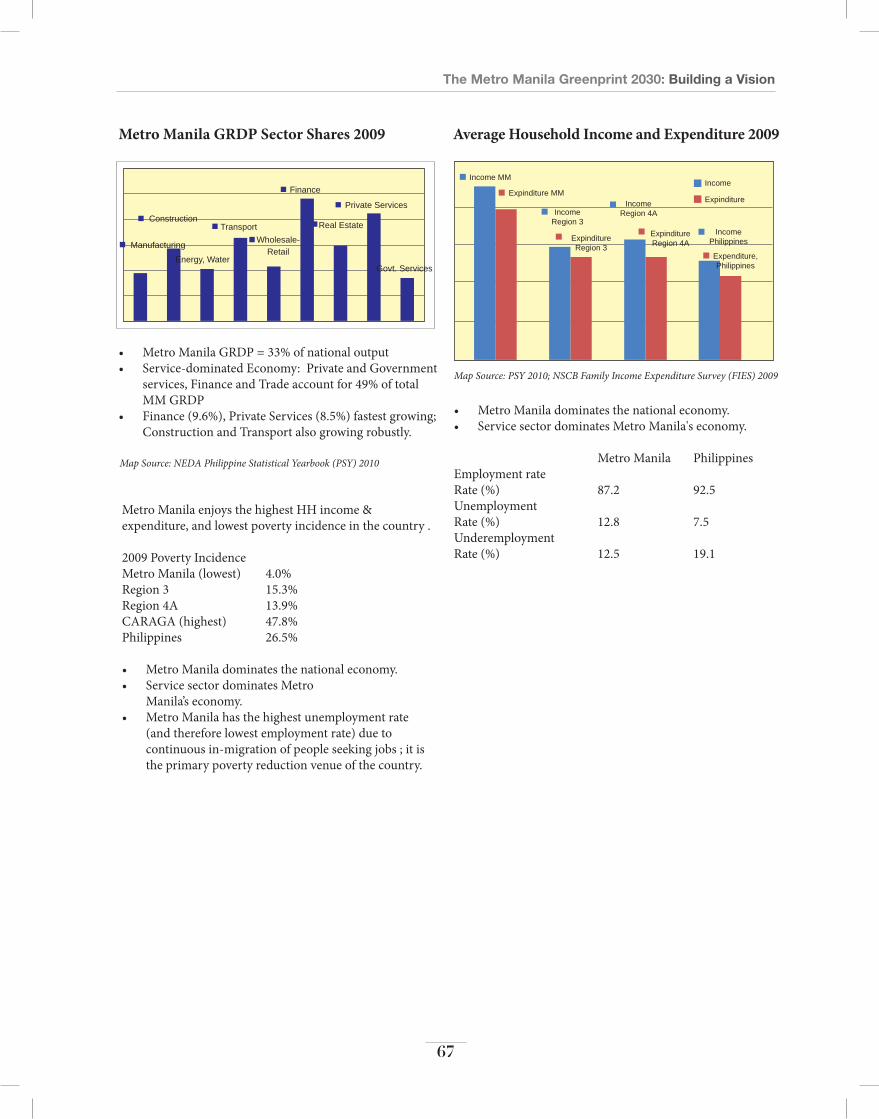
The Metro Manila Greenprint 2030: Building a Vision
67
Metro Manila enjoys the highest HH income & expenditure, and lowest poverty incidence in the country .
2009 Poverty Incidence Metro Manila (lowest) 4.0%Region 3 15.3%Region 4A 13.9%CARAGA (highest) 47.8% Philippines 26.5%
• Metro Manila dominates the national economy.• Service sector dominates Metro
Manila’s economy. • Metro Manila has the highest unemployment rate
(and therefore lowest employment rate) due to continuous in-migration of people seeking jobs ; it is the primary poverty reduction venue of the country.
• Metro Manila GRDP = 33% of national output• Service-dominated Economy: Private and Government
services, Finance and Trade account for 49% of total MM GRDP
• Finance (9.6%), Private Services (8.5%) fastest growing; Construction and Transport also growing robustly.
Metro Manila GrDP sector shares 2009
Map Source: NEDA Philippine Statistical Yearbook (PSY) 2010
ConstructionTransport
ManufacturingEnergy, Water
Wholesale-Retail
Real Estate
Finance
Private Services
Govt. Services
average Household income and expenditure 2009
• Metro Manila dominates the national economy.• Service sector dominates Metro Manila's economy.
Metro Manila PhilippinesEmployment rate Rate (%) 87.2 92.5Unemployment Rate (%) 12.8 7.5UnderemploymentRate (%) 12.5 19.1
Map Source: PSY 2010; NSCB Family Income Expenditure Survey (FIES) 2009
Income MM
Income Region 3
Income Region 4A
Income Philippines
Income
Expinditure
Expinditure Region 3
Expinditure Region 4A
Expinditure MM
Expenditure,Philippines
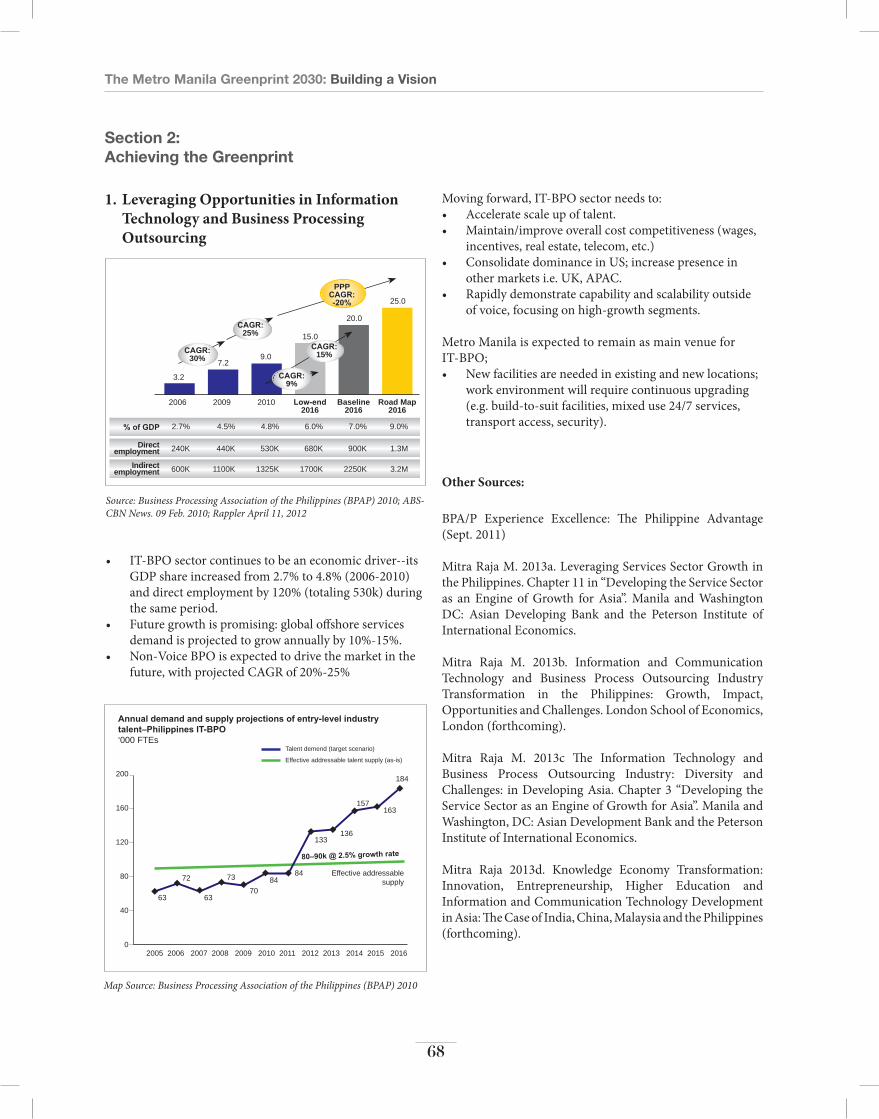
The Metro Manila Greenprint 2030: Building a Vision
68
1. leveraging opportunities in information Technology and Business Processing outsourcing
Map Source: Business Processing Association of the Philippines (BPAP) 2010
Source: Business Processing Association of the Philippines (BPAP) 2010; ABS-CBN News. 09 Feb. 2010; Rappler April 11, 2012
• IT-BPO sector continues to be an economic driver--its GDP share increased from 2.7% to 4.8% (2006-2010) and direct employment by 120% (totaling 530k) during the same period.
• Future growth is promising: global offshore services demand is projected to grow annually by 10%-15%.
• Non-Voice BPO is expected to drive the market in the future, with projected CAGR of 20%-25%
Section 2: Achieving the Greenprint
Moving forward, IT-BPO sector needs to:• Accelerate scale up of talent.• Maintain/improve overall cost competitiveness (wages,
incentives, real estate, telecom, etc.) • Consolidate dominance in US; increase presence in
other markets i.e. UK, APAC.• Rapidly demonstrate capability and scalability outside
of voice, focusing on high-growth segments.
Metro Manila is expected to remain as main venue for IT-BPO;• New facilities are needed in existing and new locations;
work environment will require continuous upgrading (e.g. build-to-suit facilities, mixed use 24/7 services, transport access, security).
Annual demand and supply projections of entry-level industry talent–Philippines IT-BPO‘000 FTEs
Talent demend (target scenario)
Effective addressable talent supply (as-is)
63 63
73
7084
84
133
80–90k @ 2.5% growth rate
136
157163
184
72 Effective addressable supply
2005 2006 2007 2008 2009 2010 2011 2012 2013 2014 2015 2016
200
160
120
80
40
0
% of GDP
2006
3.2
7.29.0
15.0
20.0
25.0
2009 2010 Low-end2016
CAGR:25%
CAGR:30%
PPPCAGR:-20%
Baseline2016
Road Map2016
Directemployment
Indirectemployment
2.7% 4.5% 4.8% 6.0% 7.0% 9.0%
240K 440K 530K 680K 900K 1.3M
600K 1100K 1325K 1700K 2250K 3.2M
CAGR:9%
CAGR:15%
other sources:
BPA/P Experience Excellence: The Philippine Advantage (Sept. 2011)
Mitra Raja M. 2013a. Leveraging Services Sector Growth in the Philippines. Chapter 11 in “Developing the Service Sector as an Engine of Growth for Asia”. Manila and Washington DC: Asian Developing Bank and the Peterson Institute of International Economics.
Mitra Raja M. 2013b. Information and Communication Technology and Business Process Outsourcing Industry Transformation in the Philippines: Growth, Impact, Opportunities and Challenges. London School of Economics, London (forthcoming).
Mitra Raja M. 2013c The Information Technology and Business Process Outsourcing Industry: Diversity and Challenges: in Developing Asia. Chapter 3 “Developing the Service Sector as an Engine of Growth for Asia”. Manila and Washington, DC: Asian Development Bank and the Peterson Institute of International Economics.
Mitra Raja 2013d. Knowledge Economy Transformation: Innovation, Entrepreneurship, Higher Education and Information and Communication Technology Development in Asia: The Case of India, China, Malaysia and the Philippines (forthcoming).

The Metro Manila Greenprint 2030: Building a Vision
69
Travel and Tourism Capital Investment 2011, $Bn
Map Source: Corpuz, "Optimizing the Growth Opportunities in the Tourism Sector: Mixed Use and Integrated Resort Development," 2012; Department of Tourism 2011)
y = 1.8271x+1.7296R2 = 0.979
y = 6.5993x- 3.94R2 = 0.9857Contribution to GDP
2011, $Bn
y = 0.4558x+ 7.9633R2 = 0.6982
CHN
THA
Visitor Exports2011, $Bn
MAL
SIN AuS
INDvIE
SRICAM
2. leveraging Metro Manila’s Tourism Potential and attracting newly rich neighbors
Mitra Raja M. 2010. Information Technology and Business Processing Outsourcing Industry Growth and Poverty Alleviation: The Case of India. Background paper. Geneva, UNCTAD
h t t p : / / w w w. j o u r n a l . c o m . p h / i n d e x . p h p / n e w s /national/39103-p252m-fund-for-it-bpo-industry
http://newsinfo.inquirer.net/169865/wellness-wake-up-call-for-sleepless-bpo-agent
• Metro Manila accounted for 12% (2.9 million) of total country tourism arrivals (2010).
• Phil direct employment: 778k jobs (2.1%)• Phil total employment: 3.55M jobs (9.6%)• Significant growth opportunities• 2012 growth rate (contribution to GDP) expected to be
highest (9.9%) in ASEAN+China+ Australia• A lot of low hanging fruit, if constraints are addressed.• NAIA heavily congested; handled about 27M
passengers, 425k MT cargo 2010; annual demand growth 5.5% and 5.0% respectively.
• Runway capacity has been reached with no more room for expansion.
• Others: traffic congestion, lack of hotel rooms, immigration constraints, other tourism services.
Gambling
• Gambling industry in the Philippines is worth an estimated P100B/yr; illegal activities account for additional P50B/yr.
• 66% of gaming revenues comes from Metro Manila operations.
• Asia Pacific expected to emerge as world’s leading region for casino gaming in next 5 years, expanding to $80B in 2015)
• Metro Manila can tap part of the Macau gaming market and grow to as much as $2B to $5B in size in the next five years. Mainland China will likely be the main market for local casinos; aside from Macau, Chinese only have Philippines and Singapore as alternatives.
Gaming markets (2010) (Billion)
Macau: $23.4B Australia: $3.4BSingapore: $2.8BSouth Korea: $2.6BPhilippines: $0.5B
Note: Macau is the largest single destination market in the world, more than 2X the revenue of Nevada, US)
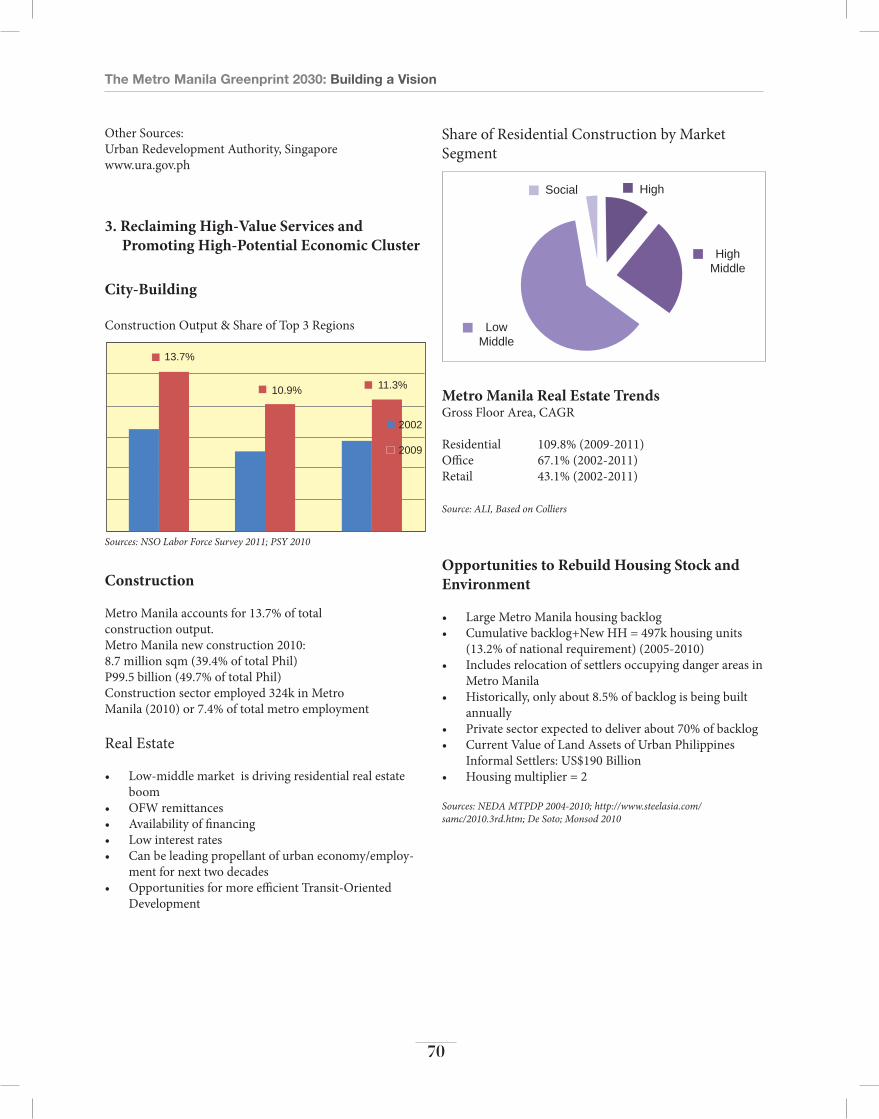
The Metro Manila Greenprint 2030: Building a Vision
70
Other Sources: Urban Redevelopment Authority, Singaporewww.ura.gov.ph
city-Building
Construction Output & Share of Top 3 Regions
construction
Metro Manila accounts for 13.7% of total construction output.Metro Manila new construction 2010:8.7 million sqm (39.4% of total Phil)P99.5 billion (49.7% of total Phil)Construction sector employed 324k in Metro Manila (2010) or 7.4% of total metro employment
Real Estate
• Low-middle market is driving residential real estate boom
• OFW remittances• Availability of financing• Low interest rates• Can be leading propellant of urban economy/employ-
ment for next two decades• Opportunities for more efficient Transit-Oriented
Development
Sources: NSO Labor Force Survey 2011; PSY 2010
2009
2002
11.3%10.9%
13.7%
3. reclaiming High-Value services and Promoting High-Potential economic cluster
Share of Residential Construction by Market Segment
Metro Manila real estate TrendsGross Floor Area, CAGR
Residential 109.8% (2009-2011)Office 67.1% (2002-2011)Retail 43.1% (2002-2011)
Source: ALI, Based on Colliers
opportunities to rebuild Housing stock and environment
• Large Metro Manila housing backlog• Cumulative backlog+New HH = 497k housing units
(13.2% of national requirement) (2005-2010) • Includes relocation of settlers occupying danger areas in
Metro Manila• Historically, only about 8.5% of backlog is being built
annually• Private sector expected to deliver about 70% of backlog• Current Value of Land Assets of Urban Philippines
Informal Settlers: US$190 Billion• Housing multiplier = 2
Sources: NEDA MTPDP 2004-2010; http://www.steelasia.com/samc/2010.3rd.htm; De Soto; Monsod 2010
Social High
HighMiddle
LowMiddle
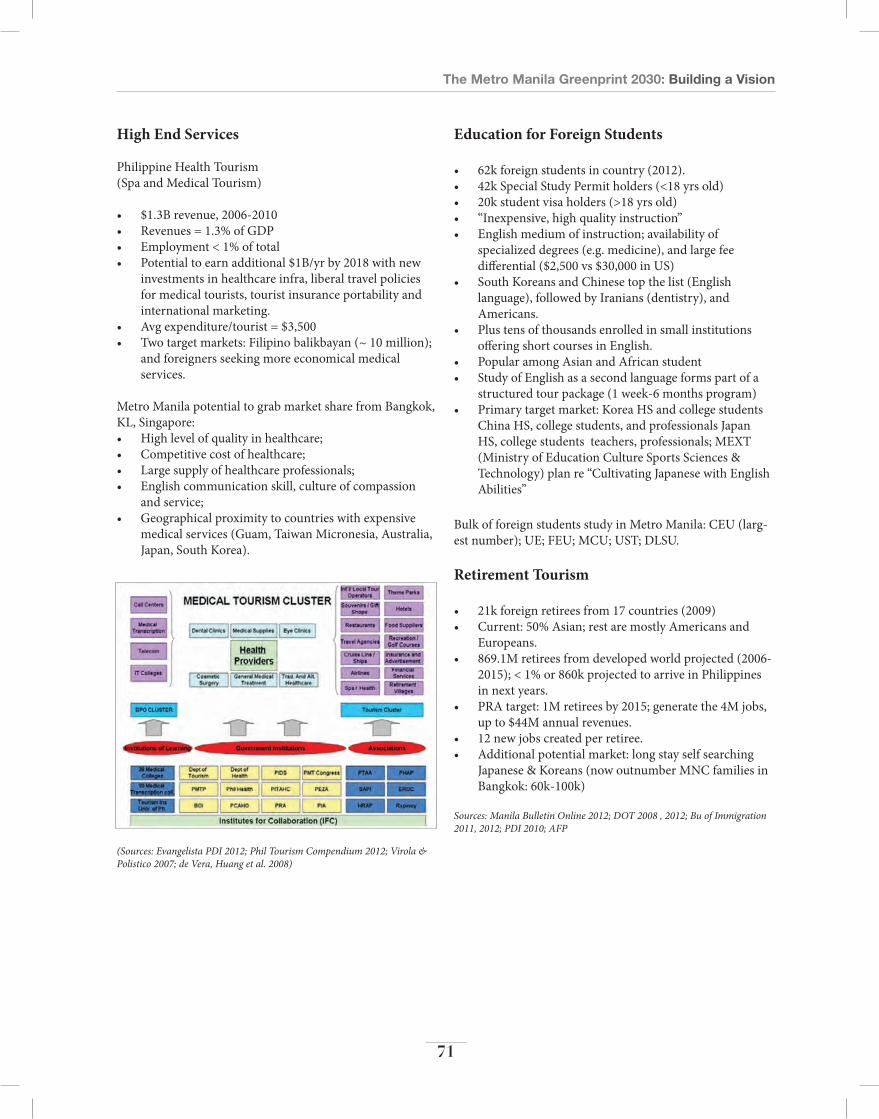
The Metro Manila Greenprint 2030: Building a Vision
71
High end services
Philippine Health Tourism(Spa and Medical Tourism)
• $1.3B revenue, 2006-2010• Revenues = 1.3% of GDP• Employment < 1% of total• Potential to earn additional $1B/yr by 2018 with new
investments in healthcare infra, liberal travel policies for medical tourists, tourist insurance portability and international marketing.
• Avg expenditure/tourist = $3,500 • Two target markets: Filipino balikbayan (~ 10 million);
and foreigners seeking more economical medical services.
Metro Manila potential to grab market share from Bangkok, KL, Singapore: • High level of quality in healthcare; • Competitive cost of healthcare; • Large supply of healthcare professionals;• English communication skill, culture of compassion
and service; • Geographical proximity to countries with expensive
medical services (Guam, Taiwan Micronesia, Australia, Japan, South Korea).
(Sources: Evangelista PDI 2012; Phil Tourism Compendium 2012; Virola & Polistico 2007; de Vera, Huang et al. 2008)
education for Foreign students
• 62k foreign students in country (2012). • 42k Special Study Permit holders (<18 yrs old)• 20k student visa holders (>18 yrs old)• “Inexpensive, high quality instruction”• English medium of instruction; availability of
specialized degrees (e.g. medicine), and large fee differential ($2,500 vs $30,000 in US)
• South Koreans and Chinese top the list (English language), followed by Iranians (dentistry), and Americans.
• Plus tens of thousands enrolled in small institutions offering short courses in English.
• Popular among Asian and African student• Study of English as a second language forms part of a
structured tour package (1 week-6 months program)• Primary target market: Korea HS and college students
China HS, college students, and professionals Japan HS, college students teachers, professionals; MEXT (Ministry of Education Culture Sports Sciences & Technology) plan re “Cultivating Japanese with English Abilities”
Bulk of foreign students study in Metro Manila: CEU (larg-est number); UE; FEU; MCU; UST; DLSU.
retirement Tourism
• 21k foreign retirees from 17 countries (2009)• Current: 50% Asian; rest are mostly Americans and
Europeans.• 869.1M retirees from developed world projected (2006-
2015); < 1% or 860k projected to arrive in Philippines in next years.
• PRA target: 1M retirees by 2015; generate the 4M jobs, up to $44M annual revenues.
• 12 new jobs created per retiree.• Additional potential market: long stay self searching
Japanese & Koreans (now outnumber MNC families in Bangkok: 60k-100k)
Sources: Manila Bulletin Online 2012; DOT 2008 , 2012; Bu of Immigration 2011, 2012; PDI 2010; AFP
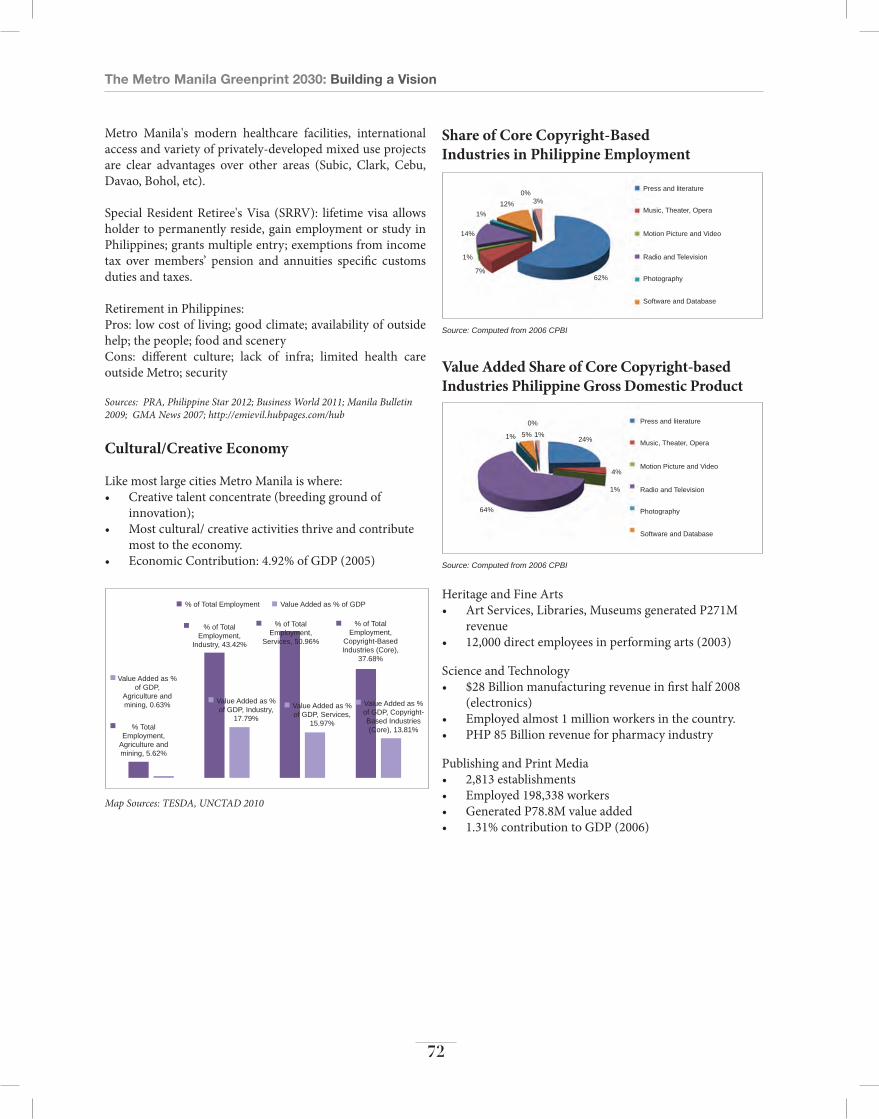
The Metro Manila Greenprint 2030: Building a Vision
72
Metro Manila's modern healthcare facilities, international access and variety of privately-developed mixed use projects are clear advantages over other areas (Subic, Clark, Cebu, Davao, Bohol, etc).
Special Resident Retiree's Visa (SRRV): lifetime visa allows holder to permanently reside, gain employment or study in Philippines; grants multiple entry; exemptions from income tax over members’ pension and annuities specific customs duties and taxes.
Retirement in Philippines:Pros: low cost of living; good climate; availability of outside help; the people; food and scenery Cons: different culture; lack of infra; limited health care outside Metro; security
Sources: PRA, Philippine Star 2012; Business World 2011; Manila Bulletin 2009; GMA News 2007; http://emievil.hubpages.com/hub
cultural/creative economy
Like most large cities Metro Manila is where: • Creative talent concentrate (breeding ground of
innovation);• Most cultural/ creative activities thrive and contribute
most to the economy.• Economic Contribution: 4.92% of GDP (2005)
Map Sources: TESDA, UNCTAD 2010
value Added as %of GDP, Copyright-Based Industries(Core), 13.81%
value Added as %of GDP, Services,
15.97%
value Added as %of GDP, Industry,
17.79%
value Added as %of GDP,
Agriculture and mining, 0.63%
% TotalEmployment,
Agriculture and mining, 5.62%
% of TotalEmployment,
Industry, 43.42%
% of Total Employment value Added as % of GDP
% of TotalEmployment,
Services, 50.96%
% of TotalEmployment,
Copyright-BasedIndustries (Core),
37.68%
Heritage and Fine Arts• Art Services, Libraries, Museums generated P271M
revenue • 12,000 direct employees in performing arts (2003)
Science and Technology• $28 Billion manufacturing revenue in first half 2008
(electronics)• Employed almost 1 million workers in the country. • PHP 85 Billion revenue for pharmacy industry
Publishing and Print Media• 2,813 establishments• Employed 198,338 workers• Generated P78.8M value added• 1.31% contribution to GDP (2006)
Press and literature
Press and literature
Music, Theater, Opera
Music, Theater, Opera
Motion Picture and video
Motion Picture and video
Radio and Television
Radio and Television
Photography
Photography
Software and Database
Software and Database
7%
1%
1%
1%
1%
1%
0%
0%
3%
5%
4%
12%
62%
64%
24%
14%
Source: Computed from 2006 CPBI
Source: Computed from 2006 CPBI
share of core copyright-Basedindustries in Philippine employment
Value added share of core copyright-based industries Philippine Gross Domestic Product

The Metro Manila Greenprint 2030: Building a Vision
73
Manufacturing
• Manufacturing shares of MM and Philippine economy are declining.
• Even as manufacturing accounts for 28% of MM GRDP (Services=49%).
• Manufacturing employment (499k in MM) is also decreasing by 7.8% in MM; by 0.7% nationwide (2006-10)
• Labor productivity growth and thus competitiveness declined.
• Despite its declining share, MM contribution to total manufacturing increased from 39% to 41% (2002-09).
Manufacturing Output (XP1000) 2002 % 2009 %
Metro M 99,068 39% 128,704 41%
Reg 3 27,791 11% 27,705 9%
Reg 4A 44,517 17% 46,147 15%
Phil 254,555 100% 316,406 100%
PhilThai
Phil,Industry,3.8
Phil,Agri, 10.7
Thai,Agri, 8.4
Thai,Services, 76.7
Phil,Services,24.9
Thai,Industry, 90.9
2003,Metro M,31.0
2009,Metro M,27.6
2003, Phil, 24.3 2009, Phil,
22.0
2003
2009
Design and Architecture• Jewelry, interior design, architecture: P8.6B• Majority of revenue generated from architectural,
engineering, technical consultancy• GDP contribution: 0.14%; employed: 17,855 (2006)
Creative Services• Game development: $8M revenues; 13% growth; employed 1,400• Animation: $128M revenues; 8,600 animators • Advertising: P4.3B value added (2011)
• Manufacture of semiconductors, other electronic components, computers, computer peripherals, and equipment totaled P652B or 19.8% of total manufacturing output (2009).
• Electronics account for 61% (P31B) of total exports in 2010; avg contribution = 65% (2000-2010)
• Electronics sector directly employed 500k in country (2010); annual growth estimated at 5%.
Potential for increased role of manufacturing in Metro Manila and periphery:• Declining competitiveness of China due to higher labor
wage; average Phil manufacturing wage is only 41% of coastal China;
• Geographical diversification of global manufacturing investments as part of risk reduction strategy;
• Aging population in mature economies (e.g. Japan) prompting moves to labor surplus countries;
• But need to identify most competitive industries/clusters and address specific constraints (infra, power supply, property rights, security) and provide focused support;
• Efficient transport and communication linkages between Metro Manila and periphery (where land for manufacturing is available) are critical.

The Metro Manila Greenprint 2030: Building a Vision
74
Top Grossers in Value of Output PhP Billion, All Manufacturing Establishments (2009)
Figure Sources: DTI BOI The Philippine Electronics Industry Profile 2011; http://www.abs-cbnnews.com/business/03/06/12/ph-benefit-relocation-chinese-manufacturing; 2009 Annual Survey of Philippine Business and Industry (ASPBI)
Figure Sources: NSO Labor Force Survey, DOLE Yearbook of Labor Statistics 2011; PSY 2010; Usui, "Taking the Right Road to Inclusive Growth" ADB 2011
http://business.inquirer.net/61629/ph-leads-way-to-stem-cell-therapy
http://www.themedicalcity.com/serviceitem.php?sid=18
http://www.stem-cell-regeneration.com/
http://www.rappler.com/video/talkthursday/28-editors-pick/5539-talkthursday-filipino-in-silicon-valley
http://www.wheninmanila.com/silicon-valley-comes-to-the-philippines-the-phildev-economic-forum-2012/
http://www.phildev.org/site/PageServer?pagename=SVC2PH
Softdrinks
Motor vehiclesparts, accessories
Powdered condensed, evap milk
Non-ferroussmelting, refining
Computers,periperal equipment
Motor vehicles
Meat products
Cigarettes, cigars
Refiened petroleum fuels
Semiconductors,other electronics
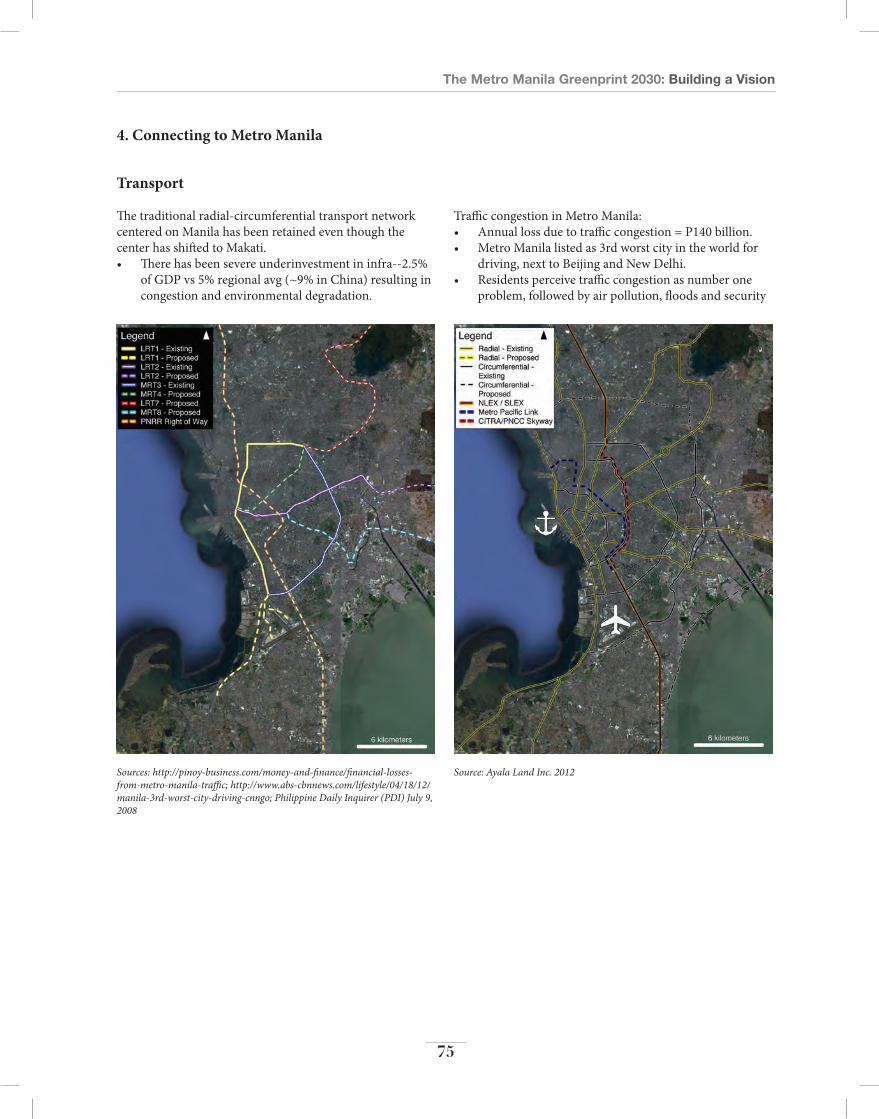
The Metro Manila Greenprint 2030: Building a Vision
75
Transport
The traditional radial-circumferential transport network centered on Manila has been retained even though the center has shifted to Makati.• There has been severe underinvestment in infra--2.5%
of GDP vs 5% regional avg (~9% in China) resulting in congestion and environmental degradation.
Sources: http://pinoy-business.com/money-and-finance/financial-losses-from-metro-manila-traffic; http://www.abs-cbnnews.com/lifestyle/04/18/12/manila-3rd-worst-city-driving-cnngo; Philippine Daily Inquirer (PDI) July 9, 2008
Source: Ayala Land Inc. 2012
Traffic congestion in Metro Manila:• Annual loss due to traffic congestion = P140 billion.• Metro Manila listed as 3rd worst city in the world for
driving, next to Beijing and New Delhi.• Residents perceive traffic congestion as number one
problem, followed by air pollution, floods and security
4. connecting to Metro Manila
Existing and Proposed Transport Infrastructure Existing and Proposed Transport Infrastructure
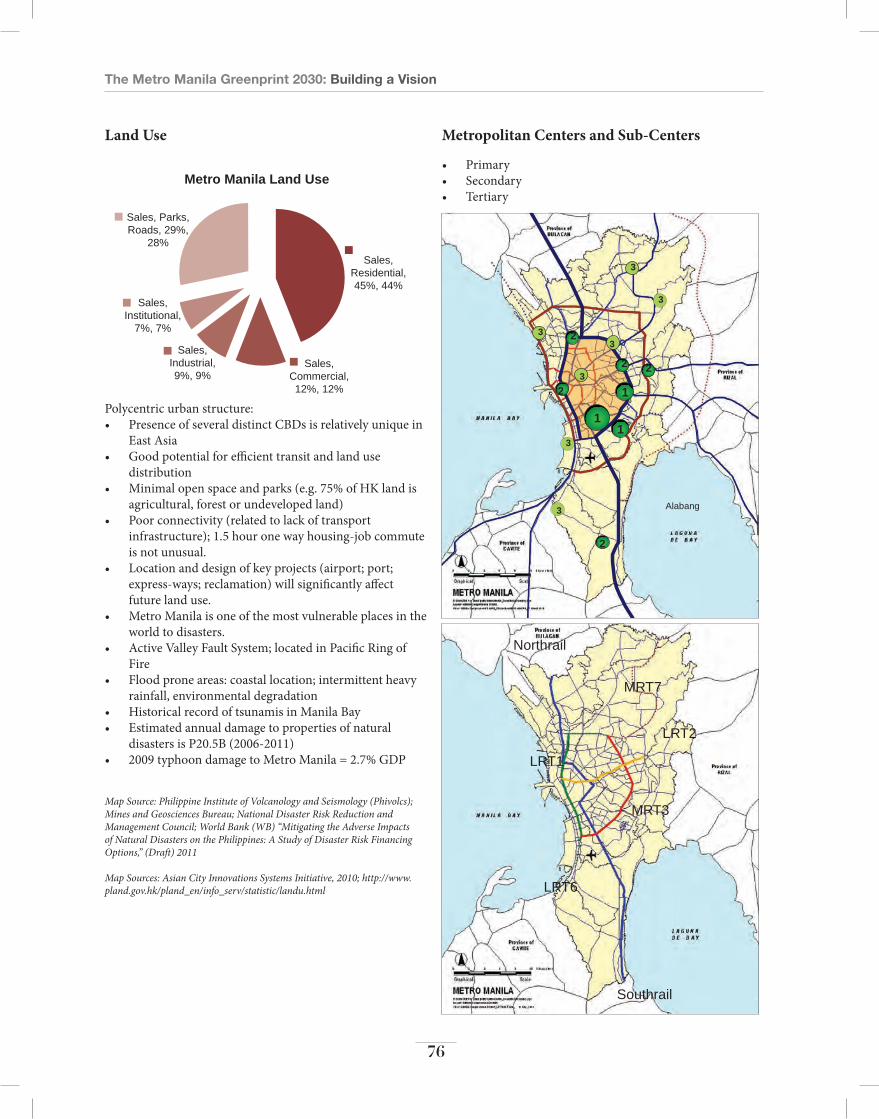
The Metro Manila Greenprint 2030: Building a Vision
76
land Use
Polycentric urban structure: • Presence of several distinct CBDs is relatively unique in
East Asia • Good potential for efficient transit and land use
distribution• Minimal open space and parks (e.g. 75% of HK land is
agricultural, forest or undeveloped land)• Poor connectivity (related to lack of transport
infrastructure); 1.5 hour one way housing-job commute is not unusual.
• Location and design of key projects (airport; port; express-ways; reclamation) will significantly affect future land use.
• Metro Manila is one of the most vulnerable places in the world to disasters.
• Active Valley Fault System; located in Pacific Ring of Fire
• Flood prone areas: coastal location; intermittent heavy rainfall, environmental degradation
• Historical record of tsunamis in Manila Bay• Estimated annual damage to properties of natural
disasters is P20.5B (2006-2011)• 2009 typhoon damage to Metro Manila = 2.7% GDP
Map Source: Philippine Institute of Volcanology and Seismology (Phivolcs); Mines and Geosciences Bureau; National Disaster Risk Reduction and Management Council; World Bank (WB) “Mitigating the Adverse Impacts of Natural Disasters on the Philippines: A Study of Disaster Risk Financing Options,” (Draft) 2011
Map Sources: Asian City Innovations Systems Initiative, 2010; http://www.pland.gov.hk/pland_en/info_serv/statistic/landu.html
Sales, Parks,Roads, 29%,
28%
Metro Manila Land Use
Sales, Institutional,
7%, 7%
Sales, Industrial,9%, 9%
Sales, Commercial,12%, 12%
Sales, Residential,45%, 44%
Metropolitan Centers and Sub-Centers • Primary • Secondary • Tertiary
LRT1
LRT6
Southrail
MRT3
LRT2
MRT7
Northrail
Alabang
1
1
1
2
2
2 2
2
3
3
3
3
3
3
3
Metropolitan Centers and Sub-Centers • Primary • Secondary • Tertiary
LRT1
LRT6
Southrail
MRT3
LRT2
MRT7
Northrail
Alabang
1
1
1
2
2
2 2
2
3
3
3
3
3
3
3
Metropolitan centers and sub-centers
• Primary• Secondary• Tertiary

The Metro Manila Greenprint 2030: Building a Vision
77
Location ~ Transportation Market Access Density Makati
BGC
Ortigas
Eastwood
Cubao/Araneta
North Triangle
Alabang
Monumento
Manila
MOA
Location of Shopping Malls, Residential and Commercial Condos and Developments
Location ~ Transportation Market Access Density Makati
BGC
Ortigas
Eastwood
Cubao/Araneta
North Triangle
Alabang
Monumento
Manila
MOA
Location of Shopping Malls, Residential and Commercial Condos and Developments
Location ofShopping Malls,Residential andCommercial Condosand Developments
Location ~ Transportation
Market Access
Density
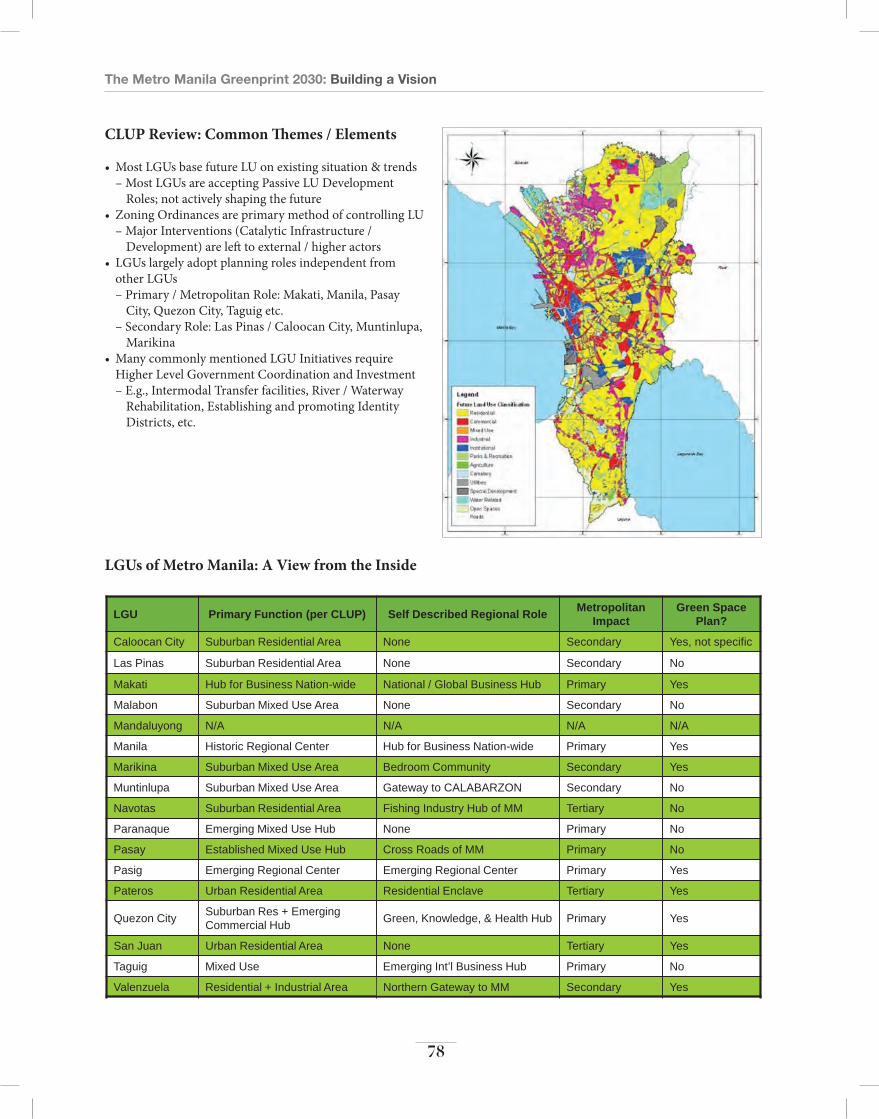
The Metro Manila Greenprint 2030: Building a Vision
78
clUP review: common Themes / elements
• MostLGUsbasefutureLUonexistingsituation&trends– Most LGUs are accepting Passive LU Development
Roles; not actively shaping the future• ZoningOrdinancesareprimarymethodofcontrollingLU
– Major Interventions (Catalytic Infrastructure / Development) are left to external / higher actors
• LGUslargelyadoptplanningrolesindependentfromother LGUs– Primary / Metropolitan Role: Makati, Manila, Pasay
City, Quezon City, Taguig etc.– Secondary Role: Las Pinas / Caloocan City, Muntinlupa,
Marikina• ManycommonlymentionedLGUInitiativesrequire
Higher Level Government Coordination and Investment– E.g., Intermodal Transfer facilities, River / Waterway
Rehabilitation, Establishing and promoting Identity Districts, etc.
LGUs of Metro Manila: A View from the Inside
LGU Primary Function (per CLUP) Self Described Regional Role Metropolitan Impact
Green Space Plan?
Caloocan City Suburban Residential Area None Secondary Yes, not specific
Las Pinas Suburban Residential Area None Secondary No
Makati Hub for Business Nation-wide National / Global Business Hub Primary Yes
Malabon Suburban Mixed Use Area None Secondary No
Mandaluyong N/A N/A N/A N/A
Manila Historic Regional Center Hub for Business Nation-wide Primary Yes
Marikina Suburban Mixed Use Area Bedroom Community Secondary Yes
Muntinlupa Suburban Mixed Use Area Gateway to CALABARZON Secondary No
Navotas Suburban Residential Area Fishing Industry Hub of MM Tertiary No
Paranaque Emerging Mixed Use Hub None Primary No
Pasay Established Mixed Use Hub Cross Roads of MM Primary No
Pasig Emerging Regional Center Emerging Regional Center Primary Yes
Pateros Urban Residential Area Residential Enclave Tertiary Yes
Quezon City Suburban Res + Emerging Commercial Hub Green, Knowledge, & Health Hub Primary Yes
San Juan Urban Residential Area None Tertiary Yes
Taguig Mixed Used Emerging Int’l Business Hub Primary No
Valenzuela Residential + Industrial Area Northern Gatewya to MM Secondary Yes Northern Gateway to MM
lGUs of Metro Manila: a View from the inside
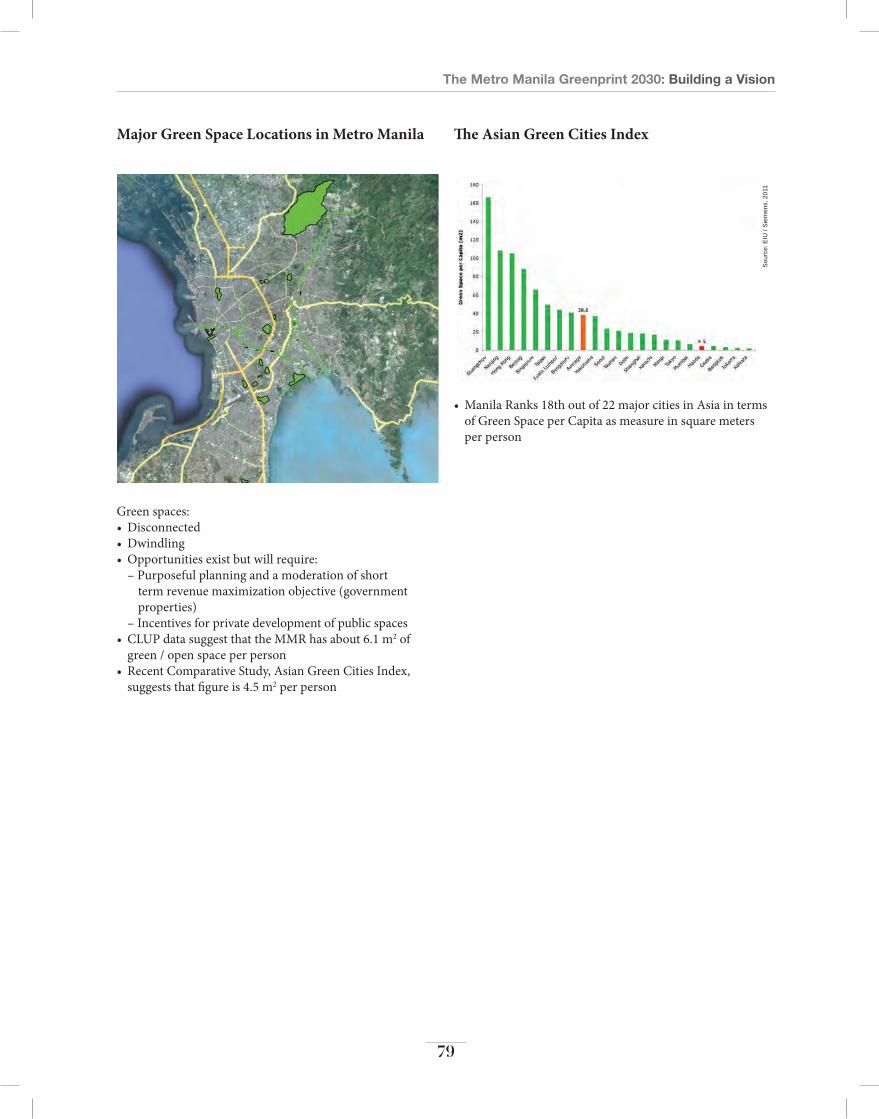
The Metro Manila Greenprint 2030: Building a Vision
79
Major Green space locations in Metro Manila The asian Green cities index
Green spaces:• Disconnected• Dwindling• Opportunitiesexistbutwillrequire:
– Purposeful planning and a moderation of short term revenue maximization objective (government properties)
– Incentives for private development of public spaces• CLUPdatasuggestthattheMMRhasabout6.1m2 of
green / open space per person• RecentComparativeStudy,AsianGreenCitiesIndex,
suggests that figure is 4.5 m2 per person
• ManilaRanks18thoutof22majorcitiesinAsiaintermsof Green Space per Capita as measure in square meters per person
The Asian Green Cities Index
• Manila Ranks 18th out of 22 major cities in Asia in terms of Green Space per Capita as measure in square meters per person
Sou
rce:
EIU
/ S
iem
ens,
201
1

The Metro Manila Greenprint 2030: Building a Vision
80
Other Sources:
JICA, MMDA, PHILVOCS. Metro Manila Earthquake Impact Reduction Study (MMEIRS). 2004.
World Bank. 2010. Post-Disaster Needs Assessment.
UN/ISDR. 2004. Geneva. Living with risk: A Global Review of Disaster Reduction Initiatives.
ESCAP, Natural Hazards and Natural Disaster Reduction in Asia and the Pacific (ST/ESCAP/1574), 1995
NIST (National Institute of Standards and Technology). 2008. Strategic Plan for the National Earthquake Hazards Reduction Program: Fiscal Years 2009-2013. Gainthersburg, Md.: NIST.
Bruneau, M., S.E. Chang, R.T. Eguchi, G.C. Lee, T.D. O’Rourke, A.M. Reinhorn, M. Shinozuka, K. Tierney, W.A. Wallace, and D. von Winterfeldt. 2003. A framework to quantitatively assess and enhance the seismic resilience of communities. Earthquake Spectra 19(4): 733-752.
Vinod Thomas, Jose Ramon G. Albert and Rosa T. Perez. Intense Climate Disaster and Development in Asia-Pacific.
Aning, Jerome. “NAIA to undergo Upgrading in 2013 as Number of Air Travellers Increase.” Inquirer. 9 January 2013.
Online: http//globanation.inquirer.net/61209/naia-to-undergo-upgrading-in-2013-as-number-of-air-travellers-increase
Japan International Cooperation Agency. “Study on the Airport Strategy for the Greater Capital Region in the Republic of the Philippines: Final Report.” November 2011.
http://www.aerotropolis.com/airportCities/about-the-aerotropolis
Transport & Traffic Planners, Inc. Study to Decongest Manila and Divert Traffic to Subic and Batangas Port, 2012
Presentation to NEDA Infrastructure Committee.
The Metro Manila Greenprint 2030: Building a Vision
81
Photo Credits
Report CoverJulia Nebrija, Michael Pineda, MMDA
Foreword PhotoMMDA
Section 1: Creating the Greenprint CoverMMDA
Section 2: Achieving the Vision CoverMichael Pineda
Fostering a Metropolis of Opportunity
Cover Photo: Farlet Vale
Pg. 16: Julia NebrijaPg. 17: Michael PinedaPg. 19: Tammy DavidPg. 20: Julia NebrijaPg. 21: Julia NebrijaPg. 22: Julia NebrijaPg. 23: Julia Nebrija, Michael PinedaPg. 27: Rafael Fuch-SimonPg. 29: The Medical CityPg. 35: Julia Nebrija, MMDAPg. 43: Julia NebrijaPg. 44: Julia NebrijaPg. 45: Julia NebrijaPg. 46: Julia NebrijaPg. 48: MMDAPg. 49: Julia NebrijaPg. 50: World Bank
Building a Green, Connected, and ResilientMetropolis for All
Section 3: Key Synergies
Cover Photo: Julia Nebrija
Figures
Figure 1.1: MMDAFigure 2.1-2.3: Greenprint TeamFigure 3-1: Greenprint Team
Maps
Figure 2-1: Greenprint TeamFigure 3-1: Greenprint TeamFigure 3-2A: Greenprint TeamFigure 3-2B: Greenprint TeamFigure 3-3: Greenprint TeamFigure 4-1: Greenprint Team

The Metro Manila Greenprint 2030: Building a Vision
82

The Metro Manila GreenPrint 2030
www.metromanila2030.com
Follow the Greenprint 2030:

Metro Manila for all;
Green, connected, resilient;
Offering talent and opportunity;
Processing knowledge anddelivering services at home and abroad.
MMDA Building, EDSA corner Orense St., Guadalupe, Makati CityTrunk Line : 882-4154 to 74
MMDA Hotline: 136 | MMDA Duty Officer: 0917-5618711www.mmda.gov.ph


![2012 DVGBC Greenprint [#042 Special]](https://img.dokumen.tips/doc/110x75/568c4aa51a28ab491699030e/2012-dvgbc-greenprint-042-special.jpg)