Embed Size (px)
Citation preview
1
The mental
health and
wellbeing of
teachers in
England
John Jerrim (UCL Social Research Institute)
Sam Sims (UCL CEPEO)
Rebecca Allen (Teacher Tapp)

2
Executive summary
Background
Over the last decade there has been renewed academic and public policy interest in wellbeing
and mental health. This has coincided with a notable increase in reported mental health
problems across the UK, including the proportion of individuals taking prescription medicines
for illnesses such as anxiety and depression. It is well known that the prevalence of mental
illness varies by key demographic characteristics, such as age, gender, ethnicity and socio-
economic status. Yet previous research has also suggested that mental ill health, and low levels
of wellbeing, differ between professions (Johnson et al., 2003). One occupation where there
has been particular concern about mental health problems is teaching, with staff working long
hours during term time and under increasing pressure from the system of school accountability.
This has, in turn, contributed to ongoing difficulties with recruiting and retaining sufficient
numbers of high-quality teaching staff (Cooper-Gibson Research, 2018), further compounded
by the fact that almost 4,000 teachers in England are on long-term sickness leave due to stress
(Liberal Democrats, 2018).
But is the problem of low wellbeing and mental ill health really that much worse for teachers,
relative to teachers in other countries and those working in other occupations in England?
Likewise, is there any evidence that the mental health and wellbeing of teachers in England has
declined over time, or that teachers who quit the profession find that their mental health
improves? And what are the drivers of poor mental health amongst teachers – is it due to
excessive workloads, the stressful nature of school accountability, issues surrounding school
leadership or disciplinary issues within schools? Currently, the evidence base on such matters
remains relatively limited.
This report provides new evidence on the mental health and wellbeing of teachers in England.
It is divided into two parts. The first provides the most detailed and comprehensive
investigation of teacher mental health and wellbeing in England up to 2018. This includes
comparing the situation amongst teachers in England to other countries, consideration of how
the mental health of teachers varies over the academic year, comparisons of teachers to those
working in other occupations and an investigation of how this has changed over time. It also
provides new evidence on the lifestyles and wellbeing of recently qualified teachers, as well as
whether middle-aged teachers who leave the profession for another job experience an
improvement in their mental health. In doing so, the report provides the most complete picture
on the mental health and wellbeing of teachers in England to date.
The second part of the report turns to potential drivers of mental ill health amongst teachers.
This includes a detailed investigation of teachers’ hours of work – one widely discussed
challenge facing the teaching profession – and how these are associated with their workplace
wellbeing and stress. The issue of high-stakes accountability is then tackled, with a detailed
consideration of how holding teachers responsible for pupil achievement is linked to their
wellbeing. Finally, the report investigates how five specific workplace factors (school
leadership, teacher collaboration, workload, initial preparation and approach to discipline) may
affect teacher job satisfaction, wellbeing and retention in the profession. Together, this provides
important new evidence on how different aspects of the job are affecting teachers’ lives.
3
Methodology
The study draws upon a wide variety of datasets to build the most comprehensive picture
possible of the wellbeing and mental health of teachers in England. This includes, but is not
limited to, the Labour Force Survey, Annual Population Survey, Understanding Society, UK
Biobank and the Teaching and Learning International Survey (TALIS). We apply a range of
regression analyses and matching methods to these datasets in order to draw comparisons of
the mental health and wellbeing of teachers in England to teachers in other countries, to workers
in other professions, to historical patterns and to those who have chosen to leave teaching for
alternative employment. The large sample size of teachers within these various data sources,
the fact that many have been collected over a long time horizon and the rich information that
they each hold about respondents’ wellbeing make them well suited for this purpose.
The TALIS dataset is drawn upon, in particular, to investigate the potential drivers of teachers’
mental health. These data are particularly rich in terms of teachers’ working environments,
including detailed measures of workload and working hours, school management practices,
working environment and aspects of school accountability. The second part of the report
therefore applies various forms of regression analyses to these data, in order to investigate the
correlates of teacher workplace wellbeing and stress. Since TALIS is a cross-national study,
this data also allows us to place the results for England in international perspective.
Findings: comparisons with other occupational groups
• Against conventional wisdom, there is little robust evidence to suggest that, on the
whole, teachers are particularly anxious, depressed, have lower levels of life
satisfaction or have poorer wellbeing outcomes than demographically similar
individuals in other forms of professional employment.
• Recently qualified teachers have higher levels of life satisfaction than other young
professionals, despite working longer hours for little extra pay. There is also no
evidence that recently qualified teachers have worse mental health outcomes, or have a
less active social life, than young people working in other jobs.
• There is no evidence that middle-aged teachers who choose to leave for another job
experience better mental health and wellbeing outcomes than their peers who choose to
remain within the profession.
Findings: teachers in England compared to other countries
• Teachers in England are more likely to say that they experience stress at work, and that
their job has a negative impact upon their mental health, relative to teachers in other
countries. There are four key areas that teachers in England perceive to be driving their
workplace stress (and more so than other countries): (a) the accountability system, (b)
marking, (c) keeping up with changing government requirements, and (d)
administrative load.
Findings: trends over time
• The mental health and personal wellbeing of teachers in England seems to have
remained broadly stable over the last 20 years. However, teachers – like other
4
professional workers – may be more likely to report mental health problems now (and
to have them treated) than previously.
• Although working hours remain high, there has been no notable change in total hours
worked by teachers over the last 20 years. Likewise, there has been no notable increase
in the proportion of teachers working during evenings and weekends over the last 15
years, and no change in time spent upon specific tasks (e.g. marking, administration)
over the last five years.
Findings: potential drivers of mental ill health amongst teachers
• The two aspects of teachers’ jobs that they perceive to cause them the greatest workload
stress are lesson planning and marking. This is in contrast to other aspects of the job,
such as time spent teaching and working with colleagues/professional development,
which teachers do not perceive to be negatively linked to stress in their workplace.
• There is a modest, positive correlation between the nature of school-system
accountability and whether teachers and headteachers perceive this to be a stressful
aspect of their job. Despite this, there are some other countries with a high-stakes school
accountability system where only a comparatively small proportion of teachers report
feeling stressed due to being held accountable for pupil achievement.
• There is little evidence that management practices differ when headteachers report
feeling stressed about accountability, or that they transmit these feelings of stress on to
their staff. However, strong evidence emerges of ‘emotional contagion’ of
accountability-driven stress amongst colleagues occurring within schools, with teachers
more likely to feel stressed by accountability if their colleagues report this causes them
stress as well.
• Supportive school leadership is linked with teacher retention, which is likely to be due
to improved job satisfaction and reduced workplace stress. School discipline is found
to be equally important. Conversely, preparation for teaching assignments is not
associated with job satisfaction, workplace stress or retention, while findings with
respect to teacher collaboration and teacher workload are mixed.
Recommendations
These findings lead us to issue a series of recommendations for policy and practice:
• Policymakers, school leaders, teachers and their unions should challenge the received
wisdom that teaching is more stressful than other occupations. This is important so as
not to dissuade people from entering the teaching profession.
• There are two clear areas where reducing teachers’ workloads would likely reduce
stress: lesson preparation and marking. With respect to the lesson preparation, perhaps
the easiest thing that policymakers can do is reduce examination, curriculum and
inspection reforms. On marking, there is a strong case to be made for teachers to spend
less time on this activity, either by focusing upon a smaller subset of pupils’ work or
by using whole-class oral feedback rather than individualised written marking.
• School leaders can reduce stress and improve retention by consulting and involving
teachers in decision-making processes, supporting their professional development and
explicitly recognising staff for their work. In addition, school leaders looking to
improve job satisfaction and retention are advised to prioritise improving disciplinary

5
standards in the school. This can be achieved by ensuring that all staff are aware of
whole-school standards for behaviour and are supported in consistently enforcing them.
• There are various ways that the Department for Education could monitor the mental
health of teachers in the future. One option could be to work with NHS Digital on
combining administrative databases across education and health. This would, for
instance, facilitate the School Workforce Census to be linked to primary and secondary
healthcare records (e.g. Health Episode Statistics, Clinical Practice Research Datalink).
Such a resource would provide a step change in our understanding of the epidemiology
of the mental and physical health of teachers in England, and provide a cost-effective
way to track changes in the health of teachers over time.
• The Department for Education has recently announced they are commissioning a
longitudinal study of teachers in England (https://schoolsweek.co.uk/new-flagship-
study-to-solve-why-teachers-leave/). This welcome innovation in the landscape on data
about teachers in England should include a focused battery of questions about mental
health. In particular, this longitudinal study should be used to track teacher wellbeing
over time, how it changes throughout their career and how this affects their movements
into and out of the teaching profession.
• We don’t yet know a lot about the impact of the Covid-19 crises on the teaching
profession, both in terms of their health and the longer-term implications for
recruitment and retention in the profession. This should be included as one of the key
topics of focus in the Department for Education’s new longitudinal study of teachers.
Academic papers
A set of ten academic papers have been produced within this project, which provide further
detail to the results provided in this report. The references to these journal papers are as follows:
Jerrim, J. & Sims, S. (2020a) Teacher wellbeing. How does England compare to other
countries?
Jerrim, J., Sims, S., Taylor, H. & Allen, R. (2020a) How does the mental health and wellbeing of teachers
compare to other professions? Review of Education.
Jerrim, J., Sims, S., Taylor, H. & Allen, R. (2020b) Has the mental health and wellbeing of teachers in England
changed over time? New evidence from three datasets. Oxford review of Education (revise and resubmit).
Jerrim, J. (2020) How is life as a newly qualified teacher? New evidence from a longitudinal
cohort study in England. British Journal of Educational Studies
Jerrim, J., Sims, S., Taylor, H. & Allen, R. (2020c) I quit! Is there an association between
leaving teaching and improvements in mental health? British Educational Research Journal.
Allen, R., Benhenda, A., Jerrim, J. & Sims, S. (2019) New evidence on teachers’ working hours in England.
An empirical analysis of four datasets. Research Papers in Education.
Jerrim, S. & Sims, S. (2020b) Teacher workload and wellbeing. New international evidence
from the OECD TALIS study. Teaching and Teacher Education (revise and resubmit).
Jerrim, J. & Sims, S. (2020c) School accountability and teacher stress. International evidence
from the OECD TALIS study.
Sims, S. & Jerrim, J. (2020) How does the school working environment predict teachers’ job
satisfaction, stress and exit from the profession? Evidence from linked survey and
administrative data.
Sims, S., Jerrim, J., Taylor, H. & Allen, R. (2020) Is teaching really bad for your health? New
evidence from biomarker data. Oxford Review of Education (revise and resubmit).
6
Acknowledgements
The Nuffield Foundation is an independent charitable trust with a mission to advance social
wellbeing. It funds research that informs social policy, primarily in Education, Welfare, and
Justice. It also funds student programmes that provide opportunities for young people to
develop skills in quantitative and scientific methods. The Nuffield Foundation is the founder
and co-funder of the Nuffield Council on Bioethics and the Ada Lovelace Institute. The
Foundation has funded this project, but the views expressed are those of the authors and not
necessarily the Foundation. Visit www.nuffieldfoundation.org. We are grateful for their
support. Helpful comments have been received on the draft from our project advisory group,
whom we would like to thank for their input and support.
Secure data citations
This research has used the UK Biobank Resource under Application Number 48217, as well as
the Annual Population Survey under the following citation:
Office for National Statistics, Social Survey Division (2019) Annual Population Survey, 2004-
2018: Secure Access. [data collection]. 14th Edition. UK Data Service. SN: 6721,
http://doi.org/10.5255/UKDA-SN-6721-13
Office for National Statistics, Social Survey Division (2016) Annual Population Survey: Well-
Being, April 2011 - March 2015: Secure Access. [data collection]. UK Data Service. SN: 7961,
http://doi.org/10.5255/UKDA-SN-7961-1
7
Contents
Executive summary .................................................................................................................... 2
Chapter 1 Introduction ............................................................................................................... 8
Chapter 2 How does the mental health and wellbeing of teachers in England compare to other
countries? ................................................................................................................................. 15
Chapter 3 How does the mental health and wellbeing of teachers compare to workers in other
professions?.............................................................................................................................. 29
Chapter 4 Evidence of teacher health using biomarker data.................................................... 45
Chapter 5 Has the mental health and wellbeing of teachers in England improved or declined
over time?................................................................................................................................. 50
Chapter 6 How does unhappiness and anxiety amongst teachers in England vary over the
academic year? ......................................................................................................................... 62
Chapter 7 The wellbeing and lifestyles of recently qualified teachers .................................... 68
Chapter 8 Is there an association between leaving teaching and improvements in mental
health? ...................................................................................................................................... 78
Chapter 9 New evidence on teachers’ hours of work .............................................................. 86
Chapter 10 The link between teacher workload and wellbeing ............................................... 98
Chapter 11 School accountability and teacher stress International evidence from the OECD
TALIS study........................................................................................................................... 109
Chapter 12 The link between the school working environment and teachers’ job satisfaction,
stress and exit from the profession? ....................................................................................... 122
Chapter 13 How did the early stages of the Covid-19 pandemic affect teacher wellbeing? . 130
Chapter 14 Conclusions ......................................................................................................... 144
References .............................................................................................................................. 153

8
Chapter 1 Introduction
1.1 Overview
Over the last decade there has been renewed academic and public policy interest in wellbeing
and mental health. This has coincided with a notable increase in reported mental health
problems across the UK, including the proportion of individuals taking prescription medicines
for illnesses such as anxiety and depression (Iacobucci, 2019). It is well known that the
prevalence of mental illness varies by key demographic characteristics, such as age, gender,
ethnicity and socio-economic status (Health and Safety Executive, 2019). Yet previous
research has also suggested that mental ill health, and low levels of wellbeing, differs between
professions (Johnson et al., 2005).
One occupation where there has been particular concern about mental health problems is
teaching (Stansfeld et al., 2011; Johnson et al., 2005), with staff working long hours during
term time (Allen et al., 2019) and under ever-increasing pressure from the system of school
accountability (Perryman & Calvert, 2019). This has, in turn, contributed to ongoing
difficulties with recruiting and retaining sufficient numbers of high-quality teaching staff
(Cooper-Gibson Research, 2018), further compounded by the fact that almost 4,000 teachers
in England are on long-term sickness leave due to stress (Liberal Democrats, 2018).
There are many potential causes thought to be leading to these low levels of wellbeing amongst
teaching staff. Recent policy attention in England has focused upon the issue of workload,
given that teachers are known to work long and often unsociable hours (at least during term
time). Yet other key challenges include the data-driven culture of school accountability that
has become an important element of the education system in England. Such issues may be
either exacerbated or diminished by aspects of the school working environment, including
attitudes towards pupil discipline, the extent of collaboration amongst teachers and the support
teachers receive from senior leaders.
The main aim of this report is to provide new, independent academic evidence into the
important education policy issue of teacher wellbeing and mental health. In doing so, it
provides the largest and most comprehensive assessment on the mental health and wellbeing
of teachers in England to date.
9
1.2 Previous literature
There has been a reasonable degree of previous research into the mental health and wellbeing
of teachers. This can be divided into two broad strands. The first is descriptive in nature, and
seeks to understand whether working as a teacher is correlated with worse mental health
outcomes and lower levels of wellbeing than other occupational groups. The second is devoted
to the potential drivers of low levels of wellbeing amongst teachers, focusing upon the specific
contribution made by particular aspects of their job. Here, we provide a brief overview of the
existing literature for both.
Starting with the former, Johnson et al. (2005) investigated work-related stress across 26
occupations, finding that teachers had one of the lowest levels of psychological wellbeing out
of any of the professions considered. Surveying 555 teachers using the Warwick-Edinburgh
Mental Wellbeing Scale (WEMWBS), Kidger et al. (2016) suggested that ‘the mean teacher
wellbeing score was lower than reported in working population samples’1, concluding that
‘wellbeing is low and depressive symptoms high amongst teachers’. Similarly, in a random
sample of over 1,500 teachers, Travers et al. (1993) found that teachers reported ‘stress-related
manifestations that were far higher than the population norms and of other comparable
occupational groups’. Based upon an investigation of 290 school leaders, Phillips, Sen and
McNamee (2008) found a similar result for headteachers, with this group having ‘poor physical
and mental health compared to the general population of workers’. This is consistent with a
recent analysis by the school inspectorate in England, Ofsted, who found teachers to have lower
levels of life satisfaction than the population as a whole (Ofsted, 2019). Another recent analysis
by Worth and Van den Brande (2019) reached a similar conclusion, with teachers feeling tenser
and more worried about their job than those employed in other occupations. Likewise, Rose
(2003) found that primary teachers had one of the highest levels of work-related stress, while
Stansfeld et al. (2011) claim teachers to be at above average risk of suffering mental ill health.
Relatedly, Bamford and Worth (2017) discovered that teachers who left the profession for
another job experienced a large increase in job satisfaction, and a small increase in subjective
wellbeing, compared to those who stayed. Yet there are also studies that reach rather different
conclusions. For instance, Bryson, Stokes and Wilkinson (2019) conclude that ‘school staff are
more satisfied and more contented with their jobs than like employees in other workplaces’.
1 Here, ‘working population sample’ refers to the general population (not specifically professional workers).
10
With respect to the potential factors that drive low levels of wellbeing amongst teachers, there
is a small but growing qualitative literature on working hours and the changing composition of
workload within the teaching profession. This research tends to find that teachers are
dissatisfied with their workload (Cooper-Gibson, 2018; Lam & Yan, 2011; Perryman &
Calvert, 2019) but also emphasises that certain aspects of workload are viewed more negatively
than others. In particular, the growing demands of assessment, marking and data entry, often
in order to comply with (perceived) demands of accountability systems are particularly
unpopular with teachers (Bradbury & Roberts-Holmes, 2018; Perryman & Calvert, 2019;
Selwin, Nemorin, & Johnson, 2017). Moreover, a related literature has found that teachers who
experience greater demands in the workplace are more likely to experience burnout (Fernet et
al., 2012; Hakanen, Bakker, & Schaufeli, 2006; Kokkinos, 2007) and reduced job satisfaction
(Kinman, Wray, & Strange, 2011; Skaalvik & Skaalvik, 2009). Such research often stresses
the importance of teachers acting autonomously – in the sense of endorsing the value of the
tasks they are required to undertake – rather than doing them solely in order to comply with
outside demands (Fernet et al., 2011; Skaalvik & Skaalvik, 2009).
Outside of working hours and workload, accountability (holding teachers responsible for pupil
achievement) has also often been cited as having a detrimental impact upon teachers’ mental
health. Large-scale quantitative research on this matter has, however, often been conducted in
the United States. Ryan et al. (2017), for instance, found that ‘accountability policies may affect
teacher stress’, which in turn leads to greater levels of teacher turnover. Likewise, Berryhill,
Linney and Fromewick (2009) suggested that certain types of accountability can lead to role
conflict and reduced self-efficacy amongst staff. After reviewing a range of literature, Saeki et
al. (2015) conclude that ‘accumulating research suggests that test-based accountability
practices have unintended, negative effects on teacher wellbeing, instructional practices, and
student learning’, while Jones and Egley (2004) found that teachers in Florida felt
accountability was having a negative effect upon the curriculum, teaching and learning and
teacher motivation. Similar notions were highlighted by Valli and Buese (2007), who claimed
that accountability had increased the expectations placed upon primary schoolteachers in the
United States, with negative, unintended consequences for ‘teachers’ relationships with
students, pedagogy, and sense of professional well-being’. This was echoed by Richards
(2012), who found that the ‘constant pressure of being accountable’ was one of the top five
sources of stress in teachers’ jobs.
11
Finally, research suggests that the quality of the working environment – defined as policies and
shared ways of working that are within the proximal control of school leadership and affect
teachers’ ability to fulfil their job roles – has an important influence upon teachers (Simon &
Johnson, 2015). Supportive school leadership has repeatedly been found to be particularly
important (Boyd et al., 2011; Ladd, 2011, Kraft et al., 2016). However, the importance of other
aspects of the working environment remains unclear, with conflicting findings on the
importance of disciplinary standards (Boyd et al., 2011; Kraft et al., 2016), teacher
collaboration (Kraft et al., 2016) and workload (Ladd, 2011).
1.3 Policy background
There has been increased concern across government in the mental health and wellbeing of the
population over the last decade. This started with the commitment made by David Cameron to
regularly measure personal wellbeing across society (Cameron, 2010). Further initiatives were
introduced by Theresa May, including training for teachers into how to spot mental health
problems within schools and extra support provided to local authorities to deal with mental
health issues (Prime Minister’s Office, 2019). At the same time, there has been a major drive
amongst education policymakers in England over the last five years to reduce teacher workload
– thought, by many, to be a key driver of low levels of teacher wellbeing. This included issuing
a consultation on teacher workload, the Department for Education setting up independent
review groups, committing to measuring teacher workload biannually, publishing advice and
guidance to schools on how workload can be reduced, and funding collaborative projects to
reduce workload (Department for Education, 2019a).
In January 2019, the Department for Education then published their retention and recruitment
strategy (Department for Education, 2019b). This included many elements that were designed
– either implicitly or explicitly – to improve teacher wellbeing. It included simplifying the
accountability system and reducing the pressure that this was placing upon teachers. There
were also key commitments to try and reduce the workload placed upon teachers, particularly
time that is spent upon unnecessary tasks. Similarly, a key part of the strategy was to make
teaching more attractive as a profession, in terms of fitting in with modern lifestyles and other
aspects of teachers’ lives. This included the possibility of flexible working. Likewise, it
proposed that additional support should be put in place to better support early career teachers,
including a reduced timetable and providing the resources they need to undertake the
appropriate professional development.
12
With the wellbeing of teachers being a key focus of this strategy, the Department for Education
then set up an expert group to provide further suggestions as to how the teaching profession
could be better supported (Department for Education, 2019c). Seven recommendations were
made by this advisory group in June 2020, echoing some of the calls made within the academic
papers upon which this report is based. This included working with the sector to develop a
wellbeing charter that receives ministerial backing, improving access to online resources
designed to support teachers’ mental health and measuring the wellbeing of teaching staff at
regular intervals, along with a commitment to review the impact of its approach (Gibb, 2020).
In addition, it has been suggested that wellbeing is integrated into schools’ training and
workload policies, that it is built into wider communication strategies and that employers’
regulatory responsibilities around wellbeing are made clear.
There has also recently been the Covid-19 pandemic, with little currently known about how
this has impacted upon the mental health and wellbeing of teachers, including how this
compares to other occupational groups. The Department for Education has, nevertheless, been
active in this policy area. This includes the development of new online resources for schools
to boost mental health support for staff and pupils, and developing a new pilot project with
Education Support to provide online peer support and telephone supervision from experts to
around 250 school leaders (Department for Education, 2020a).
1.4 Contribution of this work
The contribution of this report to the existing literature – and ongoing policy discussion – is
twofold. First, although there have been a number of studies into teacher health and wellbeing
previously, the results have not been entirely conclusive. For instance, although most existing
studies claim that teachers have lower levels of wellbeing and worse mental health than other
professional groups, a small number of existing studies have disputed this. Moreover, a number
of key questions remain unanswered. Is the problem of low wellbeing and mental ill health
really that much worse for teachers in England than teachers in other countries? Is there any
evidence that the mental health and wellbeing of teachers in England has declined over time,
or if teachers quit the profession for another job that their mental health improves? Currently,
the evidence base on such matters remains limited. The first purpose of this report is hence to
provide the most comprehensive picture on the mental health and wellbeing of teachers within
a comparative perspective to date.
13
The second half of the report moves on to consider potential drivers of mental ill health and
low levels of wellbeing amongst teachers. For instance, although the long work hours of
teachers have been widely discussed amongst researchers and policymakers, few have directly
estimated how strongly such workload factors are related to teacher wellbeing. Likewise,
accountability measures (such as school league tables and Ofsted inspections) are often blamed
for contributing to low levels of wellbeing amongst teachers. Yet relatively few empirical
large-scale quantitative studies have investigated how different aspects of the school
environment (e.g. the information used in teacher appraisals, the pressure that colleagues feel
under) are linked to accountability-induced stress within the teaching profession. Likewise,
little is currently known about how certain key aspects of teachers’ jobs (e.g. the quality of
school leadership, the approach to pupil discipline) is linked to their job satisfaction, wellbeing
and, ultimately, their decision to leave or remain in their jobs. The second key aim of this report
is to provide new evidence into such issues.
1.5 The definition and identification of teachers within the datasets
The focus of this report is the mental health and wellbeing of teachers in England. However,
due to strengths and limitations of the different datasets we analyse, the precise definition used
(or the particular group(s) we focus upon) vary across the different chapters within this report.
Where possible, separate results are presented for primary teachers, secondary teachers,
headteachers and (occasionally) those who specialise in teaching children with special
educational needs. Identification of the teacher group(s) being analysed is provided at the start
of each chapter.
1.6 Structure of the report
The remainder of this report is now structured as follows. A cross-national comparison of
teachers’ workload stress and workplace wellbeing is presented in Chapter 2, using data from
the 2018 Teaching and Learning International Study (TALIS) to consider the situation in
England from a cross-national comparative perspective. Chapter 3 provides new evidence on
how the mental health and wellbeing of teachers in England compares to individuals working
in other professional jobs, drawing upon data from several large-scale databases. This is
followed in Chapter 4 by a similar comparison of teachers’ physical health to other
occupational groups drawing, uniquely, upon objective biomarker data. Next, the report turns
to trends over time in teachers’ wellbeing and mental health in Chapter 5, exploring whether
there is any evidence of recent improvement or decline. Chapter 6 then turns to variation in

14
teachers’ anxiety and happiness levels across the academic year, presenting the first evidence
as to whether there are particular school terms where wellbeing amongst teachers is particularly
low. The lifestyles of recently qualified junior teachers are then explored in Chapter 7, before
Chapter 8 turns to whether middle-aged teachers who quit teaching to pursue alternative
employment become happier and (mentally) healthier as a result.
The report then turns to potential drivers of mental ill health. Chapter 9 provides, to our
knowledge, the most complete analysis of teachers’ working hours to date, while Chapter 10
presents new evidence on how this factor (working hours) is related to teachers’ workload
stress and workplace wellbeing. The issue of school accountability is investigated in Chapter
11. Chapter 12 then considers how five key aspects of the school working environment
(including school leadership, workload and discipline) are linked to teachers’ job satisfaction,
workload stress and retention within the profession. Chapter 13 presents some emerging
evidence on how teacher wellbeing was affected in the early stages of the Covid-19 pandemic.
Finally, Chapter 14 concludes with key findings from the report, limitations with the evidence
base and recommendations for policy and practice.

15
Chapter 2 How does the mental health and wellbeing
of teachers in England compare to other countries?
2.1 Introduction
In the previous chapter, we provided an overview of the existing literature on the mental health
of teachers, with a particular focus on evidence from England. From this, it became clear that
there are some notable gaps in the existing evidence base where our knowledge of teachers’
mental health remains sparse.
One prominent example is a lack of cross-national comparative evidence; do teachers in
England have lower levels of person wellbeing, feel more stressed in their jobs and believe that
their job has a bigger (negative) impact upon their mental health than teachers in other
countries? If so, what do they believe to be the root causes of this stress and the area(s) that
they believe policymakers should target to address this issue? A cross-country comparison of
the views of teachers on this matter can provide insightful international benchmarks, providing
important context against which the results for England can be judged. In other words, it is one
thing for teachers to say that they feel ‘unhappy’, ‘anxious’ or ‘stressed’. It is another for
teachers in England to indicate that they are more stressed than teachers elsewhere in the world.
After all, every country aims to educate its young people to the best of its capacity; yet this task
is approached in quite different ways. It is therefore important to consider whether the
particular approach used by England – with its heavy workload and its widespread use of
accountability metrics (OECD, 2011) – is placing a greater strain upon teachers here than in
other education systems.
This chapter provides new empirical evidence on this issue. It first compares the wellbeing of
teachers in England to the rest of the UK, focusing upon whether they feel less happy, more
anxious and their life less worthwhile than their counterparts in Scotland, Northern Ireland and
Wales. We then present findings from the 2018 round of the Teaching and Learning
International Survey (TALIS), where teachers from over 40 countries were asked about work-
related stress and the impact that this has upon their mental health.
2.2 Data and methodology
Two data sources are used to compare the mental health of teachers in England to other
countries. The first is the 2011-2018 rounds of the Annual Population Survey (APS), which
facilitates comparisons between England and the other countries which form the UK. This
16
included four questions capturing whether respondents were anxious, felt their life was
worthwhile, and how they rated their happiness and their life satisfaction using a 0-10 scale
(see Jerrim and Sims, 2020a for further details). Using these data, we estimate the proportion
of teachers in England, Northern Ireland, Scotland and Wales who report ‘low/medium’ levels
of life satisfaction, happiness and feelings of their life being worthwhile and ‘high’ levels of
anxiety. This part of the analysis combines primary, secondary, SEN and headteachers into a
single group.
The second data source is TALIS 2018; a cross-national study of teachers and headteachers
coordinated by the OECD. Using these data, we are able to compare mental health indicators
for Key Stage 3 teachers in England to those in 47 other countries, and for Key Stage 1/2
teachers in England to those in 14 other countries. Our analysis of these data focuses upon
responses to two key questions included in this survey. The first asked teachers to report, using
a four-point scale, the extent that they experience stress at work, that work leaves them enough
time for their personal life, impacts upon their mental health and impacts upon their physical
health. The second question asks teachers and headteachers to report the extent to which 11
different tasks cause them stress at work, such as having too much marking, having too much
administrative work and being held accountable to pupils’ achievement.
Using the TALIS 2018 data, the distribution of responses provided by primary and lower-
secondary teachers in England are first documented and compared. The analysis then turns to
cross-national comparisons, illustrating similarities and differences between England and other
countries. For lower-secondary teachers, England will be compared to the average across the
OECD countries that participated in the TALIS 2018 study. As far fewer OECD countries took
part in the primary school study, comparisons will be made between England and the TALIS
average (i.e. the average across all 15 countries that chose to conduct the survey amongst
primary staff).
2.3 The wellbeing of teachers in England compared to the rest of the UK
Table 2.1 provides results from our comparison of teachers’ personal wellbeing across the UK,
based upon our analysis of the APS data. Overall, differences in the personal wellbeing of
teachers across different parts of the UK are relatively small. The percentage of teachers
reporting feeling anxious, unhappy, that their life is not worthwhile and dissatisfied with life
are similar across England, Scotland, Northern Ireland and Wales. Similar findings continue to
emerge if we analyse average personal wellbeing scores using the full 0-10 scale and when

17
using regression analysis (to control for demographic differences in the composition of the
teacher population across different parts of the UK) instead. We hence conclude that the
personal wellbeing of teachers is broadly similar across the four nations of the UK.
Table 2.1 Comparison of the personal wellbeing of teachers across the UK
Group Anxious Unhappy Dissatisfied
Not
worthwhile N
England 21% 21% 12% 6% 16,426
Wales 20% 18% 11% 6% 2,453
Scotland 18% 17% 9% 5% 3,059
Northern Ireland 13% 12% - - 432 Notes: Analysis based upon the Annual Population Survey dataset. Some results for Northern Ireland excluded
due to the small sample size.
2.4 To what extent do primary and lower-secondary teachers say their job negatively
impacts their lives? England compared to other countries.
Table 2.2 turns to the results from TALIS. Around one third of primary and lower-secondary
teachers in England strongly agreed that they experience stress at work, while a further third
agree. A greater proportion of lower-secondary teachers report work-related stress than primary
teachers (70% versus 64%) with the difference statistically significant. Although most teachers
in England disagree that their job has a negative impact upon their mental health, there is again
a difference between primary and secondary. Specifically, 35% of lower-secondary teachers
agree or strongly agree, compared to 28% of primary teachers. On the other hand, most teachers
in England (roughly three quarters) do not believe that their job leaves them enough time for
their personal life. This suggests that workload, and the pressure that this places upon the work-
life balance of teachers, might be linked.
Table 2.2 The impact teaching has upon teachers’ health. Primary and lower-secondary
teachers in England.
Variable
Strongly
Disagree Disagree Agree
Strongly
Agree
Average
Score
I experience stress in my work Primary 1% 34% 33% 31% 2.94
Secondary 2% 28% 32% 38% 3.06
My job leaves me time for my personal life Primary 12% 63% 20% 5% 2.19
Secondary 14% 63% 18% 5% 2.14
My job negatively impacts my mental health Primary 26% 46% 17% 11% 2.13
Secondary 22% 43% 21% 14% 2.27
My job negatively impacts my physical health Primary 35% 43% 14% 8% 1.95
Secondary 32% 41% 17% 11% 2.06 Source = authors’ analysis of TALIS 2018 data for England.
18
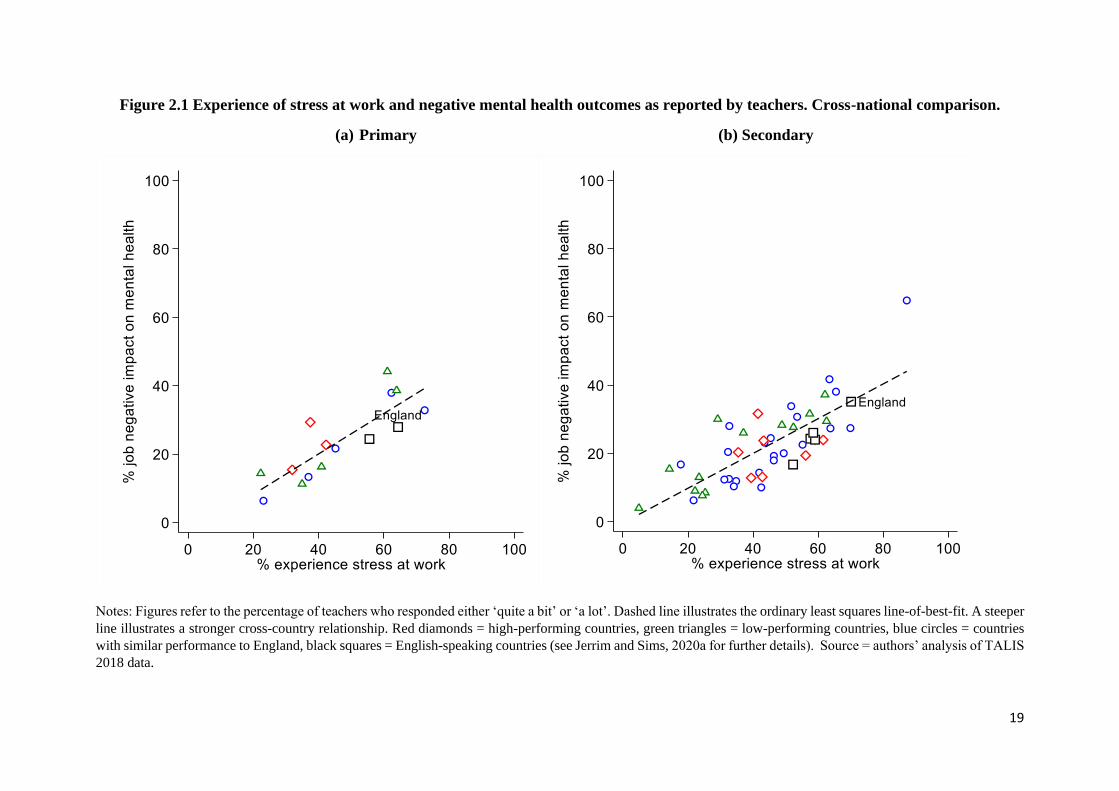
Figure 2.1 compares these results for England compared to a set of ‘high-performing’, ‘low-
performing’ and ‘average-performing’ education systems, as well as highlighting results for
the English-speaking nations (see Jerrim and Sims, 2020a for how these groups are defined).
For both primary and (particularly) lower-secondary, there is evidence that teachers in England
report being more stressed than teachers in other countries. In both panel (a) and panel (b),
England is towards the top-right of the cloud of data points. This illustrates that a greater
proportion of teachers in England agreed or strongly agreed that they experience stress at work
(horizontal axis) and that their job has a negative impact upon their mental health (vertical axis)
than elsewhere. For instance, 70% of lower-secondary teachers in England said that they
experience ‘quite a bit’ or ‘a lot’ of stress at work compared to an OECD average of 49%. The
analogous figures for lower-secondary teachers’ reporting that their job has a negative impact
upon their mental health are 35% (England) and 24% (OECD average). Broadly similar
comparative results emerge for primary teachers, albeit with a much smaller pool of countries
to compare against. Moreover, England also stands out from the other English-speaking
countries that participated in TALIS (denoted in Figure 2.1 by the black square markers). These
results therefore suggest that the education system in England may place more stress upon
teachers than education systems elsewhere across the world.
19
Figure 2.1 Experience of stress at work and negative mental health outcomes as reported by teachers. Cross-national comparison.
(a) Primary (b) Secondary
Notes: Figures refer to the percentage of teachers who responded either ‘quite a bit’ or ‘a lot’. Dashed line illustrates the ordinary least squares line-of-best-fit. A steeper
line illustrates a stronger cross-country relationship. Red diamonds = high-performing countries, green triangles = low-performing countries, blue circles = countries
with similar performance to England, black squares = English-speaking countries (see Jerrim and Sims, 2020a for further details). Source = authors’ analysis of TALIS
2018 data.
20
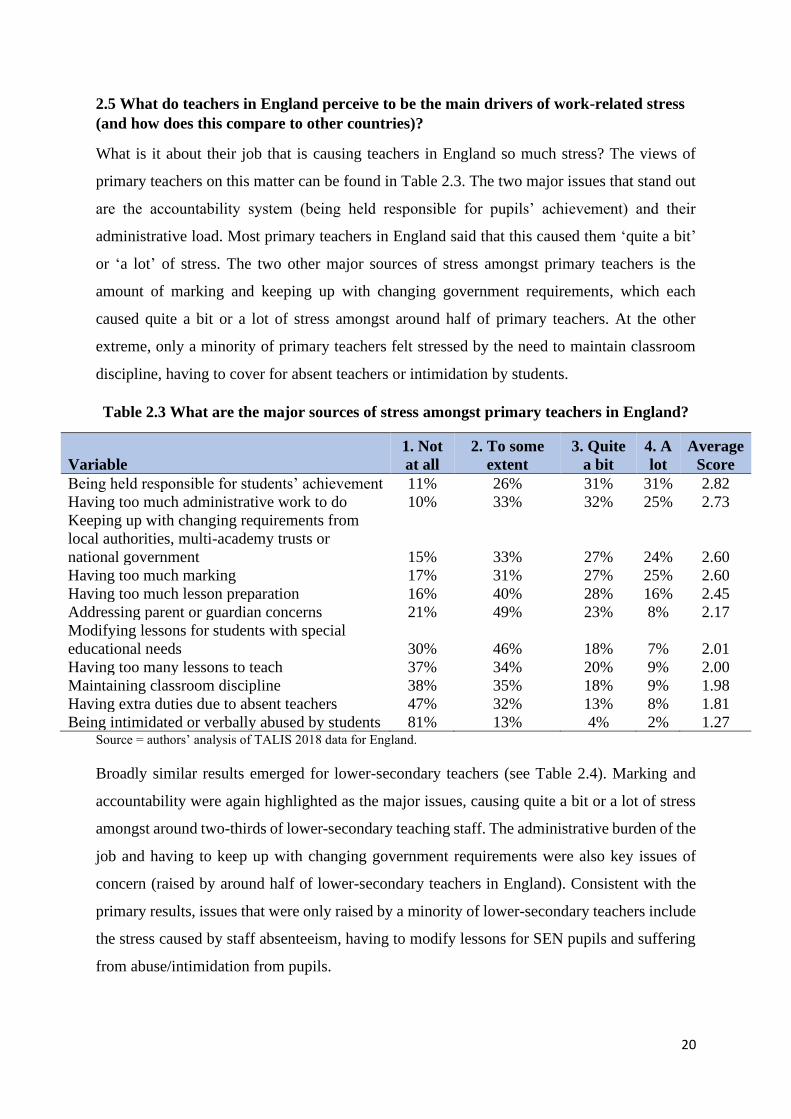
2.5 What do teachers in England perceive to be the main drivers of work-related stress
(and how does this compare to other countries)?
What is it about their job that is causing teachers in England so much stress? The views of
primary teachers on this matter can be found in Table 2.3. The two major issues that stand out
are the accountability system (being held responsible for pupils’ achievement) and their
administrative load. Most primary teachers in England said that this caused them ‘quite a bit’
or ‘a lot’ of stress. The two other major sources of stress amongst primary teachers is the
amount of marking and keeping up with changing government requirements, which each
caused quite a bit or a lot of stress amongst around half of primary teachers. At the other
extreme, only a minority of primary teachers felt stressed by the need to maintain classroom
discipline, having to cover for absent teachers or intimidation by students.
Table 2.3 What are the major sources of stress amongst primary teachers in England?
Variable
1. Not
at all
2. To some
extent
3. Quite
a bit
4. A
lot
Average
Score
Being held responsible for students’ achievement 11% 26% 31% 31% 2.82
Having too much administrative work to do 10% 33% 32% 25% 2.73
Keeping up with changing requirements from
local authorities, multi-academy trusts or
national government 15% 33% 27% 24% 2.60
Having too much marking 17% 31% 27% 25% 2.60
Having too much lesson preparation 16% 40% 28% 16% 2.45
Addressing parent or guardian concerns 21% 49% 23% 8% 2.17
Modifying lessons for students with special
educational needs 30% 46% 18% 7% 2.01
Having too many lessons to teach 37% 34% 20% 9% 2.00
Maintaining classroom discipline 38% 35% 18% 9% 1.98
Having extra duties due to absent teachers 47% 32% 13% 8% 1.81
Being intimidated or verbally abused by students 81% 13% 4% 2% 1.27 Source = authors’ analysis of TALIS 2018 data for England.
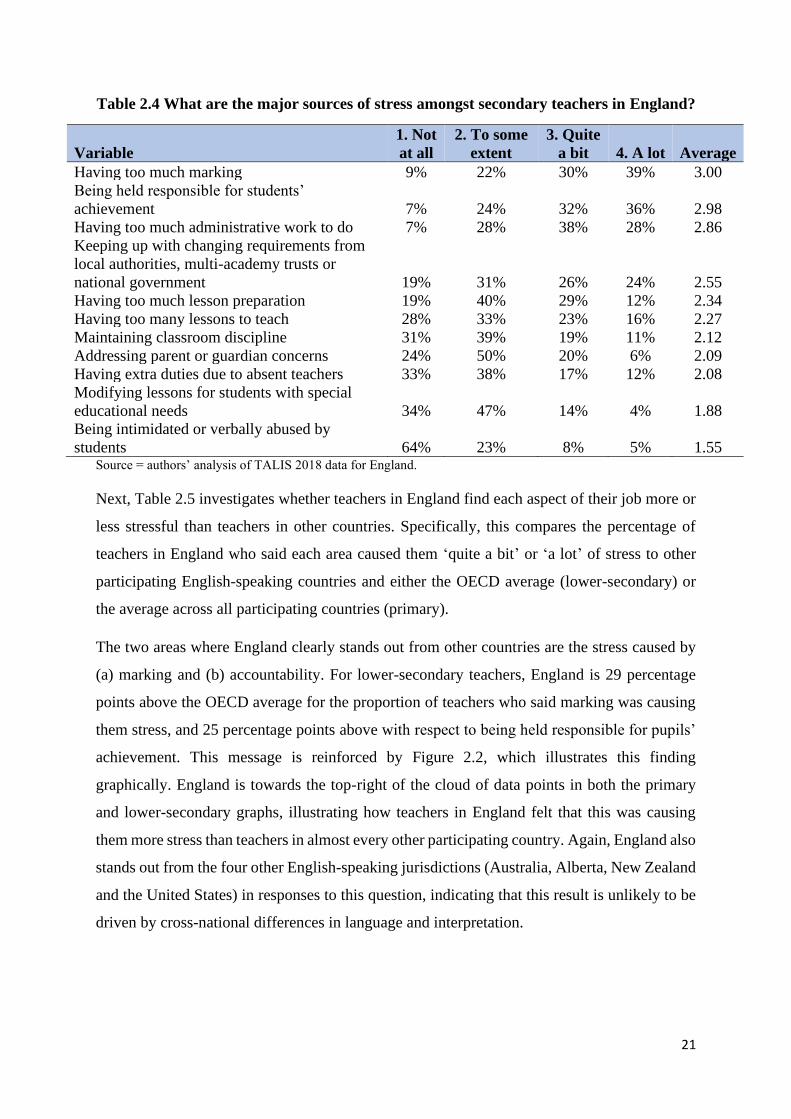
Broadly similar results emerged for lower-secondary teachers (see Table 2.4). Marking and
accountability were again highlighted as the major issues, causing quite a bit or a lot of stress
amongst around two-thirds of lower-secondary teaching staff. The administrative burden of the
job and having to keep up with changing government requirements were also key issues of
concern (raised by around half of lower-secondary teachers in England). Consistent with the
primary results, issues that were only raised by a minority of lower-secondary teachers include
the stress caused by staff absenteeism, having to modify lessons for SEN pupils and suffering
from abuse/intimidation from pupils.
21
Table 2.4 What are the major sources of stress amongst secondary teachers in England?
Variable
1. Not
at all
2. To some
extent
3. Quite
a bit 4. A lot Average
Having too much marking 9% 22% 30% 39% 3.00
Being held responsible for students’
achievement 7% 24% 32% 36% 2.98
Having too much administrative work to do 7% 28% 38% 28% 2.86
Keeping up with changing requirements from
local authorities, multi-academy trusts or
national government 19% 31% 26% 24% 2.55
Having too much lesson preparation 19% 40% 29% 12% 2.34
Having too many lessons to teach 28% 33% 23% 16% 2.27
Maintaining classroom discipline 31% 39% 19% 11% 2.12
Addressing parent or guardian concerns 24% 50% 20% 6% 2.09
Having extra duties due to absent teachers 33% 38% 17% 12% 2.08
Modifying lessons for students with special
educational needs 34% 47% 14% 4% 1.88
Being intimidated or verbally abused by
students 64% 23% 8% 5% 1.55 Source = authors’ analysis of TALIS 2018 data for England.
Next, Table 2.5 investigates whether teachers in England find each aspect of their job more or
less stressful than teachers in other countries. Specifically, this compares the percentage of
teachers in England who said each area caused them ‘quite a bit’ or ‘a lot’ of stress to other
participating English-speaking countries and either the OECD average (lower-secondary) or
the average across all participating countries (primary).
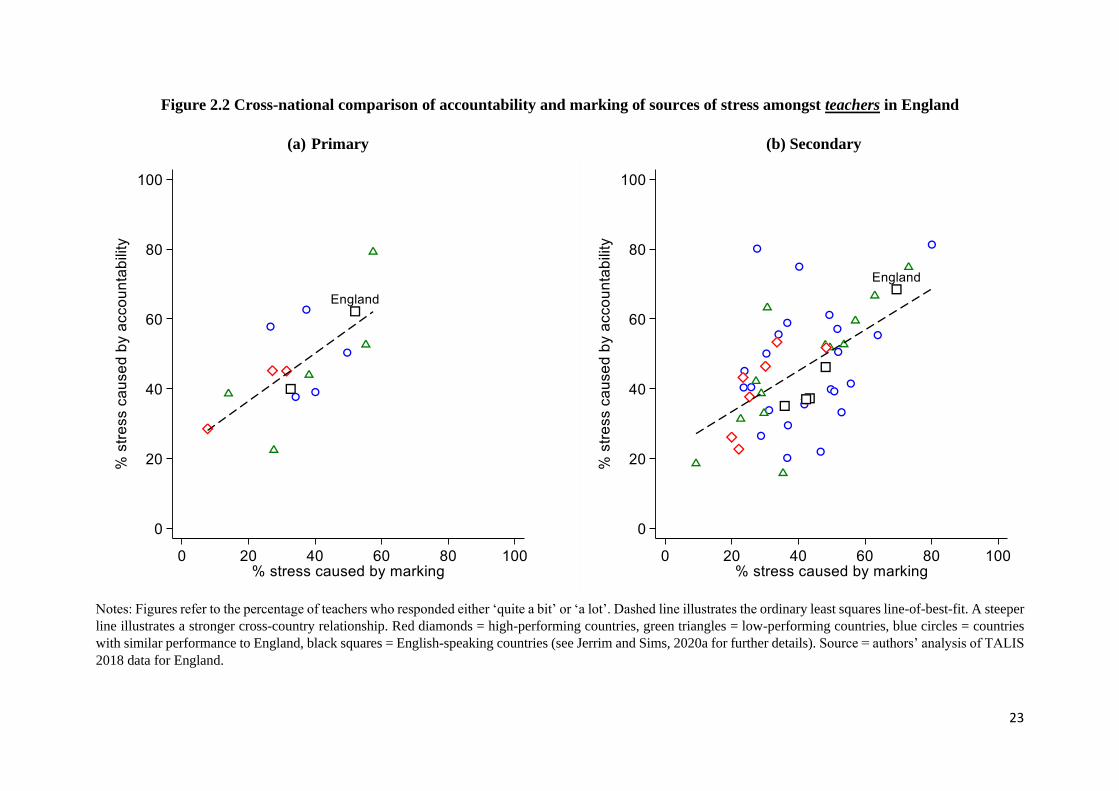
The two areas where England clearly stands out from other countries are the stress caused by
(a) marking and (b) accountability. For lower-secondary teachers, England is 29 percentage
points above the OECD average for the proportion of teachers who said marking was causing
them stress, and 25 percentage points above with respect to being held responsible for pupils’
achievement. This message is reinforced by Figure 2.2, which illustrates this finding
graphically. England is towards the top-right of the cloud of data points in both the primary
and lower-secondary graphs, illustrating how teachers in England felt that this was causing
them more stress than teachers in almost every other participating country. Again, England also
stands out from the four other English-speaking jurisdictions (Australia, Alberta, New Zealand
and the United States) in responses to this question, indicating that this result is unlikely to be
driven by cross-national differences in language and interpretation.

22
Table 2.5 Key drivers of stress amongst teachers in England compared to other English-speaking countries and international averages
Primary
England Australia
TALIS
Average
Too much marking 52 33 35
Being held responsible for students’ achievement 62 40 47
Changing requirements 51 42 41
Too much lesson preparation 44 39 35
Too much administration 57 49 49
Too many lessons to teach 29 29 29
Extra duties due to absent teachers 21 13 23
Abuse from pupils 6 9 10
Addressing parent concerns 30 31 41
Maintaining classroom discipline 27 31 39
Modifying lessons for SEN pupils 24 30 37
Lower-secondary
England Australia Alberta New Zealand USA OECD
Too much marking 69 43 42 48 36 41
Being held responsible for students’ achievement 68 37 37 46 35 44
Too much administration 65 55 29 64 30 49
Too many lessons to teach 39 25 27 24 22 28
Changing requirements 50 38 28 47 32 41
Too much lesson preparation 41 30 33 29 29 33
Extra duties due to absent teachers 29 24 12 23 13 25
Abuse from pupils 13 13 6 12 11 14
Maintaining classroom discipline 31 28 28 30 32 38
Addressing parent concerns 26 24 27 26 20 34
Modifying lessons for SEN pupils 19 25 37 19 22 31 Notes: Figures refer to the percentage of headteachers in each jurisdiction who indicated each task caused them either ‘quite a bit’ or ‘a lot’ of stress. TALIS average for
primary is the average across the 15 countries with data available. OECD average for lower-secondary is the average across the OECD countries that participated in TALIS
2018. Source = authors’ analysis of TALIS 2018 data.
23
Figure 2.2 Cross-national comparison of accountability and marking of sources of stress amongst teachers in England
(a) Primary (b) Secondary
Notes: Figures refer to the percentage of teachers who responded either ‘quite a bit’ or ‘a lot’. Dashed line illustrates the ordinary least squares line-of-best-fit. A steeper
line illustrates a stronger cross-country relationship. Red diamonds = high-performing countries, green triangles = low-performing countries, blue circles = countries
with similar performance to England, black squares = English-speaking countries (see Jerrim and Sims, 2020a for further details). Source = authors’ analysis of TALIS
2018 data for England.
24
Other areas where England is above the OECD/TALIS average are the stress caused by the
administrative burden of the job and keeping up with changing government requirements.
Lower-secondary teachers in England were also more likely to report other aspects of their
workload causing them stress than their peers in other countries; for instance, England was 11
percentage points above the OECD average for lower-secondary teachers saying that they
suffer stress from the number of lessons they teach, with an eight-percentage-point difference
for having too much lesson preparation. Stress from having too much lesson preparation was
also more likely to be highlighted as a concern by primary teachers in England compared to
the average across TALIS participants.
There were, however, also a handful of areas where the results for England are quite positive,
relative to the situation in other countries. As Table 2.5 illustrates, the three key areas where
this holds true are (a) addressing parental concerns, (b) maintaining classroom discipline, and
(c) modifying lessons for SEN pupils. Focusing upon the lower-secondary results, teachers in
England were eight percentage points less likely to say that addressing parental concerns
caused them stress than the OECD average (though this is also true for the other four English-
speaking countries that participated in TALIS). The equivalent figures for maintaining
classroom discipline and modifying lessons for SEN pupils are seven and 13 percentage points
respectively. Similar results hold for primary teachers. This hence helps to reiterate the message
that these three areas are perhaps of less pressing concern to teachers in England, with other
areas (most notably workload and accountability) being much more prominent sources of stress
in their jobs.
2.6 What do primary and lower-secondary headteachers in England perceive to be the
main sources of stress in their job?
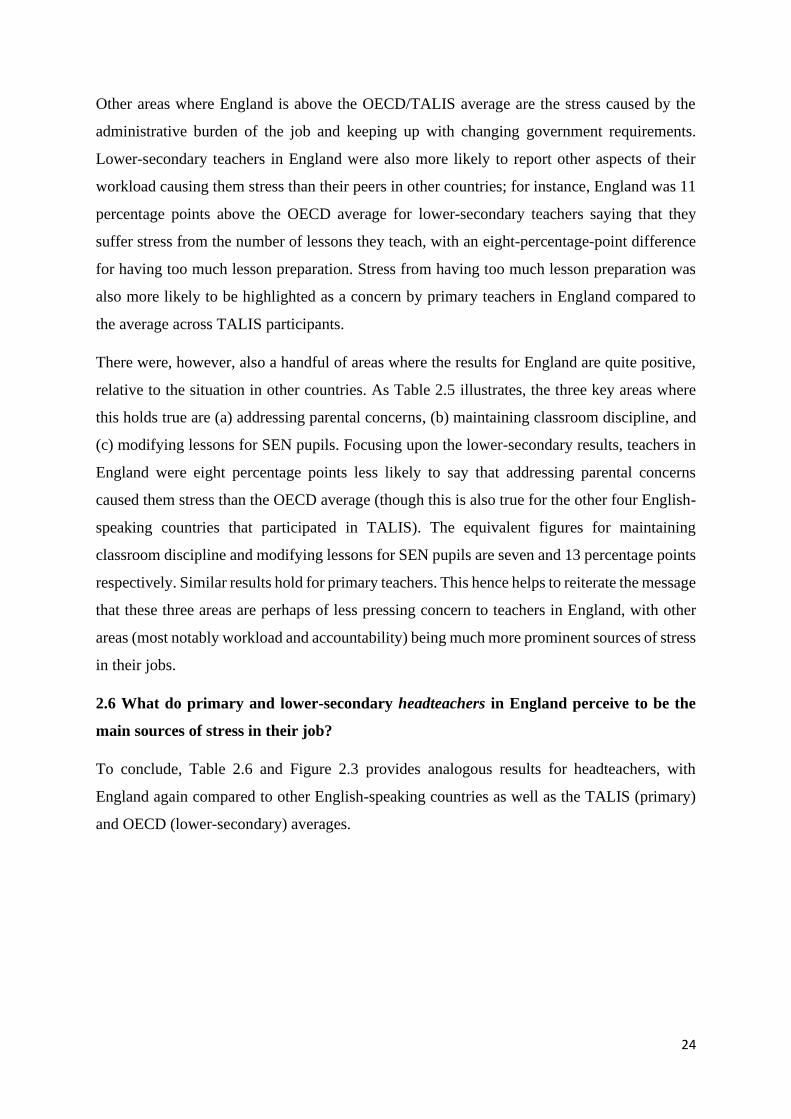
To conclude, Table 2.6 and Figure 2.3 provides analogous results for headteachers, with
England again compared to other English-speaking countries as well as the TALIS (primary)
and OECD (lower-secondary) averages.
25
Table 2.6 Key drivers of stress amongst headteachers in England compared to other countries
(a) Primary
England Australia TALIS average
Being held responsible for students’ achievement 66 41 45
Keeping up with changing requirements 64 59 49
Having extra duties due to absent school staff 38 24 33
Having too much administrative work to do 66 77 65
Accommodating students with special educational needs 34 31 35
Addressing parent or guardian concerns 45 56 47
Maintaining school discipline 30 34 34
Having too much teacher appraisal and feedback work to do 23 27 28
Being intimidated or verbally abused by students 2 5 7
(b) Secondary
England Australia Alberta New Zealand USA OECD
Being held responsible for students’ achievement 65 34 42 37 35 46
Keeping up with changing requirements 66 47 32 47 40 55
Addressing parent or guardian concerns 57 43 38 44 35 46
Maintaining school discipline 40 37 36 38 44 42
Being intimidated or verbally abused by students 2 1 2 6 3 6
Having extra duties due to absent school staff 30 18 20 19 14 37
Having too much administrative work to do 59 74 47 63 54 69
Having too much teacher appraisal and feedback work to do 16 9 20 24 37 28
Accommodating students with special educational needs 15 18 26 24 24 30 Notes: Figures refer to the percentage of headteachers in each country who indicated each task caused them either ‘quite a bit’ or ‘a lot’ of stress. TALIS average for
primary is the average across the 15 countries with data available. OECD average for lower-secondary is the average across the OECD countries that participated in
TALIS 2018. Source = authors’ analysis of TALIS 2018 data.

26
Figure 2.6 Cross-national comparison of accountability and administration of sources of stress amongst headteachers in England
(a) Primary (b) Secondary
Notes: Figures refer to the percentage of teachers who responded either ‘quite a bit’ or ‘a lot’. Dashed line illustrates the line of equality (where the value along the
horizontal and vertical axis is equal). Red diamonds = high-performing countries, green triangles = low-performing countries, blue circles = countries with similar
performance to England, black squares = English-speaking countries (see Jerrim and Sims, 2020a for further details). Source = authors’ analysis of TALIS 2018 data.

27
Consistent with the responses of teachers, being held responsible for pupil achievement and
keeping up with changing government requirements are two of the major sources of stress for
primary and lower-secondary headteachers in England. Around two thirds reported that these
two factors caused them ‘quite a bit’ or ‘a lot’ of stress, which is above the OECD/TALIS
average. Indeed, with respect to accountability for lower-secondary headteachers, the
difference between England and the OECD average is 19 percentage points. The proportion of
headteachers who suffer stress due to accountability and changing requirements is also notably
higher in England than in the other English-speaking countries included in Table 2.6. On the
other hand, although most primary (66%) and lower-secondary (59%) headteachers in England
report that the administrative burden of the job causes them stress, Table 2.6 and Figure 2.3
illustrate that similar views are held amongst headteachers from across the world (including
several of the English-speaking countries).
For most other areas, England is around the average across participating countries. This
includes for the stress caused by staff absenteeism, maintaining school discipline and
intimidation or abuse from pupils. Moreover, there are several aspects of the job that appear to
cause less stress to lower-secondary headteachers in England than their counterparts in other
countries. This includes the amount of teacher appraisal and feedback they undertake (16% of
lower-secondary heads in England reported that this caused them quite a bit or a lot of stress
compared to an OECD average of 28%) and accommodating SEN pupils (15% in England
compared to 30% of headteachers across the OECD).
2.7 Summary
This chapter has provided new evidence on how the wellbeing and mental health of teachers in
England compares to other countries Several key findings emerge. First, there is little evidence
that the personal wellbeing of teachers varies across the UK; levels of life satisfaction, anxiety
happiness and feelings that life is worthwhile are broadly similar amongst teachers in England,
Northern Ireland, Scotland and Wales. Second, teachers in England are more likely to say that
they experience stress at work, and that their job has a negative impact upon their mental health,
than teachers in most other (non-UK) countries. Third, teachers in England highlight four
factors as key drivers of the stress caused by their work: (a) the accountability system, (b)
marking, (c) keeping up with changing government requirements, and (d) the administrative
load. Fourth, critically, primary and lower-secondary teachers are much more likely to say that
these aspects of their workload cause them stress than teachers in many other countries across
the world. There hence may be something unique about the education system in England that

28
puts a particularly heavy burden upon the teaching profession. Finally, while accountability
and changing government requirements cause more stress to headteachers in England than
other countries, there are a number of areas where the opposite holds true (particularly for those
who lead secondary schools). This includes teacher feedback/appraisal and accommodating
SEN pupils, with fewer lower-secondary headteachers in England saying this causes them
stress than lower-secondary headteachers in other countries.

29
Chapter 3 How does the mental health and wellbeing
of teachers compare to workers in other professions?
3.1 Introduction
The previous chapter illustrated how teachers in England were more likely to report that their
job negatively impacts upon their mental health than teachers in other countries. But is the
problem of low wellbeing and mental ill health really that much worse for teachers in England
than for other professional groups? The literature overviewed in chapter 1 suggested that the
existing evidence base on this matter was somewhat inconclusive. While most existing work
provides strong support for this notion (e.g. Travers & Cooper, 1993; Johnson et al., 2005),
some studies within this literature do not (e.g. Bryson, Stokes & Wilkinson, 2019).
Consequently, the aim of this chapter is to provide the largest and most comprehensive
investigation of how the prevalence of mental health problems and low levels of wellbeing
compares across occupations to date. A unique feature is that it brings together evidence from
multiple large datasets, encompassing a range of different measures, using a consistent
methodology for each. In doing so, this chapter triangulates evidence across multiple sources,
providing a holistic picture of how the wellbeing and mental health of teachers compares to
other occupational groups.
3.2 Data and methodology
Within this chapter we draw upon data from across 11 datasets in total, though the analysis
focuses upon three of these in particular. The first is the Labour Force Survey, with data pooled
together from 2011 to 2018. The total teacher sample size is 16,815 primary, 16,243 secondary,
3,288 SEN teachers and 2,509 headteachers, though for certain questions the number of
observations is smaller. Using these data, we are particularly interested in the percentage of
teachers with (a) a long-lasting problem of either depression, bad nerves, anxiety, mental
illness, nervous disorders and (b) the percentage of teachers who said that they had suffered
from stress, depression or anxiety that was caused or made worse by their job.
The second dataset used is the Annual Population Survey, drawing upon data from between
March 2011 and December 2018, with a total sample size of 5,841 primary teachers, 5,825
secondary teachers, 1,231 SEN teachers and 868 headteachers. In this survey, respondents were
asked about four measures of personal wellbeing (anxiety, life satisfaction, happiness and
30
whether life is worthwhile) using a 0–10-point scale. Our focus is upon the percentage of
teachers reporting high levels of anxiety, low levels of life satisfaction, low levels of happiness
and feelings that their life is not worthwhile (see Jerrim et al., 2020a for how these are defined).
The third dataset of focus is the UK Biobank. This collected data from around half a million
volunteers between the ages of 40 and 69 between 2006 and 2010. In total, the main UK
Biobank data collection includes 4,602 primary, 5,943 secondary, 994 SEN and 1,102
headteachers. As part of the data collection, respondents completed a questionnaire. This
included questions measuring their happiness with different aspects of their life (e.g. work,
family, finances, friends, health, in general) and about how they had felt over the past two
weeks (designed to capture symptoms of depression). They were also asked about medications
that they are currently prescribed and any medical conditions that they have. We use this
information in this chapter to investigate whether teachers are more likely to be taking
antidepressants than comparable individuals working in other professional occupations and
whether they are more likely to have a medically diagnosed mental health condition.
In addition to these three datasets, our analysis also integrates information from eight other
large survey datasets: Health Survey for England (HSE), Work Employment Relations Study
(WERS), Understanding Society (USOC), Adult Psychiatric Morbidity Survey (APMS), Next
Steps (NS), British Cohort Study (BCS70), National Child Development Study 1958
(NCDS58) and Parents of the Millennium Cohort Study (MCS2000). Further details about each
of these data sources, including discussion of sample sizes and measures available, are
available in Jerrim et al. (2020a).
To begin, an (unconditional) occupational ‘ranking’ of wellbeing and mental health of staff has
been constructed using the two largest datasets (the LFS and APS). The percentage with a poor
outcome (e.g. percentage with a mental health problem; percentage with a ‘high’ anxiety score)
will be presented for each occupation. Teachers will be compared to each of the other
occupations in these unconditional estimates.
Propensity score matching is then applied to these data. This will essentially pair each teacher
in the dataset to a ‘comparable’ individual working in another profession, in terms of their age,
gender, education, whether working full- or part-time, ethnicity and marital status2. The mental
health outcomes of teachers are then compared to their matched comparators. Within this
2 In the Biobank dataset, the matching model will also include number of children in the household, whether a
parent or a sibling has had depression and whether a relative died in the two years before the interview.

31
chapter, we will focus upon differences between teachers and some other specific occupations.
This encompasses a wide range of jobs, including finance and investment analysts, authors and
writers, graphic designers, civil servants, social workers, journalists, HR officers, IT
professionals, academics, marketing professionals, management consultants, solicitors,
accountants and nurses. These occupations, like teachers, are all classed as professional or
associate professional jobs and hence represent reasonable alternative career choices that a
wide array of teachers might have made. Yet they are also diverse in terms of some being office
jobs (e.g. accountants, HR workers, civil servants), others being potentially stressful yet
rewarding public sector jobs like teaching (e.g. nurses, social workers), some regularly have
tight deadlines and time pressures (e.g. journalists), while others are still within the education
sector (e.g. academics). We will also draw comparisons between teachers and other
professional/associate professional workers as a whole.
3.3 APS Results. Comparisons of personal wellbeing across occupations
Figure 3.1 begins by presenting results for the percentage of ‘anxious’ and ‘unhappy’ teachers
using the APS. Each circle in these graphs represents one of the four-digit SOC occupations,
with the dashed lines illustrating the average across all occupational groups. Unconditional
comparisons to all other occupations can be found in panel (a) on the left-hand side of Figure
3.1, while the matching results (where secondary teachers have been matched to
observationally comparable individuals working in other professional jobs) are provided in
panel (b) on the right.

32
Figure 3.1 The percentage of teachers who are anxious and unhappy compared to other occupations. Analysis of the APS.
(a) Unconditional (all occupations) (b) Matched to other professions
Notes: Each data point represents one occupation. Figures refer to the percentage of workers who are unhappy (horizontal axis) and anxious (vertical axis). Dashed lines illustrate the
unweighted occupational average. The graph on the left presents the unconditional estimates for all occupations. The graph on the right presents the matching results, where comparators have
been restricted to those working in professional jobs. Results restricted to occupations where the sample size is above 250. Source = authors’ analysis of the Annual Population Survey.
33
The results for the APS anxiety (vertical axis) and happiness (horizontal axis) questions can be
found in Figure 3.1. Starting with the former, the unconditional results presented in panel (a)
suggest that teachers tend to be quite an anxious occupational group. All four of the teacher
groups (primary, secondary, SEN and headteachers) sit above the dashed horizontal line (the
average across all occupations), suggesting that teachers typically feel more anxious than
workers in most other jobs. This is particularly the case for SEN teachers, and for headteachers,
who have some of the highest levels of anxiety out of any occupational group. Yet it seems that
this result is largely due to occupational selection; once teachers are matched to other workers
based upon demographic background characteristics, anxiety levels are around the
occupational average. This is illustrated by the fact that, in panel (b) on the right-hand side of
Figure 3.1, the data points for the four teaching groups now all sit around the dashed horizontal
line. Overall, although teachers tend to have above-average levels of anxiety, this seems to be
driven more by who selects into the occupation, rather than it likely being caused by their
occupation per se.
Turning to the results for unhappiness, the unconditional results in panel (a) suggest that
teachers are less likely to be unhappy than most other occupational groups; the four data points
for teachers fall to the left of the dashed vertical line. This finding is particularly stark for
headteachers who have one of the lowest levels of unhappiness out of any of the occupations
considered (16% of headteachers are not happy compared to an occupational average of 23
percent). However, the matching estimates presented in panel (b) again draw the results for
teachers somewhat closer to the dashed vertical line. Consequently, once demographic
background characteristics have been controlled, the proportion of unhappy teachers is similar
to the percentage of unhappy employees in other professional jobs. The one potential exception
remains headteachers, where there continues to be lower levels of unhappiness than amongst
demographically comparable individuals working in other occupations.
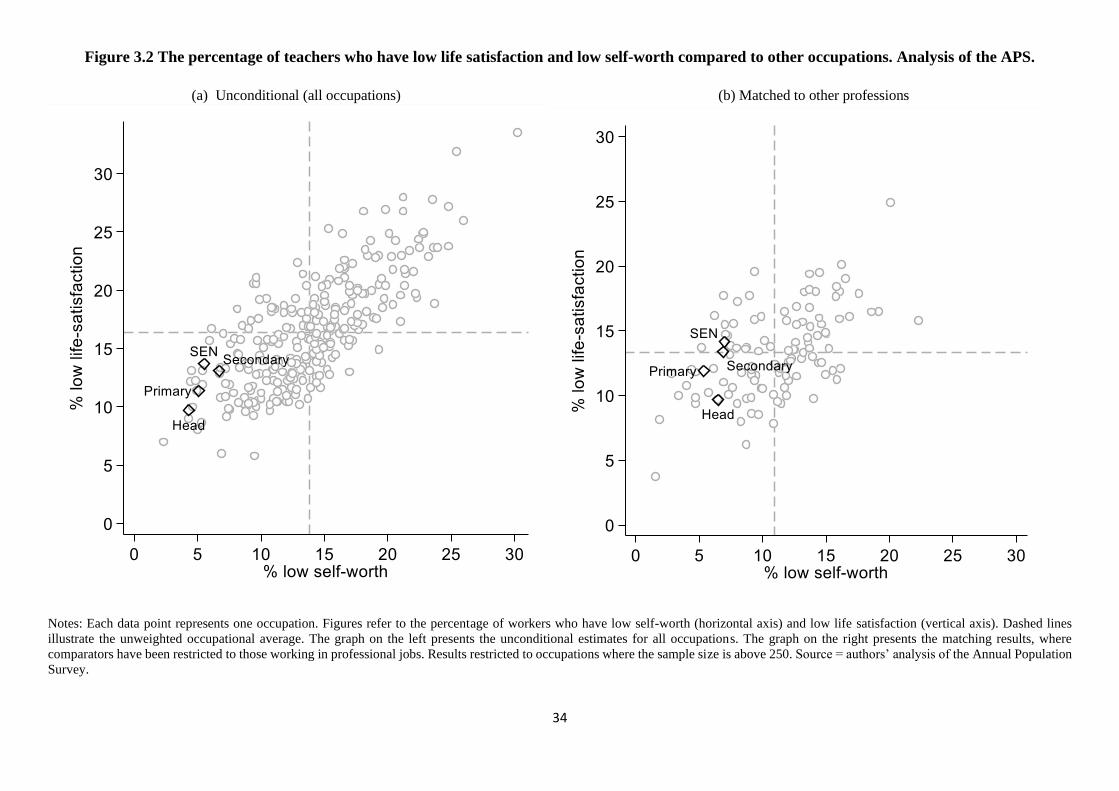
Figure 3.2 provides analogous results for the APS life satisfaction (vertical axis) and self-worth
(horizontal axis) questions. In the unconditional estimates, panel (a), the results for teachers
compare quite favourably to those who work in other occupations. The data points for primary,
secondary, SEN and headteachers all sit in the bottom left-hand quadrant, indicating that
teachers are less likely to suffer from problems with low life satisfaction and low self-worth
than workers in most other jobs. The results for self-worth are particularly striking, with this
aspect of personal wellbeing being much less likely to affect teachers than most other
occupational groups.
34
Figure 3.2 The percentage of teachers who have low life satisfaction and low self-worth compared to other occupations. Analysis of the APS.
(a) Unconditional (all occupations) (b) Matched to other professions
Notes: Each data point represents one occupation. Figures refer to the percentage of workers who have low self-worth (horizontal axis) and low life satisfaction (vertical axis). Dashed lines
illustrate the unweighted occupational average. The graph on the left presents the unconditional estimates for all occupations. The graph on the right presents the matching results, where
comparators have been restricted to those working in professional jobs. Results restricted to occupations where the sample size is above 250. Source = authors’ analysis of the Annual Population
Survey.
35
The conditional results in panel (b) suggest that, once the demographic background of
respondents has been controlled, life satisfaction amongst primary, secondary and SEN
teachers is actually around the average for workers in professional jobs; the data points for
these groups sit close to the dashed horizonal line. Yet teachers still appear to be better off than
other professionals in terms of self-worth; the data points for teachers sit to the left of the
dashed vertical line, indicating that they are less likely to suffer with this aspect of their
wellbeing than their peers in other professions. Again, the results for headteachers are amongst
the most promising out of any professional occupational group, with comparatively few
reporting low life satisfaction and low self-worth as a problem. Together, on these two aspects
of personal wellbeing, the results for teachers are actually quite favourable.
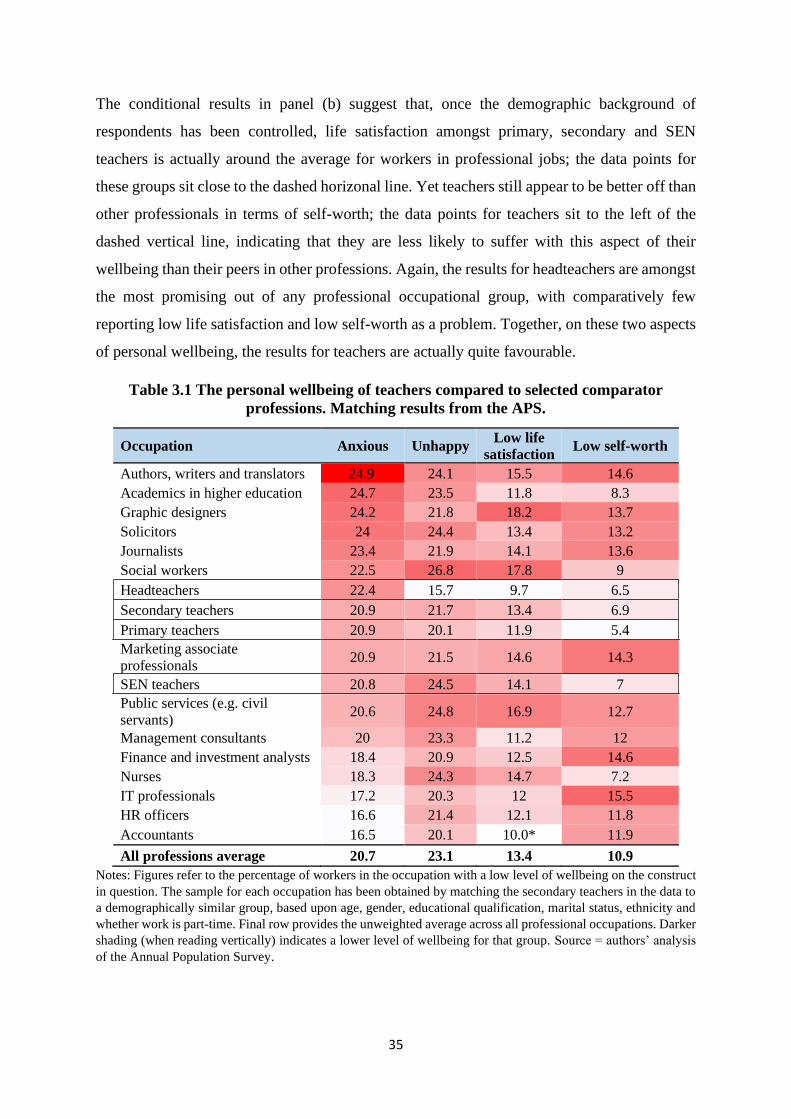
Table 3.1 The personal wellbeing of teachers compared to selected comparator
professions. Matching results from the APS.
Occupation Anxious Unhappy Low life
satisfaction Low self-worth
Authors, writers and translators 24.9 24.1 15.5 14.6
Academics in higher education 24.7 23.5 11.8 8.3
Graphic designers 24.2 21.8 18.2 13.7
Solicitors 24 24.4 13.4 13.2
Journalists 23.4 21.9 14.1 13.6
Social workers 22.5 26.8 17.8 9
Headteachers 22.4 15.7 9.7 6.5
Secondary teachers 20.9 21.7 13.4 6.9
Primary teachers 20.9 20.1 11.9 5.4
Marketing associate
professionals 20.9 21.5 14.6 14.3
SEN teachers 20.8 24.5 14.1 7
Public services (e.g. civil
servants) 20.6 24.8 16.9 12.7
Management consultants 20 23.3 11.2 12
Finance and investment analysts 18.4 20.9 12.5 14.6
Nurses 18.3 24.3 14.7 7.2
IT professionals 17.2 20.3 12 15.5
HR officers 16.6 21.4 12.1 11.8
Accountants 16.5 20.1 10.0* 11.9
All professions average 20.7 23.1 13.4 10.9
Notes: Figures refer to the percentage of workers in the occupation with a low level of wellbeing on the construct
in question. The sample for each occupation has been obtained by matching the secondary teachers in the data to
a demographically similar group, based upon age, gender, educational qualification, marital status, ethnicity and
whether work is part-time. Final row provides the unweighted average across all professional occupations. Darker
shading (when reading vertically) indicates a lower level of wellbeing for that group. Source = authors’ analysis
of the Annual Population Survey.
36
To conclude our APS analysis, Table 3.1 compares the matching results for teachers to a
handful of purposefully select comparators. This highlights how occupations with a lower
proportion of anxious staff than teachers include nurses, accountants and human resource
officers, while academics and authors/writers tend to have amongst the most anxious staff. For
the proportion of workers who are unhappy and have low levels of life satisfaction, primary
and secondary teachers do not particularly stand out from most of our chosen comparators.
This reiterates a selection of findings from Figure 3.1 and Figure 3.2, where the happiness and
life satisfaction of teachers was found to be around the occupational average. On the other
hand, relative to our selected occupational comparators, teachers are much less likely to suffer
from feelings of low self-worth, and are similar to employees in other public sector jobs in this
respect. For instance, only around 5% of primary and 7% of secondary teachers report a low
level of self-worth, which is similar to the percentage of nurses (7%), social workers (9%) and
academics (8%). The analogous figures are higher for other, mainly private sector, occupations
such as for accountants (12%), solicitors (13%), journalists (14%) and marketing professionals
(14%).
3.4 LFS results. Comparisons of mental ill health across occupations
Figure 3.3 turns to our analysis of the LFS, comparing the percentage of workers who report
having any long-lasting health – including mental health – problem (vertical axis) to those who
report having a long-lasting mental health problem. Focusing upon the matching results (panel
b), primary, secondary and headteachers all fall around the average across professional
occupations – as indicated by these data points sitting around the intersection of the dashed
horizontal and vertical lines. In other words, long-lasting health problems (including mental
health problems) are no more prevalent amongst teachers than demographically comparable
individuals pursuing other professional careers. The one potential exception is SEN teachers,
where a slightly greater proportion report having a lasting health problem (28% versus 33%)
and a lasting mental health problem (5% versus 3.6%) than the cross-profession average. These
findings are confirmed by Table 3.2, where the results for teachers are compared to our selected
occupational comparators. Academics, social workers, civil servants and authors/writers are
amongst those who are somewhat more likely to report suffering a long-lasting health problem
(and particularly a mental health problem) than teachers. On the other hand, some office-based
professional groups (e.g. accountants, management consultants, investment analysts) to some

37
degree report fewer long-lasting health problems (including mental health problems) than those
pursuing careers in education.

38
Figure 3.3 The percentage of teachers with a long-lasting illness and those with a long-lasting mental illness compared to other occupations (LFS)
(a) Unconditional (all occupations) (b) Matched to other professions
Notes: Each data point represents one occupation. Figures refer to the percentage of workers who have a long-lasting health problem (vertical axis) and a long-lasting mental health problem
(horizontal axis). Dashed lines illustrate the unweighted occupational average. The graph on the left presents the unconditional estimates for all occupations. The graph on the right presents the
matching results, where comparators have been restricted to those working in professional jobs. Results restricted to occupations where the sample size is above 250. Source = authors’ analysis
of the Labour Force Survey.

39
Table 3.2 The mental health of teachers compared to selected comparator professions. Matching
results from the LFS.
Occupation % lasting
health problem
% lasting
mental
health
problem
% job
led to
ill
health
% job led
to mental
ill health
SEN teachers 27.9 5 8.9 4.9
Nurses 27.8 3.6 7.8 3.3
Public services (e.g. civil servants) 27.7 4.5 7.6 5.3
Authors, writers and translators 27 6.1 2.4 1.3
IT professionals 25.5 3.1 1.8 0.6
Academics in higher education 25.3 4.6 4.2 2.1
Social workers 24.2 4.6 9.4 5.9
Graphic designers 24.1 3.5 3.7 1.1
Marketing associate professionals 24 3.6 2.7 1.2
Headteachers 23.4 3 2.3 1.7
Secondary teachers 23.2 3.4 5.5 3.2
HR officers 23.2 3.8 3.1 1.7
Primary teachers 22.4 3.6 4.7 3
Journalists 22.4 4 3.3 1.4
Accountants 20.7 2.1 2 1.1
Solicitors 20.7 3.7 3.3 1.5
Management consultants 20.6 2.1 3.6 2.4
Finance and investment analysts 18.3 1.8 2.9 1.2
All professions average 23.4 3.6 4.0 1.9
Notes: Figures refer to the percentage of workers in the occupation with a health problem. The sample for each
occupation has been obtained by matching the secondary teachers in the data to a demographically similar group,
based upon age, gender, educational qualification, marital status and whether there are children in the household.
Final row provides the unweighted average across all professional occupations. Darker shading (read vertically)
indicates a lower level of wellbeing for that group. Figures refer to percentages amongst all individuals (not just
those with a health problem). Source = authors’ analysis of the Labour Force Survey.
Figure 3.4 continues our analysis of the LFS, but now focusing upon respondents’ views as to
whether their job has contributed to them developing a (or worsening an existing) health
problem (vertical axis) or mental health problem (horizontal axis) over the last year. Primary
and secondary teachers are above the occupational average on both these measures, though in
terms of magnitude the difference is relatively small. For instance, in the matching results,
panel (b), approximately 3% of teachers said that their job has led to them developing or
worsening a mental health issue over the last year, compared to an average across professional
occupations of 2%. Again, the problem appears worse for SEN teachers, where around 9%
reported their job has led to them developing a health problem (compared to a cross-profession
average of 4%), with 5% saying it has led to an issue with their mental health (versus a cross-
profession average of 2%).

40
Figure 3.4 The percentage of teachers who reported their job led to ill health and mental ill health compared to other occupations (LFS).
(a) Unconditional (all occupations) (b) Matched to other professions
Notes: Each data point represents one occupation. Figures refer to the percentage of workers who said that their job has led to a lasting problem with ill health (vertical axis) and a lasting problem
with their mental health (horizontal axis). Dashed lines illustrate the unweighted occupational average. The graph on the left presents the unconditional estimates for all occupations. The graph
on the right presents the matching results, where comparators have been restricted to those working in professional jobs. Results restricted to occupations where the sample size is above 250.
Source = authors’ analysis of the Labour Force Survey.
41
Table 3.2 again illustrates how these figures for teachers compare to those for our selected
comparators. Civil servants and (particularly) social workers stand out as reporting greater
levels of work-induced ill health than primary, secondary and headteachers. On the other hand,
many office-based workers are less likely to say that their job has led to health problems and,
particularly, mental health problems. This includes accountants, marketing associates and IT
professionals, where only around 1% of workers say that their job has caused or exacerbated a
mental health issue over the last year.
3.5 Biobank results. Comparisons of mental health across occupations
Figure 3.5 presents results from our final detailed comparison across occupations, based upon
data from the UK Biobank. Note that as the Biobank data are based upon a convenience sample,
and are therefore not representative, we only present results from the matching analysis. The
left-hand panel of Figure 5 provides the proportion of teachers in the top quartile of the Biobank
depression scale (vertical axis) and the percentage who have been prescribed antidepressants.
Consistent with the main thrust of the findings from the APS and LFS, the results for teachers
do not particularly stand out from those for workers in other professional occupations. For both
the depression scale and prescriptions of antidepressants, the data points for secondary, head,
primary and SEN teachers sit reasonably close to the professional occupation average (the
dashed vertical and horizontal lines). Although antidepressant prescriptions are slightly higher
for primary teachers (4.7%) and SEN teachers (4.6%) than for the professional average (3.3%),
as Figure 5 illustrates, the difference in terms of magnitude is actually quite small. This is
further supported by Table 3.3, where the results for teachers are presented alongside selected
occupational comparators. Interestingly, none of the occupations considered particularly stands
out, with perhaps the exception that antidepressant use seems somewhat higher amongst nurses
and graphic designers than other groups. Nevertheless, Figure 3.5 panel (a) and Table 3.3
generally suggest that variation in depressive symptoms across workers in different
professional occupations is reasonably small, with little evidence of a particularly pronounced
problem within the teaching profession.

42
Figure 3.5 The percentage of teachers who are unhappy or have depression compared to other occupations. Matched analysis using Biobank.
(a) High depression scale vs antidepressant use (b) % unhappy vs % unhappy with work
Notes: Each data point represents one SOC occupation. Dashed lines illustrate the unweighted occupational average. Both graphs present the matching estimates, where comparators have been
restricted to those working in professional jobs. The left-hand graph compares the percentage of workers in each occupation who have been prescribed antidepressants (horizontal axis) to the
percentage of workers in the top quartile of the Biobank depression scale (vertical axis). The graph on the right presents analogous results for the percentage of workers in each occupation who
say they are unhappy (vertical axis) and unhappy with work (horizontal axis). Results restricted to occupations where the sample size is above 250. Source = authors’ analysis of the UK Biobank.
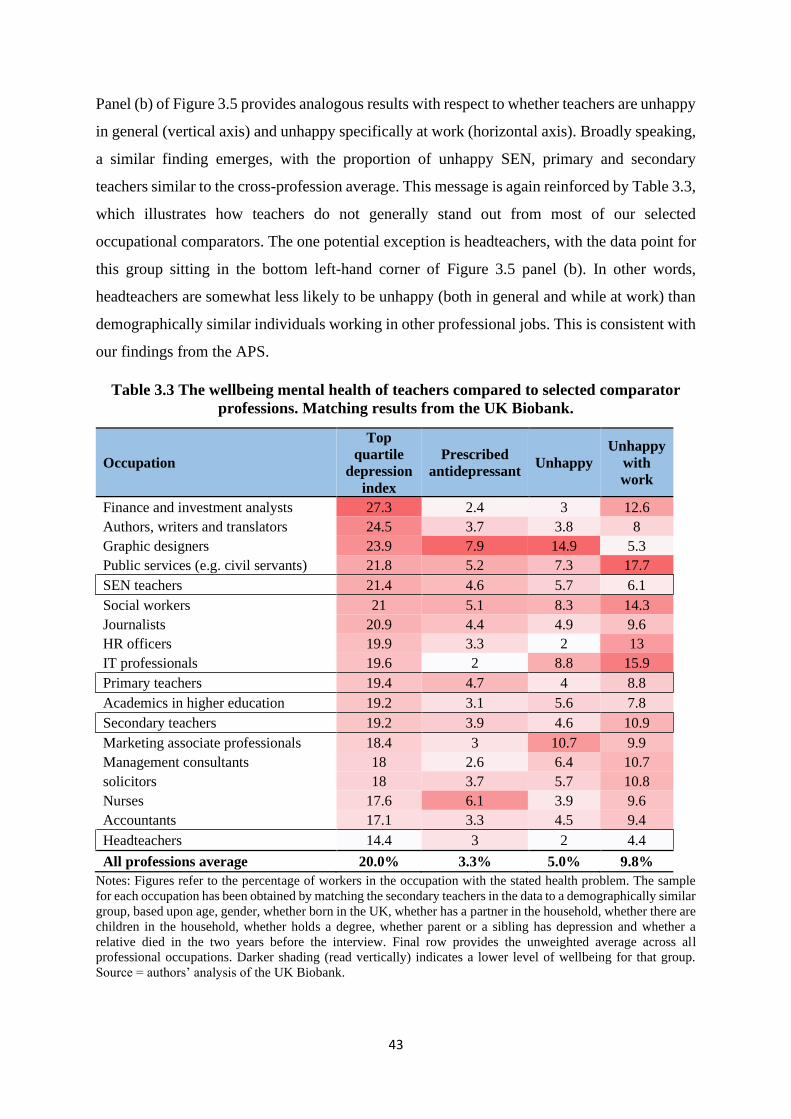
43
Panel (b) of Figure 3.5 provides analogous results with respect to whether teachers are unhappy
in general (vertical axis) and unhappy specifically at work (horizontal axis). Broadly speaking,
a similar finding emerges, with the proportion of unhappy SEN, primary and secondary
teachers similar to the cross-profession average. This message is again reinforced by Table 3.3,
which illustrates how teachers do not generally stand out from most of our selected
occupational comparators. The one potential exception is headteachers, with the data point for
this group sitting in the bottom left-hand corner of Figure 3.5 panel (b). In other words,
headteachers are somewhat less likely to be unhappy (both in general and while at work) than
demographically similar individuals working in other professional jobs. This is consistent with
our findings from the APS.
Table 3.3 The wellbeing mental health of teachers compared to selected comparator
professions. Matching results from the UK Biobank.
Occupation
Top
quartile
depression
index
Prescribed
antidepressant Unhappy
Unhappy
with
work
Finance and investment analysts 27.3 2.4 3 12.6
Authors, writers and translators 24.5 3.7 3.8 8
Graphic designers 23.9 7.9 14.9 5.3
Public services (e.g. civil servants) 21.8 5.2 7.3 17.7
SEN teachers 21.4 4.6 5.7 6.1
Social workers 21 5.1 8.3 14.3
Journalists 20.9 4.4 4.9 9.6
HR officers 19.9 3.3 2 13
IT professionals 19.6 2 8.8 15.9
Primary teachers 19.4 4.7 4 8.8
Academics in higher education 19.2 3.1 5.6 7.8
Secondary teachers 19.2 3.9 4.6 10.9
Marketing associate professionals 18.4 3 10.7 9.9
Management consultants 18 2.6 6.4 10.7
solicitors 18 3.7 5.7 10.8
Nurses 17.6 6.1 3.9 9.6
Accountants 17.1 3.3 4.5 9.4
Headteachers 14.4 3 2 4.4
All professions average 20.0% 3.3% 5.0% 9.8%
Notes: Figures refer to the percentage of workers in the occupation with the stated health problem. The sample
for each occupation has been obtained by matching the secondary teachers in the data to a demographically similar
group, based upon age, gender, whether born in the UK, whether has a partner in the household, whether there are
children in the household, whether holds a degree, whether parent or a sibling has depression and whether a
relative died in the two years before the interview. Final row provides the unweighted average across all
professional occupations. Darker shading (read vertically) indicates a lower level of wellbeing for that group.
Source = authors’ analysis of the UK Biobank.
44
3.7 Summary
Our headline conclusion is that teachers seem to have very similar mental health and wellbeing
outcomes to other workers in other professional jobs. Against conventional wisdom, and in
contrast to much of the existing literature, we find little robust evidence to suggest that teachers
are particularly anxious, depressed, have lower levels of life satisfaction or have poorer
wellbeing outcomes than demographically similar individuals in other forms of professional
employment. Although there are some exceptions amongst certain subgroups (e.g. SEN
teachers tend to have somewhat lower levels of mental wellbeing while the wellbeing of
headteachers, on certain measures, is somewhat higher) and for certain outcomes (e.g.
comparatively few teachers suffer from feelings of low self-worth), differences between
teachers and other professionals are, on the whole, relatively small.
What then are the key directions for future work in this area? In our view, the evidence
presented here makes it very hard to sustain the position that wellbeing and mental health
outcomes of teachers are worse than for other occupational groups. For researchers in this area,
the focus should now shift to better understanding the drivers of poor mental health outcomes
amongst teachers, including whether these are indeed mainly work-related, or are actually
mainly due to issues outside of their job (e.g. their personal life). Relatedly, we need better
evidence on what school leaders can do to support their staff. There are, after all, a non-trivial
number of school staff facing mental health issues, some of which may be caused or aggravated
by their work. Understanding what can be done to help these individuals through this difficult
period is key to teaching becoming a happier and healthier profession.

45
Chapter 4 Evidence of teacher health using
biomarker data
4.1 Introduction
The previous chapter compared teachers to other occupational groups in terms of their mental
health. Overall, little evidence was found that the mental health and wellbeing of teachers in
England stood out as particularly poor, relative to those employed in other professional jobs.
Yet, as the literature discussed in Chapter 1 illustrated, there is some empirical evidence that
teachers experience more general physical health problems than non-teachers. An important
limitation of the existing literature on this topic, however, is that it is very dependent upon self-
report measures, either of perceived/subjective health or self-reports of diagnosed conditions.
By contrast, few empirical studies have investigated the health of teachers using objective
biomarker data (e.g. measurements such as blood pressure and cortisol), despite a related
literature suggesting that workplace stressors would predict higher concentrations of stress
biomarkers among teachers (Bellingrath, Weigl & Kudielka, 2009; Masilamani et al., 2012; Qi
et al., 2014; Wolfram et al., 2013). Indeed, to our knowledge, no previous research has used
objective biomarker data to compare health across different occupational groups.
This chapter fills this gap in the literature to provide new empirical evidence as to whether
teaching is associated with poor health outcomes. In particular, it investigates whether teachers
have lower levels and faster deterioration in health relative to otherwise similar individuals in
other occupations. Uniquely, rather than using self-reported measures to subjective questions
captured within questionnaires (as per the two preceding chapters), we investigate occupational
differences in health in terms of objective biomarker data.
4.2 Data and methodology
Throughout this chapter, we refer to the notion of ‘allostatic load’. This has been defined as
‘the wear and tear on the body and brain resulting from chronic overactivity or inactivity of
physiological systems that are normally involved in adaptation to environmental challenge’
(McEwen, 1998). This was first measured via an Allostatic Load Index (ALI) based upon ten
biomarkers (Seeman et al., 2001). It has since been shown how higher ALI scores have been
associated with increased risk of mortality in ageing studies in Taiwan, Sweden, the UK and a
separate general population survey in the USA (Beckie, 2012). Empirically, Allostatic Load
has been measured by a set of indicators such as the Body Mass Index (BMI), heart rate and
46
blood pressure. It is hence meant to capture an objective, overall summary of whether an
individual is in poor physical health.
We measure allostatic load – and compare it across occupations – using two datasets. Both
datasets use a broad definition of teachers, including both primary and secondary staff and
headteachers. The first is a sample of 21–60-year-old individuals (including 270 primary,
secondary or head teachers) from the Understanding Society dataset. The second is a sample
of 230,455 volunteers aged between 40 and 60 (including 14,651 primary, secondary or head
teachers) from the UK Biobank (UKB). This includes a subset of 79,616 individuals (11,542
primary, secondary or headteachers) for whom occupational histories have been gathered and
5,887 individuals (280 primary, secondary or headteachers) where there has been a longitudinal
follow-up. Details on the biomarkers used in this chapter can be found in Appendix C. For each
biomarker, an individual was given a score of 1 if they were located in the highest-risk quartile
and these scores where then summed to give an overall health score, following the established
convention in this literature (Beckie, 2012; Mauss et al., 2015). See Sims et al. (2020a) for
further details, including evidence of the convergent validity of this global health measure.
These allostatic load indices then serve as our outcome measures of interest. Regression
analysis is then used to compare global health outcomes (as measured by the allostatic load
indices) between demographically similar teachers, non-teachers and those individuals
working in a specific set of comparator occupations of interest (accountants/consultants, health
professionals, planners/surveyors, protective officers, research professionals and welfare
professionals). All estimates are presented as ‘incidence rate ratios’, where values equal to 1
indicate that there is no difference in global health outcomes between teachers and other
occupational groups.
4.3 Results
Table 4.1 presents the results from our regression models. In the Understanding Society dataset,
Table 4.1 suggests that working as a teacher is associated with a small decrease in the ALI (i.e.
that teachers are in slightly better health than demographically and educationally similar
individuals from across the population). Specifically, the incidence rate ratio of 0.94 indicates
that teaching is associated with a 6% reduction in the rate of allostatic load – though this is
small in terms of magnitude. The analogous regression using the Biobank dataset suggests that
the difference between teachers and other working age adults is effectively zero (incidence rate
ratio = 1.004). Taken together, these findings suggest that the global health of teachers does

47
not stand out as atypically better or worse than demographically similar individuals across the
rest of the population.
Table 4.1 Regressing teaching on allostatic load
Understanding
Society Biobank
Respondent a teacher 0.94 1.00
N 7,173 229,503
Notes: All columns are negative binomial regressions and coefficients are incidence rate ratios (IRR). Reference
group = non-teacher. Model controls for demographics and educational qualifications. Values close to one
indicates no difference between teachers and non-teachers. * indicates statistical significance at the 5% level.
Source = authors’ analysis of the Understanding Society and UK Biobank datasets.
If teaching damages health through cumulative exposure to stress, one might expect longer
periods of teaching to be associated with worse health. We have investigated this possibility in
additional analysis where the allostatic load index has been regressed upon the number of years
spent teaching using a subsample of Biobank dataset (see Sims et al., 2020a). This reproduced
the results presented in Table 4.1; there was effectively no association. One explanation for
this apparent lack of association between teaching and health is that more or less healthy people
may select into the teaching profession (Sims et al., 2020a). Again, consistent with the results
presented in Table 4.1, very little association between teaching and allostatic load was found
(incidence rate ratio = 0.954).
Table 4.2 takes this analysis a step further, comparing teachers to a set of specific occupational
groups. Teaching serves as the reference category and the six comparator occupational groups
can be seen down the left-hand side of the table (a detailed breakdown of each can be found in
the notes to the table). Four of the six groups – accountants/consultants, planners/surveyors,
protective officers and research professionals – show coefficients very close to 1 (0.98-1.03)
and are not statistically significantly different to teachers. The other two groups show a
statistically significant difference with teachers However, these go in opposite directions:
health professionals are slightly healthier than teachers and welfare professionals are slightly
less healthy. Overall, there is little clear evidence of sizeable health differences between
teachers and these comparators.

48
Table 4.2 Occupational differences in allostatic load (UK Biobank)
Incidence rate ratio
Occupation: (ref=teacher)
Accountants/Consultants 0.98
Health Professionals 0.92*
Planners/Surveyors 1.00
Protective Officers 1.03
Research Professionals 0.99
Welfare Professionals 1.08*
N 9,356
Notes: All columns are negative binomial regressions and coefficients are incidence rate ratios (IRR). Reference
group = teacher. Model controls for demographics and educational qualifications. Values close to 1 indicates no
difference between teachers and non-teachers. Values less than (more than) 1 indicates that the occupational group
is healthier (less healthy) than teachers. * indicates statistical significance at the 5% level. Source = authors’
analysis of UK Biobank dataset.
4.4 Summary and implications
Contrary to conventional wisdom within the education profession, this chapter has found there
to be no evidence of an association between teaching and overall health. This overall finding
holds across two datasets, amongst a representative sample of teachers and among a group of
older teachers and survived a series of robustness tests.
How might we explain this finding? We believe the most appropriate interpretation is that
certain aspects of teaching as a job may compensate for the aspects of the job that are
particularly stressful. In particular, teaching is known to be less sedentary than many other
office-based, graduate occupations (Tudor-Locke et al., 2011). Epidemiological research
generally finds a relationship between prolonged sedentary behaviour and long-run health
outcomes (Owen et al., 2020) and experimental evidence suggests that the underlying
relationship is causal in nature (Benatti & Ried-Larsen, 2015). The reduced incidence of
smoking amongst teachers, which is in part a result of official guidance that all schools in
England should be smoke free, is also likely to be an important part of any countervailing effect
of teaching on health. Conversely, some of the specific health risk associated with the
profession, such as increased incidence of infectious diseases (Kovess-Masféty et al., 2007) are
acute in nature and therefore do not contribute to cumulative wear and tear on the body. These

49
are, we believe, likely to be some of the key reasons why we find no evidence for the claim
that teaching is bad for your health.
50
Chapter 5 Has the mental health and wellbeing of
teachers in England improved or declined over time?
5.1 Introduction
The previous two chapters have illustrated how, overall, there is little evidence that the mental
health and wellbeing of teachers does not appear to be worse than for comparable individuals
working in other professional jobs. Yet, like much of the literature reviewed in Chapter 1, all
analyses presented thus far have focused upon the responses of teachers at a single point in
time. To our knowledge, no evidence currently exists as to whether the personal wellbeing and
mental health of teachers in England has improved or declined compared to 20 years ago (and
how this compares to other professional groups). In other words, in terms of wellbeing, are
things now worse for teachers than they have ever been before? Or, despite recent education
spending cuts, staffing pressures and increasing scrutiny due to accountability, has the mental
health and wellbeing of teachers in England remained largely unchanged? Although anecdotal
evidence suggests that the wellbeing of teachers in England may be worse now than previously
(House of Commons, 2018)3, there is currently no large-scale, nationally representative
quantitative evidence that exists on this important issue. This chapter will fill this gap in the
literature.
5.2 Data and methods
This chapter draws upon information from three data sources. The first is the Labour Force
Survey (LFS). Using these data, we focus upon how the percentage of teachers reporting long-
lasting health problems has changed since 1992. Our particular interest is in the change in the
percentage of those reporting suffering from a mental health problem (depression, nerves,
anxiety, mental illness or nervous disorders) over time. Moreover, since 2004 LFS respondents
have been asked whether a health problem has been caused or made worse by their job over
the past year – and the type of health problem that this was. We are particularly interested in
those who selected ‘stress, depression or anxiety’, how this has changed over time, and how
the trend for teachers compares to other occupational groups. Teachers are broadly defined,
combining data from primary, secondary and head teachers.
3 For instance, at a recent House of Commons committee meeting, a headteacher giving evidence stated: ‘In terms
of staff wellbeing at the moment, I have probably got the greatest concern that I have ever had. In terms of people’s
health, I have never known it as bad as it is at the moment’ (House of Commons, 2018).
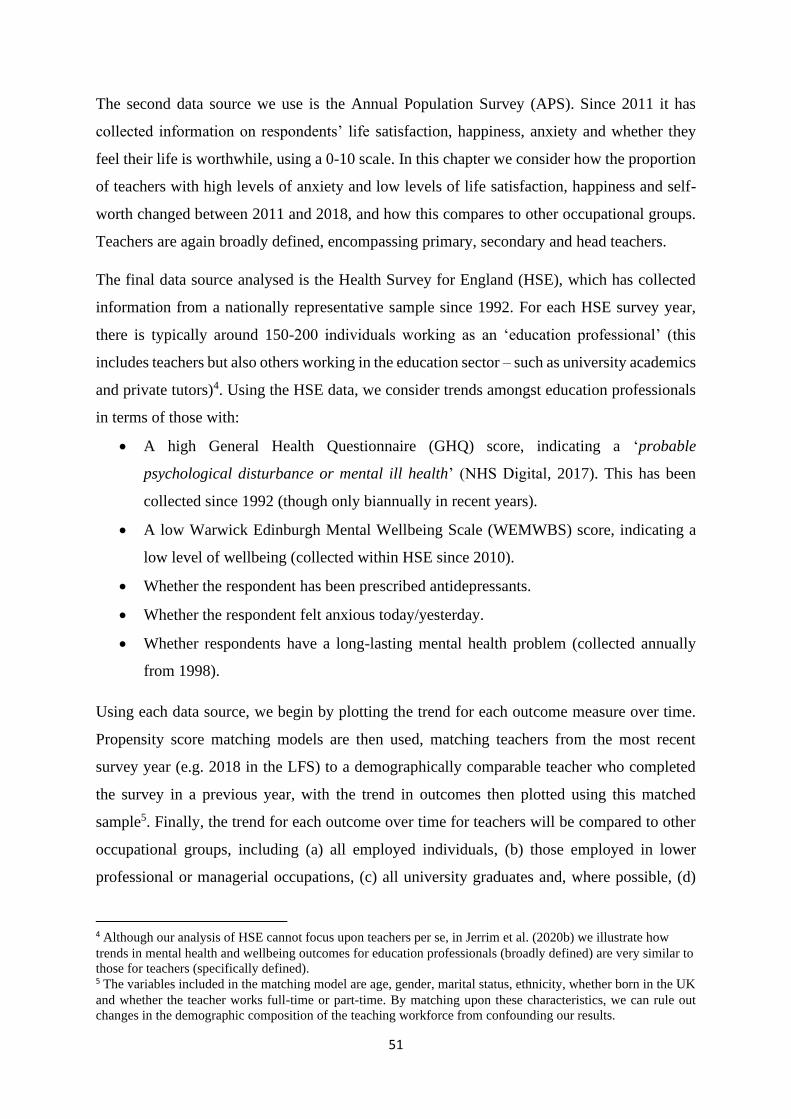
51
The second data source we use is the Annual Population Survey (APS). Since 2011 it has
collected information on respondents’ life satisfaction, happiness, anxiety and whether they
feel their life is worthwhile, using a 0-10 scale. In this chapter we consider how the proportion
of teachers with high levels of anxiety and low levels of life satisfaction, happiness and self-
worth changed between 2011 and 2018, and how this compares to other occupational groups.
Teachers are again broadly defined, encompassing primary, secondary and head teachers.
The final data source analysed is the Health Survey for England (HSE), which has collected
information from a nationally representative sample since 1992. For each HSE survey year,
there is typically around 150-200 individuals working as an ‘education professional’ (this
includes teachers but also others working in the education sector – such as university academics
and private tutors)4. Using the HSE data, we consider trends amongst education professionals
in terms of those with:
• A high General Health Questionnaire (GHQ) score, indicating a ‘probable
psychological disturbance or mental ill health’ (NHS Digital, 2017). This has been
collected since 1992 (though only biannually in recent years).
• A low Warwick Edinburgh Mental Wellbeing Scale (WEMWBS) score, indicating a
low level of wellbeing (collected within HSE since 2010).
• Whether the respondent has been prescribed antidepressants.
• Whether the respondent felt anxious today/yesterday.
• Whether respondents have a long-lasting mental health problem (collected annually
from 1998).
Using each data source, we begin by plotting the trend for each outcome measure over time.
Propensity score matching models are then used, matching teachers from the most recent
survey year (e.g. 2018 in the LFS) to a demographically comparable teacher who completed
the survey in a previous year, with the trend in outcomes then plotted using this matched
sample5. Finally, the trend for each outcome over time for teachers will be compared to other
occupational groups, including (a) all employed individuals, (b) those employed in lower
professional or managerial occupations, (c) all university graduates and, where possible, (d)
4 Although our analysis of HSE cannot focus upon teachers per se, in Jerrim et al. (2020b) we illustrate how
trends in mental health and wellbeing outcomes for education professionals (broadly defined) are very similar to
those for teachers (specifically defined). 5 The variables included in the matching model are age, gender, marital status, ethnicity, whether born in the UK
and whether the teacher works full-time or part-time. By matching upon these characteristics, we can rule out
changes in the demographic composition of the teaching workforce from confounding our results.
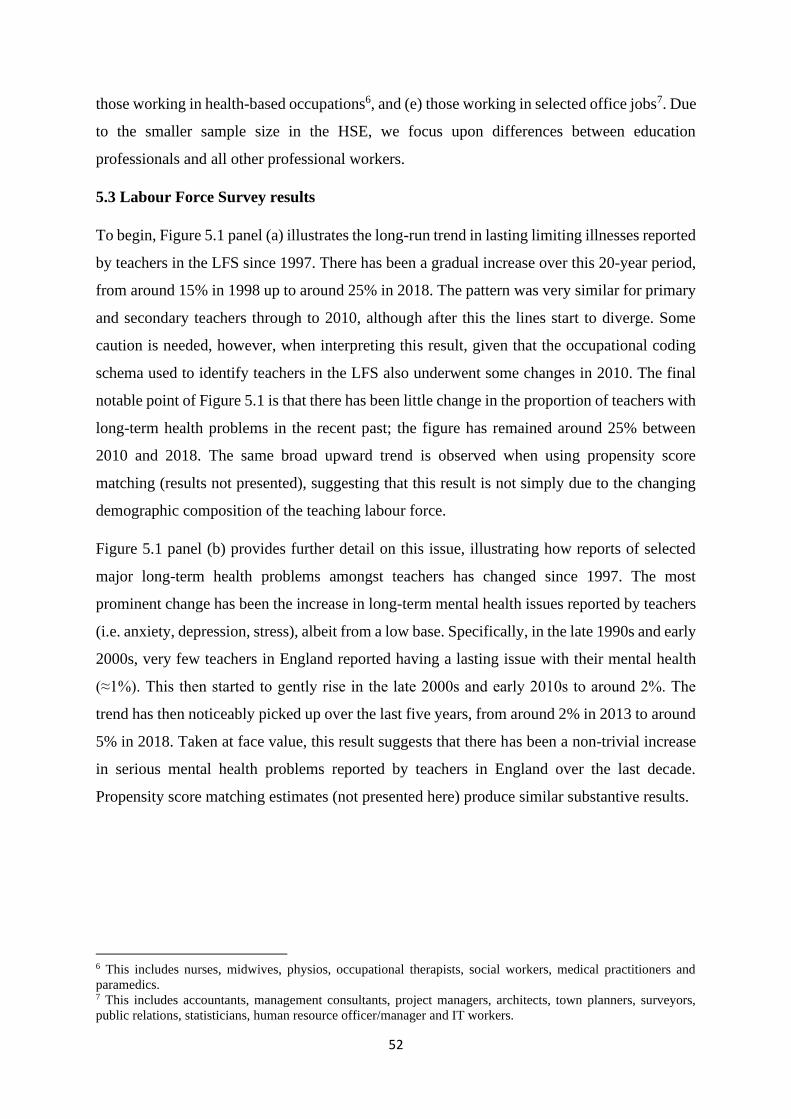
52
those working in health-based occupations6, and (e) those working in selected office jobs7. Due
to the smaller sample size in the HSE, we focus upon differences between education
professionals and all other professional workers.
5.3 Labour Force Survey results
To begin, Figure 5.1 panel (a) illustrates the long-run trend in lasting limiting illnesses reported
by teachers in the LFS since 1997. There has been a gradual increase over this 20-year period,
from around 15% in 1998 up to around 25% in 2018. The pattern was very similar for primary
and secondary teachers through to 2010, although after this the lines start to diverge. Some
caution is needed, however, when interpreting this result, given that the occupational coding
schema used to identify teachers in the LFS also underwent some changes in 2010. The final
notable point of Figure 5.1 is that there has been little change in the proportion of teachers with
long-term health problems in the recent past; the figure has remained around 25% between
2010 and 2018. The same broad upward trend is observed when using propensity score
matching (results not presented), suggesting that this result is not simply due to the changing
demographic composition of the teaching labour force.
Figure 5.1 panel (b) provides further detail on this issue, illustrating how reports of selected
major long-term health problems amongst teachers has changed since 1997. The most
prominent change has been the increase in long-term mental health issues reported by teachers
(i.e. anxiety, depression, stress), albeit from a low base. Specifically, in the late 1990s and early
2000s, very few teachers in England reported having a lasting issue with their mental health
(≈1%). This then started to gently rise in the late 2000s and early 2010s to around 2%. The
trend has then noticeably picked up over the last five years, from around 2% in 2013 to around
5% in 2018. Taken at face value, this result suggests that there has been a non-trivial increase
in serious mental health problems reported by teachers in England over the last decade.
Propensity score matching estimates (not presented here) produce similar substantive results.
6 This includes nurses, midwives, physios, occupational therapists, social workers, medical practitioners and
paramedics. 7 This includes accountants, management consultants, project managers, architects, town planners, surveyors,
public relations, statisticians, human resource officer/manager and IT workers.
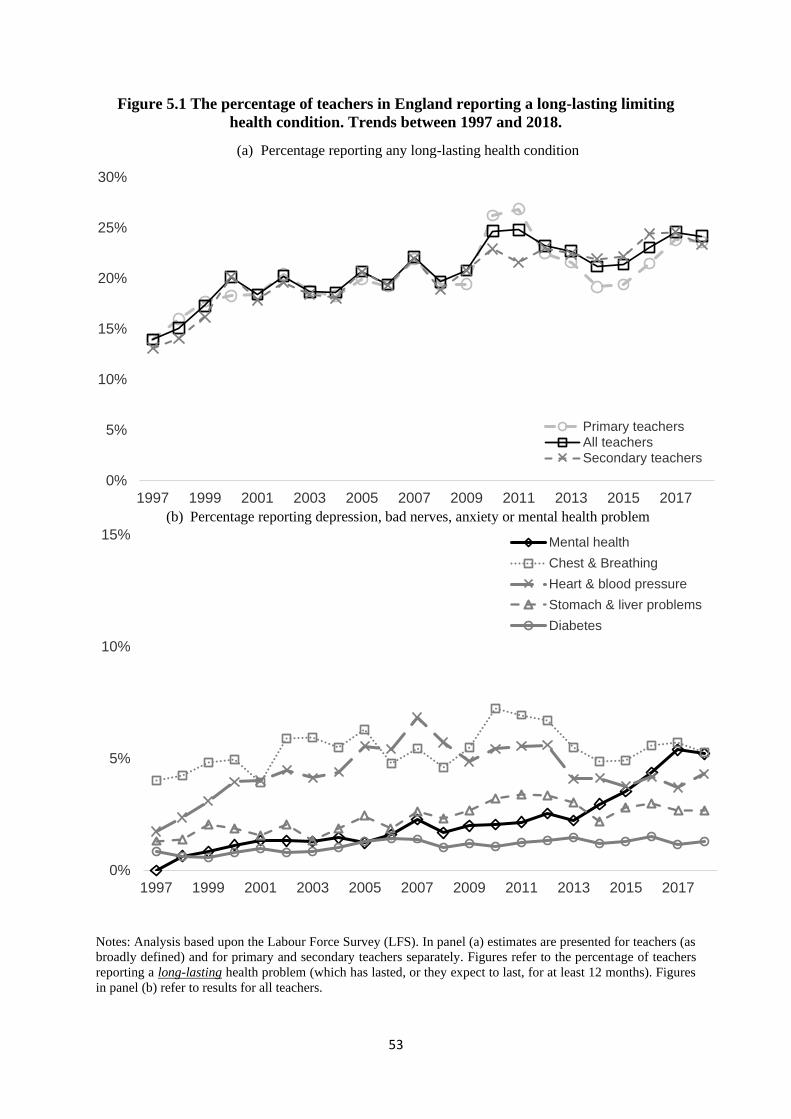
53
Figure 5.1 The percentage of teachers in England reporting a long-lasting limiting
health condition. Trends between 1997 and 2018.
(a) Percentage reporting any long-lasting health condition
(b) Percentage reporting depression, bad nerves, anxiety or mental health problem
Notes: Analysis based upon the Labour Force Survey (LFS). In panel (a) estimates are presented for teachers (as
broadly defined) and for primary and secondary teachers separately. Figures refer to the percentage of teachers
reporting a long-lasting health problem (which has lasted, or they expect to last, for at least 12 months). Figures
in panel (b) refer to results for all teachers.
0%
5%
10%
15%
20%
25%
30%
1997 1999 2001 2003 2005 2007 2009 2011 2013 2015 2017
Primary teachers
All teachersSecondary teachers
0%
5%
10%
15%
1997 1999 2001 2003 2005 2007 2009 2011 2013 2015 2017
Mental health
Chest & Breathing
Heart & blood pressure
Stomach & liver problems
Diabetes
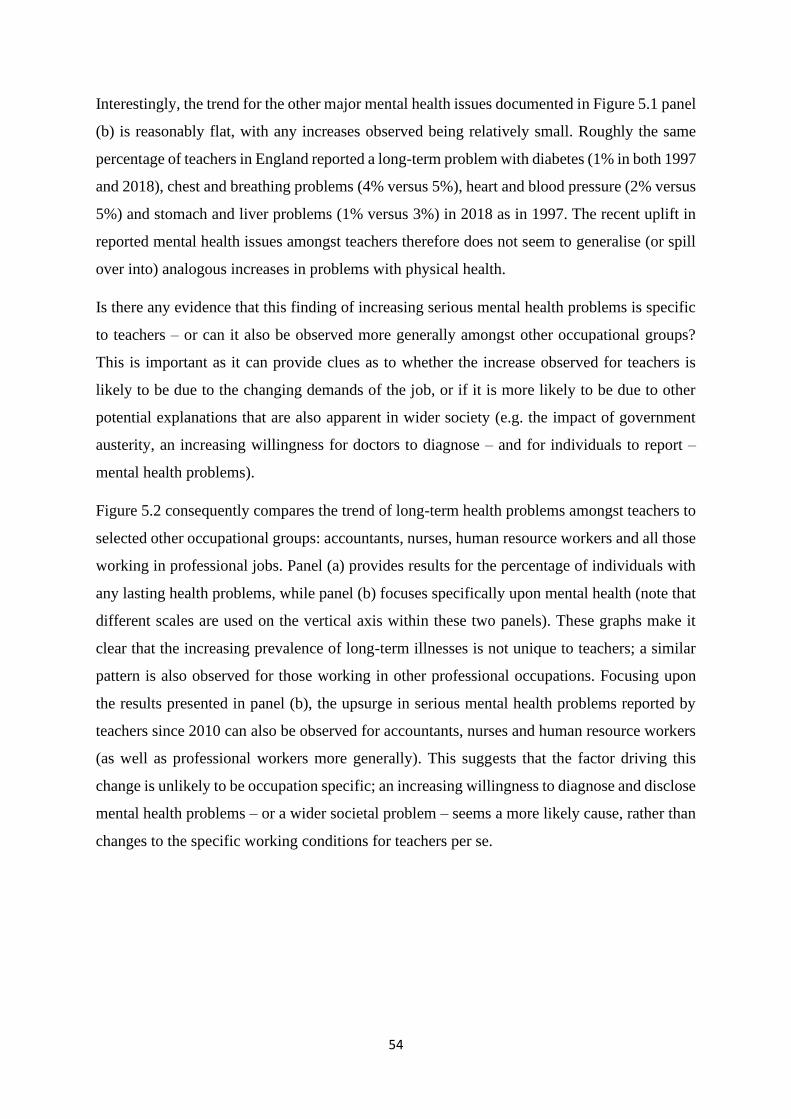
54
Interestingly, the trend for the other major mental health issues documented in Figure 5.1 panel
(b) is reasonably flat, with any increases observed being relatively small. Roughly the same
percentage of teachers in England reported a long-term problem with diabetes (1% in both 1997
and 2018), chest and breathing problems (4% versus 5%), heart and blood pressure (2% versus
5%) and stomach and liver problems (1% versus 3%) in 2018 as in 1997. The recent uplift in
reported mental health issues amongst teachers therefore does not seem to generalise (or spill
over into) analogous increases in problems with physical health.
Is there any evidence that this finding of increasing serious mental health problems is specific
to teachers – or can it also be observed more generally amongst other occupational groups?
This is important as it can provide clues as to whether the increase observed for teachers is
likely to be due to the changing demands of the job, or if it is more likely to be due to other
potential explanations that are also apparent in wider society (e.g. the impact of government
austerity, an increasing willingness for doctors to diagnose – and for individuals to report –
mental health problems).
Figure 5.2 consequently compares the trend of long-term health problems amongst teachers to
selected other occupational groups: accountants, nurses, human resource workers and all those
working in professional jobs. Panel (a) provides results for the percentage of individuals with
any lasting health problems, while panel (b) focuses specifically upon mental health (note that
different scales are used on the vertical axis within these two panels). These graphs make it
clear that the increasing prevalence of long-term illnesses is not unique to teachers; a similar
pattern is also observed for those working in other professional occupations. Focusing upon
the results presented in panel (b), the upsurge in serious mental health problems reported by
teachers since 2010 can also be observed for accountants, nurses and human resource workers
(as well as professional workers more generally). This suggests that the factor driving this
change is unlikely to be occupation specific; an increasing willingness to diagnose and disclose
mental health problems – or a wider societal problem – seems a more likely cause, rather than
changes to the specific working conditions for teachers per se.
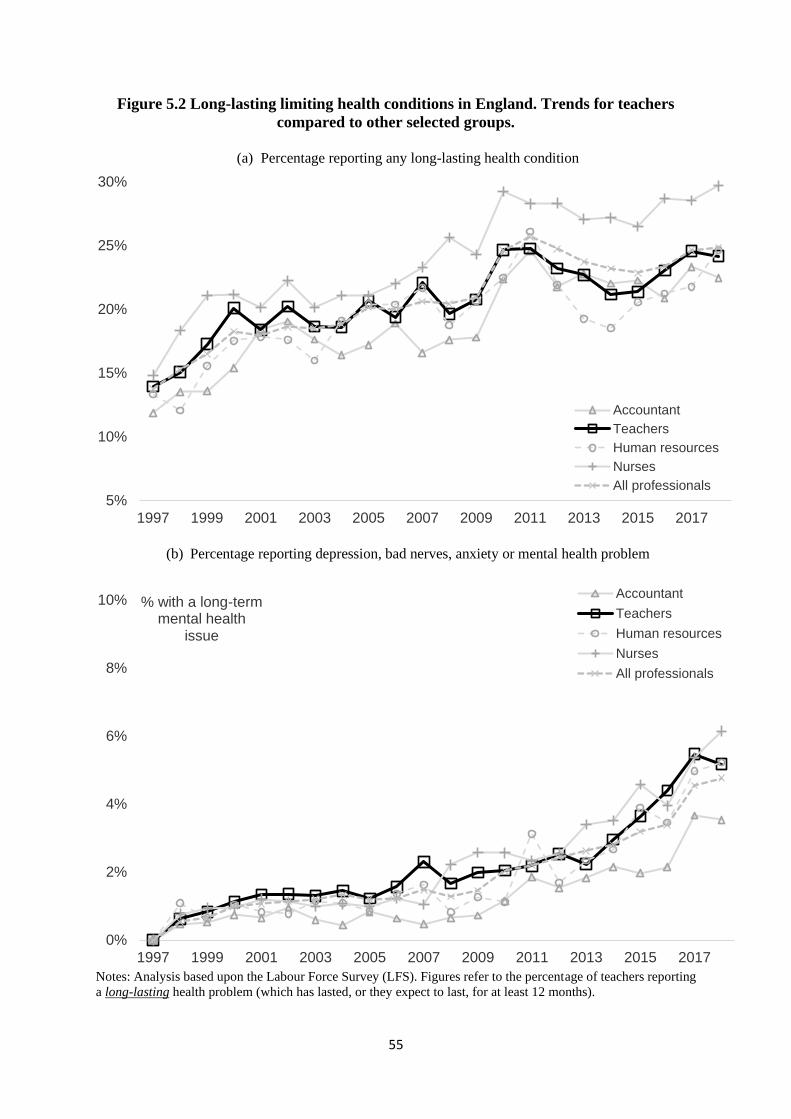
55
Figure 5.2 Long-lasting limiting health conditions in England. Trends for teachers
compared to other selected groups.
(a) Percentage reporting any long-lasting health condition
(b) Percentage reporting depression, bad nerves, anxiety or mental health problem
Notes: Analysis based upon the Labour Force Survey (LFS). Figures refer to the percentage of teachers reporting
a long-lasting health problem (which has lasted, or they expect to last, for at least 12 months).
5%
10%
15%
20%
25%
30%
1997 1999 2001 2003 2005 2007 2009 2011 2013 2015 2017
Accountant
Teachers
Human resources
Nurses
All professionals
0%
2%
4%
6%
8%
10%
1997 1999 2001 2003 2005 2007 2009 2011 2013 2015 2017
% with a long-term mental health
issue
Accountant
Teachers
Human resources
Nurses
All professionals

56
We attempt to corroborate this argument in Figure 5.3 This plots the trend for the percentage
of teachers in England who reported that their job had led them to develop an illness (or had
made a pre-existing illness worse) over the last year. Note that the sample size is much smaller
for this part of our analysis, given that this question was only asked in one specific LFS quarter.
The results nevertheless do little to suggest that there has been a substantial increase since 2006
in the proportion of teachers reporting that their job has made them ill or made an existing
health problem worse. This holds true both in general, panel (a), and specifically for depression,
panel (b). Focusing on the latter, between 2006 and 2015 around 2-3% of teachers in England
reported that their job had caused them to have a problem with depression, anxiety or stress.
There was an increase in the figure to around 4% in 2016 and 2017, though one should not
overinterpret this small change, particularly given the limited sample size. A broadly stable
trend over time can also be observed for each of the other comparator occupations. Put in the
context of the findings presented above (e.g. Figure 5.2), although there has been an increase
in reported mental health problems amongst teachers (and workers in other occupations)
recently, there has been little change in the proportion who suggest that this has been caused
or aggravated by their job. We again believe that this is consistent with our interpretation that
the recent rise in mental health issues observed in the LFS is likely to be due to previously
undiagnosed or unrecognised mental health problems that are now being reported.
Figure 5.3 The percentage of teachers in England reporting that they have an illness or
injury that has been caused or made worse by their job. Trends between 2004 and 2018.
(a) % illness made worse or caused by job
0%
2%
4%
6%
8%
10%
12%
14%
2006 2007 2008 2009 2010 2011 2012 2014 2015 2016 2017 2018
% illness due to job
AccountantTeachersHuman resourcesNursesAll professionals

57
(b) % depression caused by or made worse by job
Notes: Analysis based upon the Labour Force Survey (LFS). Estimates presented for teachers (as broadly defined).
Question not asked in 2013.
5.4 Annual Population Survey (APS) results
Given the recent rise in reported mental health problems by teachers in the LFS, it is important
we look at the period since 2010 in more detail. The APS allows us to establish whether there
has also been a decline in the personal wellbeing of teachers (and other occupational groups)
over this period. These results are presented in Figure 5.4, documenting how the percentage of
teachers with high levels of anxiety and unhappiness, and low levels of life satisfaction and
self-worth, changed between 2011 and 2018 (i.e. over the same period when reported mental
health issues in the LFS rose).
In contrast to the results from the LFS, there has been no substantive change over time in the
percentage of teachers in England reporting low levels of personal wellbeing. Each of the four
trend lines plotted in Figure 5.4 are essentially flat, with no clear evidence of an increase or
decrease over time. Similar results emerge from our analysis of average scores on the 11-point
wellbeing scale and when we use matching or regression to account for potential changes in
the demographic background characteristics of teachers over time. Again, we also find that the
trend over time for teachers is similar to the trend observed for other professional workers. It
is hence not the case that the personal wellbeing of teachers has remained stable, while for
others the situation has improved.
0%
2%
4%
6%
8%
10%
12%
2006 2007 2008 2009 2010 2011 2012 2014 2015 2016 2017 2018
% depression due to job
AccountantTeachersHuman resourcesNursesAll professionals

58
Figure 5.4 The percentage of teachers in England with poor personal wellbeing. Trends
between 2011 – 2018.
Notes: Figures refer to the percentage of teachers with high levels of anxiety, low levels of happiness, low levels
of life satisfaction and low levels of self-worth. Analysis based upon the Annual Population Survey (APS).
Our overall interpretation of these results is that it points towards changing attitudes and
acceptance of mental health problems in England. More people (both teachers and other
professionals) are reporting long-run mental health problems than ever before. Yet, at the same
time, there has been no simultaneous increase in the proportion of people who are anxious,
unhappy, unsatisfied in life and feeling of little worth. This indicates that, although underlying
levels of personal wellbeing are largely unchanged, people (including teachers) are more likely
to recognise and report that they have a mental health problem.
5.5 Health Survey for England (HSE) results
Figure 5.5 begins by plotting results for three of the HSE mental health and wellbeing measures
that are available over a long period of time. Although there is some year-to-year fluctuation
due to the small annual sample size8 there is no clear trend in the percentage of education
professionals with high GHQ scores (i.e. who are at risk of anxiety or depressive disorders). In
8 Recall that there are only around 100-200 education professionals in the HSE dataset each year.
0%
5%
10%
15%
20%
25%
30%
2011 2012 2013 2014 2015 2016 2017 2018
Anxious Unhappy Dissatisfied Low self-worth

59
the early 1990s, between 15-20% of education professionals had elevated GHQ scores. A
similar figure could be observed in the early 2000s, with little suggestion this has changed up
to today (2018).
Figure 5.5 Trends in the mental health and wellbeing outcomes of education
professionals. Evidence from Health Survey for England.
Notes: Figures refer to the percentage of education professionals with high GHQ scores (squares), who have had
a mental health issue diagnosed (circles) and who have been prescribed antidepressants (crosses). For 1994, 1995,
1996 and 1999 it is not possible to identify either teachers or education professionals, as not sufficiently detailed
occupation codes are available in the HSE dataset. Estimates are therefore not presented for these years. Markers
indicate the years where data is available. Source = authors’ analysis of the Health Survey for England dataset.
There is however some suggestion that there has been an increase in the proportion of education
professionals diagnosed with a mental health condition and who have been prescribed with
antidepressant medication. In the early 1990s, we estimate that around 3% of education
professionals were prescribed antidepressants, which rose to around 5% by the mid-2000s.
Over the last decade this has risen further, to reach around 7-8% of the education profession
today. A similar, though slightly less pronounced, pattern can also be observed in long-lasting
mental health problems reported by education professionals over this period. This is consistent
with results from the LFS, where we observed an increase in the percentage of teachers
reporting long-lasting mental health problems (particularly in recent years).
0%
5%
10%
15%
20%
25%
30%
1992 1997 2002 2007 2012 2017
% High GHQ
% Mental health issue
% prescribed antidepressants
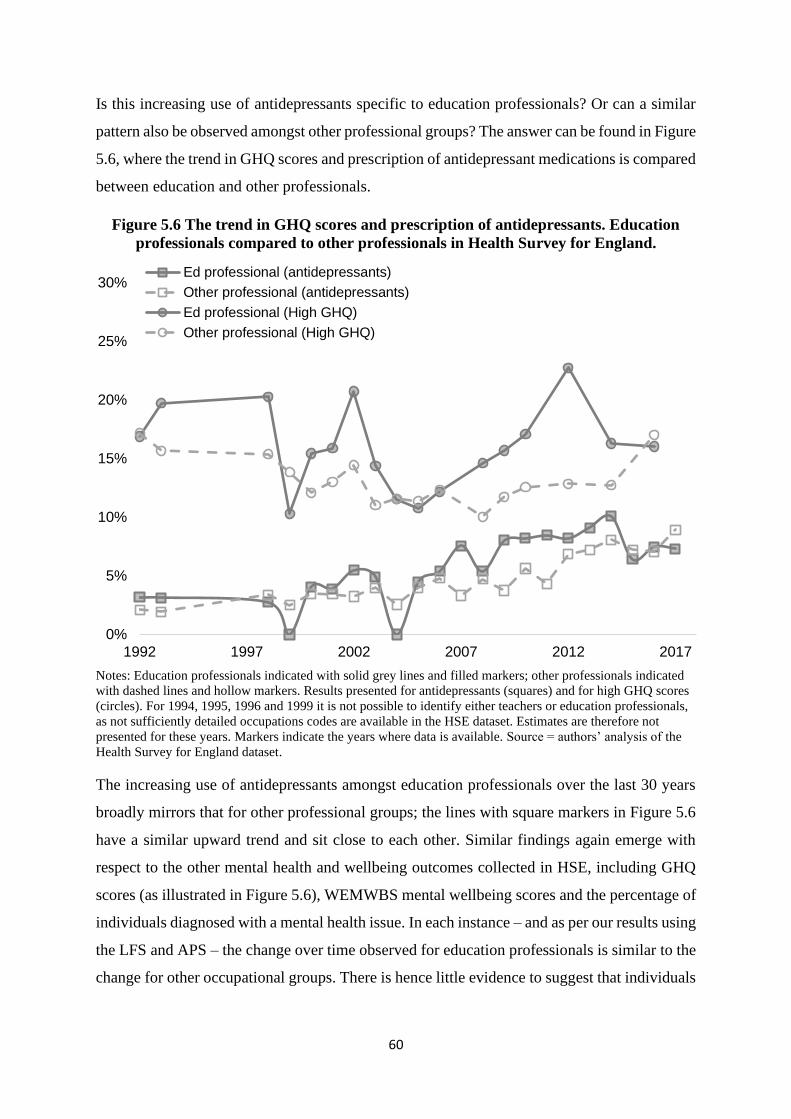
60
Is this increasing use of antidepressants specific to education professionals? Or can a similar
pattern also be observed amongst other professional groups? The answer can be found in Figure
5.6, where the trend in GHQ scores and prescription of antidepressant medications is compared
between education and other professionals.
Figure 5.6 The trend in GHQ scores and prescription of antidepressants. Education
professionals compared to other professionals in Health Survey for England.
Notes: Education professionals indicated with solid grey lines and filled markers; other professionals indicated
with dashed lines and hollow markers. Results presented for antidepressants (squares) and for high GHQ scores
(circles). For 1994, 1995, 1996 and 1999 it is not possible to identify either teachers or education professionals,
as not sufficiently detailed occupations codes are available in the HSE dataset. Estimates are therefore not
presented for these years. Markers indicate the years where data is available. Source = authors’ analysis of the
Health Survey for England dataset.
The increasing use of antidepressants amongst education professionals over the last 30 years
broadly mirrors that for other professional groups; the lines with square markers in Figure 5.6
have a similar upward trend and sit close to each other. Similar findings again emerge with
respect to the other mental health and wellbeing outcomes collected in HSE, including GHQ
scores (as illustrated in Figure 5.6), WEMWBS mental wellbeing scores and the percentage of
individuals diagnosed with a mental health issue. In each instance – and as per our results using
the LFS and APS – the change over time observed for education professionals is similar to the
change for other occupational groups. There is hence little evidence to suggest that individuals
0%
5%
10%
15%
20%
25%
30%
1992 1997 2002 2007 2012 2017
Ed professional (antidepressants)
Other professional (antidepressants)
Ed professional (High GHQ)
Other professional (High GHQ)
61
working in education have been particularly affected by an increase in mental health and
wellbeing problems over recent years.
5.6 Summary
This chapter has illustrated how there has been an increase in the prevalence of long-lasting
mental health problems reported by teachers over time, particularly the last decade. This has
been accompanied by a recent rise in the percentage of education professionals who are taking
prescribed antidepressant medication. At the same time, a range of widely used and validated
instruments designed to measure personal wellbeing and depressive symptoms has remained
broadly stable for teachers over the last 30 years. Moreover, the recent increase in mental health
issues reported (and being treated) amongst teachers can also be observed for other professional
groups. We consequently conclude that, although teachers are more likely to report mental
health issues now and to get them treated, there is little evidence to suggest that actual levels
of wellbeing and mental health amongst this group has declined - or that any trend is specific
to those working in the education sector.

62
Chapter 6 How does unhappiness and anxiety amongst
teachers in England vary over the academic year?
6.1 Introduction
In the previous chapter we considered a temporal dimension to teacher mental health and
wellbeing, exploring how it has changed relative to other professional groups since the early
1990s. However, one can consider whether there is a temporal element to teachers’ mental
health in other ways. In particular, note that the previous chapters have drawn upon survey data
collected at a somewhat arbitrary point in the academic year. This is standard practice within
this literature, with researchers drawing upon survey data from whenever the survey happened
to be conducted. This means we currently have a very limited understanding about how teacher
wellbeing varies over the course of an academic year – i.e. are there certain weeks or terms that
are more stressful (with teachers more anxious and less happy) than others? This has important
implications not only for our understanding of the epidemiology of teacher mental health, but
also for practitioners looking to support teachers (i.e. when their services are most likely to be
in demand) and for the design/timing of future data collections where teacher wellbeing is a
key issue.
There are also several reasons to suspect that the wellbeing of teachers may vary over the course
of a year, including between term time and school holidays. First, there could be variation in
teacher workload, with marking, lesson planning and administration being more intensive at
certain points during the year (see Chapter 9 for some empirical evidence on this issue). Such
short-term workload pressures may lead to peaks and troughs in the stress and anxiety that
teachers experience at certain timepoints. Second, the build-up to key events such as
examinations may lead to heightened levels of anxiety and lower levels of teacher happiness,
with teachers under increasing pressure from England’s high-stakes system of school
accountability. Third, teachers may simply get worn down as they work their way through the
school term. For instance, they may come back from the summer, Christmas or Easter break
feeling refreshed, but then the cumulative impact of working long hours for seven or eight
weeks non-stop leads them to becoming more anxious, unhappy and generally feeling run-
down. Alternatively, teachers may feel particularly anxious or worried as the new school year
(or even a new school term) is about to begin. This could be due to having new classes to teach,
changing roles or responsibilities, or renewed concerns about their workload and how they are
going to cope. The contribution of this chapter is to provide one of the first pieces of empirical
63
evidence on how the happiness and anxiety levels of teachers varies across the course of the
academic year.
6.2 Data and methodology.
The data used in this chapter is drawn from the APS gathered between March 2011 and
December 2018. This included the following question, which specifically asked respondents
about how they felt yesterday:
Next I would like to ask you four questions about your feelings on aspects of your life. There
are no right or wrong answers. For each of these questions I’d like you to give an answer
on a scale of 0 to 10, where 0 is ‘not at all’ and 10 is ‘completely’.
• Overall, how happy did you feel yesterday? (Happiness)
• On a scale where 0 is ‘not at all anxious’ and 10 is ‘completely anxious’, overall, how
anxious did you feel yesterday? (Anxiety)
Within the secure access version of the APS, exact day, month and year of the interview is
available9, meaning we know the exact day these questions refer to. For each APS year between
2011 and 2018, we code ‘week 1’ as the week starting the first Monday in September,
corresponding with the start of the new academic year in England. We then code all subsequent
weeks through to week 52. One complication is that precise school holiday dates vary between
geographically different areas - and between different schools - in England, although the
variation in school holiday dates is generally quite small (usually adjacent weeks)10. The
appendix provides a detailed list of the school holiday dates used for each APS year, and how
this corresponds to the survey week number11. The typical sample size is approximately 250
teachers responding per survey week, within the pooled sample. Throughout this chapter,
teachers include primary and secondary teachers, as well as school leaders.
The percentage of teachers who are ‘anxious’ (anxiety scores between 6-10) and ‘not happy’
(happiness score of 0-6) will first be plotted by survey week. This will be followed by a
comparison of the percentage of teachers who are anxious and not happy in each of the six
school terms and the six main school holiday periods in England. Specifically, propensity score
matching estimates will be used to match each teacher who responded to the APS personal
9 Note that this is different to the ‘reference week’ date that is available within the public use version of the APS.
Specifically, respondents are asked to recall various pieces of information about the reference week (e.g. hours
worked) with the actual survey being conducted at a later date (usually the week after, but sometimes later). 10 For instance, the February half-term in 2020 would typically be either 10th-14th February or 17th-21st February
within most schools. 11 The length of the spring term in England also varies somewhat depending upon the date of Easter.
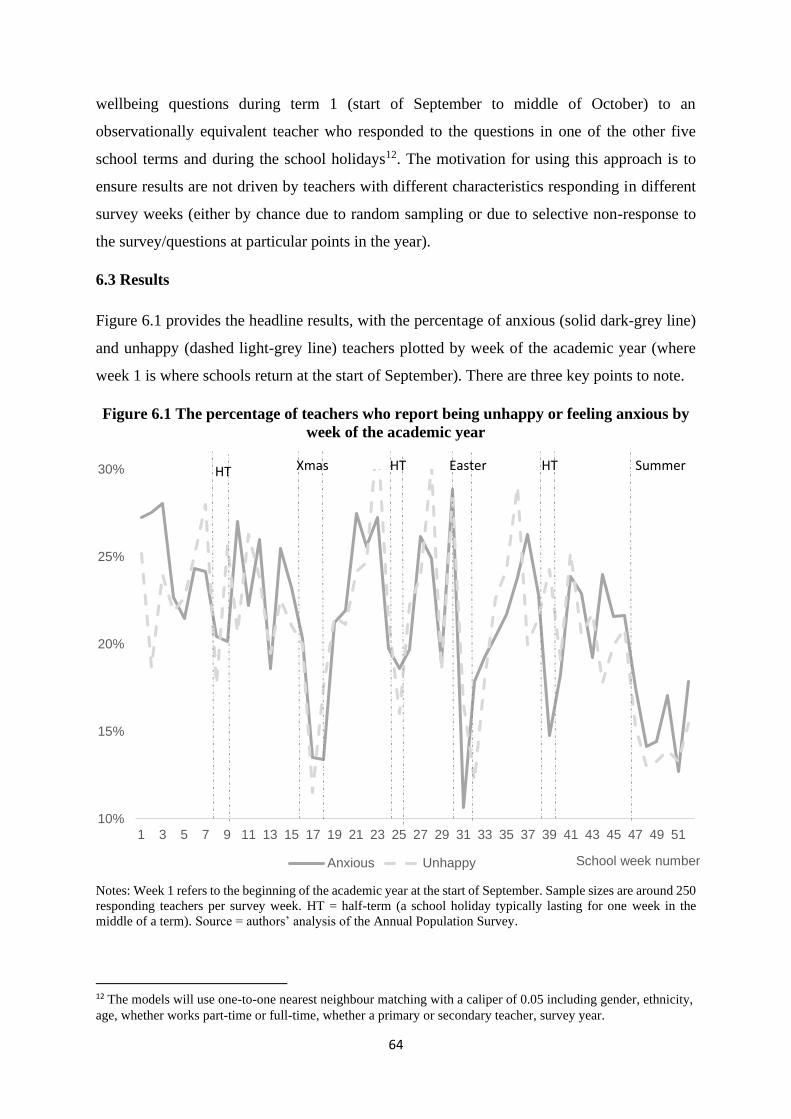
64
wellbeing questions during term 1 (start of September to middle of October) to an
observationally equivalent teacher who responded to the questions in one of the other five
school terms and during the school holidays12. The motivation for using this approach is to
ensure results are not driven by teachers with different characteristics responding in different
survey weeks (either by chance due to random sampling or due to selective non-response to
the survey/questions at particular points in the year).
6.3 Results
Figure 6.1 provides the headline results, with the percentage of anxious (solid dark-grey line)
and unhappy (dashed light-grey line) teachers plotted by week of the academic year (where
week 1 is where schools return at the start of September). There are three key points to note.
Figure 6.1 The percentage of teachers who report being unhappy or feeling anxious by
week of the academic year
Notes: Week 1 refers to the beginning of the academic year at the start of September. Sample sizes are around 250
responding teachers per survey week. HT = half-term (a school holiday typically lasting for one week in the
middle of a term). Source = authors’ analysis of the Annual Population Survey.
12 The models will use one-to-one nearest neighbour matching with a caliper of 0.05 including gender, ethnicity,
age, whether works part-time or full-time, whether a primary or secondary teacher, survey year.
10%
15%
20%
25%
30%
1 3 5 7 9 11 13 15 17 19 21 23 25 27 29 31 33 35 37 39 41 43 45 47 49 51
School week numberAnxious Unhappy
HT HT HTXmas Easter Summer

65
First, anxiety and unhappiness levels of teachers are low throughout the summer holidays (e.g.
approximately 15% of teachers feel anxious during this period), as illustrated at the right-hand
side of Figure 6.1 (weeks 47-52). However, figures then suddenly spike at the start of the
academic year (weeks 1-3) where almost double the number of teachers (approximately 27%)
report feeling anxious the previous day. This demonstrates how anxiety levels are likely to
change very quickly for some teachers as they return to work.
Second, the aforementioned result reflects a somewhat broader pattern, where anxiety and
unhappiness levels are notably lower amongst teachers during school holidays relative to term
time. This seems to hold true particularly during the longer school holiday periods at Christmas,
Easter and in the summer.
Finally, there is little evidence of a clear pattern either within or between school terms. For
instance, anxiety levels do not consistently start at a low (or high) level at the start of a term
and then either increase or decrease. Likewise, there does not seem to be any one term where
anxiety and unhappiness levels stand out as particularly low or particularly high. In other
words, there is no obvious term or half-term where teachers report feeling particularly anxious
and/or miserable. (Nor is there any term or half-term where teachers are clearly happier and
more relaxed).
These findings are formalised in Table 6.1, where we use propensity score matching to compare
how the percentage of anxious and unhappy teachers differs across the various school terms
and school holidays.
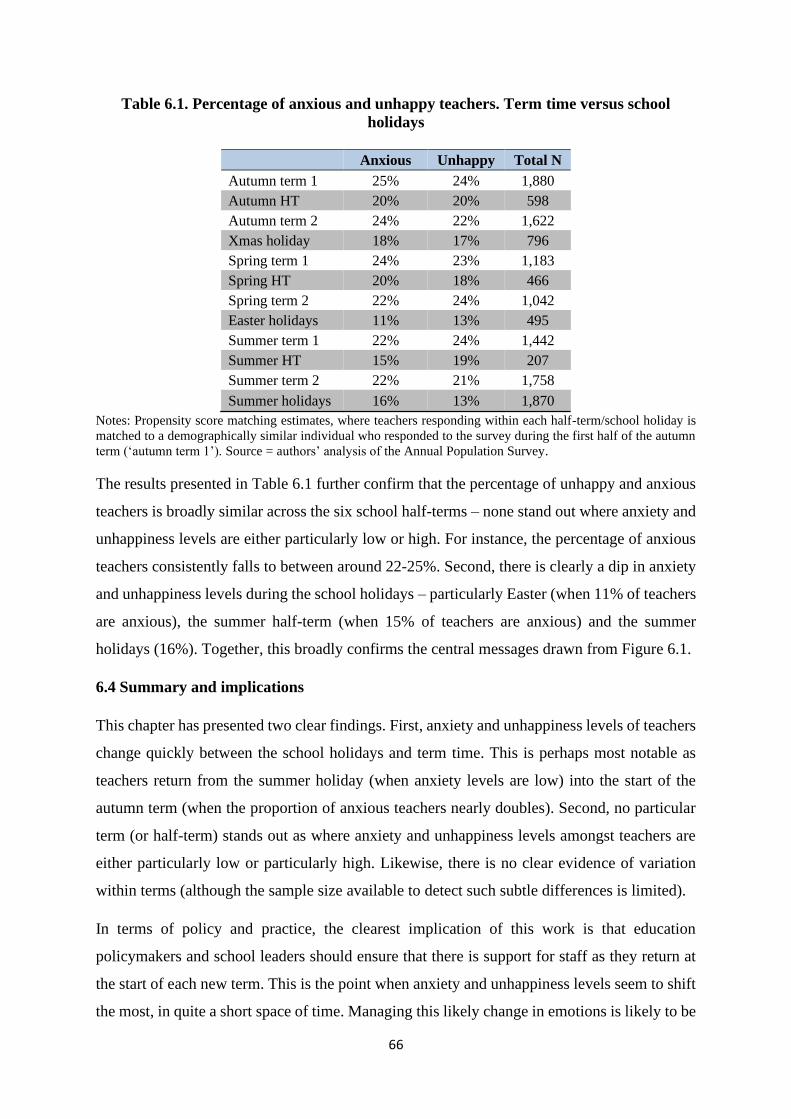
66
Table 6.1. Percentage of anxious and unhappy teachers. Term time versus school
holidays
Anxious Unhappy Total N
Autumn term 1 25% 24% 1,880
Autumn HT 20% 20% 598
Autumn term 2 24% 22% 1,622
Xmas holiday 18% 17% 796
Spring term 1 24% 23% 1,183
Spring HT 20% 18% 466
Spring term 2 22% 24% 1,042
Easter holidays 11% 13% 495
Summer term 1 22% 24% 1,442
Summer HT 15% 19% 207
Summer term 2 22% 21% 1,758
Summer holidays 16% 13% 1,870
Notes: Propensity score matching estimates, where teachers responding within each half-term/school holiday is
matched to a demographically similar individual who responded to the survey during the first half of the autumn
term (‘autumn term 1’). Source = authors’ analysis of the Annual Population Survey.
The results presented in Table 6.1 further confirm that the percentage of unhappy and anxious
teachers is broadly similar across the six school half-terms – none stand out where anxiety and
unhappiness levels are either particularly low or high. For instance, the percentage of anxious
teachers consistently falls to between around 22-25%. Second, there is clearly a dip in anxiety
and unhappiness levels during the school holidays – particularly Easter (when 11% of teachers
are anxious), the summer half-term (when 15% of teachers are anxious) and the summer
holidays (16%). Together, this broadly confirms the central messages drawn from Figure 6.1.
6.4 Summary and implications
This chapter has presented two clear findings. First, anxiety and unhappiness levels of teachers
change quickly between the school holidays and term time. This is perhaps most notable as
teachers return from the summer holiday (when anxiety levels are low) into the start of the
autumn term (when the proportion of anxious teachers nearly doubles). Second, no particular
term (or half-term) stands out as where anxiety and unhappiness levels amongst teachers are
either particularly low or particularly high. Likewise, there is no clear evidence of variation
within terms (although the sample size available to detect such subtle differences is limited).
In terms of policy and practice, the clearest implication of this work is that education
policymakers and school leaders should ensure that there is support for staff as they return at
the start of each new term. This is the point when anxiety and unhappiness levels seem to shift
the most, in quite a short space of time. Managing this likely change in emotions is likely to be
67
important to teachers in maintaining good mental health. In particular, school leaders should
reach out to colleagues over this period in particular to try and identify any of their colleagues
who may be struggling, and to guide them in the right direction to receive any necessary
support.
68
Chapter 7 The wellbeing and lifestyles of recently
qualified teachers
7.1 Introduction
The preceding chapters of this report have focused upon teachers of all ages and stages of their
career. This is standard within the literature on teacher wellbeing and mental health, which has
rarely focused upon results for specific subgroups. In contrast, this chapter pays specific
attention to the lives of young, recently qualified teachers. This is important as early career
teachers are a key group where retention is particularly low and are hence worthy of specific
attention in their own right. Moreover, all the evidence on teacher mental health and wellbeing
presented in this report thus far has been cross-sectional, using data from a sample of teachers
at just a single point in time. Again, this is standard practice within this literature. This means,
however, that little can be said about how young people’s lives change after entering teaching
(e.g. does their life satisfaction decline after entering teaching compared to before). By using
longitudinal data – tracking a cohort of young people before and after they enter teaching – this
chapter can shed new light on this issue.
The main aim of this chapter is hence to find out more about the happiness, wellbeing, health
and working lives of recently qualified teachers (i.e. teachers who have been working in the
job for approximately three years or less). This group have chosen to teach for their career; yet
many will quit for alterative employment before they turn 30 (Foster, 2019). They are hence
individuals who schools desperately need to retain. It is therefore vital that we develop a better
understanding of their lives, the most pressing challenges that they face and how this compares
to their peers working in other jobs. We are specifically interested in potential factors that may
end up ‘pushing’ recently qualified teachers out of the teaching profession, such as having low
levels of life satisfaction, whether they are showing signs of developing mental health
problems, whether they have excessive workloads, if they manage to have a reasonable work-
life balance and whether they are adequately paid.
7.2. Data and methodology
This chapter uses data from the Next Steps study, tracking a cohort of young people (born in
1989/1990) from age 14 through to age 26, when a total of 291 were working as teachers
(defined as primary or secondary school teaching staff). Throughout the analysis, outcomes for
these teachers are compared to outcomes for their school peers who are: (a) employed in lower

69
professional or managerial occupations13, (b) a university graduate, (c) working in health-based
occupations14, and (d) working in selected office jobs15. Comparisons include their general
health, life satisfaction, weekly hours worked, whether they believe that hard work is
rewarded16, the percentage showing signs of anxiety depression (based upon GHQ scores),
information on their quality and quantity of sleep, alcohol consumption and social activities.
Further details on how these measures have been derived can be found in Jerrim (2020).
Results are presented in the form of descriptive statistics. These illustrate the distribution of
the responses by teachers (and workers in selected other occupations) to the Next Steps survey
questions. Critically, where possible, we illustrate how individuals responded to the question
before they entered the workplace (from the age 20 survey sweep and before) to those at age
26 (when most graduates are in the workplace). Thus, for teachers, we can investigate whether
their responses to the questions changed before and after they started working in their job. Two
additional approaches have been used to investigate the robustness of the key findings reported
(regression analyses and propensity score matching). These more complex methodologies were
found not to alter the substantive results and so are not reported here (see Jerrim, 2020 for
further details).
7.3 Results for general health and life satisfaction
Table 7.1 begins by presenting results for two global measures of health and wellbeing – overall
life satisfaction and general health. Starting with the former, there are three key points of note.
First, the distribution of life satisfaction scores for individuals who chose to become teachers
is very similar at age 20 (before they started work) and age 26 (once they have started work).
In other words, recently qualified teachers are just as satisfied with their life as they were before
they started working in their career. Second, the same does not seem to hold true for the other
occupational groups. In particular, there is a decline in the percentage of individuals who report
being ‘very satisfied’ between age 20 and age 26 amongst lower managerial workers (32-26%),
graduates (32-25%) and those in office jobs (34-25%) – whereas the figure remains stable for
teachers (37% at age 20 and age 26). Finally, life satisfaction scores amongst recently qualified
13 This is the same National Statistics Socio-economic Classification (NSSEC) group as teachers. 14 This includes nurses, midwives, physiotherapists, occupational therapists, social workers, medical
practitioners and paramedics. 15 This includes accountants, management consultants, project managers, architects, town planners, surveyors,
public relations officers, statisticians, human resource officer/manager and IT workers. 16 This was gathered via responses to the following statement: ‘Britain today is a place where hard work is
rewarded’ using a four-point scale (strongly agree to strongly disagree).

70
teachers (and health workers) are generally at a higher level than for the other occupational
groups. We consequently conclude that overall life satisfaction is higher amongst junior
teachers than for young people who have chosen to work in other jobs.
Table 7.1 Comparison of life satisfaction and general health between recently qualified
teachers and other occupational groups
Teachers Lower
managerial Graduates
Health
workers Office job
Life Satisfaction Age
20
Age
26
Age
20
Age
26
Age
20
Age
26
Age
20
Age
26
Age
20
Age
26
1. Very dissatisfied 0% 0% 1% 1% 1% 1% 0% 0% 3% 1%
2. Dissatisfied 2% 5% 6% 5% 3% 7% 2% 2% 6% 6%
3. Neither 9% 4% 11% 13% 9% 13% 5% 6% 7% 8%
4. Satisfied 52% 54% 50% 55% 55% 54% 47% 50% 51% 60%
5. Very satisfied 37% 37% 32% 26% 32% 25% 46% 42% 34% 25%
Average 4.22 4.24 4.05 4.01 4.13 3.95 4.37 4.33 4.07 4.03
General health
Age
17
Age
26
Age
17
Age
26
Age
17
Age
26
Age
17
Age
26
Age
17
Age
26
% in good health 96% 95% 94% 93% 94% 93% 92% 97% 93% 97% Notes: Figures refer to unconditional percentages with the age 26 survey weight applied. The ‘average score’
refers to the average along the five-point scale, where 1 = very dissatisfied and 5 = very satisfied. Sample sizes
are approximately 245 (teachers), 1,356 (lower managerial), 2,092 (graduates), 179 (health workers) and 216
(office jobs). Source = authors’ analysis of the Next Steps dataset.
Turning to respondents’ general health, we find roughly the same percentage of teachers
reporting to be in good health at age 26 compared to when they were age 17 (see the final row
of Table 7.1). In other words, starting to work as a teacher does not seem to be associated with
a decline in self-reported general health. Table 7.1 also reveals that the same holds true for
other occupational groups, except for those who enter health occupations, where the percentage
reporting to be in good health increases (from 92% at age 17 to 97% at age 26). Otherwise,
Table 7.1 illustrates how recently qualified teachers do not report their general health to be any
better or worse than the general health of their former school peers who work in other jobs.
7.4 Workload and pay
Table 7.2 turns to key aspects of teachers’ jobs. The first row clearly illustrates how the average
weekly working hours of junior teachers are higher than for other occupational groups.
Compared to other lower managerial workers, junior teachers report working (on average)
around nine hours more per week (48.2 versus 39.6 hours), with a similar difference relative to
university graduates. Although the difference between junior teachers and office workers is
smaller, it is still reported to be around six hours per week. Of course, some of this difference
is likely to be offset by the fact that teachers typically have a greater amount of annual leave
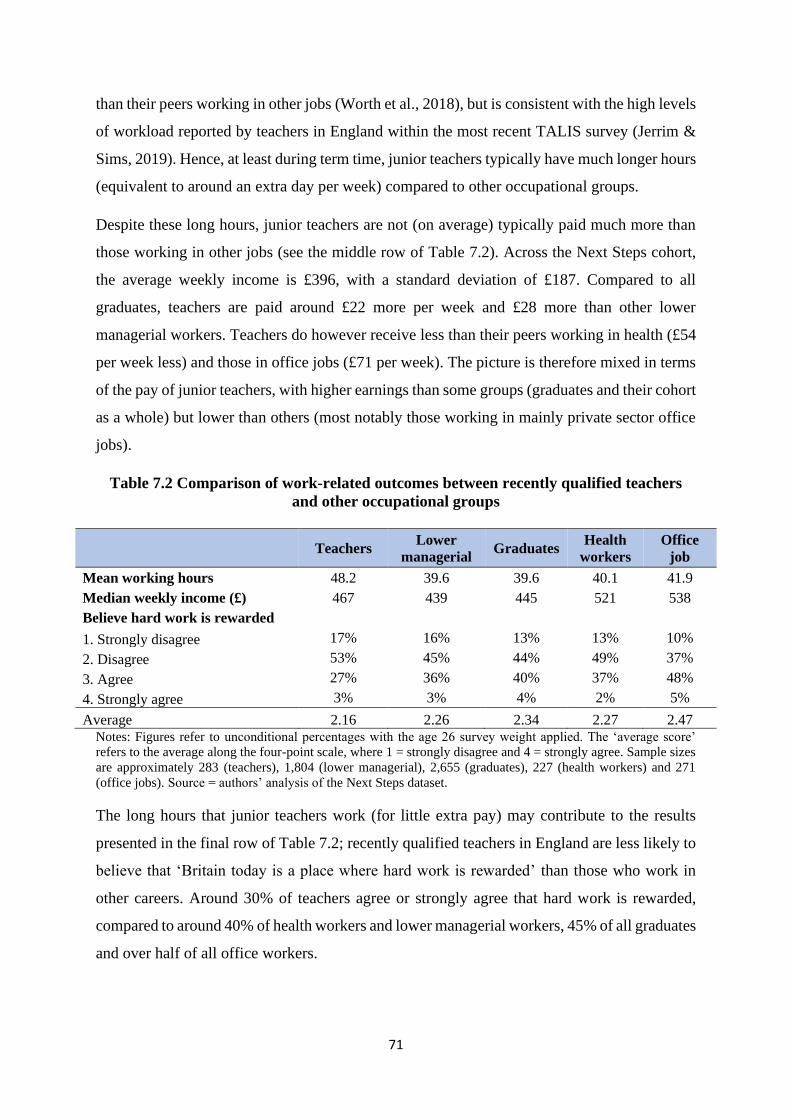
71
than their peers working in other jobs (Worth et al., 2018), but is consistent with the high levels
of workload reported by teachers in England within the most recent TALIS survey (Jerrim &
Sims, 2019). Hence, at least during term time, junior teachers typically have much longer hours
(equivalent to around an extra day per week) compared to other occupational groups.
Despite these long hours, junior teachers are not (on average) typically paid much more than
those working in other jobs (see the middle row of Table 7.2). Across the Next Steps cohort,
the average weekly income is £396, with a standard deviation of £187. Compared to all
graduates, teachers are paid around £22 more per week and £28 more than other lower
managerial workers. Teachers do however receive less than their peers working in health (£54
per week less) and those in office jobs (£71 per week). The picture is therefore mixed in terms
of the pay of junior teachers, with higher earnings than some groups (graduates and their cohort
as a whole) but lower than others (most notably those working in mainly private sector office
jobs).
Table 7.2 Comparison of work-related outcomes between recently qualified teachers
and other occupational groups
Teachers Lower
managerial Graduates
Health
workers
Office
job
Mean working hours 48.2 39.6 39.6 40.1 41.9
Median weekly income (£) 467 439 445 521 538
Believe hard work is rewarded
1. Strongly disagree 17% 16% 13% 13% 10%
2. Disagree 53% 45% 44% 49% 37%
3. Agree 27% 36% 40% 37% 48%
4. Strongly agree 3% 3% 4% 2% 5%
Average 2.16 2.26 2.34 2.27 2.47 Notes: Figures refer to unconditional percentages with the age 26 survey weight applied. The ‘average score’
refers to the average along the four-point scale, where 1 = strongly disagree and 4 = strongly agree. Sample sizes
are approximately 283 (teachers), 1,804 (lower managerial), 2,655 (graduates), 227 (health workers) and 271
(office jobs). Source = authors’ analysis of the Next Steps dataset.
The long hours that junior teachers work (for little extra pay) may contribute to the results
presented in the final row of Table 7.2; recently qualified teachers in England are less likely to
believe that ‘Britain today is a place where hard work is rewarded’ than those who work in
other careers. Around 30% of teachers agree or strongly agree that hard work is rewarded,
compared to around 40% of health workers and lower managerial workers, 45% of all graduates
and over half of all office workers.

72
7.5 Mental health
The issue of mental health, as measured by responses to the GHQ, is covered in Table 7.3. This
provides the percentage of respondents with a total score above a certain threshold, with our
particular interest being in those with a score of four or more (a threshold often used to
potentially indicate anxiety or depression). The final row also gives the average GHQ score of
respondents along the 12-point scale.
There is no evidence that the mental health of junior teachers at age 26 was any worse, on
average, than when they were age 17. At both timepoints, around one in five individuals who
went on to become teachers had a GHQ score of four or more. A similar finding holds for the
other occupational groups considered, with only health workers seeing a sizeable fall in
respondents with depressive symptoms (36% at age 17 to 23% at age 26). Overall, Table 7.3
provides little evidence that the mental health of junior teachers has declined compared to when
they were younger, or that it is any worse than for other young professionals.
Table 7.3 Comparison of current mental health outcomes. Teachers versus other
occupational groups
Teachers Lower
managerial Graduates
Health
workers Office job
GHQ total score Age
17
Age
26
Age
17
Age
26
Age
17
Age
26
Age
17
Age
26
Age
17
Age
26
0 (No evidence of
anxiety depression) 43% 45% 39% 41% 35% 40% 24% 41% 32% 36%
1 to 3 36% 36% 36% 37% 39% 37% 40% 35% 38% 39%
4+ (suggestion of
anxiety/depression) 21% 19% 24% 22% 26% 24% 36% 23% 30% 25%
Average GHQ
score 1.91 1.97 2.25 2.14 2.33 2.32 2.96 2.14 2.58 2.37 Notes: Figures refer to unconditional percentages with the age 26 survey weight applied. The ‘average score’
refers to the average across the 12-point GHQ scale. Sample sizes are approximately 248 (teachers), 1,509 (lower
managerial), 2,220 (graduates), 188 (health workers) and 228 (office jobs). Source = authors’ analysis of the Next
Steps dataset.
Figure 7.1 Illustrates the change in how teachers responded to each question on the GHQ, with
figures referring to the percentage of respondents who reported the symptom to be currently
worse than usual. There are two key points to note. First, for most of the questions, roughly the
same percentage of teachers reported suffering from the problem at age 26 as age 17. This
reaffirms our previous finding that the mental health of junior teachers is (on average) little
different from before when they started working in their job. Second, there are two out of the
12 questions where teachers are more likely to report a negative outcome at age 26 (than at age
17); they tend to feel more constantly under strain (an increase from 39-44%) and unable to
play a useful part in things (an increase from 4-9%). Interestingly, the same pattern with respect
to feeling ‘constantly under strain’ cannot be observed for individuals working in other jobs
(see Jerrim, 2020). This is therefore potentially one aspect of junior teachers’ mental health –

73
feeling constantly under pressure – which may get worse as a result of their occupational
choice.
Figure 7.1 Responses of teachers to each GHQ question. Age 17 and age 26
Notes: Figures refer to the percentage of teachers reporting each symptom to be worse than usual. Sample sizes
are approximately 255 teachers. Source = authors’ analysis of the Next Steps dataset.
7.6 Sleep
Table 7.4 turns to the specific issue of sleep, which previous research has shown to be affected
by certain mental health problems, such as anxiety (Alvaro, Roberts & Harris, 2013). There is
no evidence that junior teachers get less sleep overall than other occupational groups; with
most 26-year-olds sleeping around seven hours each night, irrespective of their job. In terms
of quality of sleep, there is again little to suggest that junior teachers stand out. Those
individuals who decided to become teachers were just as likely to report suffering from
problems sleeping at age 17 (26%) as at age 26 (26%). Similarly, the percentage of teachers
reporting issues with sleeping at age 26 is similar to other occupational groups. Our overall
6%
7%
12%
4%
11%
12%
15%
23%
19%
27%
26%
39%
6%
8%
8%
9%
12%
14%
17%
19%
19%
20%
27%
44%
0% 10% 20% 30% 40% 50%
Incapable of making decisions
Unable to face up to problems
Felt worthless
Unable to play a useful part
Not feeling reasonably happy
Unable to concentrate
Not enjoying day-to-day activities
Couldn't overcome difficulties
Losing confidence
Feeling unhappy/depressed
Lost sleep over worry
Constantly under strain
Teachers Age 26
Teachers Age 17

74
interpretation of Table 7.4 is therefore that there is little suggestion that the quality and quantity
of junior teachers’ sleep differs substantially from young people working in other jobs.
Table 7.4 Comparison of sleep quality and quantity between recently qualified teachers
and other occupational groups
Teachers Lower
managerial Graduates
Health
workers Office job
Age
17
Age
26
Age
17
Age
26
Age
17
Age
26
Age
17
Age
26
Age
17
Age
26
Hours of sleep - 7.15 - 7.00 - 7.11 - 6.90 - 7.10
Lost sleep over worry
1. Not at all 26% 22% 35% 24% 33% 25% 24% 20% 26% 22%
2. No more than usual 48% 51% 39% 50% 38% 50% 41% 50% 37% 54%
3. Rather more than
usual 20% 19% 20% 20% 23% 19% 27% 25% 27% 19%
4. Much more than
usual 6% 7% 6% 5% 5% 6% 7% 6% 10% 5%
Average 2.06 2.12 1.97 2.07 2.01 2.05 2.18 2.16 2.20 2.07 Notes: Figures refer to unconditional percentages with the age 26 survey weight applied. The ‘average score’
refers to the average along the four-point scale, where 1 = not al all and 4 = much more than usual. Sample sizes
are approximately 255 (teachers), 1,537 (lower managerial), 2,274 (graduates), 194 (health workers) and 235
(office jobs). Source = authors’ analysis of the Next Steps dataset.
7.5 Social life
We have already seen how junior teachers tend to work longer hours per week (on average)
than their former school peers pursuing other careers (recall Table 7.22). But does this then
mean that junior teachers sacrifice their life outside of work and their social activities? Table
7.5 provides some insight into this issue of work-life balance.

75
Table 7.5 Comparison of frequency of social activities between recently qualified
teachers and other occupational groups
Teachers Lower
managerial Graduates
Health
workers Office job
Age
17
Age
26
Age
17
Age
26
Age
17
Age
26
Age
17
Age
26
Age
17
Age
26
Sport/exercise weekly 67% 72% 54% 66% 62% 71% 50% 66% 67% 68%
Visit museum/gallery
monthly - 13% - 14% - 19% - 10% - 18%
Cinema/concert/theatre
monthly 80% 55% 74% 54% 77% 60% 76% 48% 77% 63%
Group activities monthly - 14% - 15% - 16% - 17% - 11%
Pub/bar/club in last month 76% 70% 77% 71% 71% 72% 75% 59% 79% 77%
Meal out weekly - 26% - 33% - 32% - 29% - 40%
Meet up with friends
weekly - 61% - 68% - 65% - 63% - 72% Notes: Figures refer to unconditional percentages with the age 26 survey weight applied. Sample sizes are
approximately 260 (teachers), 1,561 (lower managerial), 2,316 (graduates), 196 (health workers) and 238 (office
jobs). Source = authors’ analysis of the Next Steps dataset.
In general, there is little sign that junior teachers have a less active social life outside of work
than other young people. Although they are less likely to go to the cinema, concert or theatre
at age 26 than at age 17, the same pattern is also observed for other occupational groups. Junior
teachers were also more likely to do regular exercise at age 26 (72%) than at age 17 (67%),
with a similar increase also observed for graduates and other lower managerial workers. More
generally, at age 26, junior teachers are just as likely to participate in sport, visit
museums/galleries, participate in group activities and go to the pub as other occupational
groups. Similarly, the social activities of teachers appear most different to office workers, with
the latter more regularly going to a pub (70% versus 77%), having meals out (26% versus 40%)
or meeting up with their friends (61% versus 72%). Nevertheless, our overall interpretation of
Table 7.5 is that there is little suggestion that the work-life balance of junior teachers is
substantially different to other occupational groups.
7.6 Alcohol consumption
To conclude, Table 7.6 compares junior teachers to other professions in terms of alcohol
consumption, which is used by many adults in England as a way to cope with stress (Appleton
& James, 2018). Teachers drank alcohol at roughly the same frequency at age 20 as at age 26,
which is the same as for young professionals in other jobs. More generally, there is no clear
pattern that teachers drink any more (or less) than other occupational groups, with the potential
exception of office workers (20% of junior teachers say they drink at least two to three times a

76
week, compared to almost 40% of office workers). Yet the central message to be taken from
Table 7.6 is that the alcohol consumption of junior teachers is not substantially different to
other workers.
Table 7.6 Comparison of alcohol consumption between recently qualified teachers and
other occupational groups
Teachers Lower
managerial Graduates
Health
workers Office job
Frequency of
drinking
Age
20
Age
26
Age
20
Age
26
Age
20
Age
26
Age
20
Age
26
Age
20
Age
26
1. Never 10% 11% 7% 11% 12% 14% 7% 11% 7% 11%
2. Monthly or less 26% 29% 30% 25% 25% 24% 38% 28% 18% 15%
3. 2-4 times a month 45% 40% 42% 39% 42% 34% 42% 43% 43% 35%
4. 2-3 times a week 14% 19% 15% 20% 16% 24% 12% 14% 23% 33%
5. 3-4 times a week
or more 4% 1% 6% 5% 6% 5% 1% 3% 8% 6%
Average 2.76 2.69 2.84 2.84 2.81 2.83 2.63 2.68 3.07 3.09 Notes: Figures refer to unconditional percentages with the age 26 survey weight applied. The ‘average score’
refers to the average along the five-point scale, where 1 = never and 5 = four times a week or more. Sample sizes
are approximately 244 (teachers), 1,357 (lower managerial), 2,094 (graduates), 177 (health workers) and 217
(office jobs). Source = authors’ analysis of the Next Steps dataset.
7.7 Summary
Against conventional wisdom, we have found junior teachers actually to have higher levels of
life satisfaction than their peers working in other occupations and in comparison to their age
cohort as a whole. Yet, within their jobs, they tend to work much longer hours (at least during
term time) than those pursuing other careers, and for little extra pay. Importantly, junior
teachers are particularly likely to disagree with the statement that ‘Britain is a place where hard
work is rewarded’, potentially highlighting how they feel undervalued and under-appreciated17.
Although it is not clear how responses to such questions relate to individual experience – rather
than reflecting their current view of Britain as a society – it is nevertheless consistent with the
findings of Jerrim and Sims (2019:118), who used TALIS 2018 to show how most teachers in
England do not feel valued by the policymakers, the media and society as a whole. However,
despite regular news stories about the stress associated with being a junior teacher (Busby,
2018) and increasing mental health problems within the profession (Bulman, 2018), we find
little evidence that the mental health of junior teachers is any worse than within other
occupational groups. This holds true for responses to a widely used and validated mental health
17 It should be noted that this refers to responses before the Covid-19 pandemic. Data is not yet available on how
this might have changed since.

77
screening questionnaire (the GHQ) and also for a selection of other behaviours linked to stress,
anxiety and depression, such as quantity and quality of sleep and excessive alcohol
consumption. Likewise, despite the long hours that teachers work, there is no evidence that
they have a less active social life than those working in other jobs.
The key area where recently qualified teachers seem to be worse off than young people in other
jobs hence seems to be the long hours that they work (at least during term time) and that they
are less likely to believe that ‘Britain today is a place where hard work is rewarded’. While
there are many initiatives currently under way attempting to tackle the former (workload), there
is much less policy discussion about the latter (teachers feeling that hard work goes
unrewarded). Yet these two factors are potentially a toxic mix. If junior teachers are expected
to work long hours – but do not feel that this effort is appreciated – it is little wonder why many
end up choosing to leave. More work needs to be done to understand exactly why young
teachers in England feel this way. But it does nevertheless suggest that government, education
policymakers and school leaders need to make greater efforts to show junior teachers that their
hard work and dedication to the job is highly valued and sincerely appreciated.
78
Chapter 8 Is there an association between leaving
teaching and improvements in mental health?
8.1 Introduction
Whereas the previous chapter focused upon a cohort of younger, recently qualified teachers,
this chapter turns to those who have been working in the teaching profession for a number of
years and may be considering moving to another job. In particular, those teachers who are
contemplating a change of career may wonder if by doing so they will have higher levels of
wellbeing, and a lower likelihood of developing mental health problems, than those who choose
to remain?
The evidence in relation to teachers on this matter is limited. The study most comparable to the
work presented in this chapter is that of Bamford and Worth (2017). They found that teachers
who left the profession experience a large increase in job satisfaction, and a small increase in
subjective wellbeing, compared with those who decided to stay. This chapter seeks to
contribute further evidence to this understudied area, with a particular focus upon the wellbeing
and mental health outcomes of current and former teachers aged between 40 and 65 within the
UK. It is, to our knowledge, the first study to utilise the UK Biobank dataset to investigate this
issue. Through this data, we have access to a wide array of information about respondents’
wellbeing and mental health. This not only includes responses to standardised questionnaires
(as have previously been used in this literature) but also prescription of common medicines
used for conditions such as anxiety, depression and insomnia. These data can therefore be used
to explore the mental health outcomes of current and former teachers across a wide range of
important measures.
8.2 UK Biobank data
The initial UK Biobank data collection took place between 2006 and 2010, recruiting around
half a million volunteers aged between 40 and 69. Participants attended an initial assessment
centre, where they completed questionnaires, were interviewed by a trained health professional
(in order to collect accurate information about medical conditions and currently prescribed
drugs) and underwent some basic health checks. This included a set of questions designed to
measure neuroticism (e.g. ‘do you suffer from nerves’), depression (e.g. ‘how often felt
unenthusiastic/ disinterest over the last two weeks’), sleep quality and quantity, alcohol intake,
overall happiness (e.g. ‘in general, how happy are you’) and happiness with different aspects
79
of life (e.g. how happy felt with work, family, finances, friends, health). They were also asked
about medicines they were currently taking by a trained nurse and any medical conditions that
had been diagnosed. We use this information to derive binary indicators of whether the
respondent had a mental health condition and whether they were prescribed antidepressants at
the time the assessment centres took place. See Jerrim et al. (2020c) for further details about
the measures used.
In 2016, 117,500 participants also completed an online ‘occupational career’ questionnaire,
enabling us to identify current and former teachers (including when the latter left the
profession). In total, 16,662 individuals were currently working as teachers when the initial
assessment centre took place: 1,271 had left within the last five years, 661 had left five to ten
years ago and 2,214 had left more than ten years previously. Note that, throughout this chapter,
the ‘teachers’ group of interest encompasses primary and secondary teachers, as well as
headteachers. Table 8.1 provides some descriptive information about how the background
characteristics of the Biobank sample compares to the estimates of the population of age 40−65-
year-old teachers (based upon nationally representative sample surveys). On the whole, the
Biobank sample is reasonably similar to these population estimates, at least in terms of the
observable characteristics considered. Based upon this sample, we use regression modelling to
compare current teachers to former teachers in terms of each of the outcome measures
described above18.
A subset of Biobank participants completed return visits to the assessment centre, providing a
longitudinal element to the dataset. Most of the same data were collected as in the initial
assessment centre. Critically, this means we can identify individuals who have changed job
between the two assessment centres (e.g. individuals who joined or left the teaching profession)
and measure change in the aforementioned measures of mental health and wellbeing19. In total,
925 individuals were teachers at both the baseline and follow-up assessment centres, 167 had
18 These models control for household structure, family history of mental illness, whether a major life event
occurred in last two years (e.g. divorce, had a relative die), month the assessment centre took place, reported spells
of depression before they entered teaching and an array of demographic characteristics. 19 A subset of respondents also completed a follow-up mental health questionnaire, including some additional
measures. These results are not reported here for brevity, as they essentially replicate the key findings presented
within other parts of our analysis. For further details see Jerrim et al. (2020c).

80
left the teaching profession and 176 had joined. Regression modelling is again used to compare
our outcomes of interest across these three groups20.
Table 8.1 Characteristics of the Biobank sample compared to population estimates
Biobank
Population estimate
Estimate Source
Average age 53 51 LFS
% male 27% 27% LFS
% children in household 53% 44% LFS
% Partner in household 76% 74% LFS
% hold a degree 84% 75% LFS
Average age left school 20 21 LFS
Born outside UK 7% 7% LFS
Homeowner 95% 94% LFS
Smoker 6% 4% APS 2010
% poor general health 1% 1% NCDS 2008
% fair general health 14% 7% NCDS 2008
% good general health 63% 65% NCDS 2008
% excellent general health 22% 26% NCDS 2008
Total teachers 16,622 Notes: LFS = Labour Force Survey data for 40-65-year-old teachers from January-March sweeps 2007,2008 and
2009. APS = Annual Population Survey data from 2010 for 40-65-year-old teachers. NCDS = National Child
Development Survey from 2008 (when respondents were 50 years old). The NCDS data for ‘good’ and ‘very
good’ general health has been combined. APS 2010 uses information for all education and teaching professionals.
Source = authors’ analysis of the UK Biobank dataset.
Within all analyses, results for continuous outcome measures are reported in terms of effect
sizes where we interpret values below 0.1 as evidence of essentially no effect21. Results for
categorical outcomes are reported as probability differences22.
20 These models include controls for various mental health measures collected during the initial assessment centre,
family history of mental illness, month that the follow-up assessment centre was completed and a range of
demographic background factors. 21 We argue that an effect size of 0.1 would be substantively very small in this context. For instance, say that a
person who left teaching scored an effect size 0.1 lower on the depression scale than those who remained in the
profession: this would mean that there is only around a 52.8% chance that a person picked at random from those
who have continued to be teachers will have a higher score on the depression scale than a person picked at random
from the group who quit teaching for another job. In other words, the probability of suffering depression amongst
members of these two groups would be little more than equal. 22 In Jerrim et al. (2020c) results for categorical outcomes are reported as odds ratios. We convert this into a
probability difference using the formula Pt = (OR * Pc) / (1+ (OR*Pc) – Pc), where Pt = Probability for the
‘treatment’ group, Pc = probability of the outcome for the control group and OR = the estimated odds ratio reported
by Jerrim et al. (2020c).

81
8.2 Results for those who had left teaching before the initial 2006-2010 assessment
centre
The results focusing upon measures collected at the initial assessment centre can be found in
Table 8.2. Starting with anxiety/depression, there is some limited evidence that former teachers
have better outcomes on these measures than current teachers. Those individuals who left
teaching within the last five years did score slightly lower on the self-reported depression scale
than their peers who were still working as teachers (effect size difference of 0.10), though they
were no less likely to report taking prescription medicines for common mental health problems
(4% in both groups). Those who had left teaching within the last five years also scored slightly
lower, on average, on the neuroticism scale (effect size 0.13). These differences are, however,
quite modest in terms of magnitude. Differences are similar (or slightly smaller) when
comparing current teachers to those who left the profession more than five years ago. Evidence
of a link between teaching and these outcomes is hence mixed.
Table 8.2 The association between leaving/remaining in the teaching profession and
mental health outcomes measured in the 2006-2010 Biobank assessment centre
Current
teachers
Left
teaching last
5 years
Left
teaching 6 -
10 years
ago
Left
teaching >
10 years
ago
Depression/anxiety
Self-reported depression (ES) 0.00 -0.10 -0.08 0.00
Prescribed medicines 4% 4% 4% 3%
Self-reported medical condition 6% 7% 6% 7%
Neuroticism (ES) 0.00 -0.13 -0.11 -0.08
Sleep
Hours sleep per night (ES) 0.00 0.08 0.01 0.04
Often have trouble falling sleep 26% 24% 23% 24%
Alcohol
Drink daily 20% 23% 22% 23%
Number alcohol units per week 0.00 0.06 -0.22 0.09
Happiness
Very/extremely happy with work 47% 56% 50% 49%
Very/extremely with finances 47% 45% 45% 46%
Very/extremely with friends 68% 64% 68% 66%
Very/extremely with family 68% 65% 65% 67%
Very/extremely with health 43% 42% 40% 48%
Very/extremely happy overall 45% 45% 44% 46%
Notes: Those individuals who were currently teachers at the time of the assessment centre are the reference group.
‘ES’ refers to estimated effect size for continuous outcomes. Continuous measures reported as effect sizes, apart
from number of units of alcohol (which is kept in its original metric - number of units). Source = authors’ analysis
of the UK Biobank dataset.
82
The next set of estimates turns to the issue of sleep. There is little evidence of a difference
between current and former teachers in terms of the amount of sleep they get over a typical 24-
hour period; differences when expressed as an effect size are all below 0.10. Similarly,
individuals who left teaching were slightly less likely to say that they had trouble falling asleep
than the reference group (current teachers). However, the effect size is again small, with around
a quarter of individuals having difficulties sleeping across the four groups. Any benefits from
quitting teaching for one’s quality and quantity of sleep are hence likely to be small (if at all).
The third set of outcomes presented in Table 8.2 refers to the consumption of alcohol. Former
teachers are found to drink slightly more regularly than current teachers, though the difference
is again relatively modest in magnitude (e.g. around 22-23% of former teachers drink daily,
compared to 20% of current teachers). Furthermore, no difference is found between groups in
terms of number of units of alcohol consumed each week. This suggests that former teachers
drink roughly the same amount as individuals who have remained in teaching.
Finally, the last set of estimates presented in Table 8.2 refers to self-reported happiness with
different aspects of life. A similar pattern again emerges. The percentage who are happy are
broadly similar when comparing current to former teachers, with no clear or obvious pattern.
This holds true across most of the five specific areas of life teachers were asked about (e.g.
finances, friends, family and health) as well as happiness in life overall. The one exception,
where there is a sizeable difference, is happiness at work. Those who quit teaching recently –
within the last five years – are happier in their jobs than those who have remained in the
profession (56% of those who quit teaching in the last five years report being very or extremely
happy at work, compared to 47% of current teachers). Yet our overall interpretation of the
results presented in Table 8.2 is that individuals who choose to leave teaching do not generally
have better mental health outcomes than those continue working in this career.
8.3 Results for individuals who joined or left teaching between the initial and follow-up
assessment centres
Table 8.3 replicates the analysis presented in the subsection above, but is now based upon the
longitudinal Biobank data, focusing upon those who attended the assessment centre twice. The
average amount of time elapsed between the two assessment centre time points within the
sample we use within our analysis is around seven years, with an average age of 58 at follow-
up. Recall that this allows us to measure change in outcomes over time, and how these relate
to whether individuals moved out, into or remained in the teaching profession. There are

83
perhaps two key points of note (over and above our discussion of the results presented in Table
8.2).
Table 8.3 The association between leaving/remaining in the teaching profession with
outcomes measured in the follow-up Biobank assessment centre
Current
teachers
Left
teaching
Joined
teaching
Depression / anxiety
Self-reported depression (ES) 0.00 -0.07 0.13
Prescribed medicines 5.3% 2.5% 4.4%
Self-reported medical condition 11% 9% 13%
Sleep
Hours sleep per night (ES) 0.00 0.04 -0.04
Trouble falling sleep 31% 29% 25%
Alcohol
Daily drinking 14% 14% 11%
Number units of alcohol per week 0.00 -1.6 -2.3
Happiness
Very/extremely happy with work 52% 61% 53%
Very/extremely with finances 58% 53% 50%
Very/extremely with friends 71% 67% 68%
Very/extremely with family 71% 74% 71%
Very/extremely with health 55% 52% 50%
Very/extremely happy overall 52% 52% 47%
Notes: Those individuals who were teachers at both baseline (initial assessment centre) and follow-up (follow-up
assessment centre) are the reference group. ‘ES’ refers to estimated effect size for continuous outcomes. Source
= authors’ analysis of the UK Biobank dataset.
First, there is some suggestion that individuals who leave teaching report slightly lower levels
of anxiety and depression than those who have remained in the teaching profession. Former
teachers score 0.07 standard deviations lower on the self-reported depression scale, while also
being somewhat less likely to report taking prescription medicines for common mental health
problems (5.3% versus 2.5%) or reported suffering from depression/anxiety as a medical
condition (11% versus 9%). Interestingly, those who entered the teaching profession since the
baseline assessment centre scored slightly higher on the self-reported depression scale than
individuals who were working as teachers at both time points (effect size 0.13) and those who
had left teaching for another career (effect size 0.20). Nevertheless, the key message from Table
8.3 is that leaving teaching to pursue another career may only bring small benefits for one’s
mental health (if any at all).
Second, the final set of estimates in Table 8.3 (capturing self-reported happiness) potentially
helps strengthen the evidence that those individuals who leave teaching have higher levels of

84
job satisfaction than those who continue to work as a teacher as their career. In particular, those
who left teaching for other employment reported higher levels of satisfaction with their work
than those who stayed in teaching (61% who left teaching between assessment centres were
very happy in their work compared to 52% who remained in teaching). Yet this result is specific
to the work domain; there is no evidence that those who quit teaching were happier with their
health, friendships, family, health or, indeed, with life in general.
The final point to note from Table 8.3 is that the results with respect to sleep and alcohol
consumption are largely the same as Table 8.2. In other words, there is little evidence that
working as a teacher has an impact upon difficulties with sleeping and alcohol consumption.
8.4 Summary
Looking across an array of outcomes, and using several different empirical approaches, we
have found little evidence of a link between leaving teaching, lower prevalence of mental health
problems and higher levels of general wellbeing. Throughout our analysis, effect sizes have
been small and often changed in both magnitude and direction depending upon the empirical
approach taken. The one exception is happiness with work (job satisfaction), where we find a
fairly consistent improvement for those who have recently left the teaching profession.
Consistent with Bamford and Worth (2017), there is some suggestion that those who decide to
quit teaching end up being somewhat happier in their work than those who choose to remain.
Yet, critically, this does not seem to translate into greater levels of happiness in other areas of
life, including satisfaction with health or happiness overall. Consequently, the benefits of
leaving teaching for one’s happiness seem to be relatively minor, and concentrated in
satisfaction with work.
Two observations are important in interpreting this finding. First, this is consistent with
empirical research into a range of occupations, which finds that job satisfaction tends to fall in
the period prior to an individual quitting a job, before rising during the early stages of their new
employment (Chadi & Hetschko, 2018; Gielen, 2013; Longhi et al., 2019). Second, we do not
observe reductions in job satisfaction for those joining the teaching profession. Taken together,
this suggests that the increase in job satisfaction for those leaving teaching is not indicative of
any particular problem with teaching. Rather, it is more likely to reflect a natural process by
which those who are less suited to the job move into alternative occupations (Gielen, 2013).
What do these findings imply for policy and practice? At a time when many teachers are
thinking about leaving for another career, it is vital that they are fully informed about the likely

85
consequences. For those teachers who are not satisfied with their work, changing jobs may lead
to an increase in job satisfaction. However, our results suggest that quitting teaching for
alternative employment is unlikely to lead to improvements in general wellbeing or mental
health.

86
Chapter 9 New evidence on teachers’ hours of work
9.1 Introduction
As noted in Chapter 1, teacher workload has become a topic of intense policy interest in recent
times. This is partly due to research with in-service and former teachers which has concluded
that workload − in particular the overly bureaucratic requirements for planning, marking and
data entry − are driving teachers out of the profession (Gibson, Oliver & Dension, 2015; DfE,
2018). There is also a widely held belief that the long working hours of teachers – and
particularly the time they spend upon particularly undesirable tasks such as marking and
administration – have an impact upon teachers’ wellbeing and mental health.
The Department for Education in England has therefore ‘committed to collecting robust
evidence on teacher workload at least every 2 years’ (Department for Education, 2019a). Thus
far, this has consisted of the 2016 and 2019 Teacher Workload Surveys and the 2018 Teaching
and Learning International Survey (TALIS). Unfortunately, these data have a number of
limitations. First, response rates tend to be very low. For instance, the total final response rate
to the 2016 workload survey was less than 10%23. Second, all information is self-reported and
relies upon teachers recalling and accurately reporting information on weekly hours spent upon
different tasks (e.g. questions such as ‘how many hours did you spend marking during your
most recent full working week?’). Third, no attempt has been made to capture how many hours
teachers work during school holidays, with questions typically focusing upon usual working
hours during school term time. Fourth, most questions focus only upon teachers’ working hours
in their main job. Yet teachers can earn money elsewhere, such as being private tutors,
examiners or creating teaching resources. Fifth, and crucially, there is currently limited
evidence as to how teachers’ working hours have changed over time, since the low response
rates and changing methodology in government surveys limit the extent to which valid
comparison can be drawn (Deakin et al., 2010).
This chapter therefore aims to plug the gap in the existing evidence base with respect to
teachers’ hours of work. We then build on this work in the chapter that follows, where we
consider how teachers’ working hours are linked to their wellbeing and mental health.
23 The technical report to the 2016 workload survey notes that the school response rate was 24%. The teacher
response rate within participating schools was then 34%. Multiplying these two figures together gives an overall
response rate of 8%.
87
9.2 Data
This chapter draws upon four data sources. The first is the TALIS data from 2013 (which covers
Key Stage 3 teachers only) and 2018 (which covers Key Stage 1/2 and Key Stage 3 teachers).
This is an international survey, allowing us to compare working hours of teachers in England
to other countries. In both years, the survey was conducted in England between March and
May. As part of the TALIS study, teachers were asked to report their total weekly working
hours for the most recent complete school week, and also to provide a breakdown between
various different tasks (e.g. planning/preparation, marking, administration, teaching).
The second data source is the Labour Force Survey (LFS). This survey asks respondents to
provide an estimate of their total working hours (including any paid or unpaid overtime) during
a recent ‘reference week’ (this is typically the week before the LFS survey is conducted). Full
details about how total working hours have been derived using the LFS is available in Allen et
al (2019). The LFS also includes a number of auxiliary questions of interest, including whether
respondents ever work in the evenings or at weekends. Teachers are defined in the LFS as those
working as either primary or secondary teachers or as headteachers (unless stated otherwise).
Third we draw upon the UK Time Use Surveys, conducted in 2000/2001 and 2014/2015, with
respondents required to complete time-diaries on two different days within a given week (one
weekday and one day at the weekend). These diaries divided the day into a series of ten-minute
slots. Within each slot respondents were asked what their main activity was (e.g. eating
breakfast) and if they were doing anything else at the same time (e.g. checking work emails).
This can in turn be used to identify, for teachers, when exactly during the day that they work
(and for how long in total). The key limitation with the UK TUDs for our purpose is the small
sample size; there were only around 90 full-time teachers with information available in
2000/2001, with a similar number in 2014/2015. Teachers include all primary, secondary and
headteachers in this resource.
Finally, information is also drawn from the mobile-phone-based survey app Teacher Tapp. In
one week in November 2018, panellists (a self-selecting group of primary, secondary and
headteachers) were asked to report their working hours for seven consecutive days. Then, at
the end of the week, they were asked to report their total working hours over the previous seven
days. In total, 854 Teacher Tapp users responded to all these questions. In addition, the Teacher
Tapp data includes an array of information about very specific aspects of teachers’ jobs that
most other large-scale survey data does not, such as the activities teachers work on during
school holidays.

88
9.3 Trends in total working hours of teachers since 1992
Figure 9.1 begins by presenting long-run trends in full-time teachers’ average working hours
(1992 – 2018). Overall, average working hours of secondary teachers has remained broadly
stable over this period. Average working hours typically sits between 46 and 48 hours per
week; it only occasionally dips above or below this level. The most notable peak in the average
working hours of secondary teachers occurred in 2001, when it reached 49 hours per week. The
trough, meanwhile, occurred in 2006 and 2010 when the average was just over 46 hours per
week. Nevertheless, the secondary school average has generally remained quite stable
(typically within a two-to-three-hour range) over this 25-year period, with little to suggest that
the working hours of secondary teachers at the time of writing are outside of their historical
norm.
Figure 9.1 Trends in the average working hours of teachers between 1992 and 2018
Notes: Graph presents the estimated average total working hours of full-time teachers in England (LFS variable
TOTHRS). A break in the series has been indicated in 2010 with a dashed line. Prior to 2010, headteachers were
included in the definition of primary/secondary teachers within the SOC codes. This changed in 2010, with
headteachers separated into a unique category. Source = Quarterly Labour Force Survey.
A broadly similar result holds for primary teachers, although perhaps with slightly more
pronounced peaks and troughs. The longest reported average working hours, of 50 hours per
week, occurred around 2002, although the period between 2013 and 2017 was just shy of this
level (around 49 hours per week). In contrast, the lowest point(s) for primary teachers’ average
hours was in 1992 (46 hours per week) and around 2010 (approximately 47 hours per week).
30
35
40
45
50
55
1992 1994 1996 1998 2000 2002 2004 2006 2008 2010 2012 2014 2016 2018
Average hours per
week
Primary
Secondary
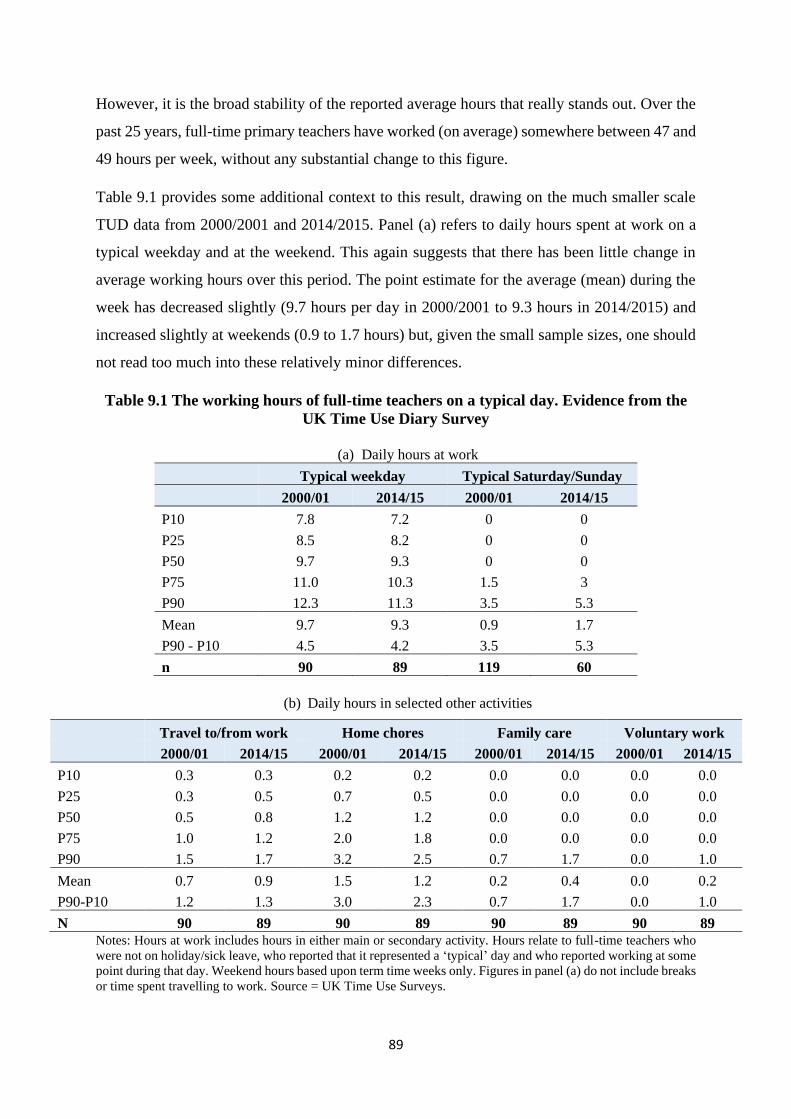
89
However, it is the broad stability of the reported average hours that really stands out. Over the
past 25 years, full-time primary teachers have worked (on average) somewhere between 47 and
49 hours per week, without any substantial change to this figure.
Table 9.1 provides some additional context to this result, drawing on the much smaller scale
TUD data from 2000/2001 and 2014/2015. Panel (a) refers to daily hours spent at work on a
typical weekday and at the weekend. This again suggests that there has been little change in
average working hours over this period. The point estimate for the average (mean) during the
week has decreased slightly (9.7 hours per day in 2000/2001 to 9.3 hours in 2014/2015) and
increased slightly at weekends (0.9 to 1.7 hours) but, given the small sample sizes, one should
not read too much into these relatively minor differences.
Table 9.1 The working hours of full-time teachers on a typical day. Evidence from the
UK Time Use Diary Survey
(a) Daily hours at work
Typical weekday Typical Saturday/Sunday
2000/01 2014/15 2000/01 2014/15
P10 7.8 7.2 0 0
P25 8.5 8.2 0 0
P50 9.7 9.3 0 0
P75 11.0 10.3 1.5 3
P90 12.3 11.3 3.5 5.3
Mean 9.7 9.3 0.9 1.7
P90 - P10 4.5 4.2 3.5 5.3
n 90 89 119 60
(b) Daily hours in selected other activities
Travel to/from work Home chores Family care Voluntary work
2000/01 2014/15 2000/01 2014/15 2000/01 2014/15 2000/01 2014/15
P10 0.3 0.3 0.2 0.2 0.0 0.0 0.0 0.0
P25 0.3 0.5 0.7 0.5 0.0 0.0 0.0 0.0
P50 0.5 0.8 1.2 1.2 0.0 0.0 0.0 0.0
P75 1.0 1.2 2.0 1.8 0.0 0.0 0.0 0.0
P90 1.5 1.7 3.2 2.5 0.7 1.7 0.0 1.0
Mean 0.7 0.9 1.5 1.2 0.2 0.4 0.0 0.2
P90-P10 1.2 1.3 3.0 2.3 0.7 1.7 0.0 1.0
N 90 89 90 89 90 89 90 89
Notes: Hours at work includes hours in either main or secondary activity. Hours relate to full-time teachers who
were not on holiday/sick leave, who reported that it represented a ‘typical’ day and who reported working at some
point during that day. Weekend hours based upon term time weeks only. Figures in panel (a) do not include breaks
or time spent travelling to work. Source = UK Time Use Surveys.

90
Panel (b) provides further details on other types of work (e.g. commuting time, family
responsibilities) that may also put time pressure upon teachers’ lives. Again, these results seem
to reveal little change over time. The average time teachers spend upon travelling to work,
home chores, family care and voluntary work in 2014/2015 is similar to in 2000/2001 (values
have typically moved ten to 15 minutes in either direction). These differences are not large or
statistically significant and hence provide further evidence of a broadly stable picture over time.
9.4 Trends in time devoted to different tasks. 2013 to 2018
Using the TALIS 2013 and 2018 datasets for England, we can also explore the average time
that lower secondary teachers spend upon different tasks. Although data are only available over
a short five-year time horizon, and relate only to lower-secondary teachers, it is important that
we document whether any change has emerged in specific areas e.g. marking, planning,
administration.
Table 9.2 Change in the average amount of time full-time lower-secondary teachers in
England spend upon different tasks between 2013 and 2018
2013 2018
Teaching 20.3 20.5
Planning /preparation 8.0 7.5
Teamworking 3.5 3.2
Marking 6.3 6.3
Pupil guidance/discipline 1.8 2.7
Management 2.4 2.3
Administration 4.2 4.0
Talking to parents 1.6 1.6
Extracurricular activities 2.2 1.7
Other 2.4 3.4
Total non-teaching tasks 32.5 32.7
Ratio teaching:non-teaching 0.62 0.63
Notes: Source: TALIS 2013 and 2018 databases. Figures refer to average working hours per week during term
time.
Table 9.2 suggests that the working hours of lower-secondary teachers remained stable between
2013 and 2018. Average hours spent teaching (20.3 versus 20.5 hours) and time spent upon
non-teaching tasks (32.5 versus 32.7 hours) were virtually unchanged. Critically, there was
little sign of any substantial reduction in marking (6.3 hours per week in both 2013 and 2018)
and administration (4.2 hours in 2013 and 4.0 hours in 2018). Moreover, any minor reductions
observed for lesson planning/preparation and extracurricular activities (both half an hour lower

91
per week in 2018 than in 2013) has been offset by increases in pupil guidance/discipline and
‘other’ (undefined) tasks.
9.5 Variation during the academic year and working during holidays
The amount that teachers work per week could vary substantially over the academic year.
Figure 9.2 provides, to our knowledge, the first evidence on this issue for England based upon
the Labour Force Survey.
Figure 9.2 Variation in teachers’ working hours over the year
Notes: Figures refer to full-time teachers who were not proxy respondents, not on parental leave, not on a training
course, not sick or injured during the survey week, had not changed their job, were not affected by poor weather
or labour dispute during the survey week. Includes primary, secondary, SEN and headteachers. Sample also
restricted to those teachers who reported not working abnormal hours due to being on leave/holiday and who
worked for at least 20 hours in the reference week. Major school holiday weeks have been excluded. Source =
Quarterly Labour Force Survey pooled between winter 1996 and winter 2018.
Interestingly, differences in average working hours of full-time teachers over the academic year
do not seem to be particularly large. Indeed, within Figure 9.2 there is no particular period
where they are notably above or below the average. Nevertheless, a couple of interesting
features do stand out. First, the average starts at a comparatively high point during the autumn
term (≈49 hours per week) before dipping to a low of ≈48 hours per week in the half-term
following the Christmas break. Average working hours then increase steadily to reach almost
50 hours per week at the start of the second summer half-term (coincides with the timing of
end-of-year testing and national examinations in England). However, we again stress the
broadly stable nature of teachers’ self-reported working hours, keeping within a two-hour range
throughout the academic year. The second feature of note from Figure 9.2 is that working hours
35
40
45
50
55
1 3 5 7 9 11 13 15 17 19 21 23 25 27 29 31 33 35 37 39 41 43 45 47 49 51
Hours
Week #
Summer term 2
Summer term 1
Spring term 2
Spring term 1
Autumn term 2
Autumn term 1
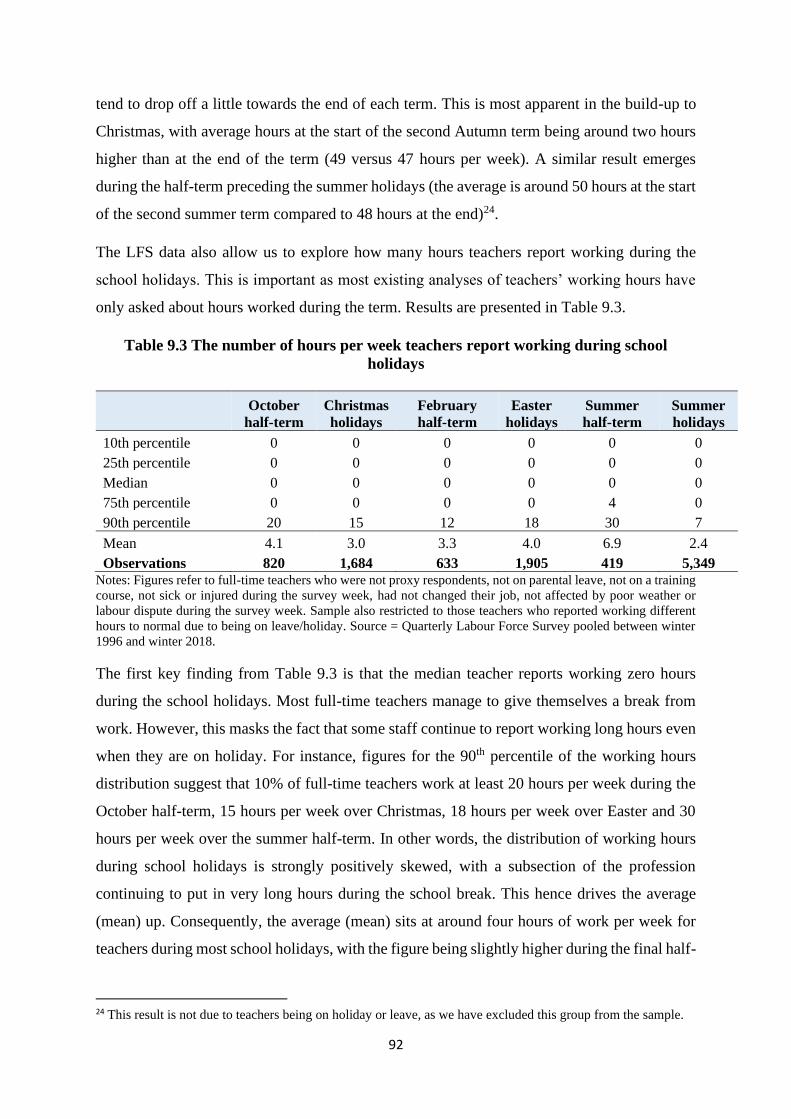
92
tend to drop off a little towards the end of each term. This is most apparent in the build-up to
Christmas, with average hours at the start of the second Autumn term being around two hours
higher than at the end of the term (49 versus 47 hours per week). A similar result emerges
during the half-term preceding the summer holidays (the average is around 50 hours at the start
of the second summer term compared to 48 hours at the end)24.
The LFS data also allow us to explore how many hours teachers report working during the
school holidays. This is important as most existing analyses of teachers’ working hours have
only asked about hours worked during the term. Results are presented in Table 9.3.
Table 9.3 The number of hours per week teachers report working during school
holidays
October
half-term
Christmas
holidays
February
half-term
Easter
holidays
Summer
half-term
Summer
holidays
10th percentile 0 0 0 0 0 0
25th percentile 0 0 0 0 0 0
Median 0 0 0 0 0 0
75th percentile 0 0 0 0 4 0
90th percentile 20 15 12 18 30 7
Mean 4.1 3.0 3.3 4.0 6.9 2.4
Observations 820 1,684 633 1,905 419 5,349 Notes: Figures refer to full-time teachers who were not proxy respondents, not on parental leave, not on a training
course, not sick or injured during the survey week, had not changed their job, not affected by poor weather or
labour dispute during the survey week. Sample also restricted to those teachers who reported working different
hours to normal due to being on leave/holiday. Source = Quarterly Labour Force Survey pooled between winter
1996 and winter 2018.
The first key finding from Table 9.3 is that the median teacher reports working zero hours
during the school holidays. Most full-time teachers manage to give themselves a break from
work. However, this masks the fact that some staff continue to report working long hours even
when they are on holiday. For instance, figures for the 90th percentile of the working hours
distribution suggest that 10% of full-time teachers work at least 20 hours per week during the
October half-term, 15 hours per week over Christmas, 18 hours per week over Easter and 30
hours per week over the summer half-term. In other words, the distribution of working hours
during school holidays is strongly positively skewed, with a subsection of the profession
continuing to put in very long hours during the school break. This hence drives the average
(mean) up. Consequently, the average (mean) sits at around four hours of work per week for
teachers during most school holidays, with the figure being slightly higher during the final half-
24 This result is not due to teachers being on holiday or leave, as we have excluded this group from the sample.

93
term of the academic year (≈7 hours per week) and lower during the summer (≈2.5 hours per
week).
However, responses to Teacher Tapp questions paint a rather different picture. During a single
(summer) half-term holiday, this panel of teachers were asked about the type of work-related
activities they had completed. Around six in ten said that they read something relevant to their
job, six in ten reported planning curriculum or lessons, one third reported marking students
work, 9% said they ran an exam revision session for students and 4% reported attending a
work-related workshop or course. Consequently, the current available evidence on teachers’
working hours during school holidays is somewhat contradictory.
9.6 Working in the evening and weekends
Of course, teachers may also work unsociable hours during term time, including in the evenings
and at weekends. Again, little is currently known about this issue. Hence Figure 9.3 draws upon
data from the LFS which, since 2005, has asked respondents whether they ‘usually’ work in
the evening, at nights and during the weekend. Our interpretation of this question – particularly
the term ‘usually’ – is that teachers report working at such times more often than not.
Figure 9.3 The proportion of teachers who report that it is ‘usual’ for them to work in
the evening, at night and at weekends
Notes: Graph presents the percentage of teachers who say that they usually work in the evening, at weekends and
at night. Source = Quarterly Labour Force Survey. The sample is comprised of full-time primary teachers,
secondary teachers, SEN teachers and headteachers. In additional analysis we have experimented with repeating
the analysis for primary and secondary teachers separately and obtained similar results.
0%
10%
20%
30%
40%
50%
2005 2007 2009 2011 2013 2015 2017
% of teachers
Evening
Weekend
Night

94
Around 40% of teachers indicate that they usually work in the evening, with around 7%
suggesting that they frequently work at night25. This helps to illustrate how a substantial
proportion of teachers in England take their work home with them and continue to put in extra
hours long after the school gates have shut. Similarly, around one in ten teachers indicate that
they usually work at the weekend. Moreover, consistent with evidence presented in previous
subsections, there is no clear evidence of change in the proportion of teachers working
weekend/evening/night over time.
Figure 9.4 provides further detail on this issue, drawing upon the 2000/2001 and 2014/2015
TUDs. This provides the percentage of teachers who said they were working (as either their
primary or secondary activity) over a 24-hour period during a usual working day. This thus
helps one to visualise a ‘typical’ working day for a schoolteacher in England. It can be broadly
described as follows.
Figure 9.4 The proportion of teachers working at different times in the school day
Notes: Source = 2000/01 (black solid lines) and 2014/15 (grey dashed lines) UK Time Use Diaries. Data based
upon 89 observations in 2000/01 and 90 observations in 2014/15. Figures refer to refer to full-time teachers who
were not on holiday/sick leave, who reported that it represented a ‘typical’ day and who reported working at some
point during that day. Time spent travelling to work and breaks not included.
25 Participants were asked: ‘within your regular pattern of work is it usual for you to work (a) during the day; (b)
during the evening; (c) at night’ – selecting all that apply.
0%
20%
40%
60%
80%
100%
0400
0600
0800
1000
1200
1400
1600
1800
2000
2200
0000
0200
2014/15
2000/01
95
The average full-time teacher will have arrived at school and started work by around 0800
(with almost all teachers having started by 0830). The vast majority will then work through
until at least midday without a break. A dip in the series presented in Figure 9.4 can then be
observed between 1200 and 1330, when some teachers are able to take a break from work.
Note, however, that this dip in the percentage of teachers who say they are working is relatively
modest. This, in turn, implies that many teachers are likely to be working during their lunch
break and only taking short amounts of time to completely switch off. Almost all teachers then
work between 1330 and 1530, after which a number start to finish for the day. Most teachers
then leave school somewhere between 1530 and 1730, with almost everyone having left by
1800. However, for a significant minority of teachers, their work is not yet done for the day.
Another spike in the proportion of teachers who report spending time working emerges
between 1900 and 2100, with around one in five saying that they are working at any given 15-
minute timeslot during this period. By around 2230, almost all teachers have finished for the
day, with the first teachers starting to return the next day around 0700.
The other notable feature of Figure 9.4 is that it suggests there has been little change to the
pattern of teachers’ working hours over time. Although sample sizes are small, estimates from
the 2000/01 and 2014/15 TUDs are quite similar, with there being no obvious change over this
15-year period.
Teacher Tapp responses help us understand the nature of teachers’ lunchtime. Lunch breaks
are often short. For 8% of teachers they are less than 30 minutes long, while for 29% they are
30-44 minutes. A minority has a lunch break of one hour or longer. This is consistent with
other recent research, which has found break times at schools are getting shorter (Baines &
Blatchford, 2019). Around one in eight teachers run a lunchtime club all year round (with many
more running one for part of the year). During their lunchbreak, teachers do the things we might
expect (e.g. eating, visiting bathroom, talking to colleagues) but also work-related activities
(68% read emails, 40% create resources, 55% tidy their classroom). This role of the lunch break
as a rare time without a class to teach emphasises how different it is to lunch breaks in many
other professions. In particular, it does not allow time for teachers to switch off, with many
continuing to work in some form.
Responses from Teacher Tapp questions also highlight how hard it is for teachers to measure
their typical after-school activities. Whilst one in five run an after-school club all year round,
96
a greater proportion say they do so but for only part of the year. For one week in May 2018,
just 5% said that they had no after-school meetings or activities that week. The proportions
staying late once, twice, three times, four times and five times in the week were 20%, 37%,
23%, 10% and 6%, respectively. Once at home, on a particular night in April 2018, 39% of
teachers said they planned or marked whilst the television was on.
9.7 Summary and conclusions
Teachers in England work long hours. Representative survey data suggest that the median
teacher works a 50-hour week, with Time Use diary data showing that they put in just under
ten hours on a typical weekday. A quarter of teachers work more than 59 hours a week, putting
in 10.7 hours on the average weekday. Remarkably, one in ten teachers works more than 65
hours per week. Around 40% of teachers report that they ‘usually’ work in the evening, 10%
at the weekend and 7% at night. Working hours for teachers in England are higher than almost
all other countries for which comparisons can be made and are eight hours (one working day)
per week longer than the OECD average. The finding that teachers work long hours in England
is consistent with prior research. However, it is notable that all of our estimates of total hours
are lower than those from both the 2013 (55.7-59.3 hours per week) and the 2016 (53.5-55.5
hours per week) government workload surveys.
Although teachers work (on average) long hours, we find no evidence that it has increased in
recent years. Indeed, total working hours as measured in the Labour Force Survey have
remained relatively stable – between 46 and 48 hours per week – over the last 20 years.
Similarly, the proportion of teachers who report that they ‘usually’ work evenings and
weekends has also been broadly stable since 2005. There has also been very little change in the
number of hours teachers report spending on specific tasks between 2013 and 2018, with
teachers spending around eight hours per week on marking, six hours per week on planning
and four hours per week on administration in both years.
What, then, does this imply for education policy in England? Perhaps most importantly, our
findings show that five years of policy initiatives − implemented by three separate Secretaries
of State for Education − have so far proven insufficient for achieving a reduction in the total
number of hours worked by teachers. Reducing working hours to bring them into line with
international norms will therefore likely require additional, more radical action on the part of
policymakers. Indeed, our research reveals that working hours have been at the present high

97
levels for many years, which suggests perhaps that they will be more difficult to shift than
previously anticipated.
98
Chapter 10 The link between teacher workload and
wellbeing
10.1 Introduction
The preceding chapter illustrated how a quarter of teachers in England work more than 59 hours
per week (Allen et al., 2019). These long hours have been blamed for high levels of work-
related stress and declining levels of retention among teachers (Foster 2019), while
headteachers have suggested that this may be hindering the quality of instruction provided by
schools (Jerrim & Sims, 2019). Finding out more about the relationship between teacher
workload and wellbeing is hence an issue of great education policy interest, while also being a
topic of much debate amongst teachers and teaching unions.
The aim of this chapter is to provide new international evidence on this matter, tackling a
number of empirical challenges that have not been considered within the existing literature.
Using nationally representative data on more than 10,000 teachers from five English-speaking
jurisdictions (Australia, England, New Zealand, United States and Alberta, Canada) we
investigate how the time teachers spend upon a selection of different tasks is related to self-
reported work-related stress and workplace wellbeing. In contrast to existing work in this area,
we do not simply assume that there is a linear relationship between workload and wellbeing
(e.g. that each additional hour spent working has the same marginal impact upon teacher
wellbeing) but explicitly consider whether there is a particular point (or a particular amount of
time) where total working hours becomes ‘too much’.
10.2 Data and methodology
This chapter draws upon data from the 2018 round of the Teaching and Learning International
Study (TALIS). Across our five countries of interest, the total sample size is 11,123 full-time
teachers, including 1,318 Key Stage 1/2 and 1,631 Key Stage 3 teachers in England. Within
the TALIS survey, teachers were asked about their total hours of work and how this was split
between different tasks. Some descriptive information on how this compares across our
countries of interest can be found in Table 10.126.
26 To limit the impact of such outliers, we cap the top 5% of the distribution for each variable to the 95th percentile.
Moreover, any teacher that reported a working week exceeding 84 hours (the equivalent of 12-hour days for seven
days a week) has been excluded due to concerns over the reliability of the data they have provided.

99
Table 10.1 Average working hours spent on different workload tasks across countries
Country Total Teaching Planning Marking
Management
+ admin
Teamwork +
CPD Other
England - primary 54.3 24.0 7.1 5.8 5.4 4.5 5.8
England - secondary 51.8 20.1 7.2 6.1 5.5 3.9 7.2
Alberta, Canada 51.1 27.7 6.7 4.5 2.8 3.5 5.8
Australia - primary 50.1 24.4 7.4 3.1 4.5 4.7 5.9
USA 50.1 27.3 6.3 4.5 2.4 3.6 9.0
New Zealand 49.3 19.7 6.4 4.4 5.7 4.9 7.2
Australia - secondary 49.2 19.5 6.9 4.6 5.7 5.0 6.9 Note: Sum of each task does not equal the total, as information is drawn from different questions. Source = TALIS
2018 dataset.
Teachers were also asked a set of questions about the aspects of their job that cause them stress,
and the impact that they believe this has upon their health. Teachers’ responses to these
questions have then been converted into quasi-continuous scales by the OECD, which form the
outcome variables used within our analysis. The first is the ‘workplace wellbeing and stress’
scale, based upon teachers responses to questions such as ‘I experience stress in my work’ and
‘my job negatively impacts my mental health’. It is therefore a scale that has been designed to
capture teachers’ subjective views about the impact that their job has upon their wellbeing.
The second scale focuses upon work-related stress captured by a question asking teachers to
report how much various different tasks (e.g. marking, lesson preparation, administration)
cause them stress at work. Table 10.2 provides descriptive statistics for how responses to each
wellbeing question varies across our countries of interest.
Table 10.2 The distribution of teacher wellbeing measures across selected countries
Australia
- primary
Australia -
secondary
Alberta,
Canada
England -
primary
England -
secondary
New
Zealand USA
Workplace wellbeing
Experience stress 58% 59% 60% 66% 71% 61% 56%
Time for personal life 28% 33% 27% 23% 22% 30% 48%
Impacts mental health 26% 24% 25% 28% 35% 27% 16%
Impacts physical health 20% 21% 18% 22% 27% 21% 14%
Workload stress
Too much prep 40% 32% 32% 45% 40% 30% 30%
Too many lessons 30% 25% 26% 29% 40% 24% 22%
Too much marking 33% 45% 43% 54% 71% 51% 38%
Too much admin 50% 57% 31% 59% 66% 67% 32%
Extra duties 14% 24% 12% 21% 31% 23% 11% Note Figures refer to percentage of teachers who selected either ‘quite a bit’ or ‘a lot’. Source = TALIS 2018
dataset.
100
Using the TALIS data we begin by estimating an Ordinary Least Squares regression model to
examine the relationship between total working hours and teachers’ workload, stress and
workplace wellbeing27, with results reported in terms of effect sizes. We then re-estimate this
model but now using non-parametric regression28. This allows us to explore whether the
relationship between teacher workload and wellbeing is linear, or if there is a certain maximum
tolerable length of working week which, if exceeded, has a major negative impact upon
teachers’ lives. Then, rather than focusing upon total working hours, we turn our attention to
the time teachers spend upon six different tasks (teaching, lesson planning, marking,
management and administration, teamworking and professional development, and other) and
how this relates to their workload stress and wellbeing. This is done using the same regression
modelling approach (OLS and non-parametric) outlined above. See Jerrim and Sims (2020b)
for further details.
10.3 The link between total working hours, workplace wellbeing and workload stress
Table 10.3 begins by presenting OLS estimates of the relationship between teachers’ total
working hours and their wellbeing. Results are provided for the association with both the
workplace wellbeing and the workload stress scale. In all English-speaking jurisdictions, a
modest positive association is observed. For a ten-hour increase in total working hours (roughly
the difference between teachers’ total working hours in England and the OECD average),
workplace stress increases by around 0.15 standard deviations. This pattern is consistent across
countries, with few statistically significant cross-national differences in the estimated
workload−wellbeing relationship.
27 These regression models are estimated separately by country, and include controls for teachers’ demographic
background and qualifications, their motivations for joining the teaching profession and school fixed effects. See
Jerrim and Sims (2020b) for further details. 28 The school fixed effects are not included in the non-parametric regression models. Final teacher weights are
also not applied.
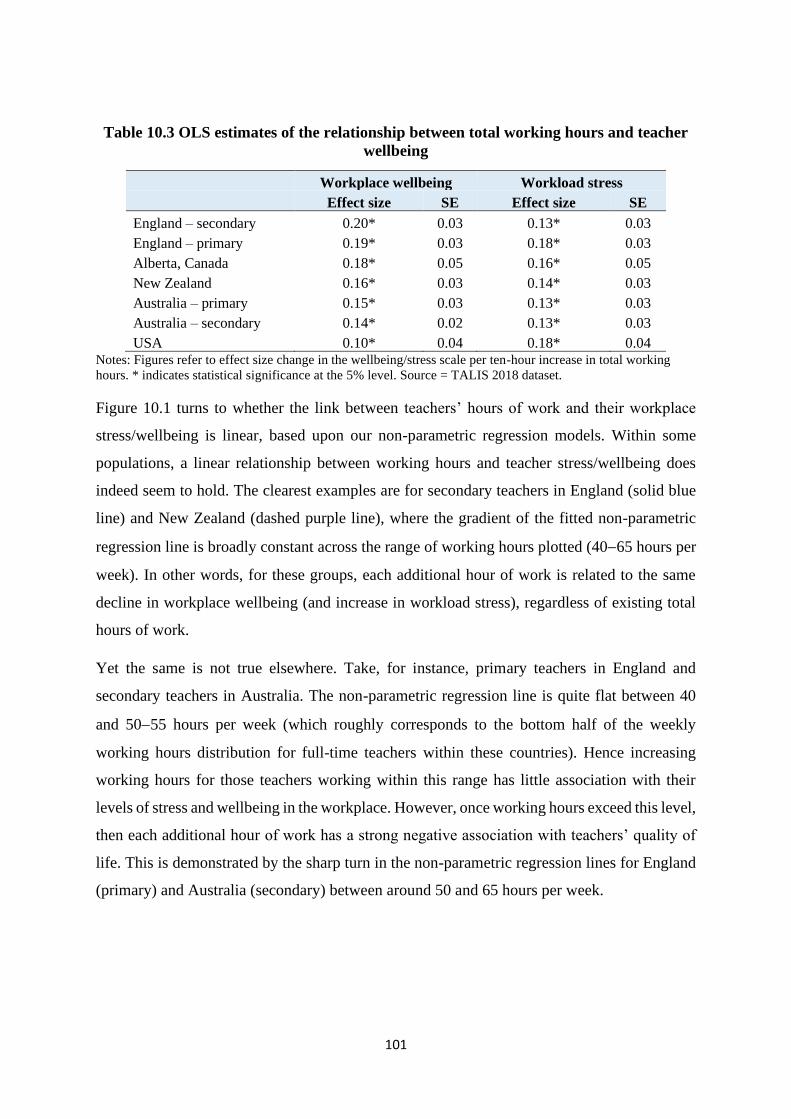
101
Table 10.3 OLS estimates of the relationship between total working hours and teacher
wellbeing
Workplace wellbeing Workload stress
Effect size SE Effect size SE
England – secondary 0.20* 0.03 0.13* 0.03
England – primary 0.19* 0.03 0.18* 0.03
Alberta, Canada 0.18* 0.05 0.16* 0.05
New Zealand 0.16* 0.03 0.14* 0.03
Australia – primary 0.15* 0.03 0.13* 0.03
Australia – secondary 0.14* 0.02 0.13* 0.03
USA 0.10* 0.04 0.18* 0.04 Notes: Figures refer to effect size change in the wellbeing/stress scale per ten-hour increase in total working
hours. * indicates statistical significance at the 5% level. Source = TALIS 2018 dataset.
Figure 10.1 turns to whether the link between teachers’ hours of work and their workplace
stress/wellbeing is linear, based upon our non-parametric regression models. Within some
populations, a linear relationship between working hours and teacher stress/wellbeing does
indeed seem to hold. The clearest examples are for secondary teachers in England (solid blue
line) and New Zealand (dashed purple line), where the gradient of the fitted non-parametric
regression line is broadly constant across the range of working hours plotted (40−65 hours per
week). In other words, for these groups, each additional hour of work is related to the same
decline in workplace wellbeing (and increase in workload stress), regardless of existing total
hours of work.
Yet the same is not true elsewhere. Take, for instance, primary teachers in England and
secondary teachers in Australia. The non-parametric regression line is quite flat between 40
and 50−55 hours per week (which roughly corresponds to the bottom half of the weekly
working hours distribution for full-time teachers within these countries). Hence increasing
working hours for those teachers working within this range has little association with their
levels of stress and wellbeing in the workplace. However, once working hours exceed this level,
then each additional hour of work has a strong negative association with teachers’ quality of
life. This is demonstrated by the sharp turn in the non-parametric regression lines for England
(primary) and Australia (secondary) between around 50 and 65 hours per week.

102
Figure 10.1 Non-parametric regression estimates of the association between total working hours and workplace wellbeing and stress
Workplace wellbeing Workload stress
Notes: Weights not applied. Models exclude the school fixed effects. Results shown for teachers working between 40 and 65 hours per week (approximately the 10th and 90th percentile of the
working hours distribution). Results based upon a female teacher, with number of years’ teaching experience set to the national average, who holds an ISCED Level 6 (postgraduate) qualification,
whose motivations for entering teaching were similar to the national average, but for whom teaching was not their first-choice career. Source = TALIS 2018 dataset.
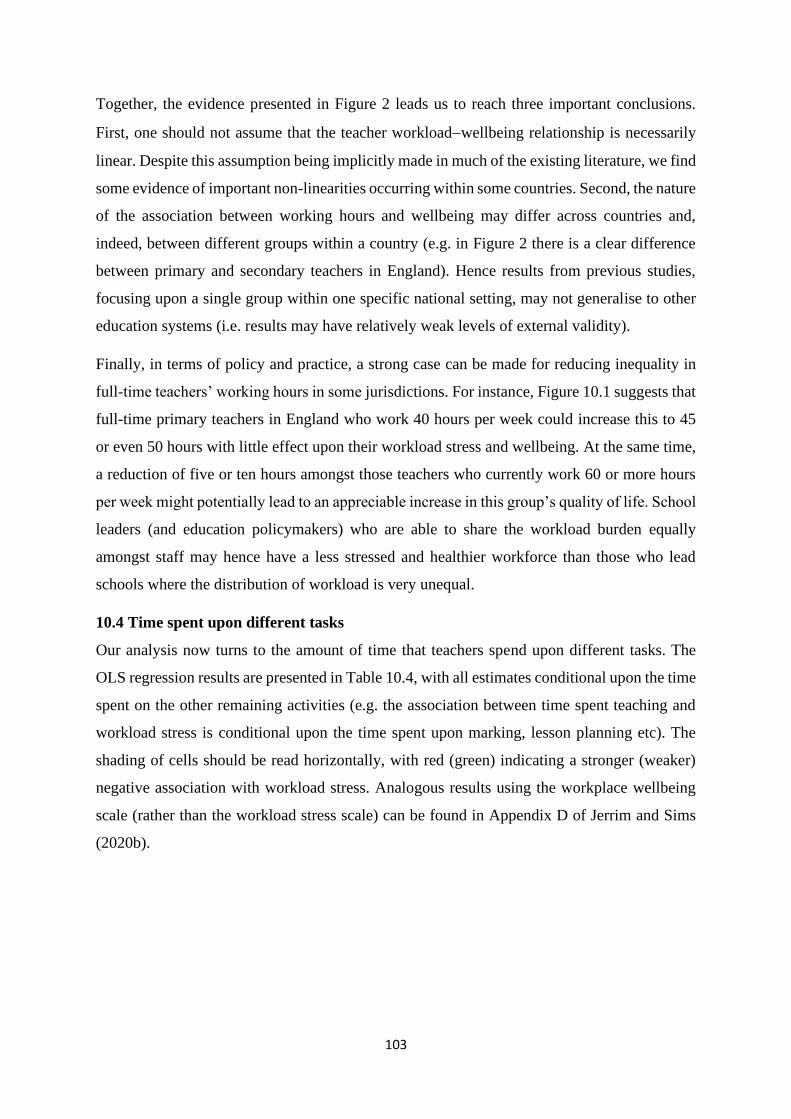
103
Together, the evidence presented in Figure 2 leads us to reach three important conclusions.
First, one should not assume that the teacher workload−wellbeing relationship is necessarily
linear. Despite this assumption being implicitly made in much of the existing literature, we find
some evidence of important non-linearities occurring within some countries. Second, the nature
of the association between working hours and wellbeing may differ across countries and,
indeed, between different groups within a country (e.g. in Figure 2 there is a clear difference
between primary and secondary teachers in England). Hence results from previous studies,
focusing upon a single group within one specific national setting, may not generalise to other
education systems (i.e. results may have relatively weak levels of external validity).
Finally, in terms of policy and practice, a strong case can be made for reducing inequality in
full-time teachers’ working hours in some jurisdictions. For instance, Figure 10.1 suggests that
full-time primary teachers in England who work 40 hours per week could increase this to 45
or even 50 hours with little effect upon their workload stress and wellbeing. At the same time,
a reduction of five or ten hours amongst those teachers who currently work 60 or more hours
per week might potentially lead to an appreciable increase in this group’s quality of life. School
leaders (and education policymakers) who are able to share the workload burden equally
amongst staff may hence have a less stressed and healthier workforce than those who lead
schools where the distribution of workload is very unequal.
10.4 Time spent upon different tasks
Our analysis now turns to the amount of time that teachers spend upon different tasks. The
OLS regression results are presented in Table 10.4, with all estimates conditional upon the time
spent on the other remaining activities (e.g. the association between time spent teaching and
workload stress is conditional upon the time spent upon marking, lesson planning etc). The
shading of cells should be read horizontally, with red (green) indicating a stronger (weaker)
negative association with workload stress. Analogous results using the workplace wellbeing
scale (rather than the workload stress scale) can be found in Appendix D of Jerrim and Sims
(2020b).
104
Table 10.4 OLS estimates of the relationship between time spent upon marking,
management + administration and workload stress
Country Teaching Preparation Marking
Management
& admin
Teamwork
& CPD Other
Alberta, Canada 0.012* 0.053* 0.066* 0.023 -0.050* 0.004
Australia - primary 0.015* 0.018* 0.064* -0.008 -0.021 0.016*
Australia - secondary 0.012* 0.042* 0.051* 0.003 -0.016 0.005
England - primary 0.007 0.038* 0.060* -0.008 -0.027* 0.019*
England - secondary 0.029* 0.030* 0.046* -0.005 -0.013 0.006
New Zealand 0.019* 0.027* 0.062* 0.008 -0.032* 0.000
USA 0.004 0.034* 0.068* 0.003 -0.045 -0.007
Average 0.014 0.034 0.059 0.002 -0.029 0.006
Notes: Figures refer to effect size change in the wellbeing/stress scale per one-hour increase in each task. Shading
should be read horizontally. Redder shading indicates a greater negative association with workload stress, green
shading indicates a zero or negative association with workload stress. A * indicates significantly different from
zero at the5% level. Source = TALIS 2018 dataset.
Across all English-speaking jurisdictions, there are two clear aspects of the job that are strongly
associated with teachers’ workload stress. The first is marking, with each additional hour spent
on this task associated with around a 0.06 standard deviation change in the stress that teachers
feel at work. The direction and magnitude of this effect is similar across all the education
systems considered; marking, however it is done, always seems to be a stressful part of the job.
Lesson planning and preparation is the other aspect of teachers’ jobs that consistently has a
negative association with workload stress. Across the countries that we consider, each
additional hour spent upon lesson planning raises workload stress by 0.034 standard deviations,
ranging from a high of 0.053 standard deviations in Alberta to a low of 0.018 for primary
teachers in Australia.
However, outside of these two areas, the association between time spent upon the other tasks
and their workload stress is rather weak. For instance, after accounting for any additional time
that must be allocated to lesson preparation and marking, each additional hour spent teaching
has little correlation with our outcome measures. Take primary teachers in England: a
substantial 10-hour increase in their teaching load is associated with just a 0.07 standard
deviation increase in their level of workload stress (conditional upon this not increasing the
time that they spend on other tasks). This suggests that it is not teaching hours per se that causes
teachers stress, but rather the auxiliary tasks (marking, planning) that come with it.
Interestingly, the effect of each additional hour allocated to management and administration is
essentially zero across most of the countries considered. Meanwhile, additional time allocated
to collaboration with colleagues and CPD may actually lead to a reduction in workload stress
(effect size = 0.03 for each additional hour), though in many countries this association does not

105
quite reach statistical significance at conventional levels. As indicated by the similar pattern of
shading across cells, very similar patterns emerge across countries and between primary and
secondary staff.
To conclude, Figure 10.2 turns to our investigations of whether the relationship between the
time teachers spend upon different tasks and their workload stress is non-linear. Estimates are
presented for the three tasks where a relationship with workload stress was found using OLS:
(a) teaching, (b) lesson planning, and (c) marking.
Although a broadly linear relationship can be observed for most tasks in most countries, there
are some important exceptions. This includes time spent upon lesson planning in the United
States and time spent upon marking for secondary teachers in Australia, for example. However,
the most striking case is secondary teachers in England. Our discussion therefore focuses upon
the results for this group.
With respect to time spent upon teaching, workload stress for secondary teachers in England
reaches its peak at 23 hours per week, after which point workload stress declines. One potential
explanation for this result is that those teachers who are required to teach for a greater number
of hours are relieved from some other duties. On the other hand, the link between lesson
planning and workload stress for secondary teachers in England is broadly linear up to seven
hours per week, but then tails off. In other words, the first few hours spent upon lesson planning
have the greatest marginal impact upon the stress suffered by this group. Finally, there is a big
jump in workload stress for secondary teachers in England who spend between one and five
hours marking students work each week. The estimated non-parametric regression line is then
flat between five and ten hours, suggesting that each additional hour of marking within this
range has little association with workload stress. However, once this ten-hour threshold for
marking is exceeded, then workload stress increases exponentially. This suggests that ten hours
of marking per week represents a red line for secondary teachers in England that should not be
crossed. As almost a quarter of full-time secondary teachers in England currently spend ten
hours per week or more on marking29, this represents a priority for workload reduction in
England.
29 Authors’ calculations based upon the TALIS 2018 sample used in this paper.

106
Figure 10.2 Non-parametric regression estimates of the association between the time spent upon different tasks and workload stress.
(a) Teaching (b) Lesson planning

107
(c)Marking
Notes: See Jerrim and Sims (2020b) for analogous results for the workplace wellbeing scale. Weights not applied. Model estimated excluding the school fixed effects. Results based upon a
female teacher, with number of years’ teaching experience set to the national average, who holds an ISCED Level 6 (postgraduate) qualification, whose motivations for entering teaching were
similar to the national average, but for whom teaching was not their first-choice career. Source = TALIS 2018 dataset.
108
10.5 Summary and policy recommendations
Using data from TALIS 2018, this chapter has attempted to provide new evidence on the
association between teachers’ working hours and their wellbeing for five English-speaking
countries. Our results illustrate how the link between teachers’ working hours and their
workplace wellbeing may not be linear (at least in some countries) and, after considering the
potential impact of measurement error, may be stronger than previously thought (see Jerrim
and Sims, 2020b for further details on this point). The two aspects of teachers’ jobs that lead
to the greatest increase in workload stress are lesson planning and marking; each additional
hour spent upon the latter is associated with a 0.06 standard deviation increase in stress in the
workplace. This is in contrast to other aspects of the job, such as time spent teaching and
working with colleagues/professional development, which seem to have little direct effect upon
teachers’ quality of working life. Together, the evidence points towards a need to aim for a
term time working week for teachers of no more than around 50 hours − similar to the
maximum allowed under the European Working Time Directive. This reduction in total
working hours should be mainly achieved via reductions in marking and lesson planning.
We believe that these findings have important implications for education policy. There are two
clear areas where reducing teachers’ workloads would help reduce stress: lesson preparation
and marking. With respect to the former, perhaps the easiest thing that policymakers can do is
dramatically reduce examination, curriculum and inspection reforms – all of which create new
work for teachers, who are forced to change lessons, materials and teaching styles as a result.
Indeed, in 2019, the Department for Education in England committed to ‘a period of greater
stability in curriculum, qualifications and assessment’ (Department for Education, 2019b).
Given our findings on the relationship between stress and both lesson planning and overall
workload, many teachers in other countries would likely benefit from a similar pledge.
The time allocated to marking may be harder to reduce, though it is noteworthy how the amount
of time spent marking in several English-speaking countries (e.g. both primary and secondary
teachers in England) is above international averages (OECD 2019). A recent review found a
lack of good research on the impact of written marking on pupil learning (Elliott et al., 2016).
However, it found that there was evidence to suggest that acknowledgement marking, awarding
grades for every piece of work and marking without providing time for pupils to consider the
feedback are all unlikely to help pupils – thus, ‘school should mark less… but better’.
Consequently, it is likely that many schools could reduce teacher stress by reducing the amount
of marking they require teachers to do, without it having a detrimental effect on pupil learning.
109
Chapter 11 School accountability and teacher stress
International evidence from the OECD TALIS study
11.1 Introduction
Within school systems across the globe, the issue of accountability is gaining in prominence
and importance. Although ‘accountability’ in education can be conceptualised and
operationalised in different ways (Gilbert, 2011), it essentially boils down to key agents within
the school system (teachers, headteachers, schools) being held responsible for student
achievement (Brill et al., 2018). Accompanied by the rise in a data-driven culture (Schildkamp,
2019), accountability in many countries has been synonymous with greater monitoring of
student test scores (Hamilton and Koretz, 2002), which are increasingly being used to make
judgements about the ‘effectiveness’ of individual teachers (Bitler et al., 2019) and their
schools (Goldstein, 1997).
Yet this close monitoring of student, teacher and school performance – based largely upon
student assessment data – may also be having unintended and undesirable consequences. Some
countries with particularly intensive accountability regimes are now facing serious issues with
the recruitment and retention of teachers (Craig, 2017), due to the increasing workloads and
the negative impact that this may have upon wellbeing (Perryman & Calvert, 2019). England
is a prime example. It has one of the most data-driven systems of school accountability
anywhere in the world (Lough, 2019), yet also has one of the lowest levels of teacher job
satisfaction and wellbeing and is struggling to recruit and retain enough staff within the
profession (Foster, 2019).
There are, however, many things we do not currently know about the relationship between
accountability and teacher wellbeing. For instance, do countries with more intensive, data-
driven accountability systems have more stressed teachers and school leaders? Are teachers
more likely to feel stressed about being held accountable for student achievement if their
colleagues (and, particularly, senior colleagues) also feel under pressure? If school leaders feel
stressed by the accountability system, how do their practices – and approaches to school
management – change? And is senior management use of test-score data in teacher appraisals
increasing accountability-induced stress amongst their staff?

110
Developing a better understanding of such unintended negative side effects of intensive data-
driven methods of school and teacher accountability is the main aim of this chapter. In doing
so, we present new evidence on the correlates and consequences of accountability-induced
stress amongst more than 100,000 teachers and 8,000 school leaders from across the globe. It
addresses the following research questions:
• Research question 1. Do countries that place more emphasis upon school-performance
accountability measures have more stressed teachers and headteachers?
• Research question 2. Are teachers more stressed by accountability when senior leaders
regularly use achievement data to make judgements about their performance (and when
this may have consequences for their career)?
• Research question 3. Are teachers more stressed by accountability when their
colleagues (including their headteachers) feel stressed by accountability as well?
• Research question 4. When headteachers are stressed by accountability, how do their
school management practices change, and does it worsen the environment in the
school?
11.2 Data
The data we use are drawn from the 2018 round of TALIS (lower-secondary teachers only –
the equivalent to those teaching Key Stage 3). As part of the TALIS questionnaire, teachers
and headteachers were asked about the sources of stress in their job. This includes ‘being held
responsible for students’ achievement’. This is the primary outcome we consider in this paper,
focusing upon those who selected one of the two most extreme options (‘a lot’ and ‘quite a
bit’).
Headteachers were also asked about how regularly they monitor staff through formal appraisals
and what information is used to judge the performance of teachers as part of their appraisals.
In this chapter, we are particularly interested in headteachers’ use of national-, school- or class-
based tests as part of pupil appraisal. Finally, headteachers were also asked about the potential
consequences of teacher appraisal. Our particular interest here is whether material sanctions,
reduced prospects of career profession or dismissal are ever a consequence of a negative
appraisal. Specifically, we will use this information as part of our investigations into whether
teachers find accountability particularly stressful when test-score metrics are used by senior
management in their appraisal and when this has potentially serious consequences for their
career.

111
In addition to TALIS, we also draw upon information from the PISA 2018 headteacher survey
in order to address research question 1. As part of PISA 2018, headteachers were asked how
they and the national government use national assessment data and how external evaluations
(e.g. inspections) are used as part of the quality assurance process for their school. These
indicators are combined into a single accountability scale, which has been standardised to mean
zero and standard deviation one across countries, with greater values indicating greater use of
(test-score-driven) school accountability.
11.3 Do countries that place more emphasis upon school-performance accountability
measures have more stressed teachers and headteachers?
Figure 11.1 illustrates the relationship between the scale of school-system accountability and
the percentage of headteachers, panel (a), and teachers, panel (b), who report being stressed by
accountability at the country level. In both graphs, there is a moderate, positive correlation
(Pearson r ≈0.3). Consistent with our hypothesis, countries with more extensive, data-driven
systems of school accountability also have staff who feel more stressed by this aspect of their
job. Yet there are some clear exceptions to this relationship as well. For instance, despite its
extensive use of data-driven accountability, the United States sits just below the international
average in terms of the proportion of teachers and headteachers reporting high levels of
accountability-induced stress. On the other hand, in Portugal many more teachers and
headteachers report high levels of stress due to accountability than one would anticipate, given
the level of accountability in its school system.
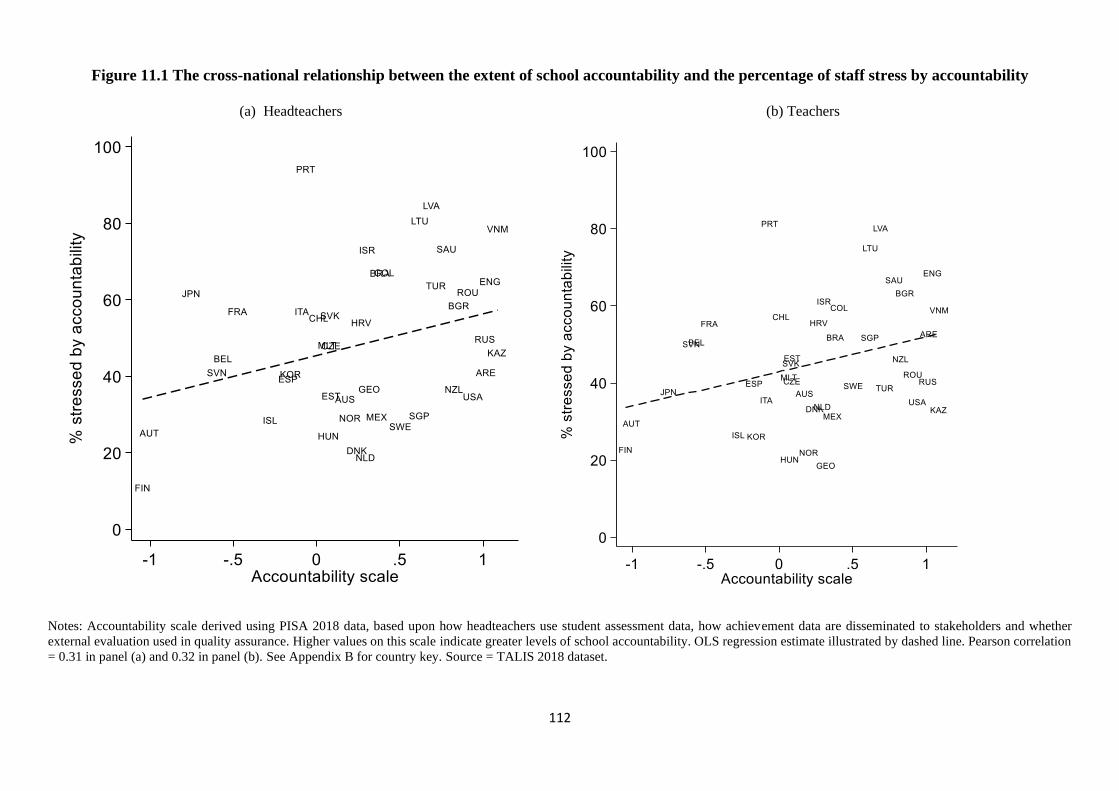
112
Figure 11.1 The cross-national relationship between the extent of school accountability and the percentage of staff stress by accountability
(a) Headteachers (b) Teachers
Notes: Accountability scale derived using PISA 2018 data, based upon how headteachers use student assessment data, how achievement data are disseminated to stakeholders and whether
external evaluation used in quality assurance. Higher values on this scale indicate greater levels of school accountability. OLS regression estimate illustrated by dashed line. Pearson correlation
= 0.31 in panel (a) and 0.32 in panel (b). See Appendix B for country key. Source = TALIS 2018 dataset.
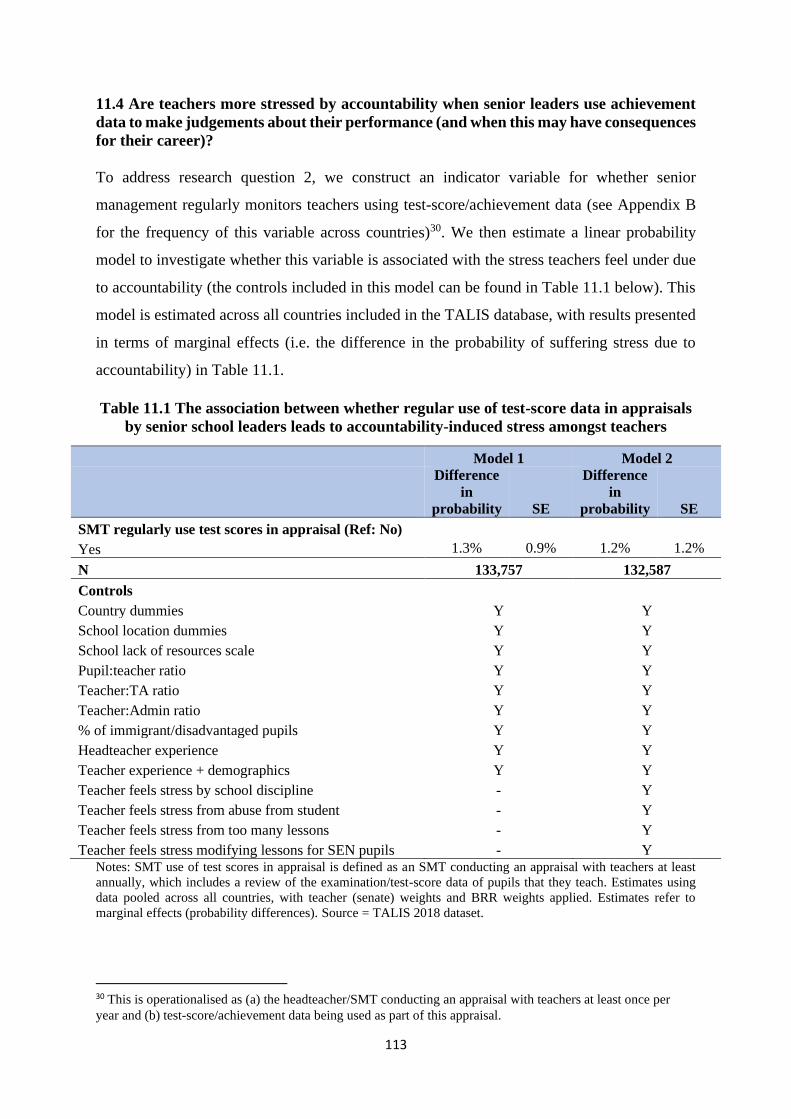
113
11.4 Are teachers more stressed by accountability when senior leaders use achievement
data to make judgements about their performance (and when this may have consequences
for their career)?
To address research question 2, we construct an indicator variable for whether senior
management regularly monitors teachers using test-score/achievement data (see Appendix B
for the frequency of this variable across countries)30. We then estimate a linear probability
model to investigate whether this variable is associated with the stress teachers feel under due
to accountability (the controls included in this model can be found in Table 11.1 below). This
model is estimated across all countries included in the TALIS database, with results presented
in terms of marginal effects (i.e. the difference in the probability of suffering stress due to
accountability) in Table 11.1.
Table 11.1 The association between whether regular use of test-score data in appraisals
by senior school leaders leads to accountability-induced stress amongst teachers
Model 1 Model 2
Difference
in
probability SE
Difference
in
probability SE
SMT regularly use test scores in appraisal (Ref: No)
Yes 1.3% 0.9% 1.2% 1.2%
N 133,757 132,587
Controls
Country dummies Y Y
School location dummies Y Y
School lack of resources scale Y Y
Pupil:teacher ratio Y Y
Teacher:TA ratio Y Y
Teacher:Admin ratio Y Y
% of immigrant/disadvantaged pupils Y Y
Headteacher experience Y Y
Teacher experience + demographics Y Y
Teacher feels stress by school discipline - Y
Teacher feels stress from abuse from student - Y
Teacher feels stress from too many lessons - Y
Teacher feels stress modifying lessons for SEN pupils - Y Notes: SMT use of test scores in appraisal is defined as an SMT conducting an appraisal with teachers at least
annually, which includes a review of the examination/test-score data of pupils that they teach. Estimates using
data pooled across all countries, with teacher (senate) weights and BRR weights applied. Estimates refer to
marginal effects (probability differences). Source = TALIS 2018 dataset.
30 This is operationalised as (a) the headteacher/SMT conducting an appraisal with teachers at least once per
year and (b) test-score/achievement data being used as part of this appraisal.
114
Overall, there is little evidence that senior school leaders regularly using student performance
data when conducting appraisals leads to teachers feeling more stressed about accountability.
The estimated difference in the probability of suffering stress due to accountability from both
model specifications is around one percentage point. This suggests that there is no overall,
systematic difference in teacher stress associated with senior leaders regularly using student
performance data when appraising their staff. There are some potential exceptions, however,
including Columbia, Kazakhstan, Slovak Republic, South Africa, Sweden and England. In
these nations, the association does appear more sizable across the two model specifications.
For instance, in England secondary teachers are around 12 percentage points more likely to say
that they feel stressed due to accountability if SMT use student performance data in teacher
appraisals31.
Table 11.2 extends this analysis by dividing the pooled TALIS data into two subgroups – those
schools where teachers never face dismissal following an appraisal (column 1) and those where
dismissal is a possibility (column 2). In other words, do we find teachers being more stressed
by accountability when test-score data is used in their appraisal and when this could have
serious consequences for their career? We find little evidence that this is the case. The
differences in the probability of suffering stress due to accountability reported in Table 11.2
are again only around one or two percentage points and do not differ substantially between the
two subgroups. For instance, amongst those teachers who could potentially face dismissal due
to a poor appraisal, around 47% report suffer stress due to accountability if school leaders use
test-score data as part of their appraisal, compared to 45% of teachers where test-score data is
not used. Hence, even when there are potentially severe consequences, the use of test-score
data in teachers’ appraisals does not seem to have a strong association with their levels of stress.
31 This estimate has been produced using a linear probability model based upon the second model specification.
It is also worth noting that around 90% of teachers in England are evaluated at least annually by a member of
senior school management, where student performance data is reviewed.
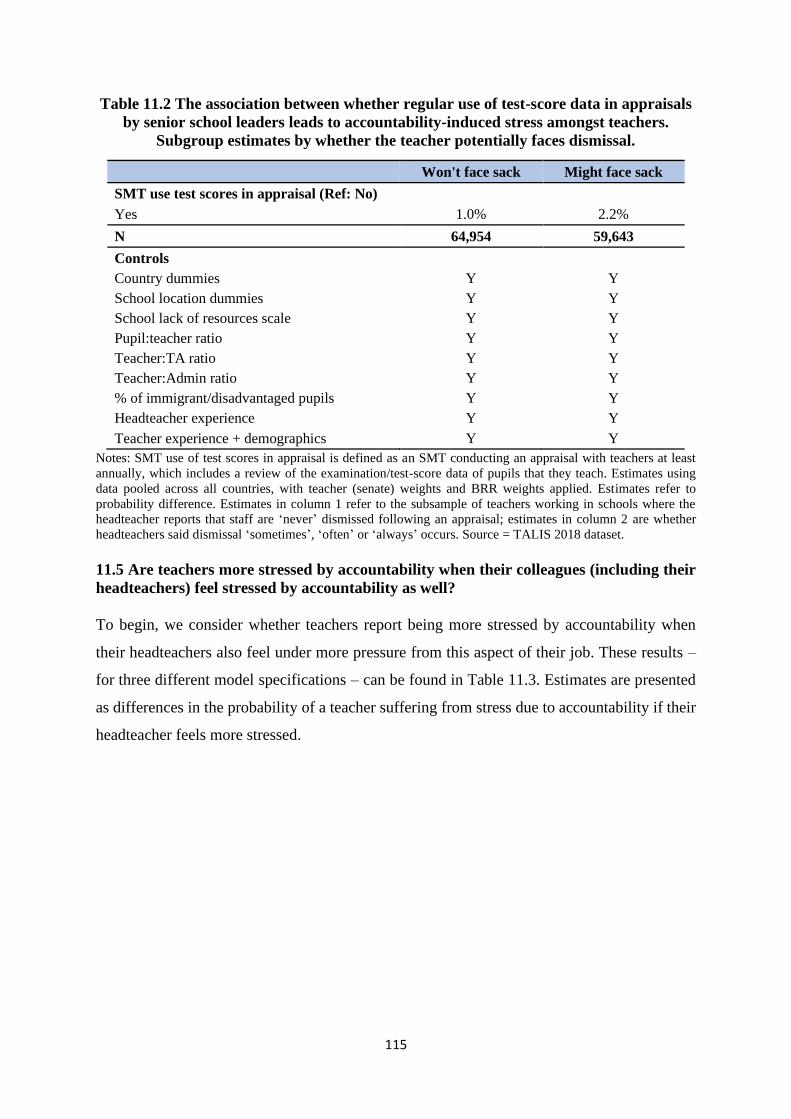
115
Table 11.2 The association between whether regular use of test-score data in appraisals
by senior school leaders leads to accountability-induced stress amongst teachers.
Subgroup estimates by whether the teacher potentially faces dismissal.
Won't face sack Might face sack
SMT use test scores in appraisal (Ref: No)
Yes 1.0% 2.2%
N 64,954 59,643
Controls
Country dummies Y Y
School location dummies Y Y
School lack of resources scale Y Y
Pupil:teacher ratio Y Y
Teacher:TA ratio Y Y
Teacher:Admin ratio Y Y
% of immigrant/disadvantaged pupils Y Y
Headteacher experience Y Y
Teacher experience + demographics Y Y
Notes: SMT use of test scores in appraisal is defined as an SMT conducting an appraisal with teachers at least
annually, which includes a review of the examination/test-score data of pupils that they teach. Estimates using
data pooled across all countries, with teacher (senate) weights and BRR weights applied. Estimates refer to
probability difference. Estimates in column 1 refer to the subsample of teachers working in schools where the
headteacher reports that staff are ‘never’ dismissed following an appraisal; estimates in column 2 are whether
headteachers said dismissal ‘sometimes’, ‘often’ or ‘always’ occurs. Source = TALIS 2018 dataset.
11.5 Are teachers more stressed by accountability when their colleagues (including their
headteachers) feel stressed by accountability as well?
To begin, we consider whether teachers report being more stressed by accountability when
their headteachers also feel under more pressure from this aspect of their job. These results –
for three different model specifications – can be found in Table 11.3. Estimates are presented
as differences in the probability of a teacher suffering from stress due to accountability if their
headteacher feels more stressed.

116
Table 11.3 The association between headteacher and teacher stress about accountability
M1 M2 M3
Headteacher stressed by accountability
(Ref: Not at all) Some extent 1.6% 0.7% 1.6%
Quite a bit 3.5% 2.2% 4.3%
A lot 5.3% 3.7% 6.7%
N 133,471 132,311 132,049
Controls
Country dummies Y Y Y
School location dummies Y Y Y
School lack of resources scale Y Y Y
Pupil:teacher ratio Y Y Y
Teacher:TA ratio Y Y Y
Teacher:Admin ratio Y Y Y
% of immigrant/disadvantaged pupils Y Y Y
Headteacher experience Y Y Y
Teacher experience + demographics Y Y Y
Other sources of stress for the teacher - Y Y
Other sources of stress for the headteacher - - Y
Notes: Outcome variable = whether the teacher reports feeling ‘quite a bit’ or ‘a lot’ of stress (1) or not (0).
Analysis based upon pooled TALIS 2018 lower-secondary data pooled across countries. Final teacher (senate)
and BRR weights applied. Estimates refer to probability difference (45% of teachers report feeling stressed by
accountability across countries). * indicates statistical significance at the 5% level.
There appears to be a modest, positive association between the accountability-induced stress
reported by headteachers and by their staff. Across all model specifications, the difference in
the probability of suffering accountability-induced stress is positive, with the coefficient
statistically significant for the top category (headteacher feels very stressed) in M1 and M332.
We should, however, emphasise that the magnitude of the estimated association is relatively
modest; the results imply that the headteacher moving from the lowest stress category (‘not at
all’) to the highest (‘a lot’) is associated with around a six-percentage-point increase in the
percentage of teachers who report that accountability causes them stress. Jerrim et al. (2020c)
also illustrates how emotional contagion of stress between headteachers and staff is only strong
in certain countries. Specifically, Australia, Belgium, Colombia, Denmark, Estonia, Japan,
Kazakhstan, South Korea, New Zealand, Portugal, Russia, Slovak Republic, Slovenia and
Sweden are examples of countries where teachers are particularly likely to report feeling more
stressed about accountability when their headteachers also feel stressed by this responsibility.
32 The estimated odds ratio is of similar magnitude across the three model specifications, though the standard error
is slightly inflated in specification two. This is part of the explanation as to why results from the second model
are not ‘statistically significant’.
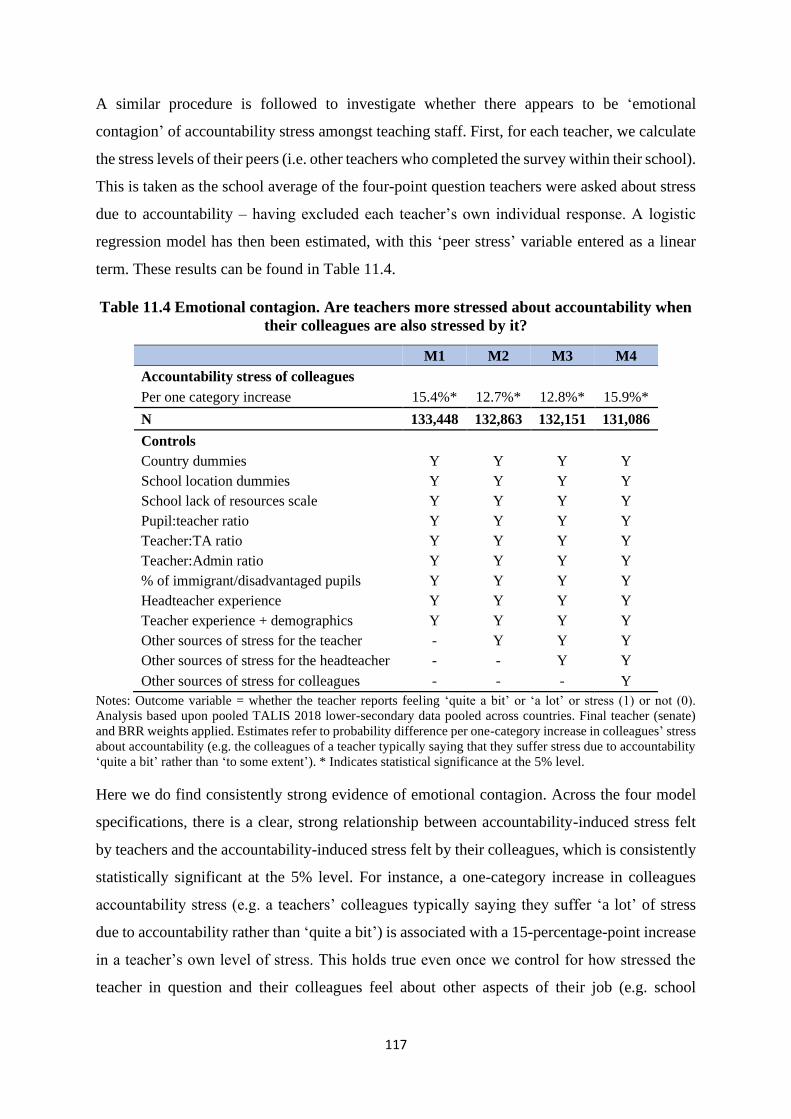
117
A similar procedure is followed to investigate whether there appears to be ‘emotional
contagion’ of accountability stress amongst teaching staff. First, for each teacher, we calculate
the stress levels of their peers (i.e. other teachers who completed the survey within their school).
This is taken as the school average of the four-point question teachers were asked about stress
due to accountability – having excluded each teacher’s own individual response. A logistic
regression model has then been estimated, with this ‘peer stress’ variable entered as a linear
term. These results can be found in Table 11.4.
Table 11.4 Emotional contagion. Are teachers more stressed about accountability when
their colleagues are also stressed by it?
M1 M2 M3 M4
Accountability stress of colleagues
Per one category increase 15.4%* 12.7%* 12.8%* 15.9%*
N 133,448 132,863 132,151 131,086
Controls
Country dummies Y Y Y Y
School location dummies Y Y Y Y
School lack of resources scale Y Y Y Y
Pupil:teacher ratio Y Y Y Y
Teacher:TA ratio Y Y Y Y
Teacher:Admin ratio Y Y Y Y
% of immigrant/disadvantaged pupils Y Y Y Y
Headteacher experience Y Y Y Y
Teacher experience + demographics Y Y Y Y
Other sources of stress for the teacher - Y Y Y
Other sources of stress for the headteacher - - Y Y
Other sources of stress for colleagues - - - Y
Notes: Outcome variable = whether the teacher reports feeling ‘quite a bit’ or ‘a lot’ or stress (1) or not (0).
Analysis based upon pooled TALIS 2018 lower-secondary data pooled across countries. Final teacher (senate)
and BRR weights applied. Estimates refer to probability difference per one-category increase in colleagues’ stress
about accountability (e.g. the colleagues of a teacher typically saying that they suffer stress due to accountability
‘quite a bit’ rather than ‘to some extent’). * Indicates statistical significance at the 5% level.
Here we do find consistently strong evidence of emotional contagion. Across the four model
specifications, there is a clear, strong relationship between accountability-induced stress felt
by teachers and the accountability-induced stress felt by their colleagues, which is consistently
statistically significant at the 5% level. For instance, a one-category increase in colleagues
accountability stress (e.g. a teachers’ colleagues typically saying they suffer ‘a lot’ of stress
due to accountability rather than ‘quite a bit’) is associated with a 15-percentage-point increase
in a teacher’s own level of stress. This holds true even once we control for how stressed the
teacher in question and their colleagues feel about other aspects of their job (e.g. school
118
discipline, number of lessons) and their colleagues’ overall level of job satisfaction. It hence
seems that, when a teacher’s colleagues are more stressed by the pressures of accountability,
they become more stressed about being held responsible for pupils’ achievement themselves.
Jerrim et al. (2020c) illustrates the cross-national variation in this result, finding strong
evidence of such emotional contagion of stress in some countries, but not in others. Examples
of countries where accountability stress amongst secondary teachers seems to be particularly
contagious include England, Spain, Singapore, Denmark, Brazil and Hungary. For instance,
for secondary schoolteachers in England, a one-category increase in colleagues’ accountability
stress (e.g. a teacher’s colleagues typically saying they suffer ‘a lot’ of stress due to
accountability rather than ‘quite a bit’) is associated with around an 18-percentage-point
increase in a teacher’s own level of stress. On the other hand, in nations such as Finland, Italy,
Austria, Norway and Sweden, there is little evidence that emotional contagion of accountability
stress occurs.
Putting these results together, we find strong evidence that stress about accountability gets
transmitted between teaching staff and their colleagues. Yet emotional contagion between
headteachers and their subordinates seems, in most countries, to be relatively weak. This is
counter to previous work (outside of education) by Sy, Cote and Saavedra (2005), who
suggested the transfer of emotions from senior staff to those more junior is particularly strong.
One possible interpretation of this finding is that headteachers generally do a good job in trying
to protect their staff when they themselves feel stressed about accountability. Yet this does then
not seem to stop concern spreading amongst teachers once an atmosphere of fear starts to take
hold in a school.
11.6 When headteachers are stressed by accountability, how do their school management
practices change, and does it worsen the environment in the school?
To conclude, Table 11.5 investigates what changes about a school when the headteacher feels
stressed about accountability. The results presented are based upon pooled data across all
countries, with unadjusted descriptive statistics provided on the left, and regression model
estimates on the right. The latter reflect the change in the probability of the headteacher taking
the action, for each category increase in headteacher stress.
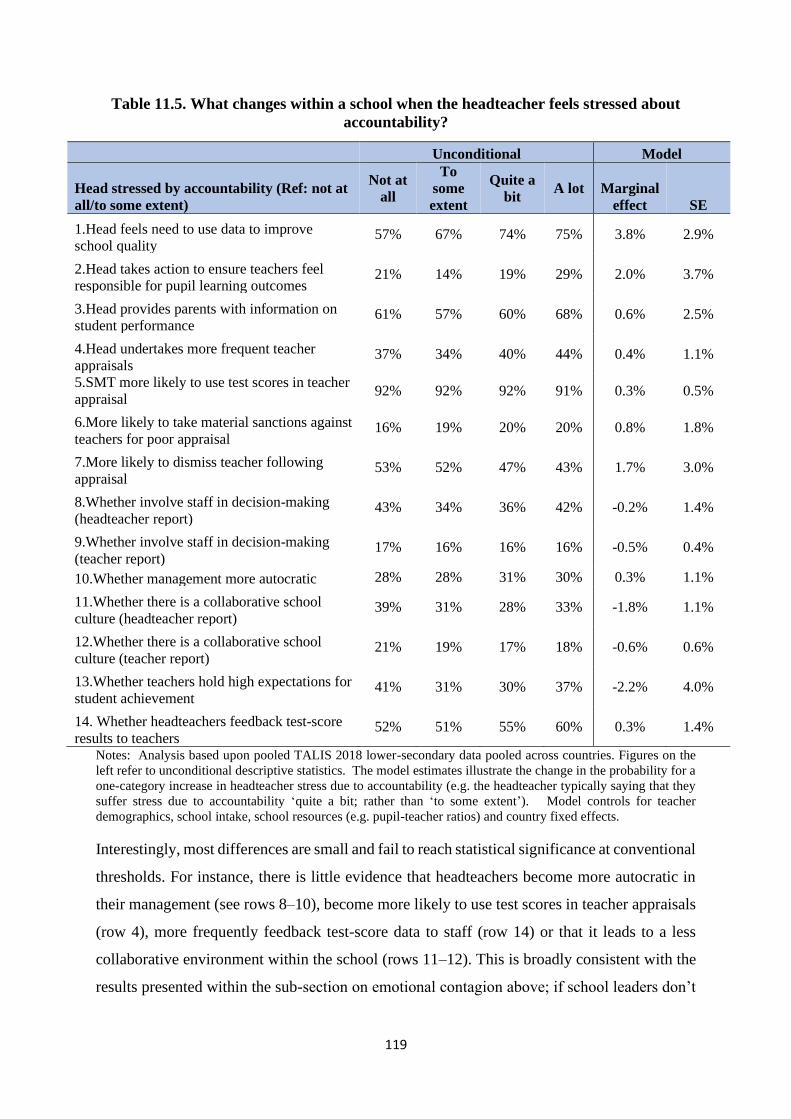
119
Table 11.5. What changes within a school when the headteacher feels stressed about
accountability?
Unconditional Model
Head stressed by accountability (Ref: not at
all/to some extent)
Not at
all
To
some
extent
Quite a
bit A lot Marginal
effect SE
1.Head feels need to use data to improve
school quality 57% 67% 74% 75% 3.8% 2.9%
2.Head takes action to ensure teachers feel
responsible for pupil learning outcomes 21% 14% 19% 29% 2.0% 3.7%
3.Head provides parents with information on
student performance 61% 57% 60% 68% 0.6% 2.5%
4.Head undertakes more frequent teacher
appraisals 37% 34% 40% 44% 0.4% 1.1%
5.SMT more likely to use test scores in teacher
appraisal 92% 92% 92% 91% 0.3% 0.5%
6.More likely to take material sanctions against
teachers for poor appraisal 16% 19% 20% 20% 0.8% 1.8%
7.More likely to dismiss teacher following
appraisal 53% 52% 47% 43% 1.7% 3.0%
8.Whether involve staff in decision-making
(headteacher report) 43% 34% 36% 42% -0.2% 1.4%
9.Whether involve staff in decision-making
(teacher report) 17% 16% 16% 16% -0.5% 0.4%
10.Whether management more autocratic 28% 28% 31% 30% 0.3% 1.1%
11.Whether there is a collaborative school
culture (headteacher report) 39% 31% 28% 33% -1.8% 1.1%
12.Whether there is a collaborative school
culture (teacher report) 21% 19% 17% 18% -0.6% 0.6%
13.Whether teachers hold high expectations for
student achievement 41% 31% 30% 37% -2.2% 4.0%
14. Whether headteachers feedback test-score
results to teachers 52% 51% 55% 60% 0.3% 1.4%
Notes: Analysis based upon pooled TALIS 2018 lower-secondary data pooled across countries. Figures on the
left refer to unconditional descriptive statistics. The model estimates illustrate the change in the probability for a
one-category increase in headteacher stress due to accountability (e.g. the headteacher typically saying that they
suffer stress due to accountability ‘quite a bit; rather than ‘to some extent’). Model controls for teacher
demographics, school intake, school resources (e.g. pupil-teacher ratios) and country fixed effects.
Interestingly, most differences are small and fail to reach statistical significance at conventional
thresholds. For instance, there is little evidence that headteachers become more autocratic in
their management (see rows 8–10), become more likely to use test scores in teacher appraisals
(row 4), more frequently feedback test-score data to staff (row 14) or that it leads to a less
collaborative environment within the school (rows 11–12). This is broadly consistent with the
results presented within the sub-section on emotional contagion above; if school leaders don’t
120
alter their approach to management when they are stressed – and it doesn’t worsen the
environment within the school – then it is perhaps not surprising that the link between
headteacher and teacher stress surrounding accountability is relatively weak. Moreover, it again
suggests that, even when headteachers themselves feel stressed about accountability, they try
not to take negative actions (e.g. become more autocratic) which might put additional pressure
on staff. One interpretation of this result – and more generally of those presented within this
paper – is that teachers feel the pressure of accountability directly from the system, rather than
it being driven by the actions of headteachers in response to the stress they themselves feel
from accountability-driven pressures.
11.7 Summary and policy implications
Results from this chapter have shown that there is a cross-national relationship between school-
system accountability and how stressed school staff feel about this aspect of their job. Yet the
strength of this relationship is modest (correlation ≈0.3), with some clear examples of countries
with extensive, data-driven accountability in schools where comparatively few teachers and
school leaders say that they feel stressed. We also find there to be only a weak relationship
between how stressed headteachers feel about accountability and the stress felt by staff. One
potential explanation for this finding is that the management practices of headteachers who feel
under pressure from accountability do not seem to differ much from those that do not feel
stressed by this part of their work. However, there is clear evidence of ‘emotional contagion’
of accountability-induced stress amongst staff within schools; an individual is much more
likely to feel under pressure from this aspect of their job if their colleagues do as well.
We believe the findings presented in this paper may hold some important implications for
education policy and practice. For government officials, it is important that they recognise that
increasing accountability within the school system is unlikely to be a one-way street to ‘school
improvement’. Although it may, according to previous research (e.g. Hanushek and Raymond,
2005), lead to increases in student test scores in the short run, our evidence suggests it might
also be associated with higher levels of teacher stress, which could ultimately drive individuals
out of the profession. This could, in turn, have negative implications for student achievement
over a longer time horizon. Benevolent education policymakers must weigh up the risks and
rewards of these possibilities before deciding whether increasing (or decreasing) school-system
accountability is the best route for their country to follow. For organisations looking to improve
the mental health of teachers – and reduce stress induced by accountability – our finding of
121
‘emotional contagion’ is likely to be relevant. In particular, it suggests that there will be specific
schools where there is an atmosphere of stress amongst staff about accountability, and where
it will be important for such organisations to intervene. It may also indicate that whole-school
approaches to reducing accountability stress amongst staff may be particularly efficient and
effective, with a reduction in the stress levels of one staff member likely to bring benefits to
others. Finally, SMTs are fine to continue the common practice of reviewing student
performance data as part of annual teacher appraisals; we find little evidence that this increases
stress levels amongst staff. However, it is important that school leaders continue to use student
performance data appropriately, and do not make inappropriate inferences about it capturing
the ‘quality’ or ‘performance’ of any individual member of staff.

122
Chapter 12 The link between the school working
environment and teachers’ job satisfaction, stress and exit
from the profession?
12.1 Introduction
Research suggests that the quality of the working environment − defined as policies and shared
ways of working that are within the proximal control of school leadership and affect teachers’
ability to fulfil their job roles − has an important influence on teacher job satisfaction, wellbeing
and ultimately job retention (Simon & Johnson, 2015). In particular, supportive school
leadership has repeatedly been found to predict such outcomes (Boyd et al., 2011; Ladd, 2011,
Kraft et al., 2016). However, the importance of other aspects of the working environment
remains unclear, with conflicting findings on the importance of disciplinary standards (Boyd
et al., 2011; Kraft et al., 2016), teacher collaboration (Kraft et al., 2016) and workload (Ladd,
2011).
The work presented in this chapter utilises unique linked survey and administrative data to
investigate the relationship between working environment and teachers leaving the profession,
and the extent that this may be due to poor working environments having a negative impact
upon job satisfaction and workplace stress. In particular, this chapter tests the following five
hypotheses:
• H1: Supportive school leadership predicts reduced attrition from the profession
• H2: Behavioural standards will predict reduced attrition from the profession overall
H2a: This relationship will be stronger for early career teachers…
H2b: …and for those who initially entered teaching to contribute to society
• H3: Workload will predict attrition from the profession overall
H3a: This relationship will be stronger for those who initially entered teaching
because it was consistent with home/family commitments
• H4: Teacher collaboration will predict attrition from the profession overall
• H5: Teachers with assignments that they feel well prepared for will be less likely to
leave the profession overall
H5a: This relationship will be stronger for early career teachers
123
12.2 Data and methods
These hypotheses are tested using the TALIS 2018 data linked to the School Workforce
Census. The analysis hence refers to a set of teachers teaching Key Stage 1, 2 or 3 pupils in
England. From the TALIS questionnaire, 26 questions measure various different aspect of
teachers’ working environment, including collaborative activities undertaken by teachers and
the nature of teacher workload; a group of four questions that collectively measure teacher job
satisfaction (e.g. ‘I enjoy working at this school’); with a further group of four questions that
collectively measure teacher workplace stress (e.g. ‘my job negatively impacts my mental
health’). We use confirmatory factor analysis to create scale scores for:
• supportive leadership (e.g. ‘my manager recognises when I have done a good job’)
• behaviour (e.g. ‘the school staff enforces rules for behaviour consistently throughout
the school’)
• workload (e.g. ‘my job leaves me time for my personal life’)
• collaboration (e.g. ‘how often do you observe other teachers’ classes and provide
feedback’)
• preparation for teaching assignment (e.g. ‘to what extent do you feel prepared for the
content of some or all of the subjects that I teach’)
• job satisfaction (e.g. ‘I enjoy working at this school’)
• workplace stress (e.g. ‘I experience stress in my work’)
These scales are all standardised to mean zero and standard deviation one, meaning all results
can be interpreted in terms of effect sizes.
It was possible to link 2,684 TALIS respondents to the School Workforce Census (SWC). This
includes information from the 2018/19 academic year (the autumn term following the TALIS
2018 data collection) which allows us to create the outcome variable of interest: exit (or
attrition) from the profession. Restricting the sample to full-time teachers, we are left with
2,136 observations, with 5.5% leaving the profession during our observation window.
We analyse the relationship between working conditions and teacher attrition using logistic
regression. These models include controls for the five working condition scales and a set of
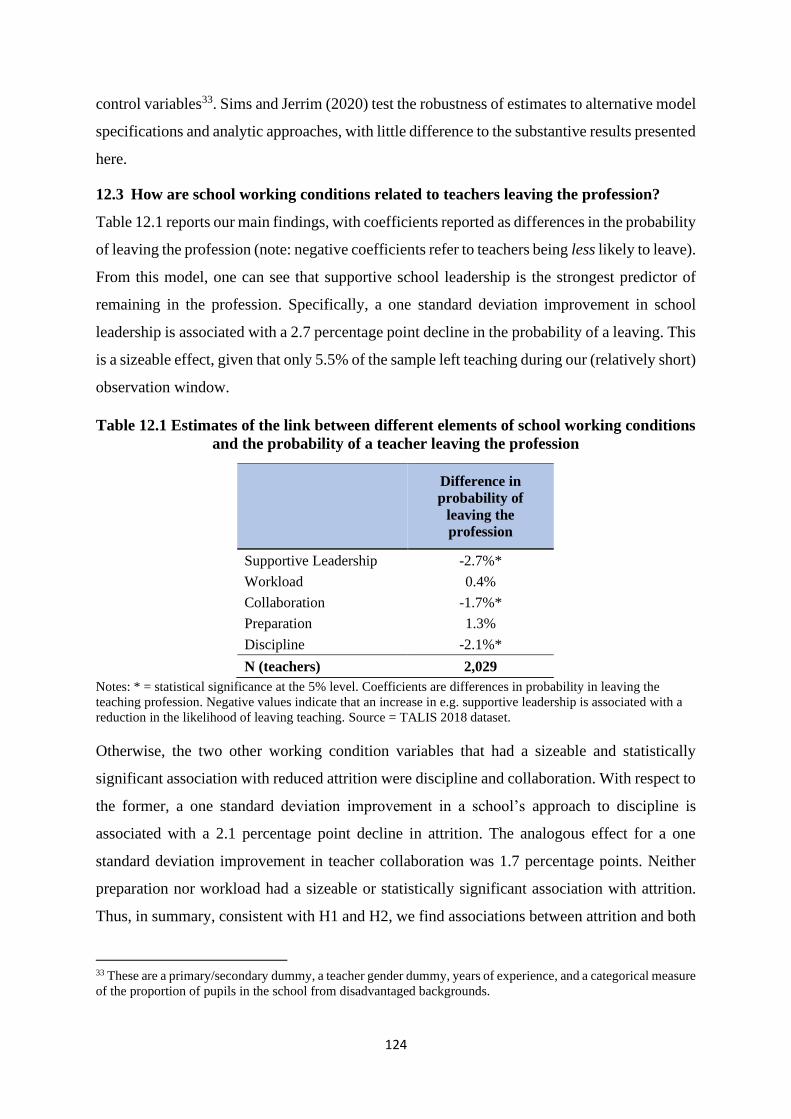
124
control variables33. Sims and Jerrim (2020) test the robustness of estimates to alternative model
specifications and analytic approaches, with little difference to the substantive results presented
here.
12.3 How are school working conditions related to teachers leaving the profession?
Table 12.1 reports our main findings, with coefficients reported as differences in the probability
of leaving the profession (note: negative coefficients refer to teachers being less likely to leave).
From this model, one can see that supportive school leadership is the strongest predictor of
remaining in the profession. Specifically, a one standard deviation improvement in school
leadership is associated with a 2.7 percentage point decline in the probability of a leaving. This
is a sizeable effect, given that only 5.5% of the sample left teaching during our (relatively short)
observation window.
Table 12.1 Estimates of the link between different elements of school working conditions
and the probability of a teacher leaving the profession
Notes: * = statistical significance at the 5% level. Coefficients are differences in probability in leaving the
teaching profession. Negative values indicate that an increase in e.g. supportive leadership is associated with a
reduction in the likelihood of leaving teaching. Source = TALIS 2018 dataset.
Otherwise, the two other working condition variables that had a sizeable and statistically
significant association with reduced attrition were discipline and collaboration. With respect to
the former, a one standard deviation improvement in a school’s approach to discipline is
associated with a 2.1 percentage point decline in attrition. The analogous effect for a one
standard deviation improvement in teacher collaboration was 1.7 percentage points. Neither
preparation nor workload had a sizeable or statistically significant association with attrition.
Thus, in summary, consistent with H1 and H2, we find associations between attrition and both
33 These are a primary/secondary dummy, a teacher gender dummy, years of experience, and a categorical measure
of the proportion of pupils in the school from disadvantaged backgrounds.
Difference in
probability of
leaving the
profession
Supportive Leadership -2.7%*
Workload 0.4%
Collaboration -1.7%*
Preparation 1.3%
Discipline -2.1%*
N (teachers) 2,029

125
supportive leadership and discipline. This is in line with existing literature (studying slightly
different outcomes) with leadership emerging as the strongest predictor of attrition.
We hypothesised that there would be a stronger relationship between discipline and attrition
(H2a) and preparation and attrition (H5a) for early career teachers. We investigated this by
running a version of our model in which the years of experience covariate was replaced with a
binary variable indicating whether a teacher has less than five years (‘novice’) or more than
five years (‘veteran’) of experience, as well as interactions between this and the latent working
environment latent variables. The predicted probability of leaving teaching for these two
groups, calculated for a teacher with otherwise average characteristics, is shown in Figure 12.1.
The left-hand panel illustrates the predicted probability of attrition based on varying levels of
preparation and the right-hand panel shows the same for discipline.
In short, both panels of Figure 12.1 illustrate how less experienced teachers are more likely to
leave the profession than their more experienced colleagues for any given value of the working
environment variables. However, there is no clear interaction between group experience and
either preparation or discipline.
Figure 12.1 Predicted probability of attrition by teacher experience level
Notes: Predicted margins for an average (female, secondary teacher with 10.9 years of experience in a school
from the modal deprivation category) from a model including interactions between a dummy for >/< 5 years of
experience and the two working environment latent variables. Grey regions indicate 90% confidence intervals.
Source = TALIS 2018 dataset.

126
We also hypothesised that there would be a stronger relationship between workload and
attrition for those who originally entered teaching in part because it would fit with their family
commitments (H3a). The left-hand panel of Figure 12.2 demonstrates clear support for this
hypothesis. Indeed, the direction of the association between workload and attrition is reversed
depending on whether TALIS respondents placed either no/low or moderate/high importance
on ‘The teaching schedule (e.g. hours, holidays, part-time positions) fit with responsibilities in
my personal life’. For those who gave this moderate/high importance, and had otherwise
average characteristics, a one standard deviation increase in the workload scale is associated
with a reduction in the probability of exiting the profession from 4% to 1.9%.
By contrast, we found no clear support for hypotheses H2b that teachers who placed
moderate/high importance on ‘Teaching allowed me to provide a contribution to society’ were
more sensitive to poor disciplinary standards (right-hand panel).
Figure 12.2 Predicted probability of attrition by presence of reason for entering teaching:
fit with responsibilities in personal life (left panel); to contribute to society (right panel)
Notes: Predicted margins for an average (female, secondary teacher from a school in the modal deprivation
category) from a model including interactions between presence of a particular motive and two working
environment variables. Grey regions indicate 90% confidence intervals. Grey dashed lines show the relationship
for individuals who placed a moderate or high importance on the following reasons for entering teaching: ‘The
teaching schedule (e.g. hours, holidays, part-time positions) fit with responsibilities in my personal life’ (left
panel) or ‘Teaching allowed me to provide a contribution to society’ (right panel). Black lines show the
relationship for those who placed low or no importance on these reasons for becoming a teacher. Source = TALIS
2018 dataset.
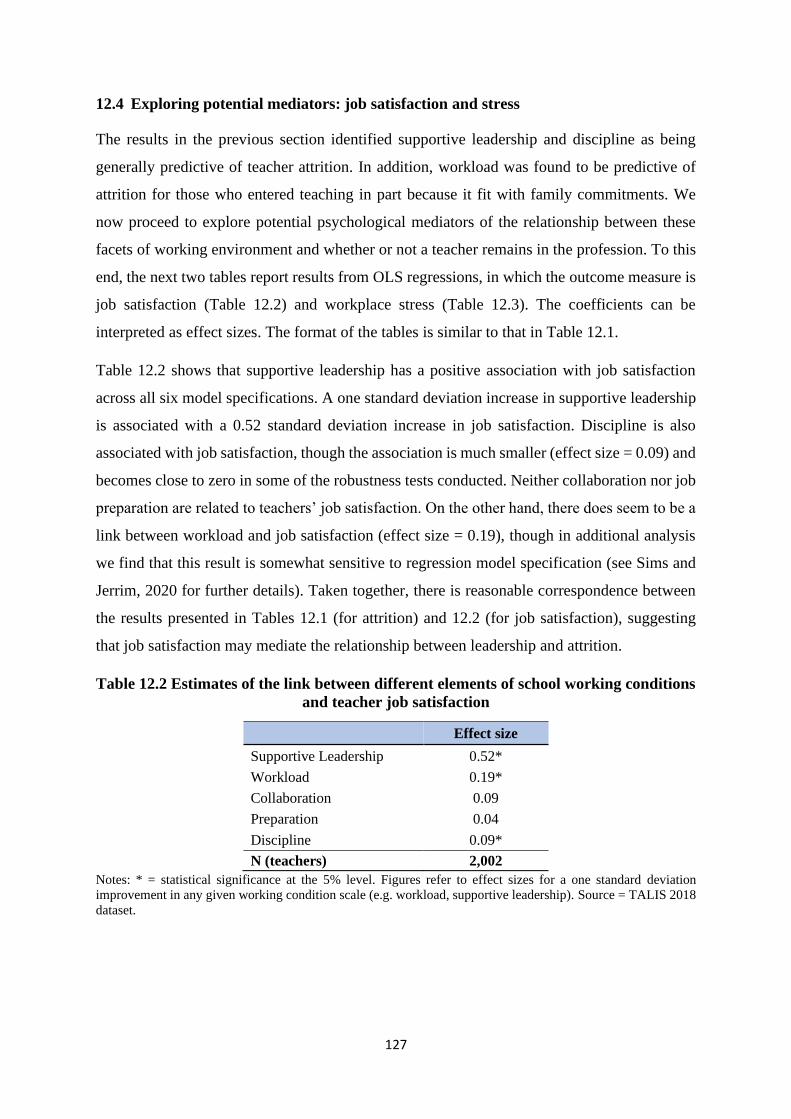
127
12.4 Exploring potential mediators: job satisfaction and stress
The results in the previous section identified supportive leadership and discipline as being
generally predictive of teacher attrition. In addition, workload was found to be predictive of
attrition for those who entered teaching in part because it fit with family commitments. We
now proceed to explore potential psychological mediators of the relationship between these
facets of working environment and whether or not a teacher remains in the profession. To this
end, the next two tables report results from OLS regressions, in which the outcome measure is
job satisfaction (Table 12.2) and workplace stress (Table 12.3). The coefficients can be
interpreted as effect sizes. The format of the tables is similar to that in Table 12.1.
Table 12.2 shows that supportive leadership has a positive association with job satisfaction
across all six model specifications. A one standard deviation increase in supportive leadership
is associated with a 0.52 standard deviation increase in job satisfaction. Discipline is also
associated with job satisfaction, though the association is much smaller (effect size = 0.09) and
becomes close to zero in some of the robustness tests conducted. Neither collaboration nor job
preparation are related to teachers’ job satisfaction. On the other hand, there does seem to be a
link between workload and job satisfaction (effect size = 0.19), though in additional analysis
we find that this result is somewhat sensitive to regression model specification (see Sims and
Jerrim, 2020 for further details). Taken together, there is reasonable correspondence between
the results presented in Tables 12.1 (for attrition) and 12.2 (for job satisfaction), suggesting
that job satisfaction may mediate the relationship between leadership and attrition.
Table 12.2 Estimates of the link between different elements of school working conditions
and teacher job satisfaction
Effect size
Supportive Leadership 0.52*
Workload 0.19*
Collaboration 0.09
Preparation 0.04
Discipline 0.09*
N (teachers) 2,002
Notes: * = statistical significance at the 5% level. Figures refer to effect sizes for a one standard deviation
improvement in any given working condition scale (e.g. workload, supportive leadership). Source = TALIS 2018
dataset.
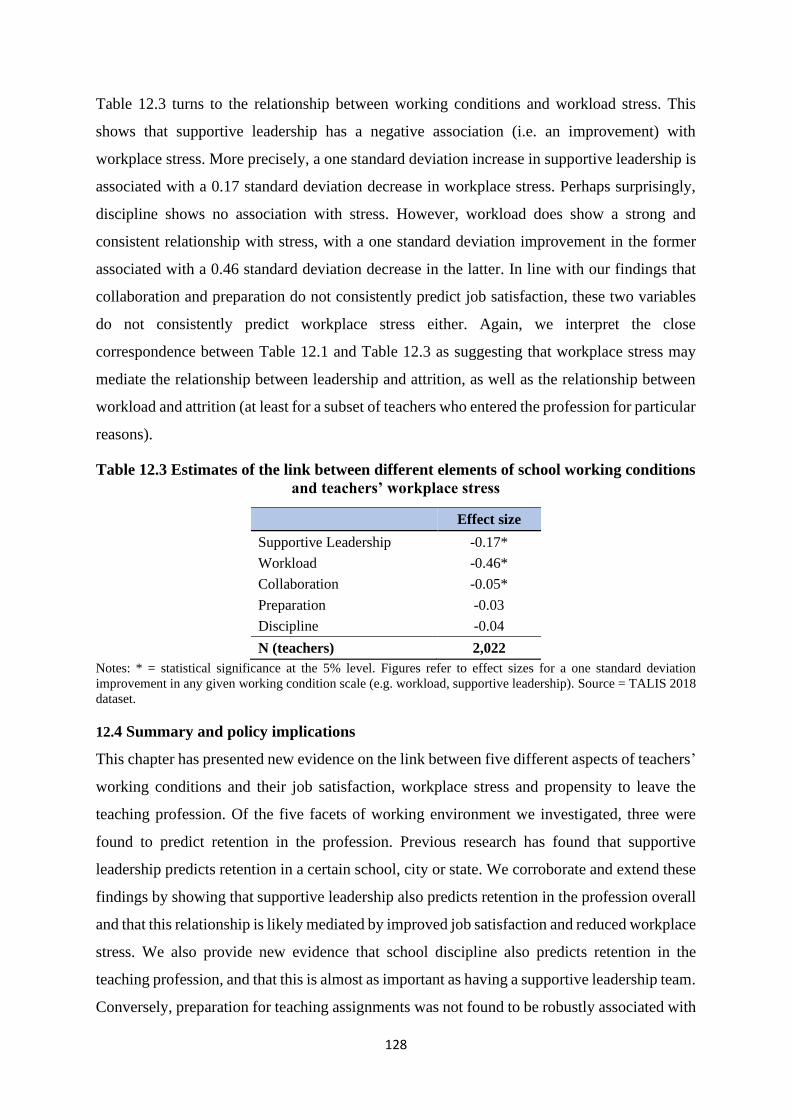
128
Table 12.3 turns to the relationship between working conditions and workload stress. This
shows that supportive leadership has a negative association (i.e. an improvement) with
workplace stress. More precisely, a one standard deviation increase in supportive leadership is
associated with a 0.17 standard deviation decrease in workplace stress. Perhaps surprisingly,
discipline shows no association with stress. However, workload does show a strong and
consistent relationship with stress, with a one standard deviation improvement in the former
associated with a 0.46 standard deviation decrease in the latter. In line with our findings that
collaboration and preparation do not consistently predict job satisfaction, these two variables
do not consistently predict workplace stress either. Again, we interpret the close
correspondence between Table 12.1 and Table 12.3 as suggesting that workplace stress may
mediate the relationship between leadership and attrition, as well as the relationship between
workload and attrition (at least for a subset of teachers who entered the profession for particular
reasons).
Table 12.3 Estimates of the link between different elements of school working conditions
and teachers’ workplace stress
Effect size
Supportive Leadership -0.17*
Workload -0.46*
Collaboration -0.05*
Preparation -0.03
Discipline -0.04
N (teachers) 2,022
Notes: * = statistical significance at the 5% level. Figures refer to effect sizes for a one standard deviation
improvement in any given working condition scale (e.g. workload, supportive leadership). Source = TALIS 2018
dataset.
12.4 Summary and policy implications
This chapter has presented new evidence on the link between five different aspects of teachers’
working conditions and their job satisfaction, workplace stress and propensity to leave the
teaching profession. Of the five facets of working environment we investigated, three were
found to predict retention in the profession. Previous research has found that supportive
leadership predicts retention in a certain school, city or state. We corroborate and extend these
findings by showing that supportive leadership also predicts retention in the profession overall
and that this relationship is likely mediated by improved job satisfaction and reduced workplace
stress. We also provide new evidence that school discipline also predicts retention in the
teaching profession, and that this is almost as important as having a supportive leadership team.
Conversely, preparation for teaching assignments was not found to be robustly associated with

129
job satisfaction, workplace stress or retention. Findings with respect to workload and teacher
collaboration were mixed.
These findings have a number of implications for practice. In particular, the questions that
comprise each of our latent working environment variables indicate promising approaches for
school leaders. First, our findings suggest that school leaders can reduce stress and improve
retention by consulting and involving teachers in decision-making processes, supporting their
professional development and explicitly recognising staff for their work. In addition, school
leaders looking to improve job satisfaction and retention would be advised to prioritise
improving disciplinary standards in the school. This can be achieved by ensuring that all staff
are aware of whole-school standards for behaviour and are supported in consistently enforcing
them. In addition, school leaders should be cognizant of the commitments that teachers have
outside of their work and consider these when making requests of staff. In combination, these
sorts of measures can help tackle the widespread problem of teacher shortages.
130
Chapter 13 How did the early stages of the Covid-19
pandemic affect teacher wellbeing?
13.1 Introduction
The Covid-19 pandemic has affected all of our lives. Coming out of the blue at the start of
2020, most people across the globe had their working lives turned upside down. This, of course,
includes teachers, with many having to quickly develop online materials and to teach their
pupils remotely. The period during first national lockdown – from mid-March to the end of
May 2020 – was also a period of great uncertainty for schools and teachers. While some were
continuing their regular routine in order to educate the children of key workers, others were
left wondering when exactly they would return to physically teaching in the classroom, and
whether it was safe to do so. All of this was occurring, of course, while loved ones were getting
sick, teachers’ own children were home from school and almost any form of social or
recreational relief was cancelled.
A great deal of research has already been conducted into wellbeing during the Covid-19
pandemic (e.g. Fancourt et al., 2020; Pierce et al., 2020), illustrating how it has impacted upon
the mental health and wellbeing of various groups. Yet there has been little consideration given
specifically to how this unusual period affected teachers. Each occupational group would have
experienced its own particular set of challenges, especially in the early stages of the pandemic
as the country went into lockdown. In this short postscript chapter, we present some of the first
available evidence on this issue, drawing upon unique data collected via the Teacher Tapp
survey app. This allows us to provide new evidence on how work-related anxiety changed over
the course of the 2019/20 academic year (both pre- and during lockdown), the extent that
lockdown affected teachers’ psychological wellbeing, and whether this varied across
demographic groups – most notably by gender and household structure. In doing so, this
chapter provides new insight into how teacher wellbeing was impacted by one of the most
unusual periods the teaching profession is ever likely to face.
13.2 Data
The data used in this chapter is drawn from the Teacher Tapp survey app. Participants are a
self-selecting group of teachers (including primary, secondary and school leaders) who are sent
three short questions each day at 3.30pm. Throughout the 2019/20 academic year, we
131
repeatedly asked the following question about teachers’ work-related anxiety, adapting a
question from the Annual Population Survey:
On a scale where 0 is ‘not at all anxious’ and 10 is ‘completely anxious’, overall, how
anxious did you feel about work today?
To avoid possible day-of-week effects, teachers always responded to this question on a
Tuesday afternoon. (When testing this question for day-of-week effects, we found that work-
related anxiety of teachers peaked Monday afternoon and then gradually fell through to
Saturday afternoon, before rising again)34. Around 8,000 teachers in England provided
responses to these questions across the various timepoints. Consistent with the results presented
in Chapter 6, responses to this question illustrate how work-related anxiety amongst teachers
falls during school holidays, with around 13% of teachers typically reporting very high work-
related anxiety (defined as a score of 8 and above on the 10-point scale) during term time and
just 5% during the holiday week. Using this data, it is hence possible to investigate how work-
related anxiety amongst teachers was affected once the country went into lockdown, and as it
came back out again.
In addition, the Teacher Tapp panel were also asked a number of other questions about their
wellbeing, including subjective views on the impact Covid-19 has had on their psychological
health, as well as questions from other standardised survey instruments (e.g. from the Warwick-
Edinburgh Mental Wellbeing Scale). We also report on responses to these questions in the
results sections below.
13.3 How did teachers’ work-related anxiety change after the pandemic hit?
Figure 13.1 illustrates the proportion of teachers reporting very high work-related anxiety (a
score of eight or more on the 10-point scale) throughout the 2019/20 academic year. Results
are presented separately for state schoolteachers, independent (private) teachers and
headteachers. For all three groups, the immediate impact of the pandemic – as lockdown was
announced – was stark. From the start of the academic year in September 2019 through to the
start of March 2020, there was little clear variation in teachers’ responses. However, as Figure
13.1 shows, the week before schools were asked to close, anxiety levels peaked as teachers
tried to cope with high staff absence rates, emergency closures, worry about infection and
34 This may explain why our sample reported fairly high anxiety levels relative to the Annual Population Survey
(e.g. during term time 36% of teachers report an anxiety value of 6-10, versus just 20% in the population) –
although there are also minor differences in the precise question asked.
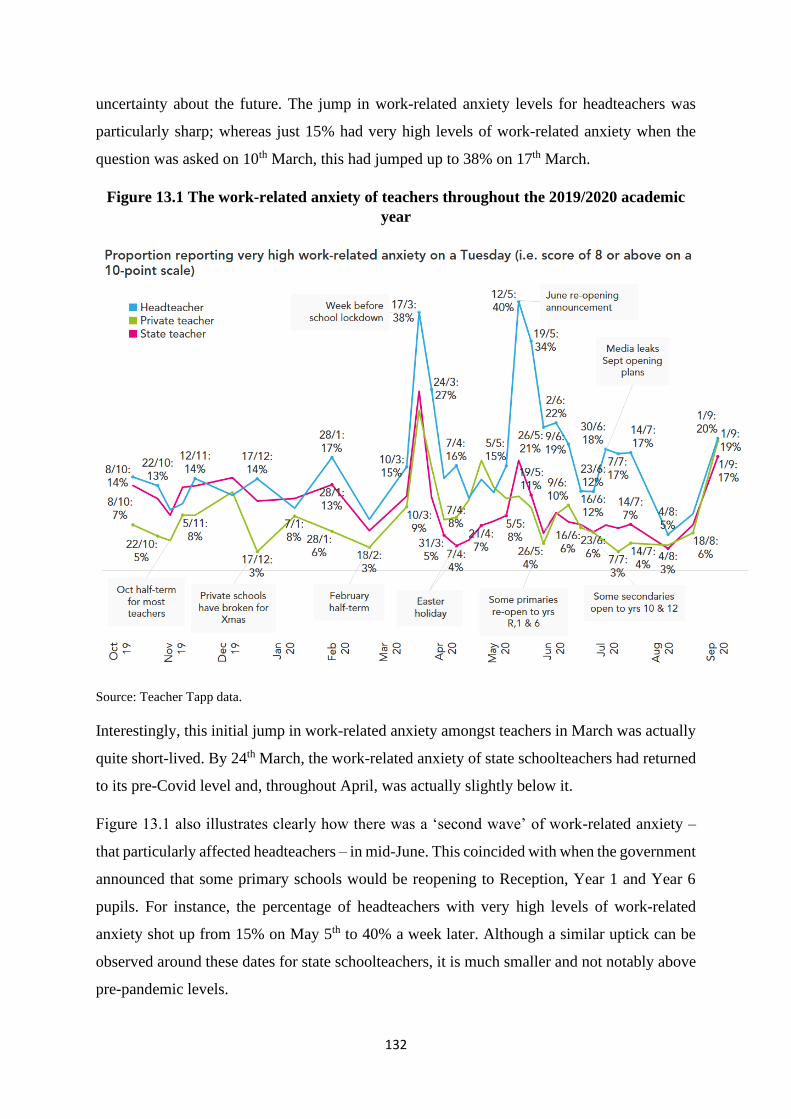
132
uncertainty about the future. The jump in work-related anxiety levels for headteachers was
particularly sharp; whereas just 15% had very high levels of work-related anxiety when the
question was asked on 10th March, this had jumped up to 38% on 17th March.
Figure 13.1 The work-related anxiety of teachers throughout the 2019/2020 academic
year
Source: Teacher Tapp data.
Interestingly, this initial jump in work-related anxiety amongst teachers in March was actually
quite short-lived. By 24th March, the work-related anxiety of state schoolteachers had returned
to its pre-Covid level and, throughout April, was actually slightly below it.
Figure 13.1 also illustrates clearly how there was a ‘second wave’ of work-related anxiety –
that particularly affected headteachers – in mid-June. This coincided with when the government
announced that some primary schools would be reopening to Reception, Year 1 and Year 6
pupils. For instance, the percentage of headteachers with very high levels of work-related
anxiety shot up from 15% on May 5th to 40% a week later. Although a similar uptick can be
observed around these dates for state schoolteachers, it is much smaller and not notably above
pre-pandemic levels.

133
Finally, what happened as the new (2020/21) academic year began? While state and private
schoolteachers had enjoyed a period between June and August where fewer were feeling very
high levels of work-related stress, this shot up (above trend) come September. Specifically,
pre-pandemic around 7% of private schoolteachers and 13% of state schoolteachers had very
high levels of work-related anxiety. During June to August, the analogous figures were around
3% (private) and 6% (state) respectively. Once September hit, however, a big increase occurred
(see the right-hand side of Figure 13.1). Now 17% of private schoolteachers (a percentage well
above the pre-Covid trend level) and 19% of state teachers were highly anxious about work.
One of the standout features of Figure 13.1 is how headteachers had a very different experience
of work throughout lockdown than teachers – with much higher (and more sharply increasing)
anxiety levels. This was likely due to having to manage a number of novel complex
administrative and pastoral tasks. Their duty of care towards their staff and students, especially
the vulnerable ones, likely became hard to manage. It is also noticeable how their anxiety often
rose in response to rumours rather than policy changes: for example, it rose on July 21st in
response to the media leaking the plans for September reopenings, which were then announced
towards the end of the week.
This extended period of stress for headteachers, which has extended throughout school
holidays, may have long-term consequences for retention. This is illustrated in Figure 13.2,
where results are presented for a question asked to the Teacher Tapp panel about their plans to
reduce hours or leave the profession in the future (asked on 24th June 2020). At this point, one
in five headteachers felt that the experience has made it more likely that they will seek to leave
the profession, compared to around one in ten of middle leaders and class teachers. Whilst
moving professions is particularly difficult during an economic downturn, this may mean that
headteachers who are closer to retirement might choose to leave their jobs earlier than
previously planned.

134
Figure 13.2 The impact of the Covid-19 pandemic on teachers’ and headteachers’ future
work plans
Source: Teacher Tapp data.
Another key feature of Figure 13.1 worthy of further consideration is the difference between
private and state schoolteachers. In pre-Covid times, private schoolteachers tend to report lower
work-related anxiety than those in the state sector. This, however, switched during lockdown.
One potential explanation for this finding is offered in Figure 13.3, which documents the
percentage of teachers with high levels of work-related anxiety by the type of teaching they
delivered (question asked 5th May 2020).
From this graph, two key features stand out. First, providing live teaching with student
interaction was generally the most stressful activity, followed by pre-recorded videos. Second,
such activities were much more likely to be delivered by private schoolteachers than their state
school peers. For instance, Figure 13.3 suggests that almost three quarters of private school
pupils received live, interactive teaching during lockdown, compared to around one in twenty
state schoolteachers. This may explain differences in anxiety levels between private and state
teachers: one third of teachers who were delivering ‘live’ instruction reported relatively high
anxiety levels that day. One important caveat, however, is that these levels of anxiety are
actually quite similar to the levels reported by teachers earlier in the year before lockdown.
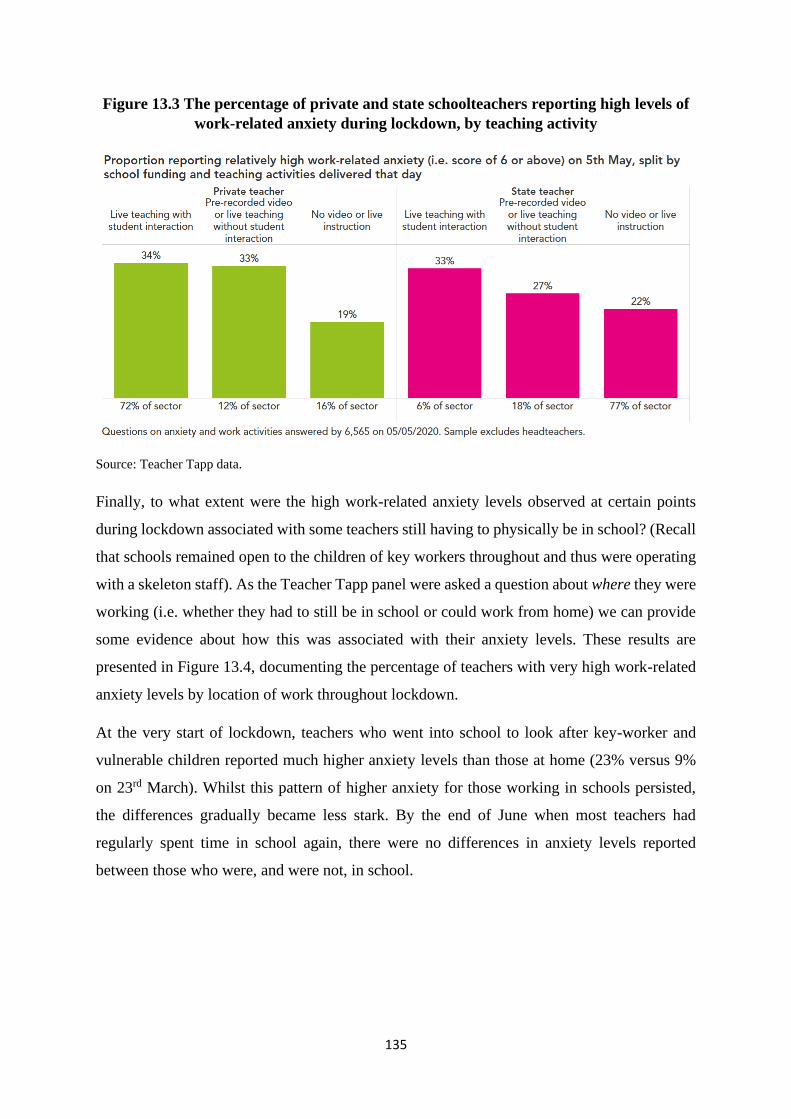
135
Figure 13.3 The percentage of private and state schoolteachers reporting high levels of
work-related anxiety during lockdown, by teaching activity
Source: Teacher Tapp data.
Finally, to what extent were the high work-related anxiety levels observed at certain points
during lockdown associated with some teachers still having to physically be in school? (Recall
that schools remained open to the children of key workers throughout and thus were operating
with a skeleton staff). As the Teacher Tapp panel were asked a question about where they were
working (i.e. whether they had to still be in school or could work from home) we can provide
some evidence about how this was associated with their anxiety levels. These results are
presented in Figure 13.4, documenting the percentage of teachers with very high work-related
anxiety levels by location of work throughout lockdown.
At the very start of lockdown, teachers who went into school to look after key-worker and
vulnerable children reported much higher anxiety levels than those at home (23% versus 9%
on 23rd March). Whilst this pattern of higher anxiety for those working in schools persisted,
the differences gradually became less stark. By the end of June when most teachers had
regularly spent time in school again, there were no differences in anxiety levels reported
between those who were, and were not, in school.
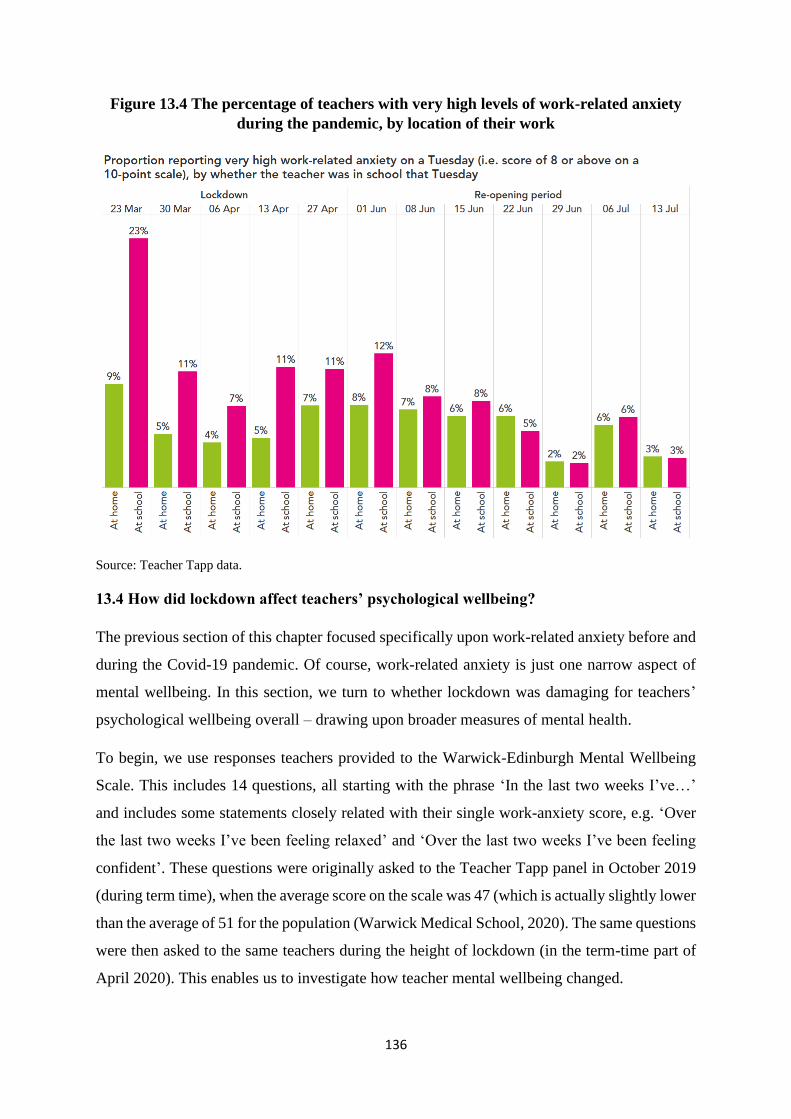
136
Figure 13.4 The percentage of teachers with very high levels of work-related anxiety
during the pandemic, by location of their work
Source: Teacher Tapp data.
13.4 How did lockdown affect teachers’ psychological wellbeing?
The previous section of this chapter focused specifically upon work-related anxiety before and
during the Covid-19 pandemic. Of course, work-related anxiety is just one narrow aspect of
mental wellbeing. In this section, we turn to whether lockdown was damaging for teachers’
psychological wellbeing overall – drawing upon broader measures of mental health.
To begin, we use responses teachers provided to the Warwick-Edinburgh Mental Wellbeing
Scale. This includes 14 questions, all starting with the phrase ‘In the last two weeks I’ve…’
and includes some statements closely related with their single work-anxiety score, e.g. ‘Over
the last two weeks I’ve been feeling relaxed’ and ‘Over the last two weeks I’ve been feeling
confident’. These questions were originally asked to the Teacher Tapp panel in October 2019
(during term time), when the average score on the scale was 47 (which is actually slightly lower
than the average of 51 for the population (Warwick Medical School, 2020). The same questions
were then asked to the same teachers during the height of lockdown (in the term-time part of
April 2020). This enables us to investigate how teacher mental wellbeing changed.

137
Interestingly, the overall scale score between the two occasions did not alter; the average score
was 47 in October 2019 (pre-pandemic) compared to a very slight increase in wellbeing up to
48 in April 2020 (height of lockdown).
This, however, masks some very large changes in a few of the 14 sub-questions that form the
scale. Specifically, Figure 13.5 illustrates the six questions where the biggest swings were
observed. It seems that the lockdown may have impacted different aspects of teachers’
wellbeing in different ways. Teachers were, for instance, more likely to say they felt loved
often or all of the time in April 2020 (69%) than in October 2019 (58%). A similar improvement
can be observed for whether teachers felt they had energy to spare (34% versus 7%), were
feeling relaxed (37% versus 15%) and had been thinking clearly (57% versus 45%). Balancing
this out in the other direction, however, was the fact that teachers were less likely to say they
were feeling useful in April 2020 than in October 2019 (decline from 60% to 44%), optimistic
about the future (decline from 39% to 30%), or interested in new things (decline from 42% to
27%).
Figure 13.5 Questions on the Warwick-Edinburgh Mental Wellbeing Scale with the
biggest changes during lockdown
Source: Teacher Tapp data.

138
One inference one can draw from the above seems to be that, although the huge change in the
day-to-day activities may have changed specific aspects of teachers’ mental wellbeing, it may
not have caused it to materially deteriorate overall. However, the Teacher Tapp panel were also
asked at three points during lockdown (10th April, 14th May and 17th June) about whether they
felt that the Covid-19 outbreak had a negative impact on their psychological health. Answers
to this more direct, subjective question about lockdown experiences were rather different, as
illustrated by Figure 13.6. On each of the three occasions, over two thirds of teachers agreed
that the impact had been negative, which is at odds with the changes in the Warwick-Edinburgh
scale (see Figure 13.5 above) and their fall in work-related anxiety (see Figure 13.1).
Figure 13.6 Teachers subjective views on how the Covid-19 pandemic had affected their
psychological health during lockdown
Source: Teacher Tapp data.
13.5 Were female teachers more anxious about work during lockdown than men?
There has been much debate about the differential effect that the Covid-19 crisis has had upon
men and women. It has been widely reported that women have borne the brunt of childcare and
home schooling during lockdown (Power, 2020), with many families trying to manage work
and family responsibilties at the same time (Oppenheim, 2020). It has hence been suggested
that Covid-19 has the potential to be disastrous for gender equality (Savage, 2020). Moreover,
the burden of juggling home and work life throughout this crisis has clear potential implications
for work-related anxiety, with many families having the same amount of time to cope with

139
more responsibilities. This section hence considers whether the pandemic differentially
affected the work-related anxiety of male and female teachers.
In total, 3,034 teachers (858 male and 2,176 female) answered the work-related anxiety
question the 12 times it was asked between mid-March and the end of June. Figure 13.7
illustrates how raw (unadjusted) gender gaps in work-related anxiety played out during the
pandemic.
Figure 13.7. Gender differences in work-related anxiety during the Covid-19 pandemic
(unconditional)
Notes: the breaks in the data represent Easter and half-term holidays where teachers were less likely to be working.
Source: Teacher Tapp data.
From Figure 13.7, there are two key points to note. First, for both men and women, work-
related anxiety peaked just before lockdown was announced. The average anxiety score for
men (women) was around five (six) out of ten on 17th March, but this fell by one whole point
on the zero-to-ten scale by 24th March (the day after lockdown was announced). The trend in
work-related anxiety has then been broadly flat thereafter. Second, the gender gap has been
stable throughout the lockdown period. Women have consistently scored around 0.7 points
higher on the work-related anxiety scale than men.
Of course, women may be more anxious about work than men during ‘normal’ times. And the
data we collected suggested that this is indeed the case. In the term before the pandemic, female
teachers scored higher on the work-related anxiety scales than males (average anxiety scores
0
1
2
3
4
5
6
7
17/0324/0331/0307/0414/0421/0428/0405/0512/0519/0526/0502/0609/0616/0623/0630/06
Average anxiety score
Men
Women

140
of 4.07 versus 3.63). There are, of course, other differences as well, such as women being more
likely to work in primary schools than men, which may also be linked to anxiety levels during
the pandemic.
Figure 13.8 hence replots lockdown trends in work-related anxiety for male and female
teachers, but now accounting for gender differences in the school phase in which they work,
whether they work in a private/state school, age and – critically – pre-Covid-19 anxiety levels.
It seems that these factors can explain some – although not all – of the gender gap in work-
related anxiety during the pandemic. In other words, although the dashed and dotted trend lines
are closer together in this second chart than they were in the first, there is still a clear and
consistent difference between men and women. This, in turn, implies that the lockdown caused
by the Covid-19 crisis led gender differences in work-related anxiety amongst teachers to
slightly increase.
Figure 13.8 Gender differences in work-related anxiety during the Covid-19 pandemic
(conditional)
Notes: Controlling for age, primary/secondary, state/private and pre-Covid-19 anxiety levels. Source: Teacher
Tapp data.
0
1
2
3
4
5
6
7
17/03 24/03 31/03 07/04 14/04 21/04 28/04 05/05 12/05 19/05 26/05 02/06 09/06 16/06 23/06 30/06
Average anxiety score
Men (conditional)
Women (conditional)

141
Of course, the association between gender and work-related anxiety during the pandemic may
be affected by household composition – including whether teachers are living with children or
not. Figure 13.9 hence considers gender differences in work-related anxiety during lockdown
depending on whether they lived in a household with children or not (again, accounting for
pre-Covid anxiety levels).
Figure 13.9 Differences in work-related anxiety by gender and children at home
(conditional)
Notes: Controlling for age, primary/secondary, state/private and pre COVID-19 anxiety levels. Source: Teacher
Tapp data.
It appears that those teachers with children at home felt more anxious about work throughout
lockdown (over and above pre-Covid anxiety levels) – particularly the period between mid-
April and mid-May. However, the gender gap in work-related anxiety is of similar magnitude
between those with and without children at home. In other words, it was not just female teachers
with children who felt more stressed about work than men; a clear gender gap can also be
observed between men and women who are not parents.
Nevertheless, some big differences between groups can be clearly seen in Figure 13.9. For
instance, in April and May there was a difference of around 1.5 points on the zero-to-ten scale
between men without children and women with children. It is also interesting to note that
female teachers without children were roughly as anxious about work as men who had children
at home (again, conditional upon pre-Covid anxiety levels).
0
1
2
3
4
5
6
7
17/03 24/03 31/03 07/04 14/04 21/04 28/04 05/05 12/05 19/05 26/05 02/06 09/06 16/06 23/06 30/06
Average anxiety score
men, no kids
women, no kids
men, kids
women, kids

142
Finally, Figure 13.10 considers whether there was a difference between single- and two-parent
households. Intuitively, one might expect that the burden of combining work and parenting
during lockdown would be harder for single parents. However, there actually seemed to be
little difference in work-related anxiety between teachers living in single- and two-parent
households. Throughout lockdown, single parent teachers seemed to cope with the challenges
of juggling their work with their home life just as well as those living with a partner to share
the load.
Figure 13.10 Differences in work-related anxiety between single- and two-parent
families (conditional)
Notes: Controlling for age, primary/secondary, state/private and pre-Covid-19 anxiety levels. Source: Teacher
Tapp data.
13.6 Summary
The Covid-19 pandemic was unforeseen, yet has had a major impact upon all of our lives. For
teachers, the lockdown and reopening of schools had the potential to have a major impact upon
their working lives. Yet whilst work-related anxiety rose for headteachers and (to a lesser
extent) private schoolteachers, lockdown was not generally associated with higher work-
related anxiety in state school classroom teachers. On the one hand, the profession was plunged
into unfamiliar working patterns which particularly affected headteachers. On the other hand,
some of the day-to-day stress of managing students in classrooms was removed.
Of course, work-related anxiety is just one narrow aspect of mental wellbeing. Our results using
broader measures were more mixed. We found that overall levels of wellbeing amongst
teachers – as measured by the Warwick-Edinburgh Mental Wellbeing Scale – did not change
between October 2019 (pre-pandemic) and April 2020 (the height of lockdown). However,
0
1
2
3
4
5
6
7
17/0324/0331/0307/0414/0421/0428/0405/0512/0519/0526/0502/0609/0616/0623/0630/06
Average anxiety score
Two parent (conditional)
Single parent (conditional)

143
different aspects of wellbeing may have been impacted in different ways, with teachers having
more energy and feeling more loved, but also being less likely to feel useful and optimistic
about the future. Moreover, when asked directly about their pandemic experiences, teachers
were more likely to agree than disagree that it had negatively impacted their mental health.
We have also presented some evidence of work-related anxiety amongst some groups being
more impacted than others. In particular, lockdown seems to have increased work-related
anxiety amongst female teachers slightly more than male teachers, with there also being a
bigger impact upon those with children in the household (irrespective of gender). Little
difference was observed, however, between single- and two-parent families.
The pandemic is, of course, not yet over. And we don’t really know what the future might bring
in terms of local lockdowns and potential further waves. But we do know a lot more about
Covid-19 and the impact it has on people. Although most of the focus has of course been on
the physical health impacts, we are also developing a better understanding of the mental health
implications as well.

144
Chapter 14 Conclusions
Key findings
A set of key overarching findings have emerged within this report. Six of the most important
of these are set out below.
Key finding 1. Teachers do not have lower levels of wellbeing than other occupational groups.
The first major headline result is that – against conventional wisdom within the education
community – there is no evidence from this project that teachers have worse mental health and
wellbeing outcomes than other occupational groups. This has been demonstrated within various
chapters throughout this report, including direct occupational comparisons made across
multiple datasets (Chapters 3 and 4), investigating whether mental health and wellbeing
outcomes of former teachers improve once they have left the teaching profession (Chapter 8)
and investigations of the change in the wellbeing of early career teachers before and after
joining the teaching profession (Chapter 7). The main thrust of the results presented in each of
these chapters is that mental health and wellbeing amongst teachers is broadly similar – and in
some instances somewhat better – than other professional workers. The comprehensive
evidence presented here – representing, we believe, the most extensive investigation of this
issue to date – dispels the myth that teachers have particularly low levels of wellbeing.
This important finding does go against some – although not all – of the existing literature. For
instance, when reviewing the existing evidence base in Chapter 1, we noted how several
descriptive studies have found mental health outcomes of teachers to be particularly poor
(Johnson et al., 2005, Kidger et al., 2016, Rose, 2003, Stansfeld et al., 2011). Yet there were
also other recent studies that have disputed such claims (Bryson, Stokes & Wilkinson, 2019).
Our work clearly supports the more sceptical views expressed in the latter. It is, however, worth
taking a moment to speculate what might be driving these divergent results and, more
generally, why the myth of teachers suffering from particularly low levels of wellbeing
continues.
We believe that there are at least five plausible explanations. First, some of the most widely
cited studies in this area either do not use representative samples (e.g. Johnson et al., 2005,
Travers et al., 1993) or do not draw comparisons between teachers and workers in other
occupational groups (e.g. Liberal Democrats, 2018). Second, studies differ in their attempts to
account for ‘selection’ into the teaching profession (e.g. the possibility that individuals who
145
are more likely to suffer from lower levels of wellbeing are more likely to choose to become
teachers). Third, evidence from some of the studies often quoted in the media illustrating the
mental health issues of teachers is actually more mixed than first appears (Bamford & Worth,
2017). Fourth, there may be problems with publication bias, where only headline-grabbing
results get reported, published and then promoted within the media. Relatedly, there is likely
to be selected use of the evidence base by various interest groups, for whom results suggesting
that teachers have particularly low levels of wellbeing are likely to help their cause. Finally,
results using survey data could depend heavily upon the context in which the questions are
asked. For instance, most of the data used within this report has been drawn from general
purpose household surveys (e.g. the Labour Force Survey), where individuals are asked a set
of questions about their mental health as a part of a much broader questionnaire (and when not
thinking directly in the context of their job). Yet other surveys, such as TALIS, are very much
conducted in an occupation-specific context about teaching – which may lead to quite different
results.
Key finding 2. Teachers’ working hours and mental health outcomes have remained broadly
stable since at least the 1990s
Another common narrative that often emerges about teaching is that things are getting worse –
hours of work are increasing and the mental health of staff is on the decline. This report has
also presented new, comprehensive evidence on these two important issues. Overall, the weight
of the evidence is not consistent with such claims. Using data from the Labour Force Survey,
Chapter 9 illustrates no clear pattern in teachers’ working hours since the early 1990s (for either
primary or secondary staff). Likewise, although Chapter 5 suggests more teachers now report
having a mental health issue than around ten years ago, a similar trend is found for other
occupational groups, with there being no clear and consistent pattern (in either direction) when
it comes to broader measures of wellbeing. Although this again perhaps contradicts
conventional wisdom amongst the education community, this report presents, to our
knowledge, the first attempt to quantify the mental health and wellbeing outcomes of teachers
in England over an extended period of time.
Our results for teachers’ working hours remaining stable conflict with recent results from the
Department for Education’s Teacher Workload Survey. This suggests that there was a big spike
upwards in teachers’ working hours between 2010 and 2016, before a decline again in 2019.
In additional work produced as part of this project (Allen et al., 2019), we discuss in detail the

146
challenges with measuring teachers’ working hours reliably, highlighting key issues with the
Teacher Workload Survey in its current form. Specifically, the conflict with our findings and
those from the Teacher Workload Survey could be due to the latter’s low response rates
(forming little more than a convenience sample), methodological changes over time, data
collection occurring at a single point in the academic year and the potential measurement error
in the questions used. More generally, it is important for readers to remember that the evidence
presented in this report refers to working hours of teachers only. It is possible that over the
same time horizon, workload (i.e. the amount of work teachers are trying to fit into these hours)
has indeed changed.
Nevertheless, our findings suggest that an increase in total working hours is unlikely to explain
the widely reported decline in teacher retention in England. This is for the simple reason that
total working hours have not increased very much, particularly among secondary teachers,
where the decline in teacher retention has been most marked. Changes in the composition of
working hours after 2013 are also very unlikely to be the cause of declining teacher retention,
for the same reason. We cannot, however, rule out the possibility that changes in the
composition of working hours occurring prior to 2013 are to blame. In any case, these findings
suggest that workload may have been given undue emphasis in the debate on teacher retention.
Policymakers might therefore be better off focusing on other, better evidenced approaches to
improving retention, such as increasing teacher pay, improving school leadership and
improving working conditions (Bueno & Sass, 2018; Feng & Sass, 2018; Kraft, Marinell &
Yee, 2018; Jacob et al., 2015).
Key finding 3. Lesson preparation and marking are two of the key aspects of teacher workload
that have the strongest association with teachers’ perceived stress
This report has provided new evidence on the association between workload and teacher
wellbeing, presenting evidence from across five predominately English-speaking countries
(Chapter 10). A key, consistent finding across these five nations is that two aspects of teachers’
jobs are particularly strongly associated with their workload stress: lesson planning and
marking. For instance, each additional hour spent upon marking is associated with a sizable
(0.06 standard deviation) increase in stress in the workplace. This is in contrast to other aspects
of the job, such as time spent teaching and working with colleagues/professional development,
which seem to have little direct effect upon teachers’ quality of working life. In additional
analysis (presented in Jerrim and Sims, 2020b) we also illustrate how this may even be an

147
underestimate, given how self-reported working hours of teachers is subject to a degree of
measurement error.
These findings are in many ways consistent with previous literature on this topic. Much
previous research – both in England and internationally – has found many teachers to be
dissatisfied with their workload (Cooper-Gibson, 2018; Lam & Yan, 2011; Perryman &
Calvert, 2019). However, previous research (like our own findings) emphasise that certain
aspects of workload are viewed more negatively than others. Most notably, other scholars have
also argued that the growing demands of assessment, marking and data entry, often in order to
comply with (perceived) demands of accountability systems, are particularly unpopular with
teachers (Bradbury & Roberts-Holmes, 2018; Perryman & Calvert, 2019; Selwin, Nemorin, &
Johnson, 2017).
Key finding 4. Countries with high-stakes accountability systems are only weakly associated
with teacher perceptions of accountability-induced stress
England has an extensive system of school accountability, through a mixture of Ofsted
inspections, high-stakes national examinations and the publication of school ‘league tables’.
Many suggest that such high-stakes accountability systems harm teachers’ job satisfaction,
wellbeing and mental health. The analysis presented in this report (Chapter 11) has indeed
found a modest, positive correlation between school-system accountability and how stressed
teachers and headteachers report being about being responsible for pupil achievement
(correlation ≈0.3). Yet this association is far from perfect, with several examples of high-
accountability school systems where only a comparatively small proportion of staff report
feeling stressed (e.g. the United States).
Our findings are thus only partially consistent with previous work in this area. Specifically,
although we find a positive association between school-system accountability and teacher
stress around this aspect of their job, the evidence of a link does not appear as overwhelming
as many perhaps believe. Indeed, in general, this is an area where we believe further work is
needed and the evidence base needs to be further strengthened. Much existing research in this
area has been conducted in a single national setting (often the United States), has been
qualitative in nature and been relatively small scale. Although the analysis presented in this
report is based upon large, nationally representative data, it also has clear limitations. In
particular, it has been based upon perceptions of stress reported by teachers (rather than
standardised instruments), the analysis has been conducted at the country level with a limited

148
number of observations, with estimates capturing correlation rather than causation. Hence,
despite the current school accountability system being disliked by many teachers in England,
there is still a dearth of high-quality quantitative evidence on the impact school accountability
has upon the wellbeing of the teaching profession.
Key finding 5. Teachers tend to feel more stressed about accountability when their colleagues
do as well
Our work on accountability (Chapter 11) has also considered the extent that stress about
accountability is ‘clustered’ within certain schools. We have found clear evidence of some
degree of ‘emotional contagion’ of accountability-induced stress, with an individual being
much more likely to feel under pressure from this aspect of their job if their colleagues do as
well. An important caveat is that this refers to the relationship of accountability-induced stress
amongst teaching staff. In contrast, there is only a weak relationship between how stressed
headteachers feel about accountability and the stress felt by staff. One potential explanation for
this finding is that the management practices of headteachers who feel under pressure from
accountability do not seem to differ much from those that do not feel stressed by this part of
their work.
Although there has been little previous research on this topic, our findings are consistent with
the small amount of other work that does exist. For instance, previous research from Canada
has suggested that such emotional contagion may exist within schools (Oberle & Schonert-
Reichl, 2016), though this focuses upon the flow between teachers and children. On the other
hand, our findings contrast with those of Sy, Cote and Saavedra (2005) – conducted outside of
an education setting – which suggested that the emotions of some team members – most notably
senior leaders (e.g. headteachers) – may be more contagious than others. The most notable
limitation with this evidence base (including our contribution) is that it is mostly based upon
cross-sectional data, and has demonstrated the presence (or absence) of a correlation, rather
than establishing causation. This highlights how there is a pressing need for more longitudinal
data on teachers, allowing researchers to monitor how their levels of stress and wellbeing
change as they get promoted, when school management changes or they move to another job.

149
Key finding 6. Supportive leadership may help to improve teacher retention through improving
job satisfaction and reducing workload stress
In Chapter 12, we investigated how five facets of the working environment (supportive
leadership, workload, collaboration, preparation, disciplinary climate) are related to teacher
retention, job satisfaction and workplace wellbeing. The factor of the work environment that
was the single strongest predictor of each of these three outcomes was having supportive
leadership. Specifically, supportive leaders are likely to retain staff via improving job
satisfaction and reduced workplace stress. This is consistent with previous research which has
suggested that the quality of teachers’ working environments has an important influence on
retention (Simon & Johnson, 2015). In particular, supportive school leadership has repeatedly
been found to predict teachers staying in their jobs (Boyd et al., 2011; Ladd, 2011; Kraft et al.,
2016).
Of the other aspects of the working environment we consider, previous research has produced
conflicting findings on the importance of disciplinary standards for retention (Boyd et al., 2011;
Kraft et al., 2016). We provide the first evidence that discipline does predict retention in the
profession overall and that this relationship is almost as strong as for supportive leadership.
We also found that conflicting findings from the existing literature about the importance of
workload for retention (Johnson et al., 2005; Ladd, 2011) can be reconciled based on
distinguishing individuals who chose to enter the profession in part because it was consistent
with personal commitments. On the other hand, preparation for teaching assignments were not
found to be robustly associated with job satisfaction, workplace stress or retention.
Limitations and future research
Despite the important findings highlighted above, the research we have conducted has
limitations. This is at least partly due to the quality and quantity of data available on teachers
in England. As we discuss in our policy recommendations below, this in itself needs to be
addressed.
The clearest limitation of this work is that much of the data we have analysed has been
(repeated) cross sections, with each teacher typically surveyed at only one time point. Where
longitudinal data has been used (e.g. Chapter 7 in our investigations of early career teachers)
sample sizes have been small. This means that, although we can track at a population level
general trends occurring within the teaching profession, it is not possible to tease out the drivers

150
of improving or declining mental health affecting individuals. As we discuss below, a large-
scale longitudinal study of teachers is needed to generate the next step in the evidence base.
Second, throughout this report Standard Occupational Classification (SOC) and Standard
Industrial Classification (SIC) codes have often been used to identify teachers within the
datasets, as is standard within the literature. These classification systems do, however, have
limitations when it comes to identifying teachers. Data is sometimes only made available at an
aggregate level (e.g. in the Health Survey for England dataset used in Chapter 5) meaning it
has occasionally been possible to only identify ‘educational professionals’, rather than teachers
per se. Similarly, through both this issue and limited sample sizes, often different groups of
teachers need to be analysed as a single group (e.g. primary and nursery staff). There will
inevitably also be some classification error when using these classification systems to identify
teachers, which is a particular challenge when attempting to understand entry and exit from the
teaching profession. Ideally, in the future, links could be made between survey (e.g. the Labour
Force Survey) and administrative data (e.g. the School Workforce Census), in order to identify
teachers in such data as accurately and consistently as possible.
Third, despite our best efforts, there continue to be limitations with measurement of mental
health outcomes. We believe our use of objective data (e.g. prescription of antidepressant
medications) represents an important innovation in this area. Yet more could still be done.
Ideally, one would be able to gather such information from primary care records linked to the
School Workforce Census. This would enable researchers to better measure objectively mental
health treatment amongst different subgroups of teachers, and how this changes during their
career. Similarly, as noted above, further work is needed as to how the specific survey
instrument used influences subjective responses to questionnaire items.
Fourth, Chapter 6 presented – to our knowledge – the first evidence on how the work-related
anxiety of teachers changes over the course of an academic year. This analysis has, however,
been limited by sample size. An intended aim of this project was to probe this issue in much
more detail, using large-scale survey data from Teacher Tapp. Unfortunately, this was
ultimately not possible due to the impact of the Covid-19 pandemic. We nevertheless believe
that this is an important area ripe for further research, particularly with respect to how the
mental health and wellbeing of teachers is impacted by the approach of high-stakes exams.
Finally, most of the data presented in this report (with the exception of Chapter 13) refers to a
pre-Covid-19 era. Teachers are currently facing particular challenges, having a public-facing

151
job and working in increasingly difficult circumstances. In Chapter 13, we have investigated
how teachers’ work-related anxiety was impacted during the first national lockdown and the
early stages of the pandemic. However, in this ever-evolving environment, there is clearly
much more to be learned.
Recommendations
Despite these limitations, we believe the findings in this report have important implications for
policy, public debate and practice surrounding teacher mental health. We thus offer the
following set of recommendations:
• Policymakers, school leaders, teachers and their unions should challenge the received
wisdom that teaching is more stressful than other occupations. This is important so as
not to dissuade people from entering the teaching profession.
• There are two clear areas where reducing teachers’ workloads would likely reduce
stress: lesson preparation and marking. With respect to the lesson preparation, perhaps
the easiest thing that policymakers can do is reduce examination, curriculum and
inspection reforms. On marking, there is a strong case to be made for teachers to spend
less time on this activity, either by focusing upon a smaller subset of pupils’ work or
by using whole-class oral feedback rather than individualised written marking.
• School leaders can reduce stress and improve retention by consulting and involving
teachers in decision-making processes, supporting their professional development and
explicitly recognising staff for their work. In addition, school leaders looking to
improve job satisfaction and retention are advised to prioritise improving disciplinary
standards in the school. This can be achieved by ensuring that all staff are aware of
whole-school standards for behaviour and are supported in consistently enforcing them.
• The Department for Education have committed to producing robust evidence on teacher
workload bi-annually. We support this, but believe that the government’s workload
survey should be reformed. The response rates are low and the absence of diary method
data collection means it adds little value over other routinely collected data sources (e.g.
TALIS and the LFS). Our suggestion is therefore that the Department for Education’s
workload survey be revised so that a truly representative sample of teachers’ complete
Time Use diaries. This will, no doubt, be relatively costly and require close co-
operation and buy-in from across the sector (particularly teacher unions). Yet the
experience of other countries has shown that this is possible (e.g. a large, representative
sample of teachers has recently completed Time Use diaries as part of a recent study in

152
Belgium) and our empirical analysis of a small sample of Time Use diaries completed
by teachers in the UK illustrates the interesting insights that such data can provide.
Collection of such diaries would likely lead to an appreciable increase in data quality,
while also greatly enhancing our understanding of the broader lives (and commitments)
of teachers.
• The Department for Education could monitor the mental health of teachers in the future
via planned data collections. For instance, the Department for Education has recently
announced they are commissioning a longitudinal study of teachers in England
(https://schoolsweek.co.uk/new-flagship-study-to-solve-why-teachers-leave/). This
welcome innovation in the landscape on data about teachers in England should include
a focused battery of questions about mental health. The measures analysed in this paper
(e.g. the GHQ or the ONS personal wellbeing questions) would be obvious candidates,
with it then possible to also triangulate the evidence against other routinely collected
secondary data sources (e.g. data gathered within the Annual Population Survey). This
longitudinal study could then be used to track teacher wellbeing over time, how it
changes throughout their career and how this affects their movements into and out of
the teaching profession.
• An additional way the Department for Education could keep track of teachers’ mental
health is via administrative data. For instance, data from England’s Teacher Workforce
Census could be linked to Hospital Episode Statistics and/or primary care records, both
of which contain information about medical treatments received for mental ill health.
Such a resource would provide a step change in our understanding of the epidemiology
of the mental and physical health of teachers in England, and provide a cost-effective
way to track changes in the health of teachers over time. This would facilitate a more
robust picture of the proportion of teachers who suffer from serious mental health issues
and potentially enabling more efficient targeting of resources to support those at
greatest risk of suffering problems. Together, this would represent a step-change in the
evidence available, providing vital new insights that this important area of research
desperately needs.
• We don’t yet know a lot about the impact of the Covid-19 crises on the teaching
profession, both in terms of their health and the longer-term implications for
recruitment and retention in the profession. This should be included as one of the key
topics of focus in the Department for Education’s new longitudinal study of teachers.

153
References
Allen, R., Benhenda, A.,Jerrim, J. and Sims, S. 2019. New evidence on teachers’ working
hours in England. An empirical analysis of four datasets. Research Papers in Education.
Alvaro, P., Roberts, R. and Harris, J. K. 2013. A systematic review assessing bidirectionality
between sleep disturbances, anxiety and depression. Sleep. 36 (7), 1059–1068.
Appleton, A. and James, R. 2018. Adults (18-75) in the UK who drink alcohol for coping
reasons. Drinkaware research report. Accessed 26/03/2021 from
at: https://www.drinkaware.co.uk/media/1852/drinking-to-cope-jan-2018.pdf
Baines, D. and Blatchford, P. 2019. School break and lunch times and young people’s social
lives: a follow-up national study. Nuffield Foundation report. Accessed 31/07/2019 from
https://www.nuffieldfoundation.org/sites/default/files/files/Baines%2042402%20BreaktimeS
urvey%20-%20Main%20public%20report%20(May19)-Final(1).pdf
Bamford, S. and Worth, J. 2017. Is the grass greener beyond teaching? Slough: NFER.
Accessed 04/07/2019 from https://www.nfer.ac.uk/teacher-retention-and-turnover-research-
research-update-3-is-the-grass-greener-beyond-teaching
Beckie, T. M. 2012. A systematic review of allostatic load, health, and health
disparities. Biological Research for Nursing 14(4): 311-346.
Bellingrath, S., Rohleder, N. and Kudielka, B. M. 2010. Healthy working schoolteachers with
high effort–reward-imbalance and overcommitment show increased pro-inflammatory immune
activity and a dampened innate immune defence. Brain, Behavior, and Immunity 24(8): 1332-
1339.
Benatti, F. B. and Ried-Larsen, M. 2015. The effects of breaking up prolonged sitting time: a
review of experimental studies. Medicine & Science in Sports & Exercise 47(10): 2053-61.
Berryhill, J., Linney, J. and Fromewick, J. 2009 The effects of educational accountability on
teachers: are policies too stress provoking for their own good? International Journal of
Education Policy and Leadership 4(5) 1-13.
Bitler, M., Corcoran, S., Domina, T. and Penner, E. 2019. Teacher effects on student
achievement and height. A cautionary tale. NBER Working Paper No. 26480.
Boyd, D., Grossman, P., Ing, M., Lankford, H., Loeb, S. and Wyckoff, J. 2011. The influence
of school administrators on teacher retention decisions. American Educational Research
Journal 48(2): 303-333.
Bradbury, A. and Roberts-Holmes, G. 2018. The datafication of primary and early years
education: Playing with numbers. Routledge.
Brill, F., Grayson, H., Kuhn, L. and O’Donnell, S. 2018. What impact does accountability have
on curriculum, standards and engagement in education? A literature review. Slough: NFER.
Accessed 09/01/2020 from
https://www.nfer.ac.uk/media/3032/nfer_accountability_literature_review_2018.pdf

154
Bryson, A., Stokes, L. and Wilkinson, D. 2019. Who is better off? Wellbeing and commitment
among staff in schools and elsewhere. Education Economics DOI:
10.1080/09645292.2019.1623178
Bueno, C. and Sass, T. R. 2018. The effects of differential pay on teacher recruitment, retention
and quality. Accessed 07/07/2020 from http://sites.gsu. edu/cbueno1/files/2014/02/The-
Effects-of-Differential-Pay-on-Teacher-Recruitment- 9b-plus-abstract-2bjl269.pdf
Bulman, M. 2018. More than half of teachers have been diagnosed with mental health issues,
study shows. The Independent 23rd January 2018. Accessed 26/03/2021
from https://www.independent.co.uk/news/uk/home-news/uk-teachers-mental-health-
diagnose-issues-targets-education-school-pupils-exams-
a8174101.html (accessed 19 July2019) [Google Scholar]
Busby, E. 2018. Two in five newly qualified teachers experience mental health problems, new
study reveals. The Independent 21st October 2018. Accessed 26/03/2021
from: https://www.independent.co.uk/news/education/education-news/teachers-mental-
health-anxiety-panic-attacks-insomnia-education-a8592551.html
Cameron, D. 2010. PM speech on wellbeing. Accessed 07/07/2020 from
https://www.gov.uk/government/speeches/pm-speech-on-wellbeing
Chadi, A. and Hetschko, C. 2018. The magic of the new: How job changes affect job
satisfaction. Journal of Economics & Management Strategy 27(1): 23-39.
Chandola, T. and Zhang, N. 2017. Re-employment, job quality, health and allostatic load
biomarkers: prospective evidence from the UK Household Longitudinal Study. International
Journal of Epidemiology 47(1): 47-57.
Cooper-Gibson Research. 2018. Factors affecting teacher retention: qualitative investigation.
Department for Education Research Report. Accessed 13/09/2019 from
https://assets.publishing.service.gov.uk/government/uploads/system/uploads/attachment_data
/file/686947/Factors_affecting_teacher_retention_-_qualitative_investigation.pdf
Craig, C. 2017. International teacher attrition: multiperspective views. Teachers and Teaching
23(8): 859-862. DOI: 10.1080/13540602.2017.1360860
Deakin, G., James, N., Tickner, M. and Tidswell, J. 2010. Teachers’ workload diary survey
2010 (Research Report DfE-RR057). London: Department for Education.
Department for Education 2018. Factors affecting teacher retention: Qualitative investigation.
Accessed 05/07/2019 from
https://assets.publishing.service.gov.uk/government/uploads/system/uploads/attachment_data
/file/686947/Factors_affecting_teacher_retention_-_qualitative_investigation.pdf
Department for Education. 2019a. Reducing school workload. Accessed 07/07/2020 from
https://www.gov.uk/government/collections/reducing-school-workload#department-for-
education-policy

155
Department for Education. 2019b. Teacher retention and recruitment strategy. Accessed
07/07/2020 from https://www.gov.uk/government/publications/teacher-recruitment-and-
retention-strategy
Department for Education. 2019c. Support on wellbeing for teachers in schools and colleges.
Accessed 07/07/2020 fromhttps://www.gov.uk/government/news/support-on-wellbeing-for-
teachers-in-schools-and-colleges
Department for Education. 2020a. Extra mental health support for pupils and teachers.
Accessed 07/07/2020 from https://www.gov.uk/government/news/extra-mental-health-
support-for-pupils-and-teachers
Elliott, V. et al. 2016. A marked improvement? A review of the evidence on written marking.
Education Endowment Foundation. Accessed 27/01/20 from
https://educationendowmentfoundation.org.uk/public/files/Presentations/Publications/EEF_M
arking_Review_April_2016.pdf
Fancourt, D., Bu, F., Wan Mak, H. and Steptoe, A. 2020. Covid-19 Social Study. Accessed
16/09/2020 from https://mk0nuffieldfounpg9ee.kinstacdn.com/wp-
content/uploads/2020/04/Covid-19-social-study-results-9-June-2020.pdf
Feng, L. and Sass, T. R. 2018. The impact of incentives to recruit and retain teachers in “hard-
to-staff” subjects. Journal of Policy Analysis and Management 37(1): 112-135.
Fernet, C., Guay, F., Senécal, C. and Austin, S. 2012. Predicting intraindividual changes in
teacher burnout: The role of perceived school environment and motivational factors. Teaching
and Teacher Education 28(4): 514-525.
Foster, D. 2019. Teacher recruitment and retention in England. House of Commons briefing
paper 7222. Accessed 17/07/2019 from
https://researchbriefings.files.parliament.uk/documents/CBP-7222/CBP-7222.pdf
Gibb, N. 2020. Improving the wellbeing of staff in schools and colleges. Accessed 07/07/2020
from
https://assets.publishing.service.gov.uk/government/uploads/system/uploads/attachment_data
/file/890547/Nick_Gibb_letter_to_EAG.pdf
Gibson, S., Oliver, L. and Dennison, M. 2015. Workload challenge: Analysis of teacher
consultation responses. Department for Education Research Report DfE-RR445. London:
Department for Education.
Gielen, A. C. 2013. Repeated job quits: stepping stones or learning about quality?. IZA Journal
of European Labor Studies 2(7).
Gilbert, C. 2011. Towards a self-improving system: the role of school accountability. Accessed
09/01/2020 from https://dera.ioe.ac.uk/14919/1/towards-a-self-improving-system-school-
accountability-thinkpiece%5B1%5D.pdf
Goldstein, H. 1997. Methods in school effectiveness research. School effectiveness and school
improvement. 8: 369-95.

156
Hakanen, J. J., Bakker, A. B. and Schaufeli, W. B. 2006. Burnout and work engagement among
teachers. Journal of school psychology 43(6): 495-513.
Hamilton, L. and Koretz, D. 2002. Tests and their use in test-based accountability systems in
L. Hamilton, B. Stecher and S. Klein (eds) Making Sense of Test-Based Accountability in
Education. RAND.
Hanushek, E. and Raymond, M. 2005. Does school accountability lead to improved student
performance? Journal of Policy Analysis and Management 24(2): 297-327.
Health and Safety Executive. 2019. Work-related stress, anxiety or depression statistics in
Great Britain 2019. Accessed 29/11/2019 from
http://www.hse.gov.uk/statistics/causdis/stress.pdf
House of Commons. 2018. Retaining and developing the teaching workforce. Seventeenth
Report of Session 2017–19. Accessed 09/02/2018 from
https://publications.parliament.uk/pa/cm201719/cmselect/cmpubacc/460/460.pdf
Iacobucci, G. 2019. NHS prescribed record number of antidepressants last year. BMJ 364:
l1508.
Jacob, R., Goddard, R., Kim, M., Miller, R. and Goddard, Y. 2015. Exploring the causal impact
of the McREL Balanced Leadership Program on leadership, principal efficacy, instructional
climate, educator turnover, and student achievement. Educational Evaluation and Policy
Analysis 37(3): 314-332.
Jerrim, J. and Sims, S. 2019. Teachers in primary and secondary schools: TALIS 2018.
Accessed 26/03/2021 from https://www.gov.uk/government/publications/teachers-in-primary-
and-secondary-schools-talis-2018
Jerrim, J. and Sims, S. 2020a. Teacher wellbeing. How does England compare to other
countries?
Jerrim, J., Sims, S., Taylor, H. and Allen, R. 2020a. How does the mental health and wellbeing of teachers
compare to other professions? Review of Education.
Jerrim, J., Sims, S., Taylor, H. and Allen, R. 2020b. Has the mental health and wellbeing of teachers in England
changed over time? New evidence from three datasets.
Jerrim, J. 2020. How is life as a newly qualified teacher? New evidence from a longitudinal
cohort study in England. British Journal of Educational Studies
Jerrim, J., Sims, S., Taylor, H. and Allen, R. 2020c. I quit! Is there an association between
leaving teaching and improvements in mental health?
Jerrim, J. and Sims, S. 2020b. Teacher workload and well-being. New international evidence
from the OECD TALIS study.
Jerrim, J. and Sims, S. 2020c. School accountability and teacher stress. International evidence
from the OECD TALIS study.
157
Johnson, S., Cooper, C., Cartwright, S., Doland, I., Taylor, P. and Millet, C. 2005. The
experience of work-related stress across occupations. Journal of Managerial Psychology 20(2):
178-187.
Jones, B. D. and Egley, R. J. 2004. Voices from the frontlines. Teachers’ perceptions of high-
stakes testing. Education Policy Analysis Archives 12(39). Accessed 20/01/2020 from
https://epaa.asu.edu/ojs/article/view/194/320.
Kidger, J., Brockman, R., Tilling, K., Campbell, R., Ford, T., Araya, R., King, M. and Gunnell,
D. 2016. Teachers' wellbeing and depressive symptoms, and associated risk factors: A large
cross-sectional study in English secondary schools. Journal of Affective Disorders 192: 76-82.
Kinman, G., Wray, S. and Strange, C. 2011. Emotional labour, burnout and job satisfaction in
UK teachers: The role of workplace social support. Educational Psychology 31(7): 843-856.
Kokkinos, C. M. 2007. Job stressors, personality and burnout in primary
schoolteachers. British Journal of Educational Psychology 77(1): 229-243.
Kovess-Masféty, V., Rios-Seidel, C. and Sevilla-Dedieu, C. 2007. Teachers’ mental health and
teaching levels. Teaching and Teacher Education, 23(7): 1,177-1,192.
Kraft, M. A., Marinell, W. H. and Shen-Wei Yee, D. 2016. School organizational contexts,
teacher turnover, and student achievement: Evidence from panel data. American Educational
Research Journal 53(5): 1,411-1,449.
Ladd, H. F. 2011. Teachers’ perceptions of their working conditions: How predictive of
planned and actual teacher movement? Educational Evaluation and Policy Analysis 33(2):
235-261.
Lam, B. H. and Yan, H. F. 2011. Beginning teachers’ job satisfaction: The impact of school-
based factors. Teacher Development, 15(3): 333-348.
Liberal Democrats. 2018. 3,750 teachers in England on long-term stress leave. Accessed
19/01/2020 from https://www.libdems.org.uk/3750-teachers-england-on-long-term-stress-
leave
Longhi, S., Nandi, A., Bryan, M., Connolly, S. and Gedikli, C. 2019. Do all job changes
increase wellbeing? What Works Wellbeing.
Lough, C. 2019. England's heads 'the most data-driven'. TES 15th October 2019. Accessed
09/01/2020 from https://www.tes.com/news/englands-heads-most-data-driven
Masilamani, R., Darus, A., Ting, A. S., Ali, R., Mahmud, A. B. A. and David, K. 2012. Salivary
biomarkers of stress among teachers in an urban setting. Asia Pacific Journal of Public
Health 24(2): 278-287.
Mauss, D., Li, J., Schmidt, B., Angerer, P. and Jarczok, M. N. 2015. Measuring allostatic load
in the workforce—a systematic review. Industrial Health 53: 5–20.

158
McEwen, B. S. 1998. Stress, adaptation, and disease: Allostasis and allostatic load. Annals of
the New York Academy of Sciences 840(1): 33-44.
National Education Union. 2018. Teachers’ workloads. Accessed 27/08/2019 from
https://neu.org.uk/policy/teachers-workload
NHS Digital. 2017. Health Survey for England 2016 Well-being and mental health. Accessed
26/03/2021 from http://healthsurvey.hscic.gov.uk/media/63763/HSE2016-Adult-wel-bei.pdf
Oberle, E & Schonert-Reichl, K. 2016. Stress contagion in the classroom? The link between
classroom teacher burnout and morning cortisol in elementary school students. Social Science
& Medicine 159 10.1016/j.socscimed.2016.04.031.
OECD. 2011. School autonomy and accountability: Are they related to student performance?
Paris: OECD. Accessed 13/09/2019 from
https://www.oecd.org/pisa/pisaproducts/pisainfocus/48910490.pdf
OECD. 2019. TALIS 2018 Results (Volume I): Teachers and School Leaders as Lifelong
Learners. Paris: OECD. Accessed 27/08/2019 from http://www.oecd.org/education/talis/
Ofsted. 2019. Teacher well-being at work in schools and further education providers. Accessed
12/09/2019 from
https://assets.publishing.service.gov.uk/government/uploads/system/uploads/attachment_data
/file/819314/Teacher_well-being_report_110719F.pdf
Oppenheim, M. 2020. Coronavirus: Women bearing burden of childcare and homeschooling
in lockdown, study finds. Accessed 16/09/2020 from
https://www.independent.co.uk/news/uk/home-news/coronavirus-childcare-homeschooling-
women-lockdown-gender-a9512866.html
Owen, N., Healy, G. N., Dempsey, P. C., Salmon, J., Timperio, A., Clark, B. K. and Lambert,
G. 2020. Sedentary behavior and public health: integrating the evidence and identifying
potential solutions. Annual Review of Public Health 41: 265-287.
Perryman, J. and Calvert, G. 2019. What motivates people to teach, and why do they leave?
Accountability, performativity and teacher retention British Journal of Educational Studies.
DOI: 10.1080/00071005.2019.1589417
Phillips, S., Sen, D. and McNamee, R. 2008. Risk factors for work-related stress and health in
head teachers. Occupational Medicine 58(8): 584–586.
https://doi.org/10.1093/occmed/kqn112
Pierce, M. et al. 2020. Mental health before and during the Covid-19 pandemic: a longitudinal
probability sample survey of the UK population. The Lancet Psychiatry DOI:
https://doi.org/10.1016/S2215-0366(20)30308-4
Power, K. 2020. The Covid-19 pandemic has increased the care burden of women and
families, Sustainability: Science, Practice and Policy, 16:1, 67-
73, DOI: 10.1080/15487733.2020.1776561

159
Prime Minister’s Office. 2019. PM launches new mission to put prevention at the top of the
mental health agenda. Accessed 07/07/2020 from https://www.gov.uk/government/news/pm-
launches-new-mission-to-put-prevention-at-the-top-of-the-mental-health-agenda
Qi, X., Zhang, J., Liu, Y., Ji, S., Chen, Z., Sluiter, J. K. and Deng, H. 2014. Relationship
between effort–reward imbalance and hair cortisol concentration in female kindergarten
teachers. Journal of Psychosomatic Research 76(4): 329-332.
Richards, J. 2012. Teacher stress and coping strategies. A national snapshot. The Educational
Forum 76(3): 299-316.
Rose, M. 2003. Good deal, bad deal? Job satisfaction in occupations. Work, Employment and
Society 17(3): 503-530.
Ryan, S., von der Embse, N., Pendergast, L., Saeki, E., Segool, N. and Schwing, S. 2017.
Leaving the teaching profession: The role of teacher stress and educational accountability
policies on turnover intent. Teaching and Teacher Education 66: 1-11.
Saeki, E., Pendergast, L., Segool, N. and von der Embse, N. 2015. Potential psychosocial and
instructional consequences of the common core state standards. Implications for research and
practice. Contemporary School Psychology 19(2): 89-97.
Savage, M. 2020. How Covid-19 is changing women’s lives. Accessed 16/09/2020 from
https://www.bbc.com/worklife/article/20200630-how-covid-19-is-changing-womens-lives
Schildkamp, K. 2019. Data-based decision-making for school improvement: Research insights
and gaps, Educational Research, 61:3, 257-273, DOI: 10.1080/00131881.2019.1625716
Seeman, T. E., McEwen, B. S., Rowe, J. W. and Singer, B. H. 2001. Allostatic load as a marker
of cumulative biological risk: MacArthur studies of successful aging. Proceedings of the
National Academy of Sciences 98(8): 4,770-4,775.
Selwyn, N., Nemorin, S. and Johnson, N. 2017. High-tech, hard work: An investigation of
teachers’ work in the digital age. Learning, Media and Technology 42(4): 390-405.
Simon, N. S. and Johnson, S. M. 2015. Teacher turnover in high-poverty schools: What we
know and can do. Teachers College Record 117(3): 1-36.
Sims, S. and Jerrim, J. 2020. How does the school working environment predict teachers’ job
satisfaction, stress and exit from the profession? Evidence from linked survey and
administrative data.
Sims, S., Jerrim, J., Taylor, H. and Allen, R. 2020a. Is teaching really bad for your health? New
evidence from biomarker data.
Skaalvik, E. M. and Skaalvik, S. 2009. Does school context matter? Relations with teacher
burnout and job satisfaction. Teaching and teacher education 25(3): 518-524.
Stansfeld, S. A., Rasul, F. R., Head, J. and Singleton, N. 2011. Occupation and mental health
in a national UK survey. Social Psychiatry and Psychiatric Epidemiology 46(2): 101–110.

160
Sy, T., Cote, S. and Saavedra, R. 2005. The contagious leader: impact of the leader’s mood on
the mood of group members, group affective tone, and group processes. Journal of Applied
Psychology 90(2): 295-305.
TNS-BMRB (2014). Teacher workload survey 2013. London: Department for Education.
Travers, C. and Cooper, C. 1993. Mental health, job satisfaction and occupational stress among
UK teachers. Work & Stress 7(3): 203-219.
Tudor-Locke, C., Ainsworth, B. E., Washington, T. L. and Troiano, R. 2011. Assigning
metabolic equivalent values to the 2002 census occupational classification system. Journal of
Physical Activity and Health 8(4): 581-586.
Valli, L. and Buese, D. 2007. The changing roles of teachers in an era of high-stakes
accountability. American Educational Research Journal 44(3): 519-558.
Warwick Medical School. 2020. Warwick-Edinburgh Mental Wellbeing Scale FAQs.
Accessed 16/09/2020 from
https://warwick.ac.uk/fac/sci/med/research/platform/wemwbs/using/faq/
Wolfram, M., Bellingrath, S., Feuerhahn, N. and Kudielka, B. M. 2013. Cortisol responses to
naturalistic and laboratory stress in student teachers. Comparison with a non‐stress control
day. Stress and Health 29(2): 143-149.
Worth, J., Lynch, S., Hillary, J., Rennie, C. and Andrade, J. 2018. Teacher workforce
dynamics in England. national foundation for educational research report. Slough: NFER.
Accessed 26/03/2021
from https://www.nfer.ac.uk/media/3111/teacher_workforce_dynamics_in_england_final_re
port.pdf
Worth, J. and Van den Brande, J. 2019. Teacher Labour Market in England: Annual Report
2019. Accessed 26/03/2021 from https://files.eric.ed.gov/fulltext/ED594396.pdf
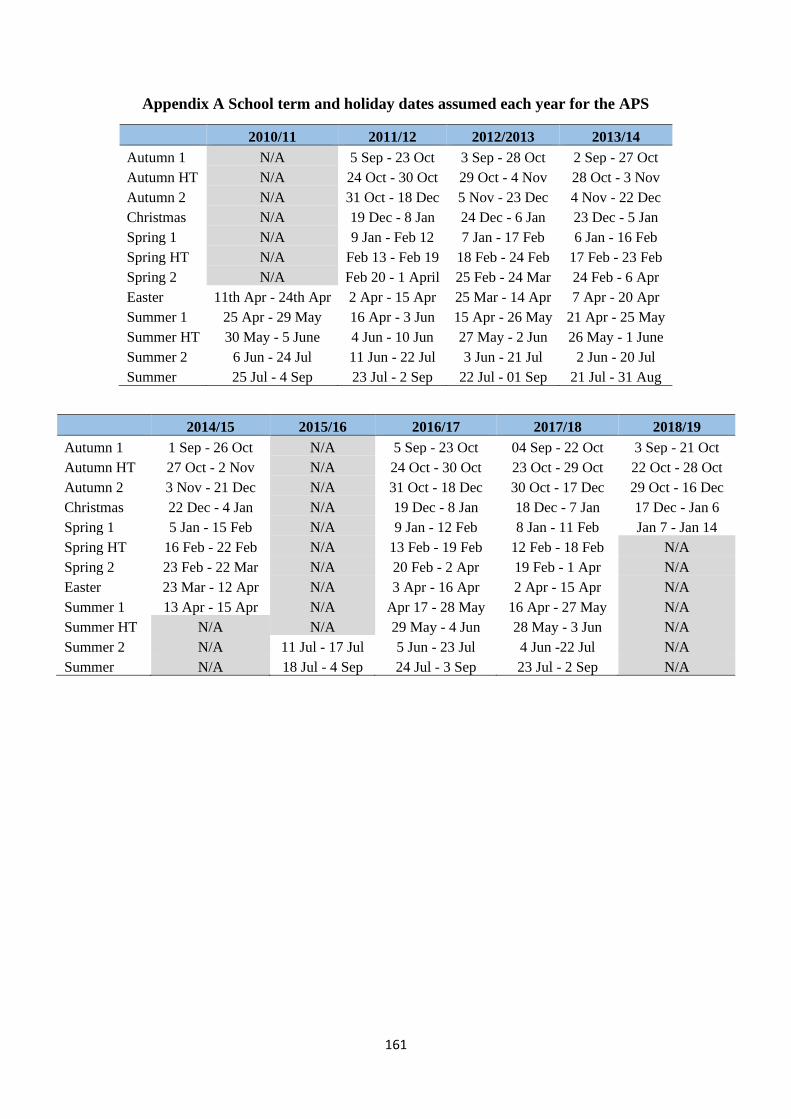
161
Appendix A School term and holiday dates assumed each year for the APS
2010/11 2011/12 2012/2013 2013/14
Autumn 1 N/A 5 Sep - 23 Oct 3 Sep - 28 Oct 2 Sep - 27 Oct
Autumn HT N/A 24 Oct - 30 Oct 29 Oct - 4 Nov 28 Oct - 3 Nov
Autumn 2 N/A 31 Oct - 18 Dec 5 Nov - 23 Dec 4 Nov - 22 Dec
Christmas N/A 19 Dec - 8 Jan 24 Dec - 6 Jan 23 Dec - 5 Jan
Spring 1 N/A 9 Jan - Feb 12 7 Jan - 17 Feb 6 Jan - 16 Feb
Spring HT N/A Feb 13 - Feb 19 18 Feb - 24 Feb 17 Feb - 23 Feb
Spring 2 N/A Feb 20 - 1 April 25 Feb - 24 Mar 24 Feb - 6 Apr
Easter 11th Apr - 24th Apr 2 Apr - 15 Apr 25 Mar - 14 Apr 7 Apr - 20 Apr
Summer 1 25 Apr - 29 May 16 Apr - 3 Jun 15 Apr - 26 May 21 Apr - 25 May
Summer HT 30 May - 5 June 4 Jun - 10 Jun 27 May - 2 Jun 26 May - 1 June
Summer 2 6 Jun - 24 Jul 11 Jun - 22 Jul 3 Jun - 21 Jul 2 Jun - 20 Jul
Summer 25 Jul - 4 Sep 23 Jul - 2 Sep 22 Jul - 01 Sep 21 Jul - 31 Aug
2014/15 2015/16 2016/17 2017/18 2018/19
Autumn 1 1 Sep - 26 Oct N/A 5 Sep - 23 Oct 04 Sep - 22 Oct 3 Sep - 21 Oct
Autumn HT 27 Oct - 2 Nov N/A 24 Oct - 30 Oct 23 Oct - 29 Oct 22 Oct - 28 Oct
Autumn 2 3 Nov - 21 Dec N/A 31 Oct - 18 Dec 30 Oct - 17 Dec 29 Oct - 16 Dec
Christmas 22 Dec - 4 Jan N/A 19 Dec - 8 Jan 18 Dec - 7 Jan 17 Dec - Jan 6
Spring 1 5 Jan - 15 Feb N/A 9 Jan - 12 Feb 8 Jan - 11 Feb Jan 7 - Jan 14
Spring HT 16 Feb - 22 Feb N/A 13 Feb - 19 Feb 12 Feb - 18 Feb N/A
Spring 2 23 Feb - 22 Mar N/A 20 Feb - 2 Apr 19 Feb - 1 Apr N/A
Easter 23 Mar - 12 Apr N/A 3 Apr - 16 Apr 2 Apr - 15 Apr N/A
Summer 1 13 Apr - 15 Apr N/A Apr 17 - 28 May 16 Apr - 27 May N/A
Summer HT N/A N/A 29 May - 4 Jun 28 May - 3 Jun N/A
Summer 2 N/A 11 Jul - 17 Jul 5 Jun - 23 Jul 4 Jun -22 Jul N/A
Summer N/A 18 Jul - 4 Sep 24 Jul - 3 Sep 23 Jul - 2 Sep N/A
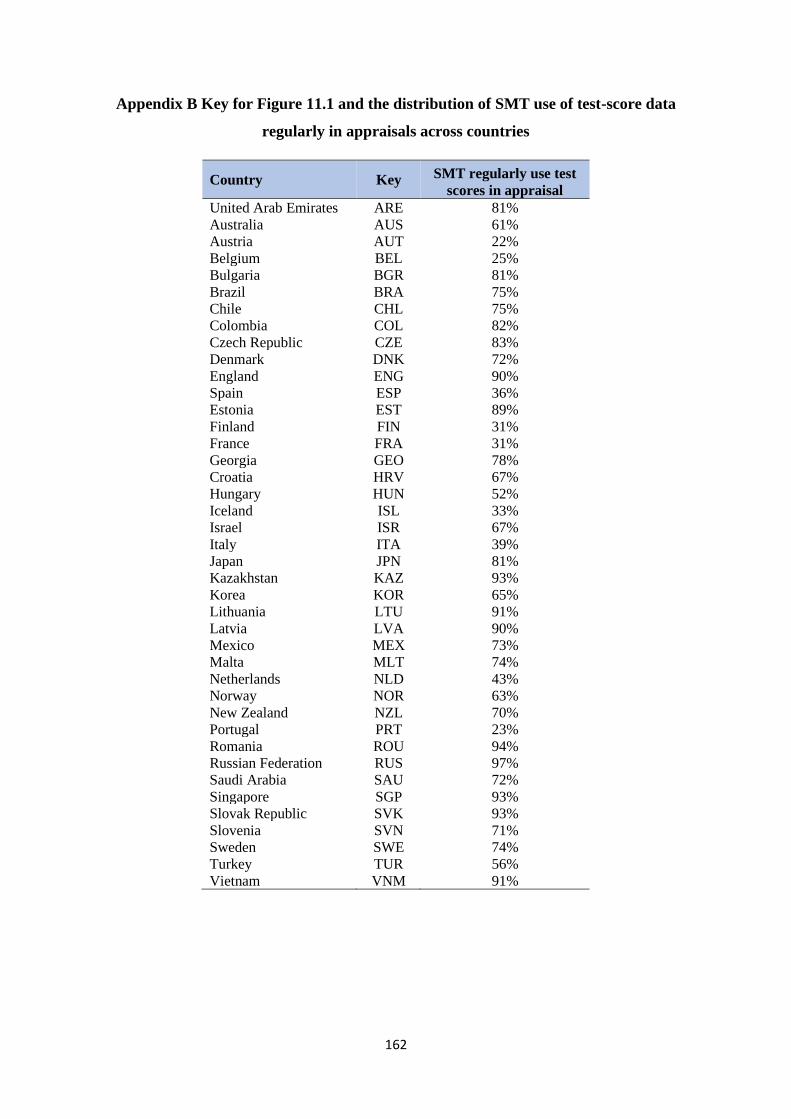
162
Appendix B Key for Figure 11.1 and the distribution of SMT use of test-score data
regularly in appraisals across countries
Country Key SMT regularly use test
scores in appraisal
United Arab Emirates ARE 81%
Australia AUS 61%
Austria AUT 22%
Belgium BEL 25%
Bulgaria BGR 81%
Brazil BRA 75%
Chile CHL 75%
Colombia COL 82%
Czech Republic CZE 83%
Denmark DNK 72%
England ENG 90%
Spain ESP 36%
Estonia EST 89%
Finland FIN 31%
France FRA 31%
Georgia GEO 78%
Croatia HRV 67%
Hungary HUN 52%
Iceland ISL 33%
Israel ISR 67%
Italy ITA 39%
Japan JPN 81%
Kazakhstan KAZ 93%
Korea KOR 65%
Lithuania LTU 91%
Latvia LVA 90%
Mexico MEX 73%
Malta MLT 74%
Netherlands NLD 43%
Norway NOR 63%
New Zealand NZL 70%
Portugal PRT 23%
Romania ROU 94%
Russian Federation RUS 97%
Saudi Arabia SAU 72%
Singapore SGP 93%
Slovak Republic SVK 93%
Slovenia SVN 71%
Sweden SWE 74%
Turkey TUR 56%
Vietnam VNM 91%
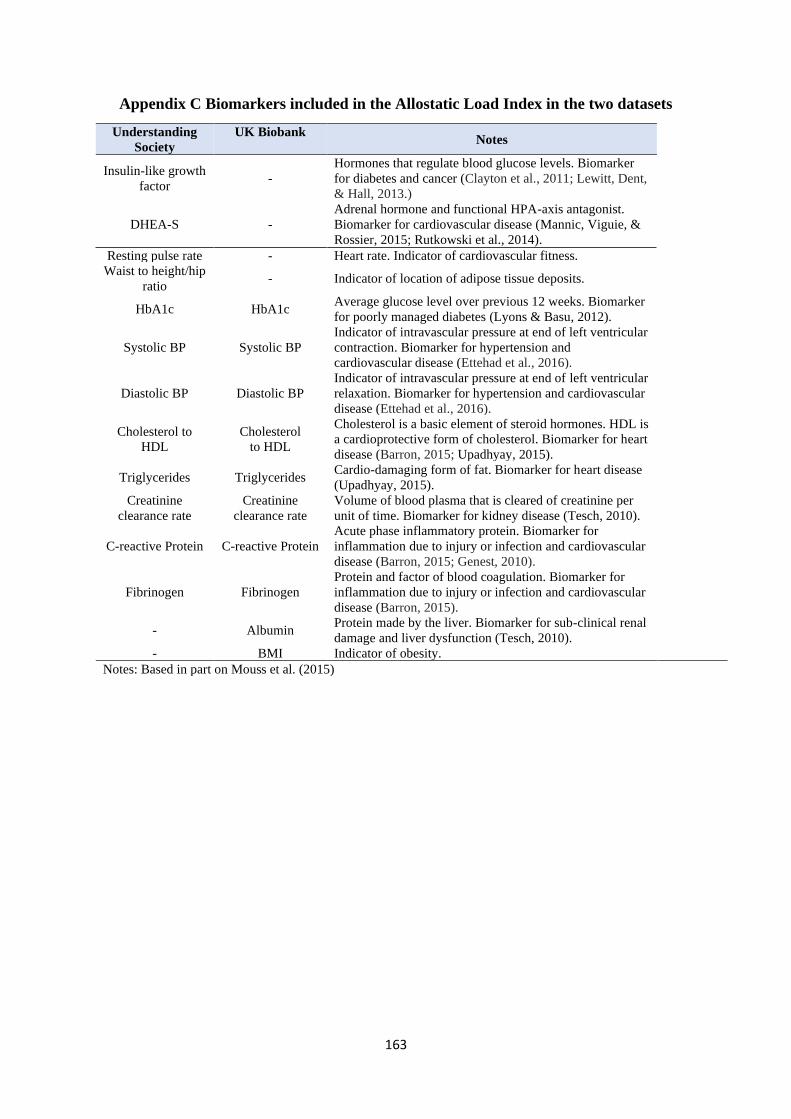
163
Appendix C Biomarkers included in the Allostatic Load Index in the two datasets
Understanding
Society
UK Biobank Notes
Insulin-like growth
factor -
Hormones that regulate blood glucose levels. Biomarker
for diabetes and cancer (Clayton et al., 2011; Lewitt, Dent,
& Hall, 2013.)
DHEA-S -
Adrenal hormone and functional HPA-axis antagonist.
Biomarker for cardiovascular disease (Mannic, Viguie, &
Rossier, 2015; Rutkowski et al., 2014).
Resting pulse rate - Heart rate. Indicator of cardiovascular fitness.
Waist to height/hip
ratio - Indicator of location of adipose tissue deposits.
HbA1c HbA1c Average glucose level over previous 12 weeks. Biomarker
for poorly managed diabetes (Lyons & Basu, 2012).
Systolic BP Systolic BP
Indicator of intravascular pressure at end of left ventricular
contraction. Biomarker for hypertension and
cardiovascular disease (Ettehad et al., 2016).
Diastolic BP Diastolic BP
Indicator of intravascular pressure at end of left ventricular
relaxation. Biomarker for hypertension and cardiovascular
disease (Ettehad et al., 2016).
Cholesterol to
HDL
Cholesterol
to HDL
Cholesterol is a basic element of steroid hormones. HDL is
a cardioprotective form of cholesterol. Biomarker for heart
disease (Barron, 2015; Upadhyay, 2015).
Triglycerides Triglycerides Cardio-damaging form of fat. Biomarker for heart disease
(Upadhyay, 2015).
Creatinine
clearance rate
Creatinine
clearance rate
Volume of blood plasma that is cleared of creatinine per
unit of time. Biomarker for kidney disease (Tesch, 2010).
C-reactive Protein C-reactive Protein
Acute phase inflammatory protein. Biomarker for
inflammation due to injury or infection and cardiovascular
disease (Barron, 2015; Genest, 2010).
Fibrinogen Fibrinogen
Protein and factor of blood coagulation. Biomarker for
inflammation due to injury or infection and cardiovascular
disease (Barron, 2015).
- Albumin Protein made by the liver. Biomarker for sub-clinical renal
damage and liver dysfunction (Tesch, 2010).
- BMI Indicator of obesity.
Notes: Based in part on Mouss et al. (2015)