Embed Size (px)
Citation preview

21
The Measurement of Saving inAustralia
This paper analyses the various available measures of household and overallprivate saving, with a particular focus on their strengths and weaknesses from aconceptual and practical perspective. The paper is intended as an overview ofthe important factual information on the measurement of saving in Australia.
EXECUTIVE SUMMARY
The most commonly quoted measure of saving is the net household saving ratio,as published by the ABS. It is determined residually and can be affected byunderlying measurement and classification problems. As such, it may notprovide an accurate indication of the underlying saving behaviour ofhouseholds.
The pure economic definition of saving is the change in the wealth or net worthof households from one period to the next. In this context, an importantlimitation of conventional measures of saving is that they do not take intoaccount the effect of changing asset values on the wealth of households. Therehave been several attempts to estimate Australian net private sector wealth.Although such measures are inherently volatile, they suggest that savingthrough the 1990s has exceeded the long run average.
Consideration of possible alternative measures of saving raises questions as tohow the measure itself is to be defined and how to define (especially over time)sectors in the economy. There are conceptual and practical arguments aboutwhether to use a gross or a net (that is, gross saving less depreciation) measureof saving. The net household saving ratio can be affected by the approach usedfor the measurement of depreciation. For example, the use (consistent withinternational standards) of replacement cost in depreciating dwellings meansthat when the cost of building a house increases, the measured householdsaving ratio may fall even though household net worth, at least initially,increases. Further, international comparison of net saving measures is difficultbecause the methods for calculating depreciation vary significantly acrosscountries. As a result, gross measures of saving enable internationalcomparisons to be more soundly based.
The household sector is defined as including both individuals andunincorporated enterprises. Consequently, changes in the structure of thebusiness sector, particularly small business, can have a significant effect onwhether income (and hence saving) is classified as belonging to the household

22
or the corporate sector. The trend towards incorporation over recent decadessuggests that some of the saving that was previously measured as accruing tothe household sector would now be measured as accruing to the corporatesector.
As a result, it may be more accurate to assess trends in private saving as a wholerather than the saving of the household sector. The measure of private savingwhich can be derived from the National Accounts takes into account householdsaving and the undistributed income of private corporations. However, itgenerally does not include the effect of asset price movements. The increase inprivate saving as a percentage of GDP in the early to mid-1970s, and thedownward trend since then, is much less pronounced than that of householdsaving. Gross private saving rose from around 19 per cent of GDP to around22 per cent of GDP in the early to mid-1970s, and is currently around15½ per cent of GDP. A similar trend is evident in some other developedcountries. By comparison, household saving in Australia is currently around3 per cent of net household disposable income, compared with an average ofaround 11 per cent in the 1960s and a peak of around 18½ per cent in themid-1970s.
Several studies have noted that traditional measures of saving are distorted bythe National Accounts inclusion of interest receipts and payments on a nominalrather than real (post inflation) basis. A measure of private saving which isadjusted for the effects of inflation on nominal interest receipts and payments islikely to be more representative of private saving behaviour. After the grossprivate saving measure is adjusted for inflation, the decline since the mid-1970sappears more muted, with the current inflation adjusted private saving ratearound 3½ per cent of GDP lower than it was at the end of the 1960s.
The net (of depreciation) private saving measure that can be derived from theNational Accounts is more suggestive of a downward trend over recent decadesthan the gross private saving measure. Net private saving (unadjusted forinflation) rose from an average of 9 per cent of GDP in the 1960s to around12 per cent in the mid-1970s and is currently around 4½ per cent of GDP, about2 per cent of GDP below the average of the past two decades. Adjusting the netprivate saving measure for inflation reduces the extent of this decline. That said,the current inflation adjusted net private saving rate is around 4 per cent of GDPlower than it was at the end of the 1960s.
A range of other adjustments could be made to the conventional measurementof private saving to reflect more accurately the conceptually ‘pure’ definition ofsaving. These include the treatment of consumer durables and investment inhuman capital, the impact of capital gains tax of saving measures and thetreatment of the statistical discrepancy.
In summary the significant decline in the ABS net household saving ratio sincethe mid-1970s appears to reflect measurement and classification limitationsrather than a significant change in saving behaviour. Broader measures of the

23
saving behaviour of Australian households, such as gross and net private saving(particularly after adjustment for inflation) and changes in net worth, present adifferent picture. While there are uncertainties about the appropriate definitionand measurement of saving, these broader measures of private saving haveshown a much less pronounced downward trend than the ABS net householdsaving ratio over recent decades.
INTRODUCTION
This paper analyses the various available measures of household and overallprivate saving, with a particular focus on their strengths and weaknesses from aconceptual and practical perspective. The paper is intended as an overview ofthe important factual information on the measurement of saving in Australia.
MEASURES OF HOUSEHOLD AND PRIVATE SAVING
There is a range of measures of household and overall private sector saving.This section discusses several such measures, with a particular focus onconceptual and practical measurement issues.
Household saving
The most commonly quoted measure of household saving in Australia is the nethousehold saving ratio published as a memorandum item by the AustralianBureau of Statistics (ABS) in its National Accounts publications.1 The nethousehold saving ratio is defined by the ABS as the proportion of the netdisposable income of all households that is not consumed by households in thatperiod. In this context, net disposable income is the gross disposable income ofthe household sector net of depreciation2 on the capital assets of the householdsector in the period.
As illustrated in Chart 1, the ABS net household saving ratio averaged around11 per cent of net household disposable income in the 1960s, rising to a peakaround 18½ per cent in the mid-1970s. According to this measure, the nethousehold saving ratio fell from around 13 per cent to around 6 per cent overthe course of the 1980s, and from around 6 per cent to around 3 per cent thus farover the course of the 1990s.
1 Australian Bureau of Statistics, Australian System of National Accounts, Catalogue Number5204.0; National Income, Expenditure and Product, Catalogue Number 5206.0.
2 Depreciation is referred to in the National Accounts as ‘consumption of fixed capital’ .

24
Chart 1: ABS net household saving ratio
0
4
8
12
16
20
Dec-60 Jun-66 Dec-71 Jun-77 Dec-82 Jun-88 Dec-93 Jun-99
0
4
8
12
16
20Per cent of net disposable income Per cent of net disposable income
Source: ABS Cat. No. 5206.0.
The trend in this measure of household saving in Australia has been broadlysimilar to that experienced in some other developed countries3 (see Chart 2). Forexample, although the measured household saving ratio did not peak quite ashigh in the United States in the 1970s and hit a higher peak in Canada in theearly 1980s, since then the ratio in these two countries has trended down to be athistorically low levels. Japan, generally considered a high saving country, has ameasured household saving ratio consistently about 7 to 10 per cent higher thanthe United States, Canada and Australia, but this ratio also declined over theperiod between the mid-1970s and late 1980s. During the 1990s, Japan’shousehold saving ratio has been relatively steady.
3 Measures of the household saving ratio are not strictly comparable across countries becauseeach country produces its national accounts using its own conventions that often differsubstantially. As a consequence, the discussion is restricted to a comparison of broadunderlying trends.

25
Chart 2: Household saving ratios — international comparison
0
5
10
15
20
25
1962 1966 1970 1974 1978 1982 1986 1990 1994 1998
0
5
10
15
20
25
Australia Canada US Japan
Per cent of household income Per cent of household income
Source: OECD Economic Outlook No. 65.
Gross versus net household saving
There are conceptual and practical arguments about whether to use a grossmeasure or a net (that is, gross saving less depreciation) measure of saving.
From a conceptual point of view, net saving is appropriate because it moreclosely reflects the theoretical notion of saving representing the change in thewealth or net worth of households from one period to the next. However, netsaving can be affected by the approach used for the measurement ofdepreciation, including whether depreciation is calculated using a capital stockthat is valued at historical or current cost and the amortisation methodemployed. For example, consistent with international standards, current cost isused to estimate the depreciation of dwellings (a significant component ofhousehold depreciation); however where the price of new houses rise, theconsequent increase in the value of the existing stock of dwellings is notincluded in household income. This means that when the price of new housesincrease, the measured household saving ratio may fall even though householdnet worth, at least initially, increases.
Chart 3 compares the gross household saving ratio with the net householdsaving ratio over the past four decades. Using the gross household saving ratiomeasure, the apparent decline in household saving over recent decades is mutedslightly, as is the rise in household saving in the mid-1970s.

26
Chart 3: ABS gross and net household saving ratios
0
2
4
6
8
10
12
14
16
18
20
22
Dec-60 Jun-66 Dec-71 Jun-77 Dec-82 Jun-88 Dec-93 Jun-99
5
7
9
11
13
15
17
19
21
23
25
27Per cent of net disposable income Per cent of gross disposable income
Gross Household Saving (RHS)
Net Household Saving (LHS)
Source: ABS Cat. No. 5206.0.
The gap between the gross and net household saving ratios reflects theestimated depreciation of household capital assets, as measured by the ABS. Theannual rate of depreciation of the household capital stock used by the ABS inconstructing these measures was broadly constant during the 1960s at around6 per cent. This fell to a broadly constant annual rate of 4.5 per cent in the 1970s,as the increased share of dwellings in the household capital stock (whichdepreciate at a lower rate) more than offset the effects of increases in new houseprices. As illustrated in Chart 3, this fall in the rate of depreciation led to anarrowing of the gap between the gross and net household saving ratios in theearly 1970s.
The subsequent widening of the gap between the gross and net householdsaving ratios in the mid to late 1980s reflects the rapid increase in the value ofthe household capital stock due largely to sharply higher new house priceswhich, in turn, led to increased levels of depreciation. For example, the ABSestimates that the value of the housing capital stock increased by 70 per centbetween 1986-87 and 1989-90.
International comparison of net saving measures is difficult because themethods for calculating depreciation vary significantly across countries. As aresult, gross measures of saving enable international comparisons to be moresoundly based.

27
A broader measure of ‘household’ saving which includes saving byunincorporated enterprises
It is often assumed that a clear delineation exists between saving by thehousehold and business sectors. However, in practice this distinction is not clearcut, particularly in relation to unincorporated enterprises. Reflecting datalimitations — and consistent with international standards — the householdsector as measured by the ABS includes, amongst other things, the gross profit4
of unincorporated enterprises (eg, sole traders and partnerships). The ABS notesthat ‘household and unincorporated enterprises are included in the one sectorbecause the owners of ordinary partnerships and sole proprietorships frequentlycombine their business and personal transactions’.5
Consequently, changes in the structure of the business sector, particularly smallbusiness, can have a significant effect on whether income (and hence saving) isclassified as belonging to the household or the corporate sector. In particular,recent decades have seen a significant trend towards corporatisation byAustralian business. This can be illustrated by the steady increase in theproportion of gross profit earned through company structures and thecorresponding decline in the proportion earned by unincorporated businesses(Chart 4).
Chart 4: Share of gross profit —corporate and unincorporated enterprises
30
40
50
60
70
1962-63 1971-72 1980-81 1989-90 1998-99
30
40
50
60
70
Corporate Gross Profit
Unincorporated Gross Profit
Per cent of total gross profit Per cent of total gross profit
Source: ABS Cat. No. 5206.0.
4 In ABS publications, gross profit is known as the gross operating surplus.
5 ABS, Australian National Accounts — Concepts, Sources and Methods, ABS Cat. No. 5216.0,page 16.
28
There are several possible factors that could explain this trend towardscorporatisation by Australian business. Corporatisation, for example, offerslimited liability and other commercial advantages.
The consequences of this trend toward corporatisation on the measurement ofthe household sector saving ratio are often overlooked. To the extent that theincreasing corporatisation of Australian business reflects changes in thestructure of the small business sector, then (unless all corporate profits aredistributed to households as dividends) the income measured as accruing to thehousehold sector will be lower than otherwise. This is because the ABS measureof household income includes dividends paid from the corporate sector to thehousehold sector but does not include the household sector’s interest inundistributed income of the corporate sector (even when realised as a capitalgain).
On the other hand, the relationship between small business households’consumption and the income of their business is unlikely to be affectedsignificantly by whether their business is incorporated or unincorporated.Therefore, the trend towards corporatisation by Australian enterprises is likelyto have reduced the measured household saving ratio over time, as incomeattributed to the household sector will decline relative to householdconsumption.
An illustration of the magnitude of this shift on the gross household saving ratiocan be gauged by estimating what the gross household saving ratio may havebeen under the assumption that unincorporated enterprises’6 current share ofgross profits had prevailed over the past three decades (see Chart 5). Under thisassumption, the fall in the gross household saving ratio from the early-1970s ismuch less pronounced and, while the current level of the ratio is still low byhistorical standards, it is higher than its level for most of the 1960s.
That said, there is a range of technical and data difficulties in making such anadjustment and hence the results should be regarded as only being indicative ofbroad trends. It also points to the potential benefit in examining trends in overallgross private saving (which is unaffected by such structural changes) rather thanthe much more narrow definition of household saving. This issue is discussedfurther below.
6 Adjusted such that dividend flows to households remain fixed through history at their currentlevels as a proportion of income.

29
Chart 5: Gross household saving ratio adjusted fora constant share of gross profit
0
5
10
15
20
25
30
1961-62 1967-68 1973-74 1979-80 1985-86 1991-92 1997-98
0
5
10
15
20
25
30
Gross Household Saving Ratio
Adjusted Gross Household Saving Ratio
Per cent of disposable income Per cent of disposable income
Source: ABS Cat. No. 5204.0 and Treasury estimates.
Private Saving
Private and household saving are often (incorrectly) used interchangeably whenreferring to Australia’s saving performance. As noted above, household savingas measured by the ABS refers only to saving by the household sector, includingunincorporated enterprises. It does not include changes in the value of thehousehold sector’s interest in private corporations, whether by reason ofchanges in undistributed income or asset price fluctuations. On the other hand,private saving is the sum of saving by the private (financial and non-financial)corporation and household sectors. This key difference between household andoverall private sector saving is vital in gaining a better understanding of whathouseholds consider to be their saving. However, it still needs to be borne inmind that, while the National Accounts measure of private saving takes intoaccount the undistributed income of private financial and non-financialcorporations, it generally does not include the effect of asset price fluctuations.7
As private corporations are ultimately owned by households, saving by privatecorporations8 is, at least conceptually, also household saving.9 The extent to
7 The principal exception being the extent to which asset price fluctuations reflect thecapitalisation of undistributed income.
8 That is, the retained profits or undistributed income of corporations.

30
which households ‘see through the corporate veil’ and adjust their saving (andconsumption) decisions accordingly is not clear. It is likely that this will varyaccording to a range of factors, probably including how widely the corporation’sshares are held and the level of disclosure of financial information by thecorporation.
Although the ABS does not publish a measure of overall private saving, it haspreviously published the gross profit of private non-financial and financialcorporations, enabling a National Accounts consistent measure of private savingto be constructed. However, the ABS no longer separates the income of financialcorporations between the private and public sectors. As such, it is no longerpossible to derive private saving directly from ABS data. While it is possible toconstruct a measure of private saving by estimating the private-sector’s share ofthe income of financial corporations, data limitations make this distinction inhistory difficult. The measures of private saving, private corporation saving andhousehold saving in Chart 6 are derived from data calculated under the currentNational Accounts methodology employed by the ABS (SNA 93) to the extent itis available, supplemented by data calculated under the previous NationalAccounts methodology (SNA 68). However, as discussed in Appendix A, this isnot the only approach that could be used to construct this measure.
An OECD study10 found that the offset (inverse correlation) between privatecorporation and household saving in the United States was between50-75 per cent. Chart 6 suggests that there is a similar inverse relationshipbetween household and corporate saving in Australia. In other words, theincrease in the early to mid-1970s, and the downward trend since then, inprivate saving as a percentage of GDP is less pronounced than that forhousehold saving. Whereas gross household saving rose from around14 per cent of GDP in the 1960s to peak at little below 18 per cent of GDP in themid-1970s, the rise in gross private saving was a little more modest, fromaround 19 per cent of GDP to around 22 per cent of GDP over the same period.Similarly, while the gross household ratio fell from a little below 18 per cent ofGDP in the mid-1970s to around 7½ per cent of GDP in 1997-98, the fall in grossprivate saving over this period was much more modest — from around22 per cent of GDP to around 15½ per cent of GDP.
9 Although to obtain saving by Australian households it is necessary to adjust this amount toreflect net foreign holdings.
10 Dean et al (1989).

31
Chart 6: Components of gross private saving
0
5
10
15
20
25
1962-63 1968-69 1974-75 1980-81 1986-87 1992-93 1998-99
0
5
10
15
20
25
Household Saving
Per cent of GDP Per cent of GDP
Private Saving
Private Corporation Saving
Source: ABS 5204.0, 5206.0 and Treasury estimates.
The trend in the measured private saving ratio in Australia has been broadlysimilar to that experienced in some other developed countries11 (see Chart 7). InCanada and the United States the measured private saving rate also increased inthe 1970s before falling back to a little below the average rate for the 1960s, andin both countries is now at broadly similar levels as a percentage of GDP to thelevel in Australia. Japan has had a measured private saving ratio consistentlyhigher than that of Australia, Canada and the United States. Its measuredprivate saving ratio has been trending upwards slowly over the 1990s, wideningthe gap between Japan’s private saving ratio and that of the other countries inChart 7.
11 The caution in footnote 1 about cross country comparisons of saving measures is equallyapplicable here.

32
Chart 7: Gross private saving — international comparison
10
15
20
25
30
1962 1967 1972 1977 1982 1987 1992 1997
10
15
20
25
30
Australia Canada US Japan
Per cent of GDP Per cent of GDP
Source: OECD Annual National Accounts and Treasury estimates.
Inflation adjusted private saving measure
The measure of gross private saving outlined above includes, in the net incomeof the private sector, the nominal interest received on interest-bearing debtinstruments less the nominal interest paid on debt. However, as noted in severalprevious studies,12 the nominal interest payment on debt has two components: areal component and an inflation component (the latter reflecting the change inthe value of the loaned funds caused by inflation). As, conceptually, the inflationcomponent of the interest payment represents a repayment of capital in realterms, it should not be regarded as income when received or an expense whenpaid. A number of researchers have argued that households distinguish betweenthese components of interest receipts or payments. This implies that a measureof private saving which is adjusted for the effect of inflation on nominal interestreceipts and payments is likely to be more representative of private savingbehaviour.13
As Chart 8 shows, the decline in the inflation-adjusted measure of gross privatesaving appears more muted. In summary, in the high inflation times of the
12 The merits in applying the above adjustments to interest payments and receipts have beenacknowledged by Anstie, Gray and Pagan (1982), as well as several other researchers,including Makin (1990, 1995), O’Mara and Walshaw (1992), Access Economics (1992), Nevile(1993), Fitzgerald (1993), Flynn (1993) and Bartley and Phipps (1995).
13 By limiting the inflation adjustment to interest-bearing debt, it is implicitly assumed that (inaggregate) an increase in value of the underlying non-interest bearing assets compensates theowners of these assets for the effects of inflation.

33
1970s, the inflation adjustment reduces the estimate of the gross private savingratio significantly. In contrast, with much lower inflation in the 1990s, theinflation adjustment is much less significant and has the effect of increasing themeasure of the gross saving ratio slightly, as the private sector interest bearingliabilities starts to exceed interest-bearing assets. Note that while the privatesector has become a net debtor in relation to interest-bearing securities in the1990s, the total assets of the private sector still exceeds its liabilities by asignificant margin. In the ABS National Balance Sheet, the net worth ofhouseholds has increased by an average real rate of around 4 per cent perannum since 1989-90 (see below). In other words, households have moved awayfrom interest bearing deposits to other assets.
Chart 8: Inflation adjusted gross private saving
12
14
16
18
20
22
24
1970-71 1974-75 1978-79 1982-83 1986-87 1990-91 1994-95 1998-99
12
14
16
18
20
22
24
Conventional
Inflation Adjusted
Per cent of GDP Per cent of GDP
Source: Treasury update of estimates in Bartley and Phipps (1995).
It should be noted that although conceptually the household saving ratio couldalso be adjusted for the effects of inflation, data limitations render suchadjustments impractical and/or unreliable. This is because the adjustmentrequires a detailed breakdown of cross holdings of interest bearing debtsbetween the household and private corporation sectors. Such a breakdown isnot required to adjust the private saving measure (as the cross holdings ofinterest bearing debts between the household and private corporation sectorscancel when aggregated to construct private saving). Nevertheless, it is likelythat the household saving ratio would be affected in a broadly similar manner asthe gross private saving measure by the effects of inflation over this period.
34
Other issues in measuring private saving
There is also a range of other adjustments that could be made to theconventional measurement of private saving, to reflect more accuratelyunderlying consumption/saving behaviour. These issues are discussed brieflybelow.
Consumer durables
The ABS classifies as consumption all of the expenditure by households ongoods, including expenditure on consumer durables (broadly, goods thatproduce benefits beyond the year in which they were purchased). Severalstudies14 have argued that, conceptually, expenditure on consumer durablesshould be capitalised and apportioned to the periods in which the benefit fromthe durable good accrues. In practice, where the expenditure on consumerdurables is relatively constant as a share of income, these adjustments are likelyto largely cancel each other out.15
The exclusion of consumer durables from final consumption would clearly leadto an increase in the measured level of gross household and private saving as aproportion of disposable income. However, the more relevant issue is how theclassification of expenditure on consumer durables affects the longer term trendin saving measures. Where expenditure on consumer durables is constant as aproportion of disposable income, the classification of consumer durables willnot affect the underlying trend in saving measures significantly. However,where the expenditure on consumer durables rises (or falls) as a proportion ofdisposable income, its classification can have a significant effect on the trend inmeasures of gross saving.
Chart 9 shows that expenditure on consumer durables declined as a proportionof disposable income from around 14 per cent in the early 1960s to around12 per cent at the start of the 1980s, after which it has remained broadlyconstant. As all expenditure on consumer durables is classified as finalconsumption, there is an inverse relationship between the rate of consumerdurable expenditure and National Accounts measures of saving. Thus, thehigher rate of consumer durables expenditure in the 1960s and 1970s suggests adownward bias in saving measures over this period relative to the 1980s and1990s, where the rate of consumer durables expenditure was lower.
14 See for example, Eisner (1988), Makin (1990, 1995), Depta, Ravalli and Harding (1994).
15 In other words, as a proportion of disposable income, new investment in consumer durablesbroadly offsets the depreciation of the existing stock of durables.

35
Chart 9: Expenditure on consumer durables (a)
11
12
13
14
15
1961-62 1967-68 1973-74 1979-80 1985-86 1991-92 1997-98
11
12
13
14
15Per cent of disposable income Per cent of disposable income
(a) Expenditure on consumer durables is defined as including furnishings, householdequipment, and goods for recreation and culture. These categories include some items thatprobably are not consumer durables, such as non-durable household goods, as moredetailed disaggregation of this expenditure is not available.
Source: ABS Cat. No. 5204.0.
Investment in human capital
On the other hand, it has been argued that increased expenditure on thedevelopment of ‘human capital’ has tended to depress saving measures overrecent decades. Several studies have noted that education and healthexpenditure, currently classified as consumption, have at least an element ofinvestment in that they are likely to give rise to future benefits.
Depta, Ravalli and Harding (1994) separated private sector expenditures oneducation and health into (immediate) consumption and investmentcomponents. They found that investment in education by the private sectorincreased from around ½ per cent of GDP in the 1960s to around 1 per cent ofGDP at the start of the 1990s. Although health investment was found to haveincreased from 2 per cent of GDP to 4 per cent of GDP over the same period, thiswas almost entirely attributable to the public sector.
Unlike consumer durables, this increase in the share of GDP devoted toinvestment in human capital over time suggests that the treatment of suchexpenditure as consumption has resulted in a downward bias in the trend inprivate saving measures over recent decades.

36
The impact of capital gains tax on saving measures
Both the ABS household saving ratio and the private saving measure derivedfrom the National Accounts, as outlined above, reduce the amount of saving bythe household and private sector respectively for the effects of various taxes onincome, including capital gains tax. However, capital gains (either realised orunrealised) are not included in the income of these sectors. This inconsistencyresults in a negative bias on these measures of private saving.
One approach to addressing this issue is to include taxable net capital gains inthe definition of income of these sectors. Although this would be relativelystraight-forward for the household sector, it would, in turn, raise additionalconsistency issues. For example, why would capital gains or losses that areuntaxed16 be excluded from such an adjustment? This adjustment is much moreproblematic for the private sector as a whole, as it would require a complexconsolidation process to avoid double counting.
A simpler, although perhaps less conceptually pure, approach to achievingconsistency is to disregard (ie, add back in) capital gains tax in arriving at savingmeasures. The rationale for this approach is that if an item is not included in theincome component of a saving measure then consistency requires that a tax onthat item should not be included in the expense component of the measure. Thisadjustment increases the measured level of the household and private saving.
Statistical revisions and discrepancies
The National Accounts measures of private saving outlined above involve, ineffect, the subtraction of an item measured on an expenditure basis from acombination of income accounts. Implicitly, this assumes that there is nodiscrepancy between these numbers. However, while in principle thesemeasures of output should be equivalent, in practice as the data sources for eachmeasure are independent they can produce different results. As a result, abalancing adjustment — referred to as the statistical discrepancy17 — is requiredto reconcile these measures.
Several studies18 have noted the potential for the statistical discrepancy to havean impact on private saving measures. For example, if the statistical discrepancyis positive — that is, output on the income measure exceeds that on theexpenditure measure — this suggests that either income is overstated,expenditure is understated or both. Edey and Britten-Jones (1990) found that
16 For example, due to exemption, indexation or transitional rules.
17 In this case it is the statistical discrepancy on the expenditure account less the statisticaldiscrepancy on the income account. In practice this simplifies to output on the income basisless output on the expenditure basis.
18 See for example Gregory (1989), Edey and Britten-Jones (1990) and Fitzgerald (1993).

37
where the statistical discrepancy was subtracted19 from the private savingmeasure, the trend over recent decades did not appear to be disturbed. As theynoted, this is likely to be the maximum impact of the discrepancy between theexpenditure and income accounts on the private saving measure.
Chart 10 illustrates the size of the likely maximum adjustment to the privatesaving measure by showing the statistical discrepancy as a percentage of GDP.The positive statistical discrepancy through the 1960s to the mid-1970s, and inthe late 1980s, may have resulted in measured private saving being overstatedover these periods, particularly in the mid-1970s where the statisticaldiscrepancy was around 2 per cent of GDP. Conversely, the negative statisticaldiscrepancy from the late 1970s to the mid-1980s, and in the early 1990s,suggests that measured private saving may have been understated over theseperiods.
Chart 10: Size of statistical discrepancy as a per cent of GDP
-5
-4
-3
-2
-1
0
1
2
3
4
5
1962-63 1968-69 1974-75 1980-81 1986-87 1992-93 1998-99
-5
-4
-3
-2
-1
0
1
2
3
4
5Per cent of GDP Per cent of GDP
Source: ABS Cat. No. 5204.0, 5206.0.
Beginning with 1994-95, and for each subsequent year up to the year prior to thelatest complete financial year (currently 1996-97 for the annual NationalAccounts and 1997-98 for the quarterly National Accounts), balanced supplyand use tables have enabled the ABS to reconcile the differences between thethree broad approaches to measuring GDP.20 As a result, the same measure of
19 The statistical discrepancy is subtracted in this instance as it is assumed that a positivediscrepancy means that either income is lower or final consumption is higher than implied inthe private saving measure, both of which reduce the private saving measure.
20 See ABS information paper, Upgraded Australian National Accounts for further explanation.

38
GDP is obtained regardless of approach, so the quarterly statistical discrepanciesin these financial years sum to zero. However there is currently a non-zerostatistical discrepancy for the 1997-98 and 1998-99 financial year, as the balancedsupply and use table for these years21 has not yet been compiled.
Net private saving
A downward trend over recent decades is somewhat more evident in the netprivate saving measure. Chart 11 compares the gross, net and inflation-adjustednet private saving measures over time. Although movements in these measuresof private saving have been broadly similar over recent decades, the net privatesaving measures have fallen a little more as private sector depreciation as apercentage of GDP has increased, although, as with the gross saving measure,adjusting the net private saving measure for inflation reduces the extent of thisdecline. More detail on the calculation and components of net private saving iscontained in Appendix B.
Chart 11: Comparison of net and gross private saving
0
3
6
9
12
15
18
1962-63 1968-69 1974-75 1980-81 1986-87 1992-93 1998-99
7
10
13
16
19
22
25
Net Private Saving (LHS)
Gross Private Saving (RHS)
Per cent of GDP Per cent of GDP
Inflation-Adjusted Net Private Saving (LHS)
Source: ABS Cat. No. 5204.0, 5206.0 and Treasury estimates.
21 Although the statistical discrepancy has been eliminated for the 1997-98 financial year in thequarterly national accounts, this will not be translated to the additional detail of the annualnational accounts (used in calculating the private saving measure) until the 1998-99 annualnational accounts are released.

39
Changes in net worth
The pure economic definition of saving is the change in the wealth or net worthof households from one period to the next. In this context, an importantlimitation of conventional measures of saving is that they do not take intoaccount the effect of changing asset values on the wealth of households.
There have been several attempts to estimate Australian net private sectorwealth. Treasury has published annual estimates of Australian net private sectorwealth since the Summer 1990 issue of the Economic Roundup. These estimatesrelate to financial and physical wealth only and do not make any attempt tovalue natural resources or human capital. Chart 12 shows annual economicsaving of the private sector as measured by the annual growth in real andnominal private net wealth (at market value) over the period since the early1960s. The growth in real wealth has been volatile over time, particularlythrough the 1970s and 1980s, where high inflation appears to have had asignificant impact. In the 1990s, growth in real wealth has generally exceeded itslong run average with lower volatility than previous decades due to lowerinflation. Although the rate of growth of both nominal and real wealth wasslower through the year to June 1998 than in the previous year, real wealthcontinued to grow faster than its long run average.
Chart 12: Growth in Australian net private sector wealth at market value (a)
-15
-10
-5
0
5
10
15
20
25
30
35
40
1962 1965 1968 1971 1974 1977 1980 1983 1986 1989 1992 1995 1998
-15
-10
-5
0
5
10
15
20
25
30
35
40
Nominal
Real
Average real growth 1962 to 1998
Per cent Per cent
(a) As at June 30.Source: Treasury update of estimates in the Summer 1999 Economic Roundup.
With the publication by the ABS of the National Balance Sheet it is also possibleto obtain a measure of net household saving based on the change in net worth

40
from 1989-90 to 1997-98. The National Balance Sheet values some assets(‘produced assets’ ) on a replacement cost basis and other assets on a marketvalue basis, whereas the Treasury wealth measure estimates the value of allassets on a market value basis. This is the principal difference between the ABSand Treasury wealth measures. Although the ABS measure includes some assetcategories not included in the Treasury measure, neither of the measuresattempts to value human capital. Chart 13 shows the annual growth in real andnominal private wealth of households under the ABS measure. As with theTreasury measure, real net wealth has grown strongly through most of the1990s. However, the relatively short history of this series cautions againstreading too much into these data in relation to longer term trends.
Chart 13: Growth in private net worth
-4
-2
0
2
4
6
8
10
12
14
1990 1991 1992 1993 1994 1995 1996 1997 1998
-4
-2
0
2
4
6
8
10
12
14Per cent Per cent
Nominal
Real
Average real growth 1990 to 1998
Source: ABS Cat. No. 5241.0.
In summary, the Treasury and ABS measures of net private sector wealthsuggest that the real net worth of Australian households has grown strongly inthe 1990s. As net wealth measures include the full effects of asset revaluations(both appreciation and depreciation), they are not directly comparable in levelterms to the private saving measures in Charts 8 and 12. Nevertheless, netwealth measures are consistent with the view that private saving (whethermeasured on a gross or net basis) has shown only a mild downward trend, ifany, over recent decades.22
22 The higher level of fluctuations in net wealth measures reflects the inclusion of assetrevaluations in these measures.

41
Conclusion
The significant decline in the ABS net household saving ratio since themid-1970s appears to reflect limitations in the measurement and classification ofthis measure rather than a significant change in saving behaviour.
Broader measures of the saving behaviour of Australian households, such asgross and net private saving (particularly after adjustment for inflation) andchanges in net worth, present a much different picture. While there areuncertainties about the appropriate definition and measurement of saving, thesebroader measures of private saving have shown a much less pronounceddownward trend than the ABS net household saving ratio.

42
REFERENCES
Access Economics 1992, ‘The ANZ Saving Measure: a new quarterly measure ofAustralia’s saving performance’ , Canberra.
Anstie, R.K., Gray, M.R. and Pagan, A.R. 1982, ‘ Inflation and the consumptionratio’ , in Pagan, A.R. and Trivedi, P.K. (eds), The effects of inflation, Centre forEconomic Policy Research, Australian National University, Canberra.
Australian Bureau of Statistics, Australian System of National Accounts, CatalogueNumber 5204.0
——, National Income, Expenditure and Product, Catalogue Number 5206.0.
——, National Balance Sheet, Catalogue Number 5241.0.
——, Upgraded Australian National Accounts, Catalogue Number 5253.0.
——, Australian National Accounts — Concepts, Sources and Methods,Catalogue Number 5216.0.
Australian Taxation Office, 1986-87 to 1996-97, Taxation Statistics.
Bartley, S. and Phipps, S. 1995, Inflation adjustment of private and public savingand the current account deficit, a paper presented at the 24th Conference ofEconomists, Economic Society of Australia, Adelaide, September.
Bladen-Hovell, R.C. and Richards, G.M. 1983, ‘ Inflation and Australian SavingsBehaviour, 1959-1981’ , Australian Economic Papers, vol. 22, pp. 290-301.
Carroll, C.D. 1991 ‘Buffer Stock Saving and the Permanent Income Hypothesis’ ,Board of Governors of the Federal Reserve System, mimeo.
Covick, O. and Higgs, B. 1995, Will the Australian government’ssuperannuation initiatives increase national saving?, a paper presented at the24th Conference of Economists, Economic Society of Australia, Adelaide,September.
Dardanoni, V. 1991, ‘Precautionary savings under income uncertainty: across-sectional analysis’ , Applied Economics 23, pp. 153-160.
Dean, A, et al 1989, Saving Trends and Behaviour in OECD Countries, OECD Paris,Working Paper no. 67.
Depta, P., Ravalli, F., and Harding, D., Extended Measures of Investment andSaving, Treasury Research paper No. 8. Commonwealth Treasury, Canberra.
Edey, M. and Britten-Jones, M. 1990, ‘Saving and Investment’ , in Grenville, S.(ed) The Australian Macroeconomy in the 1980s, 20-21 June, Reserve Bank ofAustralia, pp. 79-158.

43
Eisner, R., 1988, ‘Extended Accounts for National Income and Product’ , Journalof Economic Literature, Vol. 26, pp. 1611-1684.
FitzGerald, V.W. 1993, National savings: a report to the Treasurer, AGPS, Canberra.
Flynn, B. 1993, Aggregate saving in Australia: measurement and trends, TreasuryResearch Paper, no. 7, Commonwealth Treasury, Canberra.
Gregory, R.G., 1989, ‘The Current Account and Australian Economic Policyunder the Labor Government’ , paper prepared for the 18th Pacific Trade andDevelopment Conference, December 11-14, Kuala Lumpur, Malaysia.
McKissack, A. and Sedgley, P. 1993, ‘The Effectiveness of Personal Savings inAustralia’ , paper presented to the Conference of Economists, 27-30 September1993.
Makin, T. 1990, The real federal budget imbalance, University of QueenslandDiscussion Paper in Economics, no. 24.
—— 1990, Inflation and the external account: Australia in the 1980s, University ofQueensland Discussion Paper in Economics, no. 35.
—— 1995, ‘ Inflation distortion of the external accounts: the Australian example’ ,Journal of Economic Studies, vol. 22 no. 1, pp. 58-66.
Masson, P.R., Bayoumi, T. and Samiei, H. 1995, ‘Saving behaviour in industrialand developing countries’ , in International Monetary Fund, Staff Studies for theWorld Economic Outlook, World Economic and Financial Surveys, Washington.
Nevile, J. 1993, ‘Structural deficits and fiscal policy’ , in Maxwell, P. andHopkins, S. (ed), Macroeconomics, contemporary Australian readings, Harper,Pymble, NSW.
O’Mara, L.P. and Walshaw, T.J. 1992, ‘Some implications of inflation adjustmentof interest payments on Australia’s foreign debt’ , Economic Analysis and Policy,vol. 22, no. 1, March, pp. 51-65.
OECD 1994, Taxation and Household Saving, OECD, Paris.
Treasury, 1999, Australian Net Private Wealth, Summer, Economic RoundUp,pp. 71-81.

44
APPENDIX A
Alternative approaches to constructing a SNA 93 consistentmeasure of gross private saving
The ABS does not currently publish a measure of overall private saving. Rather,it publishes separate income and capital accounts for the household (includingnon-profit institutions serving households and unincorporated enterprises) andthe non-financial private corporations sectors. Under current internationalstandards (known as SNA93), the ABS also publishes a capital account for theaggregate financial corporation sector. To construct an overall measure ofprivate saving, this financial corporation saving needs to be allocated betweenthe public and private sectors and added to the saving by the household andnon-financial private corporation sectors. Another difficulty with deriving aconsistent measure of private saving over time is that, at present, the ABS hasonly recalculated the income and capital accounts for the public and privatenon-financial corporation sectors back to 1989-90. The remainder of thisAppendix discusses three alternative approaches for trying to overcome theseproblems.
These approaches make use of the fact that, prior to the adoption of the currentinternational standards (SNA93), the ABS separately identified the public andprivate components of the financial corporation sector. These data are availablefrom 1969-70 to 1996-97 and was prepared on the basis of the previousinternational standard known as SNA68. However, this data are not directlycomparable with that which has been prepared on an SNA93 basis. Not least ofthese difficulties are the differences in the ‘asset boundary’ between the twostandards. Another complication is the reclassification of the state governmentcentral borrowing authorities from the general government sector under SNA68to the financial corporation sector under SNA93.
Approach 1: Split SNA 93 National Saving using SNA 68 private and publicsplits
This approach to constructing SNA 93 consistent measures of private and publicsaving uses the split between the two saving measures already available underthe SNA 68 standard. This approach involves taking the ratio of private savingto national saving under the SNA 68 and multiplying this by national saving onan SNA 93 basis. The same is then also done for public saving (or alternatively itcan be derived as a residual of the other two). This means that the total of thepublic and private saving measures calculated is consistent with the SNA 93calculation of national saving.
A limitation of this approach is that it does not capture some differences in theclassification and definition of the components of public and private saving inthe SNA 68 and SNA 93 methodologies. In particular, it is unclear whether thedifference between national saving on an SNA 68 and an SNA 93 basis has been

45
allocated correctly since the approach ignores information on the allocation ofthis difference between the general government, non financial public, nonfinancial private and household sectors. For example, the new treatment ofunfunded superannuation for general government employees under SNA 93will have had a significant impact on the saving of the general government andhousehold sectors.23
A second limitation of this approach is that SNA 68 data are only available up to1996-97. As a result, it has been assumed that the split between public andprivate saving in 1997-98 and 1998-99 is the same as in 1996-97.
The main strengths of this approach are that it is simple to calculate and that itslimitations are relatively transparent.
Approach 2: Use SNA 93 data when available, and use SNA 68 data when theyare not
An alternative approach to the construction of private and public saving wouldbe to use SNA 93 data to the extent they are available and use SNA 68 datawhen they are not.
Under the SNA93 standard, data are available for household and generalgovernment saving back to 1959-60. Data are also available for non-financialcorporation saving (broken down between the public and private sectors) from1989-90 to 1997-98. To construct a public and private saving measure, financialcorporations can be split between public and private using SNA68 data goingback to 1959-60. This allows public and private saving to be calculated from the‘bottom up’ , adding each of the components, from 1989-90 to 1996-97.Non-financial corporations can then be split between public and private from1959-60 to 1989-90 using SNA68 data, and then ‘spliced’ onto the SNA93 series.It is necessary to assume that the split between public and private financialcorporations remains the same in 1997-98 and 1998-99 as it was in 1996-97 andthe split between public and private non-financial corporations is the same in1998-99 as in 1997-98.
This approach has the limitation of being more complex than Approach 1. As ituses both SNA 93 and SNA 68 data to ‘construct’ private saving, there is agreater prospect of it being affected by classification and definitional differencebetween these methodologies.
23 See Table 4.2, ABS Information Paper, Upgraded Australian National Accounts, ABSCat. No. 5253.0.
46
Approach 3: Use SNA 93 data on saving when available, and the relationshipbetween net lending, saving and investment when it is not
Another approach to calculating private saving is through the relationshipbetween public, private and national net lending, saving and investment. Publicsaving is calculated first, with private saving the residual from national saving.
Public net lending (or the PSBR) is required to calculate the level of publicsaving and hence private saving. General government net lending is availableon a SNA 93 basis and is used directly (as is the case in Approach 2, wheregeneral government saving was able to be used directly). Public non-financialnet lending is available from 1989-90 to 1997-98 on a SNA 93 basis. Over thisperiod it again is used directly. Prior to 1989-90, public non-financial net lendingis sourced from the RBA Australian economic statistics (on an SNA 68 basis).Public financial net lending is imputed, as the residual of total financial netlending (which is published on an SNA 93 basis) and private financial netlending (which is published on an SNA 68 basis up to 1996-97). It is assumedthat subsequent to 1996-97 public financial net lending is zero, as all excessfunds are distributed to the general government sector.
With public net lending (calculated as the sum of the three components above),public saving is calculated as public net lending plus public investment(available on a SNA 93 basis). Private saving is derived as national saving(available on a SNA 93 basis) less the calculated level of public saving.
Which approach is preferable?
There are reasonable grounds for adopting each of these approaches toconstructing a SNA 93 private saving measure would be acceptable. Indeed, asshown in Chart 14, they follow a similar trend over time. In this paper,Approach 2 is adopted. Although more complex than Approach 1, it isconsidered to be more likely to provide an accurate reflection of the privatesaving as measured by the SNA93 national accounts. Although Approach 3 mayprove to be superior in time, further work is required to test the validity ofassumptions underpinning its construction.
Short of the ideal solution to this dilemma — ie, the publication of a nationalaccounts consistent measure of private saving by the ABS — analyses of privatesaving in Australia should be cognisant of the fact that there are severalapproaches to the measurement of this measure.

47
Chart 14: Comparison of measures of private saving
10
12
14
16
18
20
22
24
26
1962-63 1968-69 1974-75 1980-81 1986-87 1992-93 1998-99
10
12
14
16
18
20
22
24
26Per cent of GDP Per cent of GDP
Approach 1
Approach 2
Approach 3
Source: ABS Cat. No. 5204.0, 5206.0 and Treasury estimates.

48
APPENDIX B
Construction and components of the net private saving measure
To assist international comparisons, the analysis in the body of this paperfocuses on gross, rather than net, measures of private saving derived from theNational Accounts. However, as noted in the paper, when properly measuredthe net measure of saving is more conceptually correct. The purpose of thisAppendix is to outline how net private saving measure can be derived from thenational accounts and to show the effect of using net rather than gross privatesaving on the components of private saving.
How is net private saving calculated?
Net private saving is defined as gross private saving less private sectordepreciation. Appendix A outlines how gross private saving is constructed. Asimilar methodology is employed in calculating SNA 93 consistent measure ofprivate sector depreciation (and thus net private saving).
The ABS does not publish a SNA 93 consistent measure of depreciation for theprivate sector as a whole, although it does publish depreciation for the economyas a whole. However, prior to the adoption of the current internationalstandards (SNA93), the ABS separately identified the public and privatecomponents of depreciation in the annual national accounts. As with grossprivate saving, this data are available from 1969-70 to 1996-97 and was preparedon the basis of the previous international standard, SNA 68.
This approach to constructing SNA 93 consistent measures of private and publicdepreciation uses the split between the two saving measures already availableunder the SNA 68 standard. This approach involves taking the ratio of privatedepreciation to national depreciation under the SNA 68 and multiplying this bynational saving on an SNA 93 basis. The same is then also done for publicdepreciation (or alternatively it can be derived as a residual of the other two).This means that the total of the public and private saving measures calculated isconsistent with the SNA 93 calculation of national saving.
The resultant private sector depreciation is subtracted from gross private savingdetermined under Approach 1 of Appendix A to arrive at net private saving.
A limitation of this approach is that it does not capture some differences in theclassification and definition of the components of public and privatedepreciation in the SNA 68 and SNA 93 methodologies. In particular, there weresignificant changes to the calculation of depreciation in the move to the SNA 93basis that could have affected the public/private mix of total depreciation.
Components of net private saving
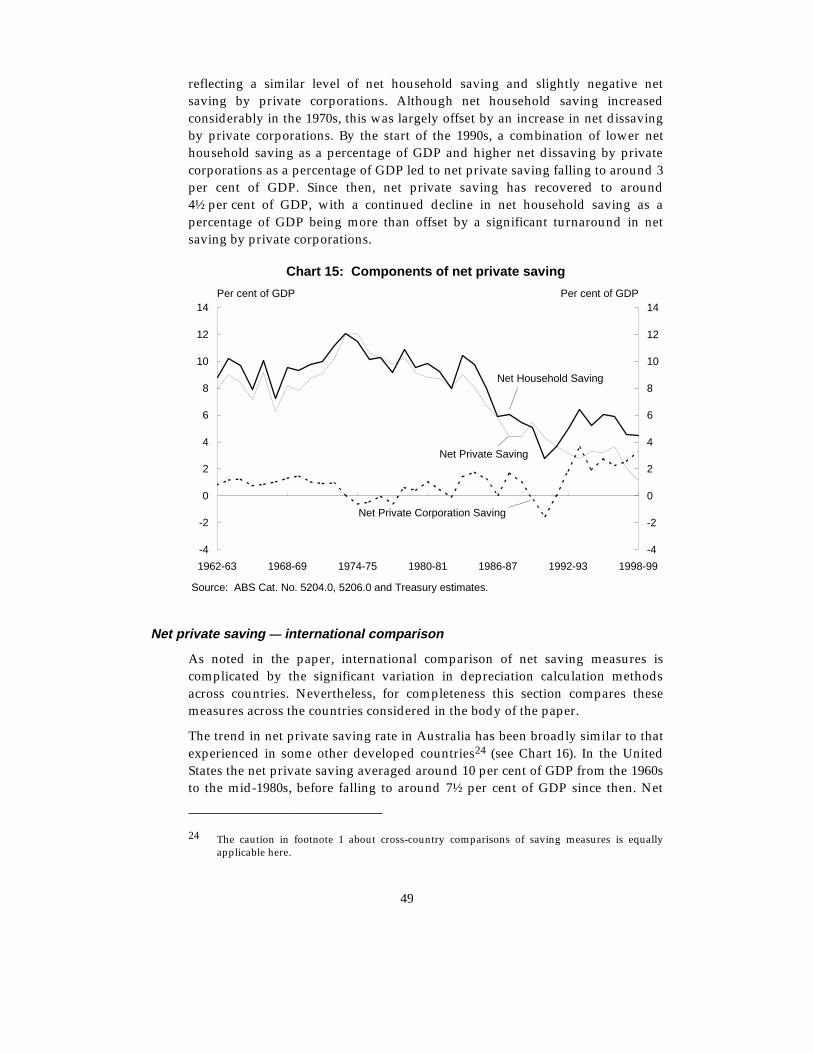
Chart 15 illustrates the components of net private saving as a percentage ofGDP. Over the 1960s net private saving averaged around 9 per cent of GDP,
49
reflecting a similar level of net household saving and slightly negative netsaving by private corporations. Although net household saving increasedconsiderably in the 1970s, this was largely offset by an increase in net dissavingby private corporations. By the start of the 1990s, a combination of lower nethousehold saving as a percentage of GDP and higher net dissaving by privatecorporations as a percentage of GDP led to net private saving falling to around 3per cent of GDP. Since then, net private saving has recovered to around4½ per cent of GDP, with a continued decline in net household saving as apercentage of GDP being more than offset by a significant turnaround in netsaving by private corporations.
Chart 15: Components of net private saving
-4
-2
0
2
4
6
8
10
12
14
1962-63 1968-69 1974-75 1980-81 1986-87 1992-93 1998-99
-4
-2
0
2
4
6
8
10
12
14
Net Private Corporation Saving
Net Private Saving
Net Household Saving
Per cent of GDP Per cent of GDP
Source: ABS Cat. No. 5204.0, 5206.0 and Treasury estimates.
Net private saving — international comparison
As noted in the paper, international comparison of net saving measures iscomplicated by the significant variation in depreciation calculation methodsacross countries. Nevertheless, for completeness this section compares thesemeasures across the countries considered in the body of the paper.
The trend in net private saving rate in Australia has been broadly similar to thatexperienced in some other developed countries24 (see Chart 16). In the UnitedStates the net private saving averaged around 10 per cent of GDP from the 1960sto the mid-1980s, before falling to around 7½ per cent of GDP since then. Net
24 The caution in footnote 1 about cross-country comparisons of saving measures is equallyapplicable here.

50
private saving in Canada was around 6 per cent of GDP at the start of the 1960sbefore increasing to around 12 per cent of GDP in the mid-1980s. Since then theCanadian net private saving rate has fallen back to around 4 per cent of GDP.Net private saving in Japan rose from slightly above the rate of the UnitedStates, Canada and Australia at the start of the 1970s to peak above 16 per centof GDP in the mid-1970s. In the 1980s Japan’s net private saving rate was similarto that of the United States and Canada. Since then, Japan’s net private savingrate has risen to around 12 per cent of GDP at present, significantly above therate in Australia, Canada and the United States.
Chart 16: Net private saving — international comparison
0
2
4
6
8
10
12
14
16
18
1961 1964 1967 1970 1973 1976 1979 1982 1985 1988 1991 1994 1997
0
2
4
6
8
10
12
14
16
18
Australia Canada US Japan
Per cent of GDP Per cent of GDP
Source: OECD Annual National Accounts and Treasury estimates.