Embed Size (px)
Citation preview

The Mean Doesn’t Mean As Much Anymore
Stephen J. Rubergin conjunction with
Lei Chen, Yanping Wang, Doug Haney
Eli Lilly & Company
The University of PennsylvaniaAnnual Conference on Statistical Issues in Clinical Trials - Targeted Therapies29 April 2009
Company ConfidentialCopyright © 2000 Eli Lilly and Company

Disclosure
• I am a full time employee of Eli Lilly• I own stock in Eli Lilly• I will be using examples involving 2 Eli Lilly compounds• The examples represent ongoing analysis and
interpretation by Eli Lilly and represent off-label information
Company ConfidentialCopyright © 2000 Eli Lilly and Company
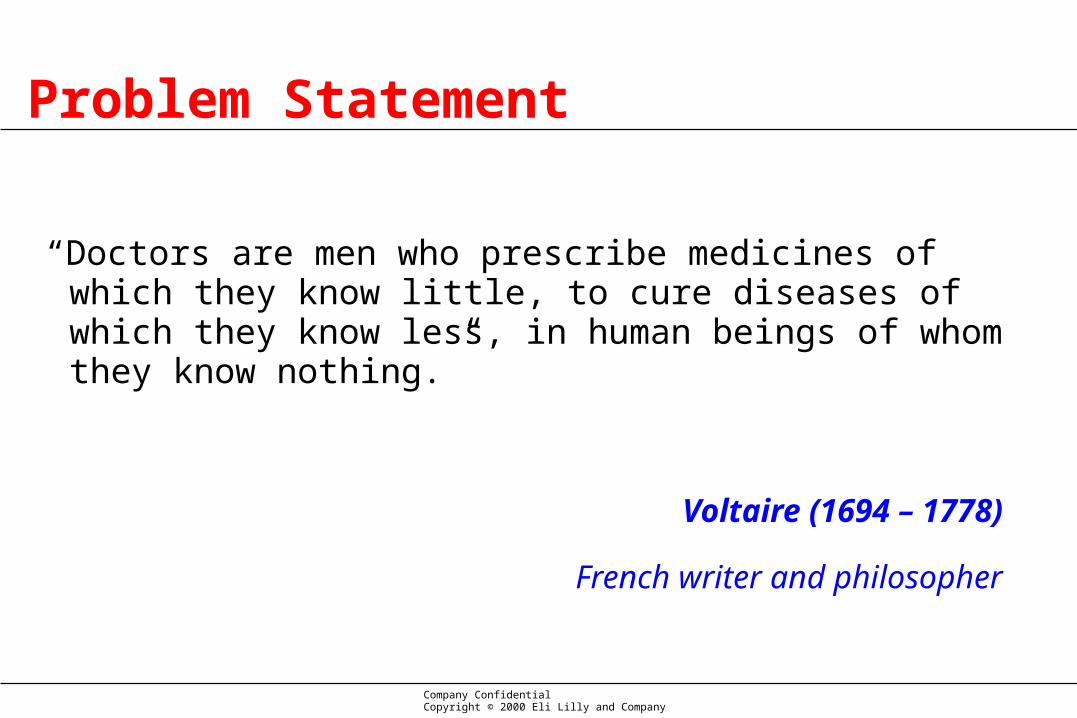
Problem Statement
“Doctors are men who prescribe medicines of which they know little, to cure diseases of which they know less, in human beings of whom they know nothing.”
Voltaire (1694 – 1778)
French writer and philosopher
Company ConfidentialCopyright © 2000 Eli Lilly and Company

60%
60%
51%
50%
48%
47%
40%
30%
Asthma
Cardiac Arrythmias
Migrane
Rheumatoid arthritis
Osteoporosis
Hepatitis C virus
Incontinence
Alzheimer's
Oncology
Spear et al. TRENDS in MolecularMedicine Vol. 7 No. 5 May 2001
Therapeutic Area Effective Rate (%)
25%
On average only about 50% of patients respond
to prescribed drugs
Average drug efficacy is low
Problem Statement
Company ConfidentialCopyright © 2000 Eli Lilly and Company

Average Effects Active Drug vs. Placebo
-16
-14
-12
-10
-8
-6
-4
-2
0
0 1 2 3 4 5 6
week
ch
an
ge
of
BP
RS
to
tal
fro
m b
ae
lin
e
Active Drug (n=252)
Placebo (n=170)
* * * * **
*p<0.001
Problem Statement
Company ConfidentialCopyright © 2000 Eli Lilly and Company

The Individual and Group Profile
Time
Week 0 Week 1 Week 2 Week 3 Week 4 Week 5 Week 6
BP
RS
Posit
ive S
core
0
5
10
15
20
25
AntipsychoticPlaceboIndividual Trajectories
Problem Statement
Company ConfidentialCopyright © 2000 Eli Lilly and Company

Conclusion
It is not enough to show the mean effect of a new treatment is statistically significantly better than control.
Patients, physicians, payers want (are demanding) more.
Problem Statement
Company ConfidentialCopyright © 2000 Eli Lilly and Company

Dimensions of Tailored Therapeutics
Perspectives
One size fits allOne size fits all
GOAL: Improve individual patient outcomes and health outcome predictability through tailoring drug, dose, timing of treatment, and relevant information.
TailoringTailoring (e.g. oncology productscomprising drug and
companion diagnostic)
Targeted TherapyTargeted Therapy
Prospective
Retrospective
The Continuum
Company ConfidentialCopyright © 2000 Eli Lilly and Company
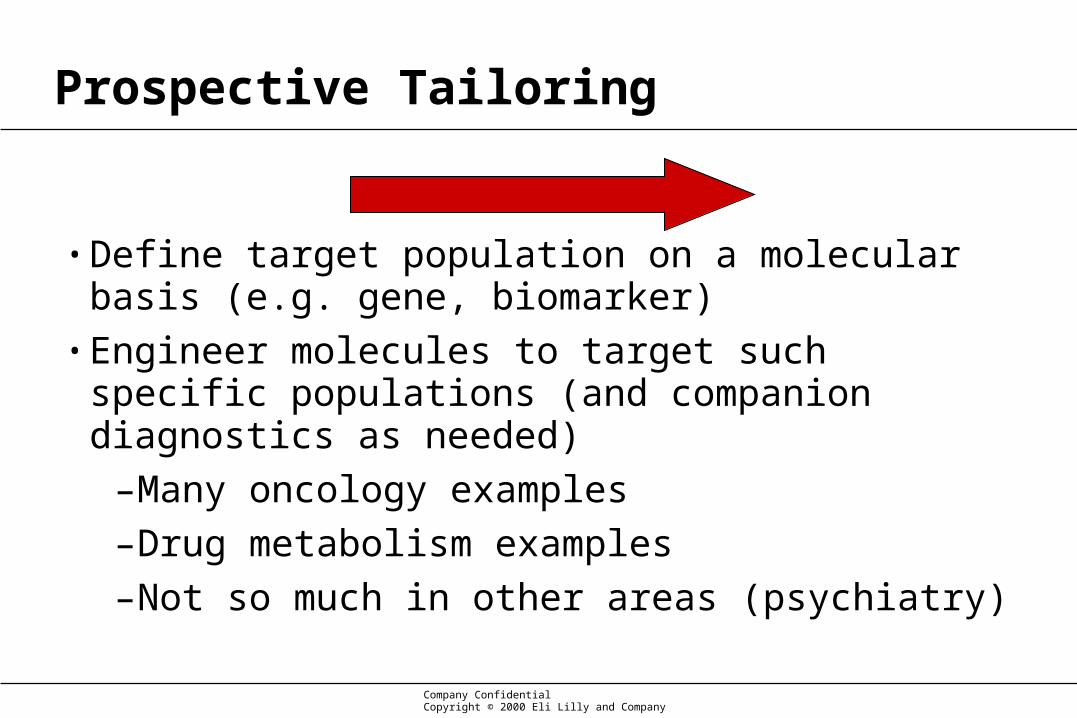
Prospective Tailoring
• Define target population on a molecular basis (e.g. gene, biomarker)
• Engineer molecules to target such specific populations (and companion diagnostics as needed)
–Many oncology examples
–Drug metabolism examples
–Not so much in other areas (psychiatry)
Company ConfidentialCopyright © 2000 Eli Lilly and Company
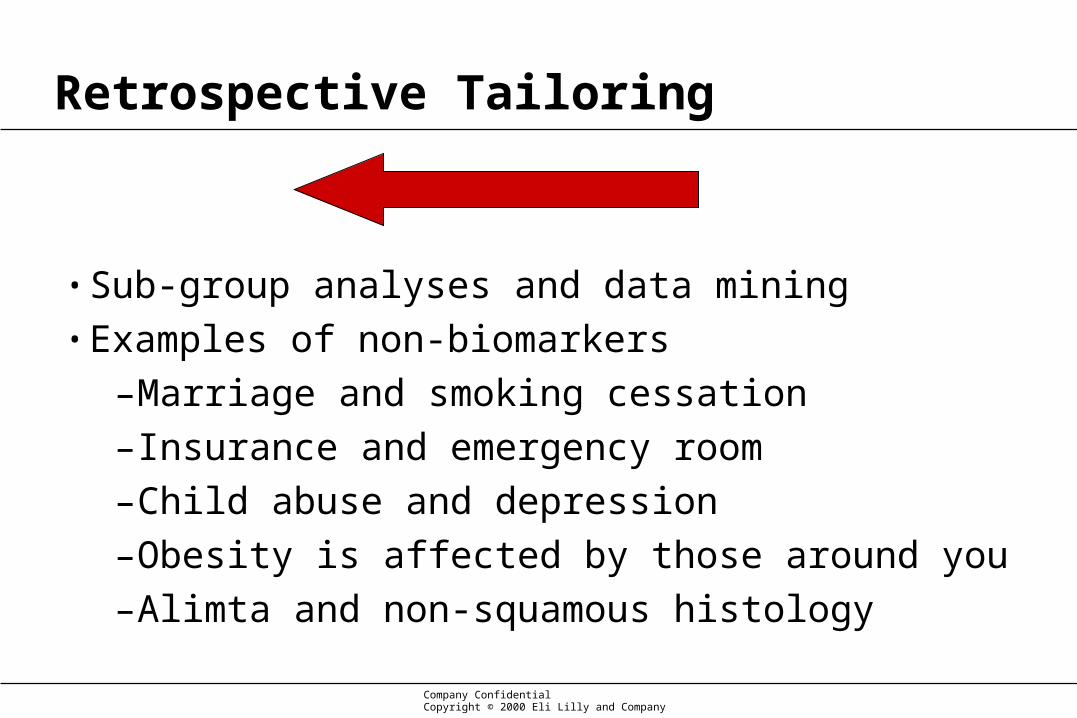
Retrospective Tailoring
• Sub-group analyses and data mining• Examples of non-biomarkers
–Marriage and smoking cessation
–Insurance and emergency room
–Child abuse and depression
–Obesity is affected by those around you
–Alimta and non-squamous histology
Company ConfidentialCopyright © 2000 Eli Lilly and Company

Tailoring to the Whole Patient
Co-Morb
iditi
es
Obesity
Vascular Comp.
HTN
Hi LDL-CHi Triglyceride
Disease Parameters
Pre-D
iabetesType II – E
xer/Wgt
Type II – 1 Oral
Type II – 2 Oral
Type II – 2 Oral + Ins
Type II – 2 Oral + G
lpType I
Patient Factors
Genetics
Compliance
Diet / Exercise
Personal History
Demographics
Positive Benefit-Risk
Negative Benefit-Risk
Diabetes Illustration
•Each box represents a phenotype•The calculus of benefit risk may
change for each phenotype
Source: Paul, S. Tailoring Therapies for Better Patient Outcomes: Drug Development Meets Evidence-Based Medicine. IOM 37th Annual Meeting presentation – Oct 8, 2007.
Company ConfidentialCopyright © 2000 Eli Lilly and Company

Tailored Therapeutics Analysis(From Sub-group Analysis To Variable Selection)
Traditional Approach Proposed Approach
Efficacy Model
Y = f (TRT, xi)
Assess well-known sub-groups
Age, Gender, Race, Baseline
Sub-group Analysis (one at a time)
Y = f (TRT, xi) + Age + TRT*Age
heterogeneity test
Define Responders / Non-responders
Efficacy: Y1, Y2
Safety: S1, S2, S3
Possible Predictors (100’s)
Baseline, Early Response, PK,
Genomic, Environmental? Social?
Data Mining – Classification Trees, …
Company ConfidentialCopyright © 2000 Eli Lilly and Company

A decision tree model consists of a set of rules for
dividing a large heterogeneous population into
smaller, more homogeneous groups
with respect to
a particular target variable (e.g., adverse event).
Very useful for finding complex interactions.
Tailored Therapeutics Analysis(From Sub-group Analysis To Variable Selection)
Company Confidential Copyright © 2000 Eli Lilly and Company
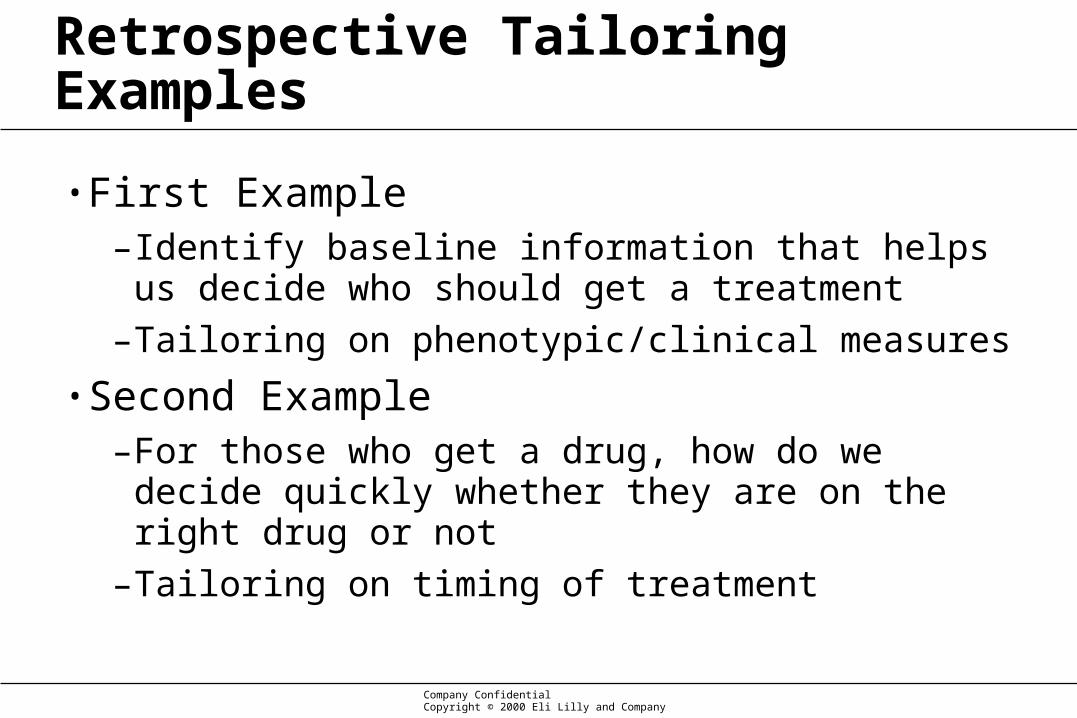
Retrospective Tailoring Examples
• First Example–Identify baseline information that helps us decide
who should get a treatment
–Tailoring on phenotypic/clinical measures
• Second Example–For those who get a drug, how do we decide quickly
whether they are on the right drug or not
–Tailoring on timing of treatment
Company ConfidentialCopyright © 2000 Eli Lilly and Company
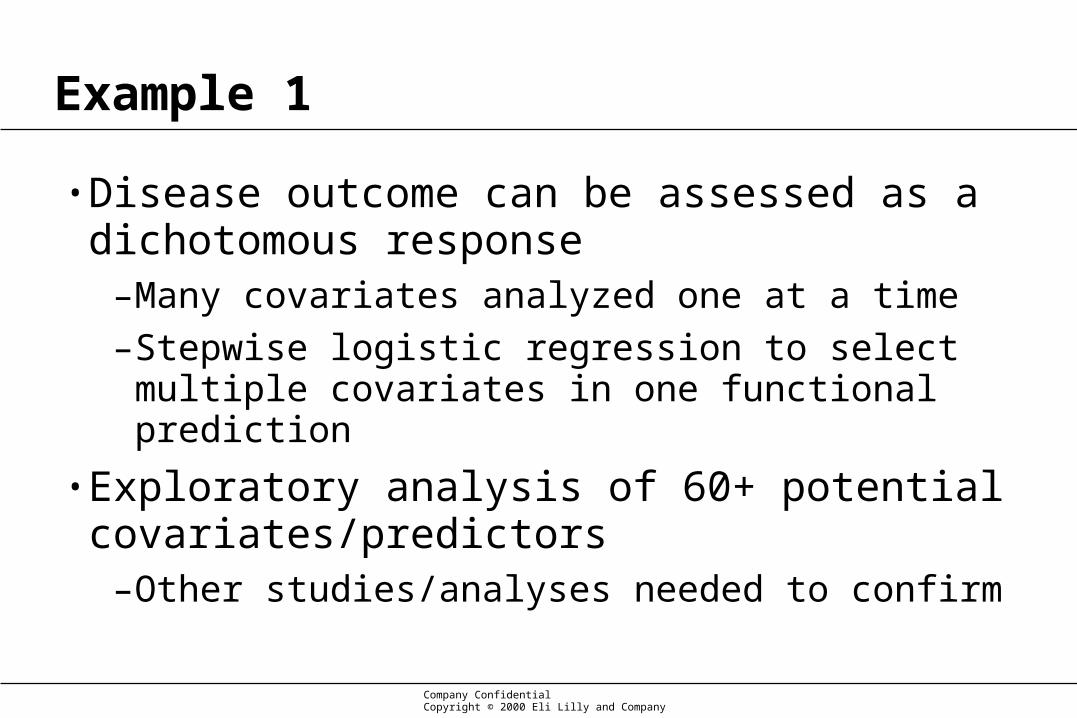
Example 1
• Disease outcome can be assessed as a dichotomous response
–Many covariates analyzed one at a time
–Stepwise logistic regression to select multiple covariates in one functional prediction
• Exploratory analysis of 60+ potential covariates/predictors
–Other studies/analyses needed to confirm
Company ConfidentialCopyright © 2000 Eli Lilly and Company

Example 1 - ObjectiveWhat marker(s) can be used to predict the largest
population of patients that are most responsive to Treatment?
If the belief is such that Treatment works best in the highest risk patients, what marker(s) are the best predictors of high risk?
What are the simplest marker(s)?Easiest to measure, least expensive, availableMeasurable / responsive over timeCould a ‘complex’ marker be made simpler thru a new diagnostic?
What is the sub-group size associated with marker(s)?Company ConfidentialCopyright © 2000 Eli Lilly and Company
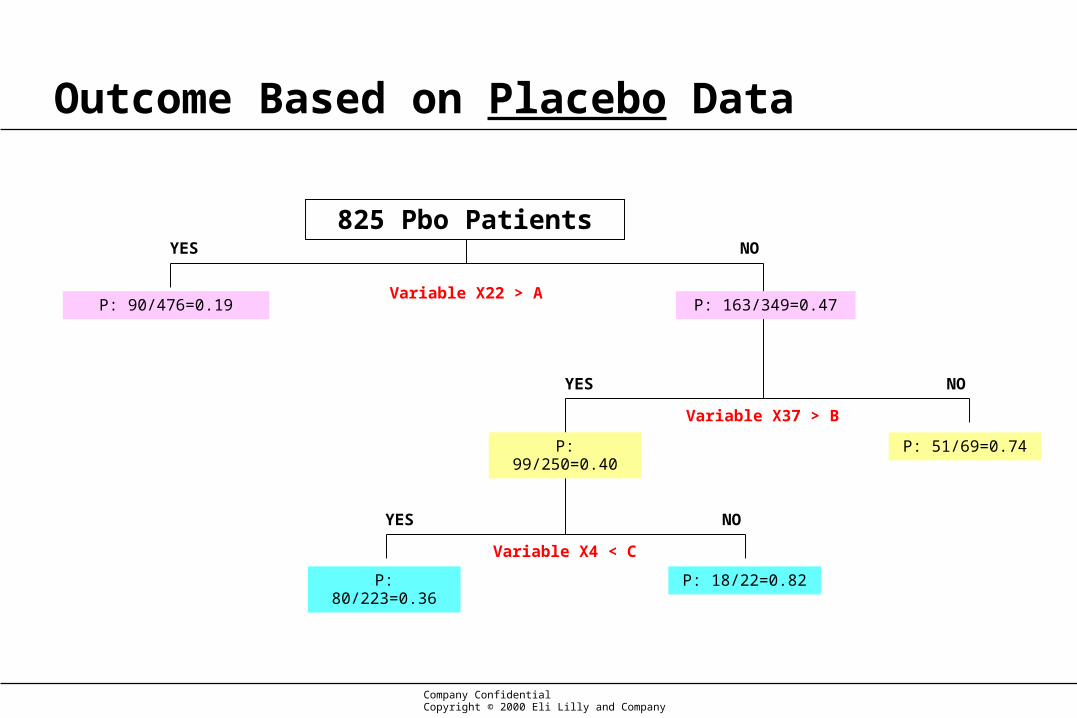
Outcome Based on Placebo Data
Variable X22 > AP: 90/476=0.19
P: 80/223=0.36 P: 18/22=0.82
P: 51/69=0.74P: 99/250=0.40
P: 163/349=0.47
Variable X37 > B
Variable X4 < C
825 Pbo PatientsYES
YES
YES
NO
NO
NO
Company ConfidentialCopyright © 2000 Eli Lilly and Company

Variable X22 > A
Variable X37 > B
Variable X4 < C
825 Pbo Patients
823 Treatment PatientsYES
YES
YES
NO
NO
NO
Treatment vs. Pbo in Subgroups Based on CART
P: 90/476=0.19
T: 86/468=0.18
P-value=0.87
RR=0.05
P: 163/349=0.47
T: 118/355=0.33
P-value<0.0001
RR=0.30
P: 51/69=0.74
T: 29/75=0.39
P-value<0.0001
RR=0.47
P: 99/250=0.40
T: 79/259=0.31
P-value=0.03
RR=0.23
P: 80/223=0.36
T: 69/236=0.29
P-value=0.14
RR=0.19
P: 18/22=0.82
T: 8/20=0.40
P-value=0.01
RR=0.51
Company ConfidentialCopyright © 2000 Eli Lilly and Company
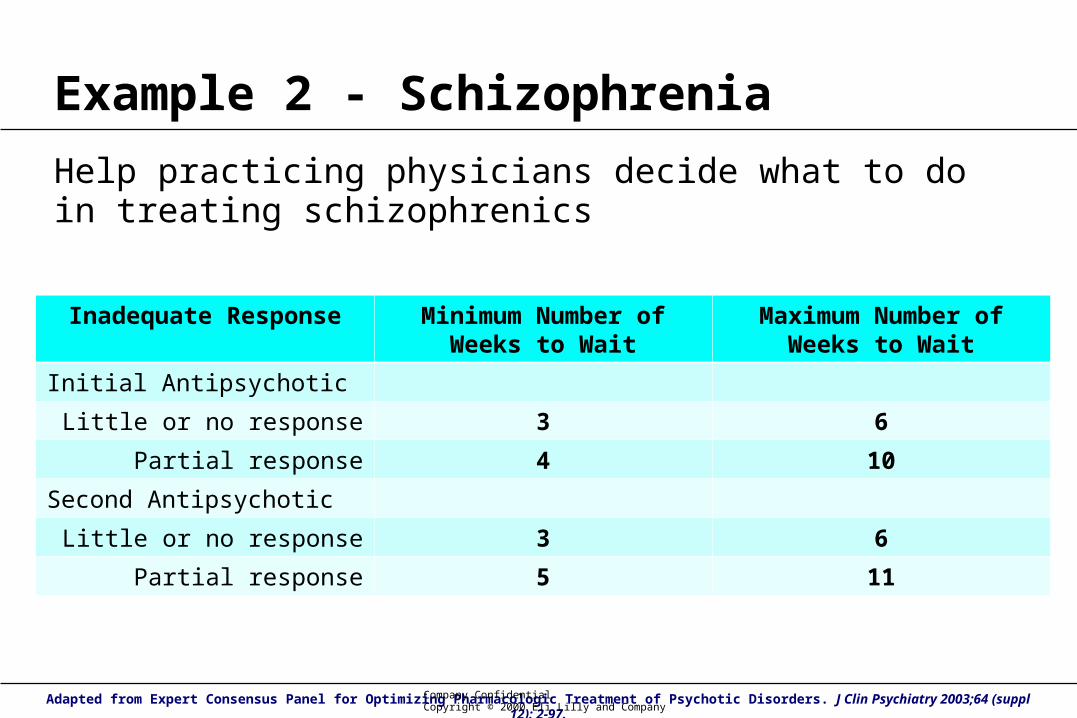
Example 2 - Schizophrenia
Help practicing physicians decide what to do in treating schizophrenics
Inadequate Response Minimum Number of Weeks to Wait
Maximum Number of Weeks to Wait
Initial Antipsychotic
Little or no response 3 6
Partial response 4 10
Second Antipsychotic
Little or no response 3 6
Partial response 5 11
Adapted from Expert Consensus Panel for Optimizing Pharmacologic Treatment of Psychotic Disorders. J Clin Psychiatry 2003;64 (suppl 12): 2-97.Company ConfidentialCopyright © 2000 Eli Lilly and Company

Early Response Assessment
GOAL:
Identify what amount of change …
in which of the fewest symptoms/measures …
at the earliest time in treatment …
predicts both responders and non-responders.
Has to be “implementable” for the typical clinician on a routine basis (i.e. not a research tool as part of research studies)
Company ConfidentialCopyright © 2000 Eli Lilly and Company

Example 2 – Zyprexa & Atypicals
Predicting Efficacy Responders• Response = 30% reduction in PANSS Total Symptom Score at 8 weeks• Predictors are the change in individual symptom ratings from PANSS
at week 1 and week 2 of treatment
– 30 individual symptoms = 60 predictors• Integrated data from 6 studies (1494 patients)
– Moderately to severely ill patients
– All patients on active atypical antipsychotics
PANSS = Positive and Negative Symptom ScaleCompany ConfidentialCopyright © 2000 Eli Lilly and Company

GenericClassification
Tree
R: %NR: %N number
Symptom Criteria #1
R: %NR: %N number
R: %NR: %N number
R: Mis%NR: NPV%N
Symptom Criteria #2N
PPVNPVMixedMiscls
YESNO
NO YES
R: %NR: %N mixed
R: PPV%NR: Mis% N
Symptom Criteria #2Y
NO YES
R: %NR: %N mixed
Example 2 – Zyprexa & Atypicals
Company ConfidentialCopyright © 2000 Eli Lilly and Company
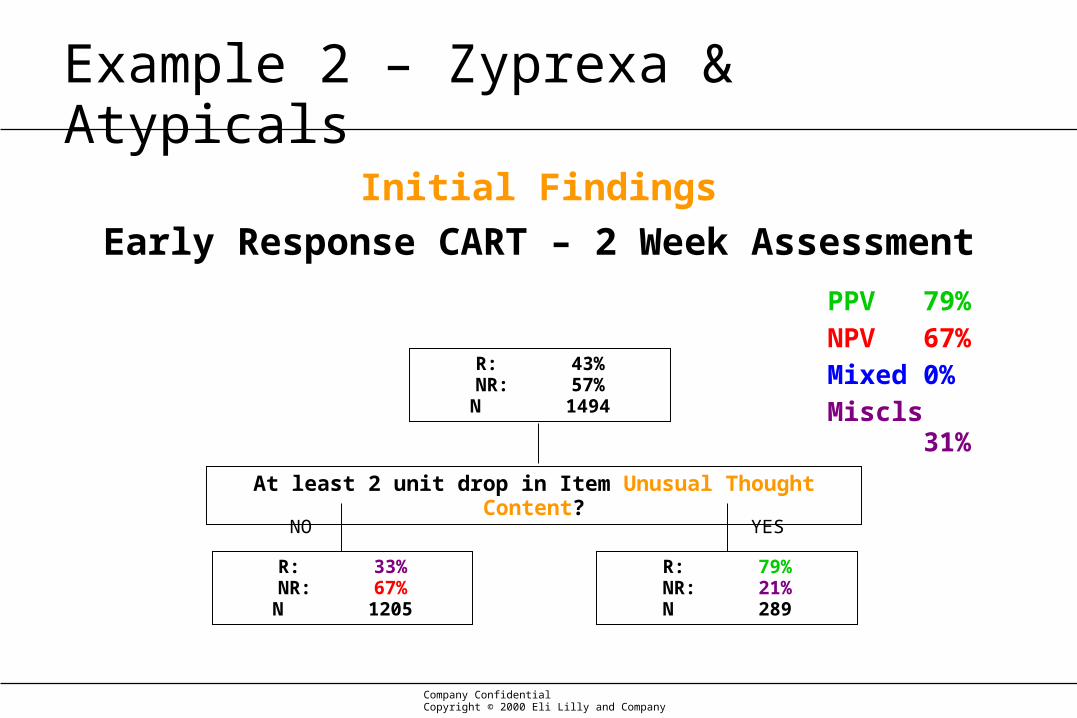
Initial Findings
Early Response CART – 2 Week Assessment
R: 43%NR: 57%N 1494
At least 2 unit drop in Item Unusual Thought Content?
R: 33%NR: 67%N 1205
R: 79%NR: 21%N 289
YESNO
PPV 79%NPV 67%Mixed 0%Miscls 31%
Example 2 – Zyprexa & Atypicals
Company ConfidentialCopyright © 2000 Eli Lilly and Company
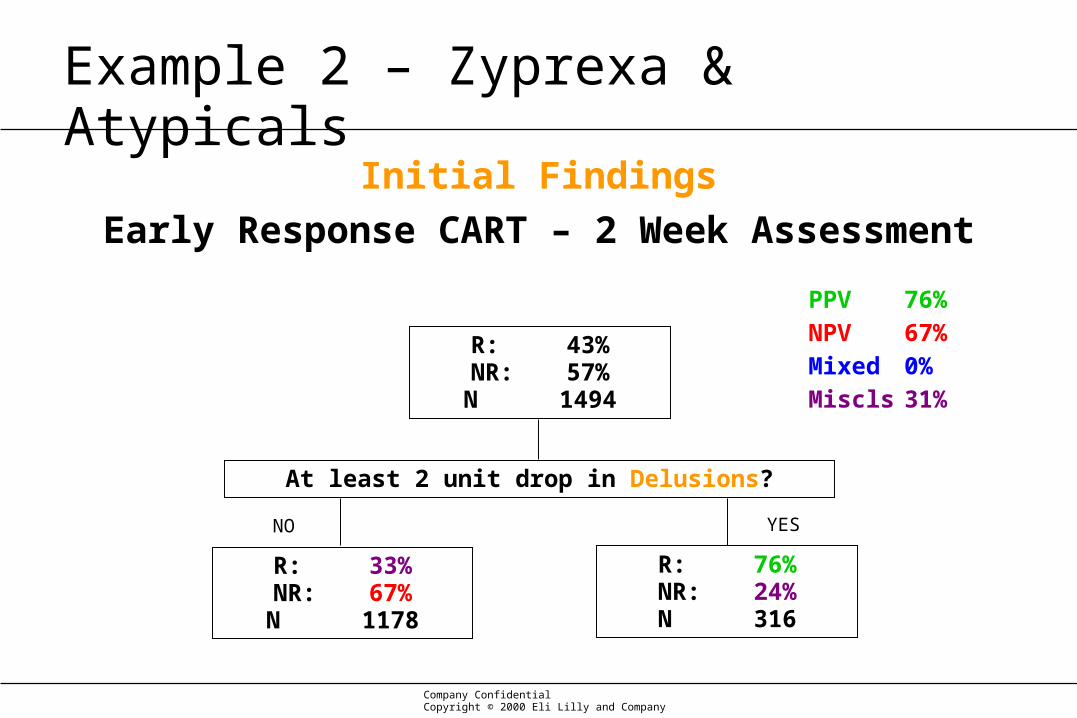
Initial Findings
Early Response CART – 2 Week Assessment
R: 43%NR: 57%N 1494
At least 2 unit drop in Delusions?
R: 33%NR: 67%N 1178
R: 76%NR: 24%N 316
YESNO
PPV 76%NPV 67%Mixed 0%Miscls 31%
Example 2 – Zyprexa & Atypicals
Company ConfidentialCopyright © 2000 Eli Lilly and Company

Final Model
Early Response CART – 2 Week Assessment
R: 43%NR: 57%N 1494
At least 2 unit drop in at least 2 psychotic items?
R: 28%NR: 72%N 1049
R: 79%NR: 21%N 445
R: 25%NR: 75%N 929
R: 53%NR: 47%N 120
At least 2 unit drop in excitement?PPV 79%NPV 75%Mixed 8%Miscls 24%
YESNO
NO YES
Psychotic items = Unusual Thought Content, Delusions, Hallucinatory Behavior, Conceptual Disorganization, Suspiciousness
Company ConfidentialCopyright © 2000 Eli Lilly and Company
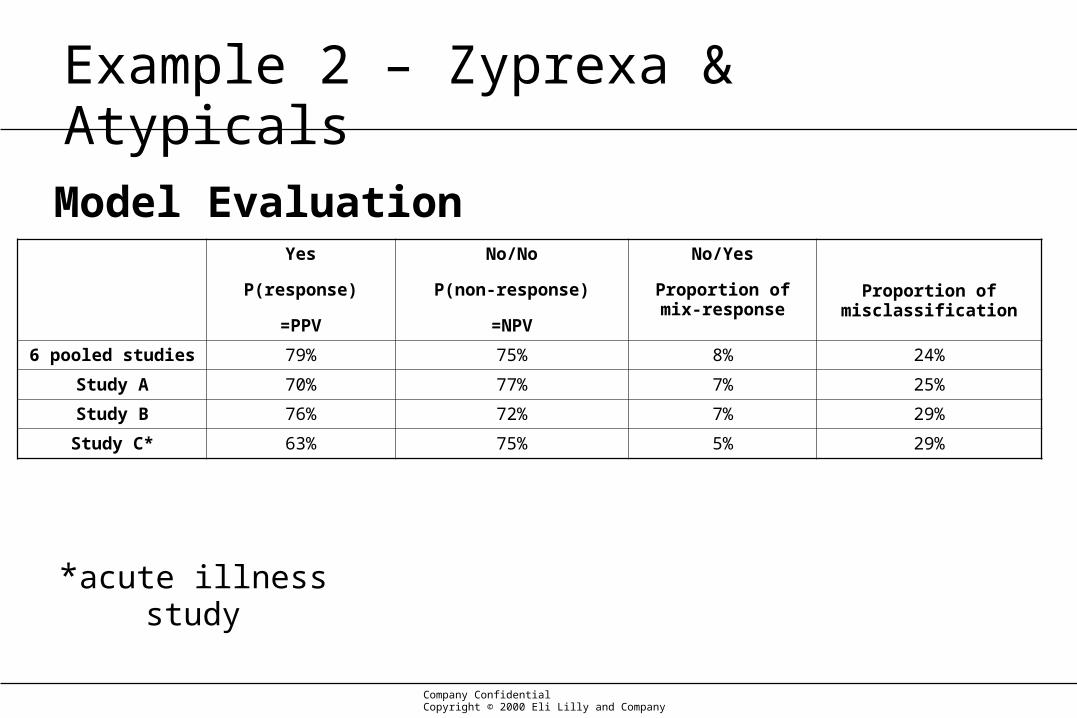
Model EvaluationYes
P(response)
=PPV
No/No
P(non-response)
=NPV
No/Yes
Proportion of mix-response
Proportion of misclassification
6 pooled studies 79% 75% 8% 24%
Study A 70% 77% 7% 25%
Study B 76% 72% 7% 29%
Study C* 63% 75% 5% 29%
*acute illness study
Example 2 – Zyprexa & Atypicals
Company Confidential Copyright © 2000 Eli Lilly and Company

YES
NO/YES
NO/NO
Average Total Symptom Scores Over 8 Weeks of Study
Company ConfidentialCopyright © 2000 Eli Lilly and Company

Conclusions
Company ConfidentialCopyright © 2000 Eli Lilly and Company

“What's required is a revolution called ‘evidence-based medicine,’ says Eddy, a heart surgeon turned mathematician
and health-care economist.
“The human brain, Eddy explains, needs help to make sense of patients who have combinations of diseases, and of the
complex probabilities involved in each.”
BusinessWeek29 May 2006
Medical GuessworkFrom heart surgery to prostate care, the medical industry knows little
about which treatments really work
Company ConfidentialCopyright © 2000 Eli Lilly and Company

Conclusions (1)
• Tailor to the whole patient
• There is prospective and retrospective tailoring approaches
• Physicians like decision trees– Understandable and implementable
• Move from sub-group analysis mindset to variable selection mindset
– CART is a useful omnibus tool
Company ConfidentialCopyright © 2000 Eli Lilly and Company

Conclusions (2)
• More and more, there is less and less interest in the overall mean response in a broad population of patients.
• There is a shift to greater interest in smaller, more responsive populations.
• The key questions emerging seem to be:
Company ConfidentialCopyright © 2000 Eli Lilly and Company
Conclusions (3)
1. “What is the largest population that has a very high probability of showing a clinically meaningful benefit?”
a. A really large benefit in a really small population may be useful but will have less medical or public health impact.
b. The exceptions are rare diseases.
Company ConfidentialCopyright © 2000 Eli Lilly and Company

Conclusions (4)
2. “What measurable/observable characteristics define that population?”
a. What are the easiest and cheapest characteristics to measure?
b. They may not be genetic or biochemical?
c. It doesn’t have to be perfect, just better than what we do now.
Company ConfidentialCopyright © 2000 Eli Lilly and Company

Conclusion (5)
• Pharmaceutical research will continue to refine our understanding of who is likely to respond to drugs.
• Personalized medicine as a general rule has a long way to go, and it may never be achieved in some disease states.
• Tailored medicine is happening today and refinements in treatment paradigms are being studied at the present time.
• This area of medicine is ripe with statistical problems, and much more research is needed.
Company ConfidentialCopyright © 2000 Eli Lilly and Company

Thank you.
謝謝。
Gracias.
Вы.
Obrigado.
ありがとう。
Grazie.
Σας ευχαριστούμε.
Danke.
Merci.
Dank u.
너를 감사하십시요 .
Company ConfidentialCopyright © 2000 Eli Lilly and Company