Embed Size (px)
Citation preview

CHAPA Briefing Paper
The Massachusetts Rental Voucher Program Maintaining the State’s Primary Homelessness Prevention Tool
Prepared by Ann Verrilli Citizens’ Housing and Planning Association
June 2009

2
The Massachusetts Rental Voucher Program
Maintaining the State’s Primary Homelessness Prevention Tool Executive Summary…………………………………………………………..…………....3 1. Overview: Role of Rental Assistance in Housing Policy ……………………………..4 2. Profile of Current MRVP Households ………………………………………………....5 3. Program Types and Costs ……………………………………………………………..8 4. Cost of Revoking Vouchers on Low Income Households …………………………....10 5. Program History: Role of State-Funded Rental Assistance in State Housing Policy ...11 6. MRVP Administrative Structure …………………………………………………….. 12 7. Income Limits, Rent Formulas and Program Requirements ………………….............14 8. Priorities for Assistance ………………………………………………………………19 9. Need for Additional Vouchers to Fulfill the Commonwealth’s Commitment to End Homelessness ..…………………….……………………………...…………..20 10. Long-term Recommended Changes …………………………………………….…..22 Appendices ……………………………………………………………………….............24 Endnotes ………………………………………………………………………….............29 Principal Author: Ann Verrilli Editing: Aaron Gornstein, Karen Wiener, Sean Caron Special thanks for assistance with this study goes to the Department of Housing and Community Development for providing background, historical information and current data on the MRVP and Section 8 programs, to Maureen Fitzgerald at the Regional Housing Network of Massachusetts, and Chris Norris and Mary Doyle at the Metropolitan Boston Housing Partnership for providing additional information on MRVP operations and programs, to Michael Stone at the UMass/Boston Center for Social Policy (CSP) with the support of the Sociological Initiatives Foundation and the Hyams Foundation, and to the members of the Housing Solutions Campaign.

3
The Massachusetts Rental Voucher Program (MRVP) –
Maintaining the State’s Primary Homelessness Prevention Tool
Executive Summary
The Massachusetts Rental Voucher Program (MRVP) is the State’s largest state-funded rental assistance program and a tested but currently underutilized resource to help extremely low income households avoid homelessness and leave shelters. In 1990, MRVP assisted 20,000 households; today, it assists 5,200. This report describes who is served by the program, how the State used rental assistance in the past to combat homelessness, how the MRVP program currently operates and the impacts of budget proposals to cut additional vouchers. Despite the current budget challenges, it is critical that MRVP not be cut. The 5,200 households it currently assists have average incomes of less than $11,000, almost all (79%) are extremely low income and many have incomes below 15% of area median income. About 2,300 of these households include children under 18. Most are already paying more than 40% of their income for housing. Given the current homelessness crisis, they will have few alternatives if they lose their subsidy. In light of the doubling of family homelessness in the past four years (to over 2,800 families in the emergency shelter system today), we urge the State to maintain an active MRVP program to help homeless and at-risk households.
• The State saves money by using MRVP to help families and individuals to avoid or
transition from the shelter system (and provides municipal relief by reducing the cost of
transporting homeless children from out of town shelters)
o Newly-issued mobile vouchers cost $906/month on average, while the average cost of providing a shelter bed is $2,980/month in the family shelter system and $1,000/month in shelters for individuals. It currently costs the Department of Transitional Assistance over $140 million/year to support 4,800 shelter beds,1 while MRVP assists 5,200 households at an annualized cost of $35.8 million.
o At the average new mobile voucher cost of $906/month, MRVP provides families at-risk of homelessness with 19 months of voucher assistance for the same amount the state currently spends to shelter them for 6 months.
• Cutting appropriations to MRVP will have a serious impact on the Commonwealth’s
ability to house low income residents. At least 818 households and 684 children will suffer housing instability as a result of losing a voucher under the Senate’s FY2010 proposed $30.5 million expenditure for MRVP.
FY 2010 and FY 2011 Funding Recommendations
� Maintain sufficient funding to keep MRVP from shrinking in FY 2010 and FY 2011, and as revenues improve, increase funding and tie funding to the goal of supporting a specified minimum number of households.

4
1. Overview: Role of Rental Assistance in Housing Policy
Rental assistance programs such as MRVP and Section 8 help low income households pay their rent by providing a subsidy that covers the difference between: • what they can “afford” (using a formula set by the program – often 30% of income) and • their actual rent (up to a rent limit established by the program). If the unit rent is above that
limit, they pay all of the additional cost themselves. Most programs calculate the subsidy based on a household’s “gross rent.” Gross rent is the sum of the contract rent paid by the tenant directly to the landlord, and the tenant’s utility allowancea, which is an estimated cost of any basic utilities paid directly by the tenant. MRVP is an exception because it uses contract rents and does not account for utilities. Rental assistance has several characteristics that other housing programs do not: • It makes units affordable to extremely low income households Aside from public housing, an
imperiled and fully utilized resource, it is the only type of aid that makes housing affordable to very poor households. This is because a household’s share of their rent is based on their actual income.
• It can be expanded quickly when needed, since it is primarily used in existing housing. • Tenant-based assistance can offer geographic choice and mobility
Table 1 - How Tenant Rent Contribution Fluctuates with Income (HUD Section 8 Program)
Household Annual Adjusted Income $24,000 9,000
Household Monthly Adjusted Income $ 2,000 750
Required Tenant Contribution @30% of Income/Mo 600 225
Gross Rent 1145 1145
Contract Rent (assume no utilities included) 1000 1000
Allowance for tenant-paid utilities2 145 145
Subsidy Calculation
Tenant Contribution – utility allowance 145 145
Tenant Contribution - rent to landlord 455 80
S8 Subsidy paid to owner 545 920
Rental assistance comes in two basic forms, each with advantages and limitations.
1. Tenant-based (“mobile”) assistance travels with the tenant. Participants can use their voucher3 to stay in place or move as long as a unit meets program standards. If they move, they can use it for their next unit. • It offers geographic choice and mobility. • However, it is vulnerable to market forces - when vacancy rates are low or rents or utility
costs are rising, households may find it difficult to rent units in many locations.
2. “Project-based” assistance is tied to specific units in specific developments through a long-term contract between a housing agency and owner. The owner agrees to rent the units to eligible households at a specified rent and the housing agency agrees to cover the difference between that rent and the amount paid by the voucher holder. • It does not provide mobility. If the participant moves out, they lose their voucher (it is re-
issued to another household to rent that unit). • It can ensure affordable units are available in specific locations or for specific populations. • It tends to be less expensive than mobile vouchers as it is usually attached to units in
projects developed with other state or federal subsidies. The vouchers help ensure that
a Housing authorities calculate utility allowances annually based on local utility rates and “typical” consumption, by
type of building (i.e. single family, duplex, large multifamily), unit and household size.

5
some units (generally no more than 25%) are affordable to lower income households. • It can help owners finance the development or rehabilitation of units by providing a multi-
year rent guarantee that can be used to secure financing.
2. Profile of Current MRVP Households
At present, the most extensive data on MRVP households comes from a 2008 annual DHCD survey. a It provides point-in-time information on characteristics related to fair housing (income bracket, household size, race/ethnicity of adults in household, households with children) by unit size and location.
DHCD’s 2008 survey data covers 3,978 households (76.5% of all participants as of August 1, 2008), as well as 63 vacant project-based units. It includes data from all nine Regional nonprofits (RNPs) and from 75 Local Housing Authorities (LHAs). 47 LHAs did not respond.
Table 2: DHCD 2008 Survey Response Rate
Units under lease 8/1/08
Households in data survey
Occupied Units
Percent covered
Mobile 2,197 1,741 1,741 79.2%
Project-based 3,003 2,300 2,237 74.5%
Total 5,200 4,041 3,978 76.5%
The 2008 survey data and DHCD leasing data showed that: • Most MRVP households (79%) are extremely low income (at or below 30% of area median) and
discussions with administering agencies and other DHCD data suggest that most in this bracket
have incomes at or below 15% of area median.b A 2005 DHCD survey found that MRVP mobile voucher households had an average net income of $10,226. A slightly earlier DHCD review of 1,200 households (average size 1.79 persons) with old project-based found average net incomes of $11,171 (gross incomes averaged $12,179).
• Most (69%) are small person (1 or 2 person) households, including 75% of project-based units. • Less than one-half (44%) of households overall include children, including 35% of project-based
and 55% of mobile households. Among households with children, one-half have children under age 6.
• Over one-half (56%) live in Greater Boston and another 22% live in the Springfield and Worcester areas.
Income Distribution The DHCD survey included income bracket data for 92% of the responses (3,674). Of those, 79% of the households had incomes in the 0-30% of area median income (AMI) bracket. Of the remaining households, 17% (639) were in the 31-50% AMI bracket, and 4% were in the 51-60% AMI bracket or above. These percentages held for both mobile and project-based vouchers and did not vary by region or type of housing agency. Small households were slightly more likely to be extremely low income.c
a That survey was created to comply with a new state law requiring DHCD to determine whether state-funded and state-
controlled housing programs are meeting the needs of households covered by fair housing laws. CHAPA is in the process of collecting supplementary data from the regional nonprofits on rents, actual incomes, sources of income, age (elderly/non-elderly) and disability status (disabled or not) and length of program participation.
b In 2009, the 30% limit for a household of two in the Boston region is $21,650. c It is possible that this is because MRVP income limits are lower relative to HUD AMI for this group (see page 9)

6
Table 3 – MRVP Participant Household Incomes (by Income Bracket)
Total Mobile
Project-Based
% of Total
% of Mobile
% of Project-Based
0-30% AMI 2,891 1,246 1,645 78.7% 79.6% 78.0%
31-50% AMI 639 257 382 17.4% 16.4% 18.1%
51-60% of AMI 81 37 44 2.2% 2.4% 2.1%
61-80% AMI 49 20 29 1.3% 1.3% 1.4%
81%%+ AMI 14 6 8 0.4% 0.4% 0.4%
Total Surveys with income data 3,674 1,566 2,108 100% 100% 100%
Household Size Most MRVP households are small (1 or 2 persons). Overall, the survey indicated that almost one-half (46.5%) were one-person households (including one-third of mobile vouchers and 57% of those leasing with project-based vouchers), another 22% were 2-person households, 15% consisted of three persons and 15% consisted of households of 4 or more persons. The average household size was 2.11 persons (1.89 for project-based, 2.39 for mobile).
The predominance of small households in the project-based program is directly related to the types of projects still in the old project-based program. About 15% of the units in projects for the elderly or for individuals and 58% of the project-based responses were from persons in SROs, 0- or 1-bedroom units (compared to 28% of mobile responses). A review of the contracts administered by non-responding LHAs suggests that even more than 58% of project-based units may be small.
Table 4 - MRVP Voucher Holders by Household Size
Mobile Project-Based Total
Household size Number % Number #of BR Number %
1 583 33.5% 1,266 56.6% 1,849 46.5%
2 466 26.8% 428 19.1% 894 22.5%
Subtotal 1049 60.30% 1,694 75.70% 2,743 69.00%
3 352 20.2% 253 11.3% 605 15.2%
4 199 11.4% 149 6.7% 348 8.7%
5 79 4.5% 83 3.7% 162 4.1%
6+ 62 3.6% 51 2.3% 113 2.9%
Missing 0 0.0% 7 0.3% 7 0.2%
Total 1,741 100% 2,237 100% 3,978 100%
Average size 2.39 1.89 2.11
Unit Size The median size of a unit under lease was two bedrooms overall, two bedrooms for the mobile program and one bedroom for the project-based program.
Table 5 - MRVP Units under Lease 8/1/2008 by Unit Size (Number of Bedrooms)
Mobile Project-Based Total
#of BR Number % Number Number % Number
SRO/congregate - - 65 3% 65 2%
0 bedroom 61 4% 375 17% 436 11%
1-bedroom 424 24% 810 37% 1,234 32%
Subtotal 485 28% 1,250 58% 1,735 44%
2-bedroom 662 38% 536 25% 1,198 31%
3-bedroom 456 26% 349 16% 805 21%
4+ bedroom 137 8% 101 5% 238 6%
Total 1,740 100% 2,171 100% 3,911 100%
* Excludes two responses with missing data on unit size

7
Households with Children Less than one-half (43.8%) of the households (1,743) in the survey included children age 18 or younger, including 35% of the project-based and 55% of the mobile participants. One-half (50%) had at least one child under age 6 and one-half had only school-age children. Households with children had an average of 1.94.
Table 6 - Percentage of MRVP Households with Children
Mobile Project-Based Total Number % Number % Number %
Total Households 1,741 100.0% 2,237 100.0% 3,978 100.0%
With no children under 18 775 44.5% 1,460 65.3% 2,235 56.2% With children under 18 966 55.5% 777 34.7% 1,743 43.8%
Age Distribution
Children Under 6 only 253 26.2% 206 26.5% 459 26.3%
Children Under and Over 6 230 23.8% 174 22.4% 404 23.2% Children 6-18 only 483 50.0% 397 51.1% 880 50.5%
Table 7 - Children in Household
Mobile Project-Based Total
# % # % # %
1 440 45.5% 352 45.4% 792 45.5%
2 286 29.6% 212 27.4% 498 28.6%
3 145 15.0% 133 17.2% 278 16.0%
4+ 95 9.8% 78 10.1% 173 9.9%
Total Households 966 100.0% 775 100% 1741 100%
Total Children 3386
Geographic Distribution A review of units under lease (as of August 1, 2008) showed that over one-half (56%) of the units are in HUD’s Boston FMR area (Middlesex, Norfolk and Suffolk counties). Another 22% are in the Springfield and Worcester regions. Nine percent (9%) of the mobile voucher holders reside in Barnstable County.
Table 8 - Distribution of Units under Lease by HUD FMR Region
Region Mobile
Project-
Based Total Mobile % Project-
Based % Total %
Boston-Cambridge-Quincy 1,195 1,731 2,926 52% 58% 55.8%
Lowell FMR area 61 24 85 3% 1% 1.6%
Lawrence FMR area 43 38 81 2% 1% 1.5%
Brockton 121 27 148 5% 1% 2.8%
Easton-Raynham 1 - 1 0% 0% 0.0%
New Bedford 65 13 78 3% 0% 1.5%
Taunton-Mansfield Area 22 41 63 1% 1% 1.2%
Fall River area 19 40 59 1% 1% 1.1%
Barnstable County 215 61 276 9% 2% 5.3%
Fitchburg-Leominster 19 59 78 1% 2% 1.5%
Eastern Worcester County 4 17 21 0% 1% 0.4%
Worcester Metro 186 141 327 8% 5% 6.2%
Western Worcester County 36 44 80 2% 1% 1.5%
Springfield Metro Area 273 575 848 12% 19% 16.2%
Franklin County (part of) 6 118 124 0% 4% 2.4%
Berkshire 6 14 20 0% 0% 0.4%
Pittsfield area 3 6 9 0% 0% 0.2%
Dukes County 4 - 4 0% 0% 0.1%
Nantucket County - 12 12 0% 0% 0.2%
Total 2,279 2,961 5,240 100% 100% 100%

8
3. Program Types and Costs
Today, the MRVP program has four distinct components – “old” (pre-1992) mobile and project-based programs and “new” (2006 or later) mobile and project-based programs. Mobile vouchers tend to have higher subsidy costs on average because they are used to serve more families and are less likely to be used in units receiving other subsidies.
Table 9: MRVP Subprograms
Units Under Lease
(3/1/2009)
Monthly Average Subsidy Cost*
(3/1/2009)
Monthly Average Subsidy Cost* (July-Nov)
Old Mobile 1,627 $677 $678-691
New Mobile 537 $906 $903-933
Total Mobile 2,164 $734
Old Project-Based 2,934 $428 $431-452
New Project-Based 73 $735 $926-1564
Total Project-Based 3,007 $435
Total 5,171 $560 $554-592
The “Old” Mobile Program currently assists about 1,627 households, down from almost 15,000 in June 1990. With a freeze on re-issuing turnover vouchers, it continues to shrink as current participants leave the program. It includes households that received assistance pre-MRVP and households who received vouchers between 1999 and 2002 when the turnover freeze was lifted.
The “New Mobile” Program currently assists 537 households (March 2009), primarily formerly homeless and at-risk families and individuals. • Approximately 100 received vouchers in early 2008 from a statewide pool of 100 new mobile
vouchers allocated to local housing authorities in late 2007 (22 LHAs received awards). Others received vouchers through homelessness prevention and re-housing initiatives, including: • Home and Healthy for Good (assists homeless individuals with serious health problems) • RAFT-Ineligible Households (for households who needed assistance other than that available
through that short-term prevention program) • Department of Transitional Assistance (DTA) vouchers to help families in shelter or at
imminent risk of homelessness (primarily single parents with children), including special time-limited vouchers to help avert homelessness.
The “Old” Project-Based Voucher Program is the largest sub-program, currently assisting 2,934 households (down from almost 6,000 contracted units in the early 1990s). It helps make some units in projects developed with other state or federal subsidies more deeply affordable (the percentage of such units varies by project, usually no more than 20-25% but sometimes higher for supportive housing). The types of units assisted reflect the variety of subsidy programs active between 1970 and 1990. It has contracted over time as rent rollbacks and freezes led owners to withdraw units from the program (DHCD allowed owners of MassHousing projects to reduce their MRVP obligation by agreeing to rent the dropped units to Section 8 voucher holders). Today about 3,500 units are covered by 190 “old” project-based contracts (see page 27) and 2,934 are under lease using MRVP project-based vouchers (others are occupied by Section 8 or MRVP mobile vouchers). Of the approximately 3,000 old project-based units under lease:
• About 1,300 are in MassHousing-financed projects developed in the 1970s or early 1980s under subsidy programs that no longer exist (state Chapter 13A, federal Section 236). A few are in rural projects built under a federal Rural Housing Service program also now largely inactive.

9
• The other 1,700 are in state-subsidized developments developed in the mid to late 1980s under a variety of initiatives (e.g. downtown or neighborhood revitalization, supportive housing, local initiatives, SRO housing preservation). About 300 are in SHARP projects and about 1,400 are in projects developed by nonprofits or in older buildings owned by small landlords. Over 800 are in “moderate rehabilitation” projects in areas where owners could not get conventional rehabilitation loans because of low market rents. The contracts for those were modeled on a Section 8 rehab program, allowing higher rents if needed to support rehabilitation loans.
• Some units are in elderly-only developments; some are in SROs and some provide transitional housing for families.
• Voucher contracts written from the 1980s on were generally provided on a back-up basis (i.e. only when the owner could not fill units with tenant-based voucher holders).
New Project-Based Vouchers The declining use of project-based vouchers in old projects enabled DHCD to issue commitments for 192 new project-based vouchers in the past few years to homeless households and individuals with disabilities in 14 new affordable projects (including one project where the 39 vouchers are on a backup basis). Of those, 89 vouchers were under lease as of December 1, 2008, with most of the rest expected to come on line over the next 18 months, as projects are completed (the turmoil in the capital markets has delayed the financing of several of these projects).
Current Program Costs The aggregate cost of the MRVP program depends on multiple variables, including:
• the number of mobile and project-based vouchers in use • the rate of attrition of “old mobile” participants • changes in the number of old project-based units under lease • additions to the new mobile and new project-based subprograms • increases/decreases in net incomes of program participants • changes in income limits (none since 1992) • changes in the voucher schedule and rent limits (none recently) • changes in project-based rents (none anticipated) • changes in administrative costs, including fees paid to LHAs and RNP (none recently).
In March 2009, rent subsidy costs averaged $528/month per unit excluding administrative fees and $560/month ($6,720 a year) including those fees, for a total cost for that month of $2.9 million. If the program size and cost profile remained unchanged, the program would have an annualized cost of $34.8 million. DHCD’s projection of likely changes in leasing activity shows that the program is likely to have an annualized cost of $35.8 million. The difference reflects: • attrition in the “old mobile” program of about 6 households/month (resulting in permanent
retirement of the voucher) and growth in the new mobile program (about 2/month) as participants who already have vouchers find units;
• minor fluctuations in leasing by current mobile participants as they move from one unit to another;
• fluctuations in the number of old project-based vouchers in use, depending on whether turnover units are filled by persons holding MRVP project-based vouchers (as opposed to MRVP mobile vouchers or Section 8 vouchers);
• a small increase in the new project-based program over the next year, as the last new project-based developments come online (several were delayed by difficulties finding purchasers for their low income housing tax credits as a result of the economic downturn).
10
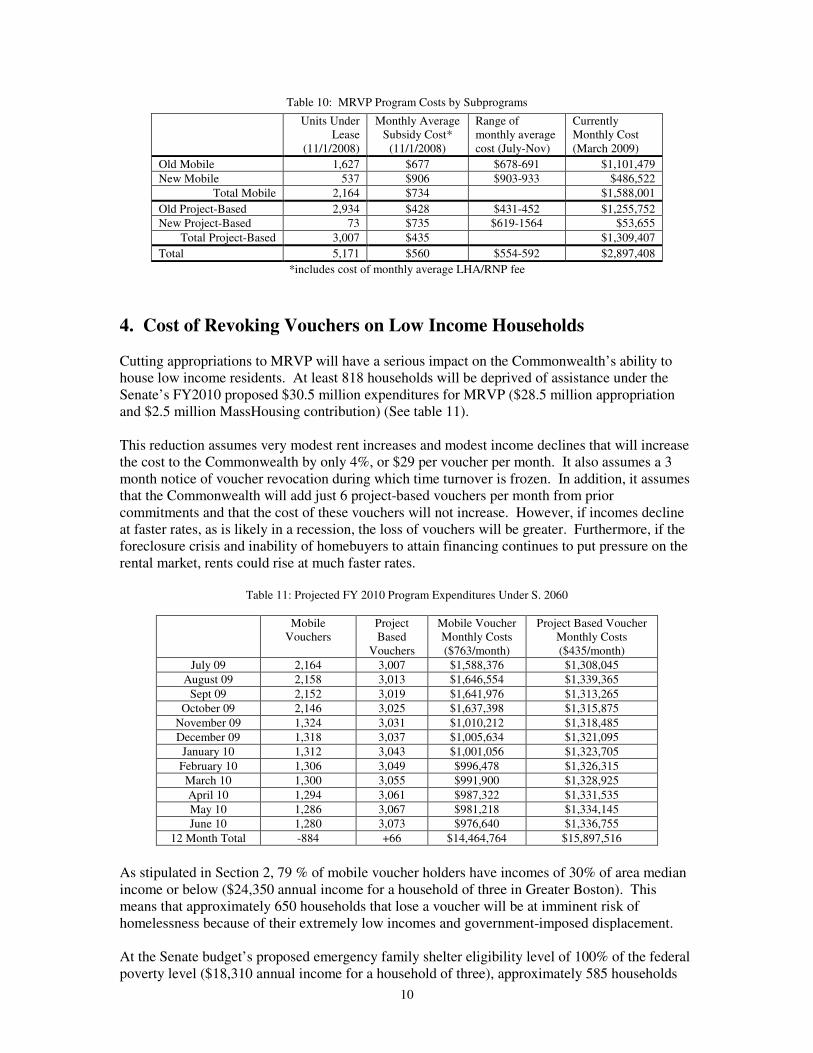
Table 10: MRVP Program Costs by Subprograms
Units Under Lease
(11/1/2008)
Monthly Average Subsidy Cost*
(11/1/2008)
Range of monthly average cost (July-Nov)
Currently Monthly Cost (March 2009)
Old Mobile 1,627 $677 $678-691 $1,101,479
New Mobile 537 $906 $903-933 $486,522
Total Mobile 2,164 $734 $1,588,001
Old Project-Based 2,934 $428 $431-452 $1,255,752
New Project-Based 73 $735 $619-1564 $53,655
Total Project-Based 3,007 $435 $1,309,407
Total 5,171 $560 $554-592 $2,897,408
*includes cost of monthly average LHA/RNP fee
4. Cost of Revoking Vouchers on Low Income Households
Cutting appropriations to MRVP will have a serious impact on the Commonwealth’s ability to house low income residents. At least 818 households will be deprived of assistance under the Senate’s FY2010 proposed $30.5 million expenditures for MRVP ($28.5 million appropriation and $2.5 million MassHousing contribution) (See table 11). This reduction assumes very modest rent increases and modest income declines that will increase the cost to the Commonwealth by only 4%, or $29 per voucher per month. It also assumes a 3 month notice of voucher revocation during which time turnover is frozen. In addition, it assumes that the Commonwealth will add just 6 project-based vouchers per month from prior commitments and that the cost of these vouchers will not increase. However, if incomes decline at faster rates, as is likely in a recession, the loss of vouchers will be greater. Furthermore, if the foreclosure crisis and inability of homebuyers to attain financing continues to put pressure on the rental market, rents could rise at much faster rates.
Table 11: Projected FY 2010 Program Expenditures Under S. 2060
Mobile Vouchers
Project Based
Vouchers
Mobile Voucher Monthly Costs ($763/month)
Project Based Voucher Monthly Costs ($435/month)
July 09 2,164 3,007 $1,588,376 $1,308,045
August 09 2,158 3,013 $1,646,554 $1,339,365
Sept 09 2,152 3,019 $1,641,976 $1,313,265
October 09 2,146 3,025 $1,637,398 $1,315,875
November 09 1,324 3,031 $1,010,212 $1,318,485
December 09 1,318 3,037 $1,005,634 $1,321,095
January 10 1,312 3,043 $1,001,056 $1,323,705
February 10 1,306 3,049 $996,478 $1,326,315
March 10 1,300 3,055 $991,900 $1,328,925
April 10 1,294 3,061 $987,322 $1,331,535
May 10 1,286 3,067 $981,218 $1,334,145
June 10 1,280 3,073 $976,640 $1,336,755
12 Month Total -884 +66 $14,464,764 $15,897,516
As stipulated in Section 2, 79 % of mobile voucher holders have incomes of 30% of area median income or below ($24,350 annual income for a household of three in Greater Boston). This means that approximately 650 households that lose a voucher will be at imminent risk of homelessness because of their extremely low incomes and government-imposed displacement. At the Senate budget’s proposed emergency family shelter eligibility level of 100% of the federal poverty level ($18,310 annual income for a household of three), approximately 585 households

11
removed from MRVP will be eligible for shelter. At the current eligibility level of 130% of the federal poverty level ($23,803 annual income for a household of three), all 650 households would be eligible for emergency family shelter. At an average cost of $3,000 per month for family emergency shelter, it will cost the Commonwealth $1,950,000 per month to shelter the 650 households that are extremely low income and currently eligible for shelter if they are unable to secure stable housing, as opposed to $494,950 to maintain stable housing through MRVP. If eligibility is reduced as proposed in the Senate budget, shelter costs for these displaced households will be $1,755,000 per month. In either case, the Commonwealth’s shelter costs will far outweigh the costs to maintain MRVP assistance. Furthermore, revocation of vouchers and subsequent homelessness will have serious financial consequences for municipal school transportation budgets. 1,743 households with children currently receive vouchers, or 44% of total households served (see table 6). Based on total household size of voucher holders with children, revoking vouchers from 359 families with children (44% of 818 vouchers revoked) would place approximately 684 children at risk of homelessness (See table 7). Families with children forced to seek emergency shelter due to a loss of rental assistance necessary to afford housing are not guaranteed shelter near the child’s school. Pursuant to the McKinney-Vento Act, all school systems have a responsibility to arrange transportation for any children from their district that relocates due to homelessness. Arrangements may include a bus pass for the parent/child, a special bus, or a taxi or other car service and must be reimbursed by the school system. This is particularly challenging because family shelters are currently operating at full capacity and homeless families are being placed further from their home communities due to lack of shelter beds available.
5. Program History: Role of State-Funded Rental Assistance in State
Housing Policy
Massachusetts created its first state-funded rental assistance program (“Chapter 707”) in 1966. Chapter 707 was modeled on early federal rental assistance programs and revised over time as state and federal housing policies evolved. At its largest, in 1990, it assisted almost 20,000 households. It was restructured (with lower income limits and reduced subsidies) and renamed the Massachusetts Rental Voucher Program (MRVP) effective November 1, 1992. This section describes how the program evolved. Chapter 707 (1966-1992) The Massachusetts Legislature enacted “Chapter 707” in 1966.4 It was one of many bills enacted that year following the recommendations of a highly influential 1965 state legislative commission on the housing problems of low and moderate income households. It began as a “supplement and alternative to” public housing,5 modeled after a new federal program (Section 23).6 It changed over the years as state and federal housing programs and the federal Section 8 programs were enacted. Initially it started as a program under which housing authorities would lease private units, sublease them to tenants at public housing rents and use the State funds to cover the difference in rent costs and charges. Over time, it was used to create a tier of affordable units in MassHousing developments, and expanded to allow tenants to find their own units to lease. DHCD also arranged with regional nonprofit housing agencies to operate the program in communities lacking a local housing authority program.
The State further expanded the program between 1984 and 1990, during a period of both strong state economic growth and unprecedented housing inflation (home prices more than doubled, rents rose by 40%7 and homelessness became a rising problem). The project-based program rose

12
from about 2,000 units under lease in 1983 to almost 5,400 in 1992 as a result of several initiatives. The State created two new state-funded programs (SHARP and TELLER) for mixed-income rental housing, after Congress repealed the major federal housing development programs in late 1983,8 and provided project-based subsidies so that developers could make at least 20-25% of the units affordable to low income households. Some contracts provided assistance on a “back-up” basis, used only if an owner couldn’t fill the unit with a tenant who had mobile Chapter 707 or Section 8 assistance. Over 2,000 more units were added to help finance the creation of affordable SROs and supportive housing, and to support local housing partnership developments.9
Rising homelessness also led the State to more than double mobile assistance, using budget language and regulations to target much of the new aid to at-risk and homeless households. In 1987, the Legislature also used budget language to create a new type of mobile assistance (state vouchers”) based on HUD Section 8 voucher program rules.
Freezes and Cuts (1990-1992) A state fiscal crisis in 1990 ended the growth of the program. A 7% funding cut in FY1991 forced the State to stop issuing new vouchers and freeze the re-issuance of existing vouchers as participants left the program. The appropriation dropped another 16% in FY1992, forcing cuts in current subsidies. On July 1, DHCD ordered an immediate $200 subsidy cut for all of its 2,000+ state voucher households and across the board cuts of $40-60 a month in the rents it would subsidize for all Chapter 707 households, creating havoc for tenants and landlords (including those with project-based contracts). The FY1992 budget language also cut the per-unit administrative fee for housing authorities and regional nonprofits from $45 to $15. MRVP (November 1992 forward) After advocates won a lawsuit to slow the state voucher subsidy cut in January 1992,10 the Administration began work on a new program to replace Chapter 707 and state vouchers. Unlike Chapter 707, MRVP was not created through housing legislation. Rather, the Legislature used FY1993 budget line language to end Chapter 707 (by terminating funding on October 31, 1992) and establish a replacement program effective November 1, 1992.11 The State wrote regulations for the new program and gave it its name.
The FY1993 budget language set a new, lower income limit (200% of the federal poverty limit), mandated use of a “voucher schedule” to calculate subsidy levels, and eliminated utility allowances by requiring subsidies to cover only the contract rent. The new program regulations (760 CMR 49.00)12 implemented these changes, replacing the standard subsidy model with a flat subsidy based on a household’s income bracket. To cut administrative costs, the new regulations also eliminated unit inspections by housing authorities. Chapter 707 and state voucher households who met the new standards were transferred to the MRVP program.
MRVP structural changes, combined with budget cuts between FY1992 and FY2004, rent cuts, voucher cuts and freezes on turnover, reduced the number of households assisted from 16,600 just prior to implementation to a low of about 4,500 in 2006. Since 1992, MRVP has experienced ups and downs in its ability to assist households and meet contract obligations (see

13
12).
Table 12 – MRVP Units under Lease 1993-Present (Selected Years)
Total Tenant-Based Project Based
October 31, 1992* 16,613 11,243 5,370 Nov. 1, 1993 13,885 8,766 5,119 October 1, 1996 10,292 5,650 4,642 May 1, 1999 7,871 3,600 4,271 January 1, 2000 7,310 3,114 4,196 January 1, 2003 5,858 2,340 3,518 March 1, 2009 5,171 2,164 3,007
6. MRVP Administrative Structure DHCD is responsible for overall administration of the MRVP program. Day-to-day operations are handled by local housing authorities (LHAs) and regional non-profit housing agencies (RNPs) that have mobile voucher allocations or agreed to administer project-based vouchers for specific developments. Vouchers are generally administered by the LHA in which the assisted unit is located, but not all communities have an LHA operating the program. In those cases, DHCD assigns administration to an RNP or other entity.13 Some RNPs also operate special regional programs (including the old state voucher program and new homelessness assistance programs). Currently 122 housing agencies administer MRVP vouchers - 113 LHAs and nine RNPs. The number of MRVP vouchers administered by housing agencies varies tremendously and has generally declined as MRVP has shrunk. Today, of the 122 agencies: • 57 administer five or fewer vouchers and only 33 administer more than 10 vouchers. • 3 account for one third of all units under contract, including two (the Boston Housing
Authority and Metropolitan Boston Housing Partnership) administering over 700 units each LHA and RNP responsibilities are spelled out in an Annual Contributions Contract (ACC) they execute with DHCD and the housing agency. Among other things, these include:
• Waiting List Maintenance for all tenant-based and most14 project-based vouchers (accepting applications when the waiting list is open, reviewing documentation to determine if the household is eligible at time of application, periodically updating waiting lists to see if households are still interested in remaining on the list).
• Selection of applicants from the waiting list, in accordance with state-mandated priorities, if a voucher becomes available.
• Verification of initial eligibility of selected household by reviewing financial and other required documentation (criminal and substance abuse history, public housing history, etc.)a
• Issuance of vouchers when available. • Project-based voucher-holders have 7 days to accept or reject the unit; if they reject it and
LHA finds unit was appropriate, they go to the bottom of the waiting list. • Mobile voucher holders have 120 days to locate a unit (150 days in the case of a
documented hardship) both initially and if they later decide to move from an assisted unit. Households who do not meet this deadline are not eligible for further assistance.
a In addition to income and asset limits, households must meet additional requirements to begin and continue
receiving assistance. Items that make households ineligible include owing back rent or damage payments to a housing authority and not complying with a repayment agreement, intentionally submitting false information on applications to MRVP or state housing programs in the past 3 years, eviction for good cause from public housing or when receiving state-funded rental assistance, having engaged in criminal activity, or including an illegal user of one or more controlled substance.

14
• Review of the “Request for Program Payment” form when the voucher holder finds a unit. The form lists the address, number of bedrooms, who is responsible for paying utilities, proposed contract rent and owner or owner’s agent name. The voucher holder or owner must also provide a certification from the local Board of Health that the unit complies with the state sanitary code (and a certification from a certified lead inspector that it complies with lead paint laws if the household includes a child under age 6).
• Ensuring that the tenant and owner have executed an MRVP “Lease Addendum” prescribed by DHCD that insures that the lease doesn’t unfairly waive certain legal rights. (The actual lease is between the owner and the voucher household.)
• Executing of a “Voucher Payment Contract” with the owner.
• Mailing monthly subsidy checks to owners.
• Recertifying voucher holders (request/review updated income documentation to determine financial eligibility, recalculate required tenant contribution to the rent if there has been a change and adjust payment to owner accordingly) at least annually or sooner if: o their income changes (households may request a voucher increase if their monthly income
declines and must notify the LHA/RNP if their monthly income rises by more than 10%); o their size and/or composition changes; o they move to a different unit (to confirm continued eligibility and voucher amount).
• Complying with DHCD grievance procedures for voucher holders who disagree with a decision by the LHA or regional nonprofit.
The agencies receive a monthly per-unit fee for units under lease. The fee was cut from $45 to $15 in FY1992, raised to $25 in FY1997 and to $32.50 in FY2006. With no turnover allowed since 2002, most LHAs closed their mobile waiting lists (stopped accepting new applications) years ago. When a new allocation of 100 vouchers became available in 2008 – for the first time since 1990- DHCD acknowledged that many LHAs might not have enough active applicants on their old MRVP waiting lists to use the new allocation and allowed them to use public housing waiting lists to distribute the vouchers if needed.
7. Income Limits, Rent Formulas and Program Requirements
When the State restructured Chapter 707 and state vouchers as MRVP in 1992, it moved from a program that generally resembled state public housing and federal rental assistance in terms of income limits, rent formulas, and housing quality safeguards to one that diverges in key ways: • it uses an income limit that terminates eligibility well below the level households need to
afford current rents at 30% of income in many parts of the state • it excludes tenant-paid utilities from the subsidy calculation • it has a short “grace period” for tenants who become over-income, making it risky to cross
over • it no longer requires housing agencies to periodically inspect assisted units. These changes reduced the depth of the benefit to voucher holders and the costs to the Commonwealth. Statewide Income Limits for Initial and Ongoing Eligibility Because housing costs and household incomes vary by region, all State and federal housing programs except MRVP set income limits and benefits regionally, generally using HUD-defined regions (19 in Massachusetts).

15
Initial eligibility The upper limit for initial eligibility under MRVP is 200% of the federal poverty level – a figure that is uniform both statewide and nationwide.15 16 By contrast, the old program used the same region-based limits as state public housing – then 64% of the HUD area median income adjusted for household size].
Table 13 - 2009 MRVP Income Limits by Household Size
Household size 1 2 3 4 5 MRVP Income Limit $21,660 29,140 36,620 44,100 51,580
*The limit for larger households is calculated by adding $7,480 per additional member (2009)
Definition of Income Like other housing programs, the MRVP definition of income (used to determine eligibility and minimum/maximum rent shares) excludes certain types of income from the household’s gross, pre-tax income17 and deducts certain costs (see Appendix 3). • These deductions and exclusions recognize that some households have costs (e.g. child care)
that limit the amount they can afford to spend for housing. • Some are designed to encourage or avoid penalizing work or training. • Some reflect administrative practicality (e.g. one cannot predict a one-time gift).
For the purposes of determining initial eligibility, the major difference between the MRVP definition (“net income”) and Section 8 definition (“annual income”) lies in the treatment of: • high medical expenses, the cost of caring for children or disabled household members so that
a household member can work, certain training costs, and the income of working children 18-
20 (not full time students) MRVP (and state public housing) deduct all these from gross income before calculating income eligibility, while Section 8 does not.
• One-time income exclusion for welfare recipients, treatment of elderly earned income MRVP (and state public housing) provide a one-time exclusion of increases in earnings in a 12 month period that would otherwise trigger a rent increase for households receiving some forms of public assistance. They also exclude the first $8,300 in earned income by seniors (age 60+).
These differences narrow the gap between Section 8 and MRVP initial eligibility limits for the
subgroup using these deductions. That is, the net incomes of MRVP households who used those exclusions/deductions would be lower than the Section 8 annual income data for similar households. The MRVP definition used to calculate rent share (net income), however, is very close to the Section 8 definition for that purpose (“adjusted income”), as Section 8 deducts most of those costs then.
Ongoing Eligibility MRVP also uses 200% of poverty as the upper limit for ongoing assistance. This means most participants lose eligibility at 30-50% of the HUD AMI,18 particularly one-person households19 and those living in eastern Massachusetts (where 70% live). By contrast, the old program used the Section 8 and state public housing standard which continues assistance until a household can afford the going rate for a modest apartment at about 30% of income.20
Table 14 - MRVP Income Limits as a Percentage of 2009 HUD AMI Adjusted for Household Size
Region/HUD FMR Area/ Household size 1 2 3 4
Cape and Islands
Barnstable County 40% 47% 52% 57%
Dukes County 38% 45% 50% 54%
Nantucket County 32% 37% 42% 45%
Greater Boston Boston-Cambridge-Quincy Metro 34% 40% 45% 49% Central MA
Eastern Worcester County 30% 36% 42% 43% Fitchburg-Leominster Area, Western Worcester County 40% 47% 55% 57% Worcester Area 39% 46% 54% 55%
North Shore
16
Lawrence FMR Area 36% 43% 48% 52%
Lowell FMR Area 35% 41% 46% 50% South Shore/South Coast
Easton-Raynham 31% 36% 41% 44%
Brockton Metro Area 39% 46% 51% 55%
Taunton-Mansfield-Norton 37% 43% 48% 52%
Providence- Fall River and New Bedford Area 42% 50% 56% 60%
Western MA (Hampden, Hampshire, Berkshire, Franklin Counties) 40% 47% 52% 57%
Cliff Effect MRVP’s upper income limit terminates benefits abruptly. A $1 increase in annual income can trigger a $2,000-$7,000 loss in rental assistance (approximately $200-$600 per month) if it puts a household above 200% of Federal Poverty Level (FPL). This same effect operates at lower income levels as well for mobile voucher holders because a $1 increase in annual income can move one to the next income bracket and abruptly reduce a household’s rent subsidy by $45/month ($540 a year) (see Appendices Example for Region 33). This creates a disincentive to increase one’s income, especially as one nears 200% of FPL.
Short Grace Period Because housing assistance is so difficult to obtain, most programs give households who reach the upper income limit a grace period that allows them to maintain their eligibility for a while (even though subsidy payments end). Grace periods provide a safety net against the possibility of job losses or other events that could reduce their income. MRVP provides only a three month grace period (compared to six months for Section 8 and state public housing). This creates another downside for households reaching program income limits.
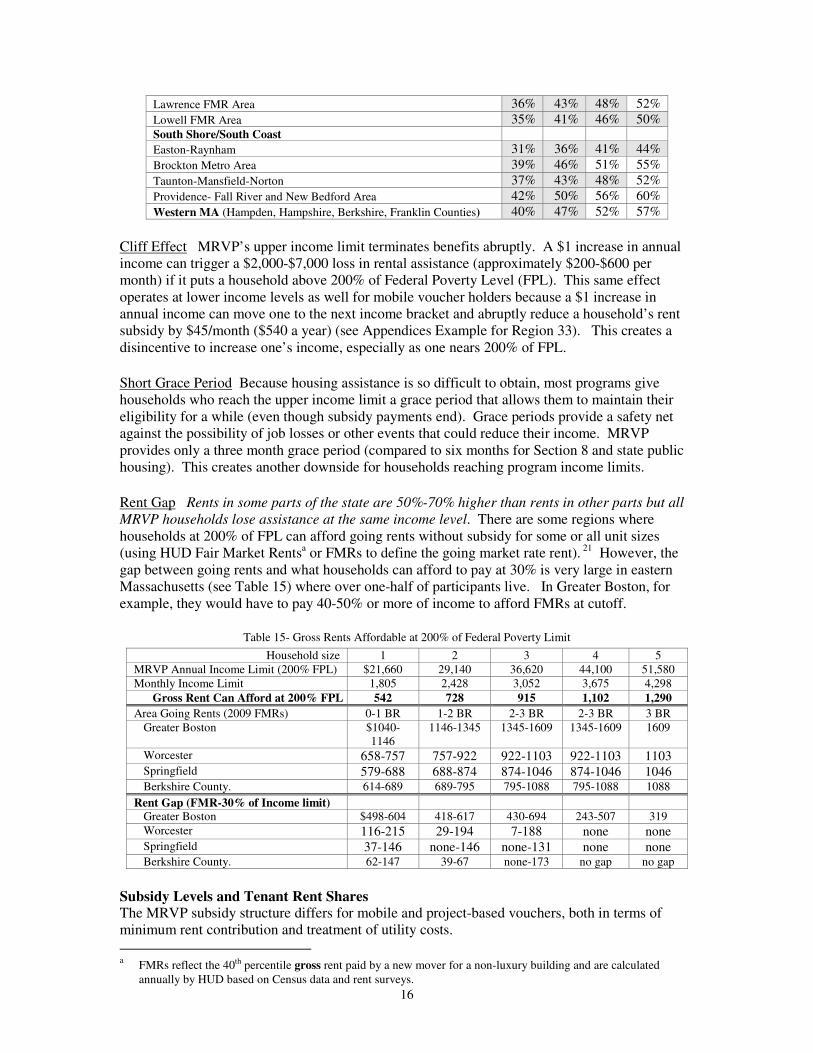
Rent Gap Rents in some parts of the state are 50%-70% higher than rents in other parts but all
MRVP households lose assistance at the same income level. There are some regions where households at 200% of FPL can afford going rents without subsidy for some or all unit sizes (using HUD Fair Market Rentsa or FMRs to define the going market rate rent). 21 However, the gap between going rents and what households can afford to pay at 30% is very large in eastern Massachusetts (see Table 15) where over one-half of participants live. In Greater Boston, for example, they would have to pay 40-50% or more of income to afford FMRs at cutoff.
Table 15- Gross Rents Affordable at 200% of Federal Poverty Limit
Household size 1 2 3 4 5 MRVP Annual Income Limit (200% FPL) $21,660 29,140 36,620 44,100 51,580 Monthly Income Limit 1,805 2,428 3,052 3,675 4,298
Gross Rent Can Afford at 200% FPL 542 728 915 1,102 1,290
Area Going Rents (2009 FMRs) 0-1 BR 1-2 BR 2-3 BR 2-3 BR 3 BR Greater Boston $1040-
1146 1146-1345 1345-1609 1345-1609 1609
Worcester 658-757 757-922 922-1103 922-1103 1103 Springfield 579-688 688-874 874-1046 874-1046 1046 Berkshire County. 614-689 689-795 795-1088 795-1088 1088
Rent Gap (FMR-30% of Income limit) Greater Boston $498-604 418-617 430-694 243-507 319
Worcester 116-215 29-194 7-188 none none Springfield 37-146 none-146 none-131 none none Berkshire County. 62-147 39-67 none-173 no gap no gap
Subsidy Levels and Tenant Rent Shares The MRVP subsidy structure differs for mobile and project-based vouchers, both in terms of minimum rent contribution and treatment of utility costs.
a FMRs reflect the 40th percentile gross rent paid by a new mover for a non-luxury building and are calculated
annually by HUD based on Census data and rent surveys.
17
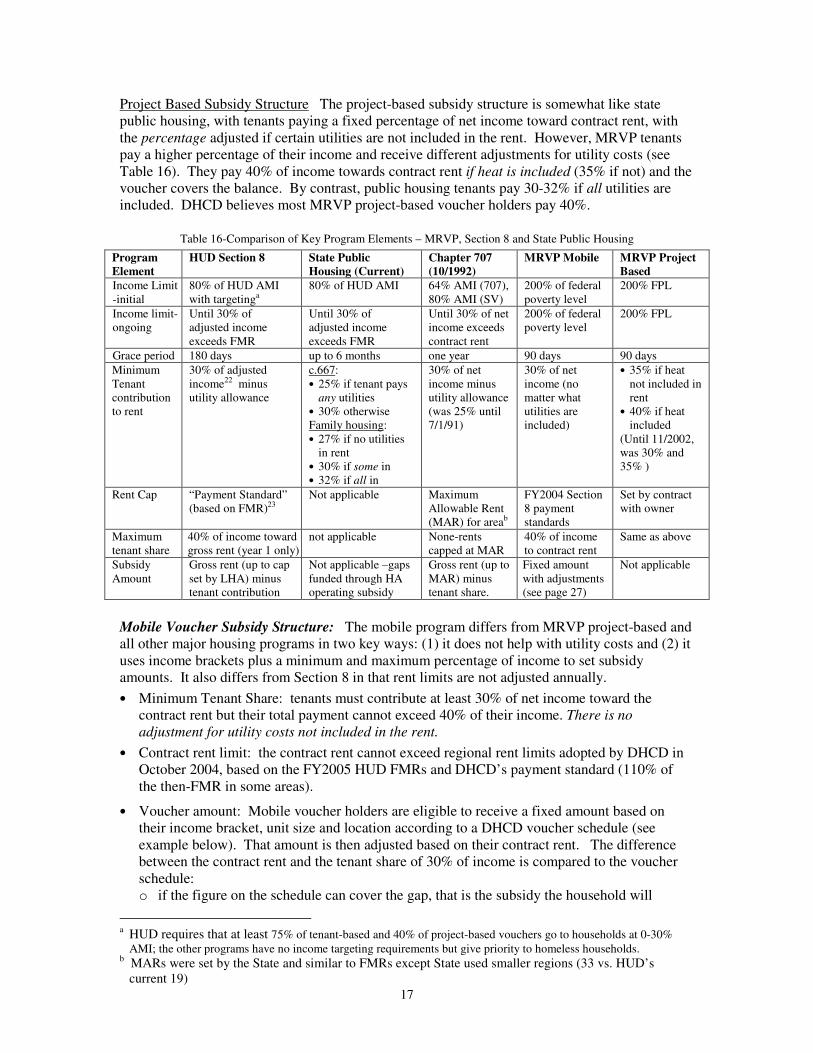
Project Based Subsidy Structure The project-based subsidy structure is somewhat like state public housing, with tenants paying a fixed percentage of net income toward contract rent, with the percentage adjusted if certain utilities are not included in the rent. However, MRVP tenants pay a higher percentage of their income and receive different adjustments for utility costs (see Table 16). They pay 40% of income towards contract rent if heat is included (35% if not) and the voucher covers the balance. By contrast, public housing tenants pay 30-32% if all utilities are included. DHCD believes most MRVP project-based voucher holders pay 40%.
Table 16-Comparison of Key Program Elements – MRVP, Section 8 and State Public Housing
Program
Element
HUD Section 8 State Public
Housing (Current)
Chapter 707
(10/1992)
MRVP Mobile MRVP Project
Based
Income Limit -initial
80% of HUD AMI with targetinga
80% of HUD AMI 64% AMI (707), 80% AMI (SV)
200% of federal poverty level
200% FPL
Income limit-ongoing
Until 30% of adjusted income exceeds FMR
Until 30% of adjusted income exceeds FMR
Until 30% of net income exceeds contract rent
200% of federal poverty level
200% FPL
Grace period 180 days up to 6 months one year 90 days 90 days
Minimum Tenant contribution to rent
30% of adjusted income22 minus utility allowance
c.667: • 25% if tenant pays
any utilities • 30% otherwise Family housing: • 27% if no utilities
in rent • 30% if some in • 32% if all in
30% of net income minus utility allowance (was 25% until 7/1/91)
30% of net income (no matter what utilities are included)
• 35% if heat not included in rent
• 40% if heat included
(Until 11/2002, was 30% and 35% )
Rent Cap “Payment Standard” (based on FMR)23
Not applicable Maximum Allowable Rent (MAR) for areab
FY2004 Section 8 payment standards
Set by contract with owner
Maximum tenant share
40% of income toward gross rent (year 1 only)
not applicable None-rents capped at MAR
40% of income to contract rent
Same as above
Subsidy Amount
Gross rent (up to cap set by LHA) minus tenant contribution
Not applicable –gaps funded through HA operating subsidy
Gross rent (up to MAR) minus tenant share.
Fixed amount with adjustments (see page 27)
Not applicable
Mobile Voucher Subsidy Structure: The mobile program differs from MRVP project-based and all other major housing programs in two key ways: (1) it does not help with utility costs and (2) it uses income brackets plus a minimum and maximum percentage of income to set subsidy amounts. It also differs from Section 8 in that rent limits are not adjusted annually.
• Minimum Tenant Share: tenants must contribute at least 30% of net income toward the contract rent but their total payment cannot exceed 40% of their income. There is no
adjustment for utility costs not included in the rent.
• Contract rent limit: the contract rent cannot exceed regional rent limits adopted by DHCD in October 2004, based on the FY2005 HUD FMRs and DHCD’s payment standard (110% of the then-FMR in some areas).
• Voucher amount: Mobile voucher holders are eligible to receive a fixed amount based on their income bracket, unit size and location according to a DHCD voucher schedule (see example below). That amount is then adjusted based on their contract rent. The difference between the contract rent and the tenant share of 30% of income is compared to the voucher schedule: o if the figure on the schedule can cover the gap, that is the subsidy the household will
a HUD requires that at least 75% of tenant-based and 40% of project-based vouchers go to households at 0-30%
AMI; the other programs have no income targeting requirements but give priority to homeless households. b MARs were set by the State and similar to FMRs except State used smaller regions (33 vs. HUD’s
current 19)
18
receive (with a downward adjustment if it is more than enough). o if it will not cover the gap, but an increase in the tenant contribution will (up to 40% of
income will), the tenant will receive the voucher amount listed on the schedule. If going to 40% of income still leaves a gap, the voucher amount is increased to fill the gap.
Exclusion of Utility Costs The exclusion of utility costs from the mobile subsidy calculation significantly raises the rent burden of most MRVP mobile households, relative to others receiving housing assistance, and the lower the household’s income, the greater the impact. The impact of excluding utility costs from the MRVP subsidy calculation has grown more pronounced in recent years, as utility costs doubled between 2000 and 2008.24 HUD estimates that utility costs make up about 20% of local gross rents, meaning the lack of a utility adjustment under MRVP can raise gross rent burdens to above 50%.
2007 Census data and 2000 Section 8 data suggest that at least 80% of MRVP mobile households have leases that do not include all utilities (heat, hot water, cooking fuel, electricity),a and a review of American Community Survey (ACS) data for Massachusetts suggests that tenant-paid utilities averaged about $150/month in 2007.25 Clearly, some pay more (those whose rent excludes all utilities).
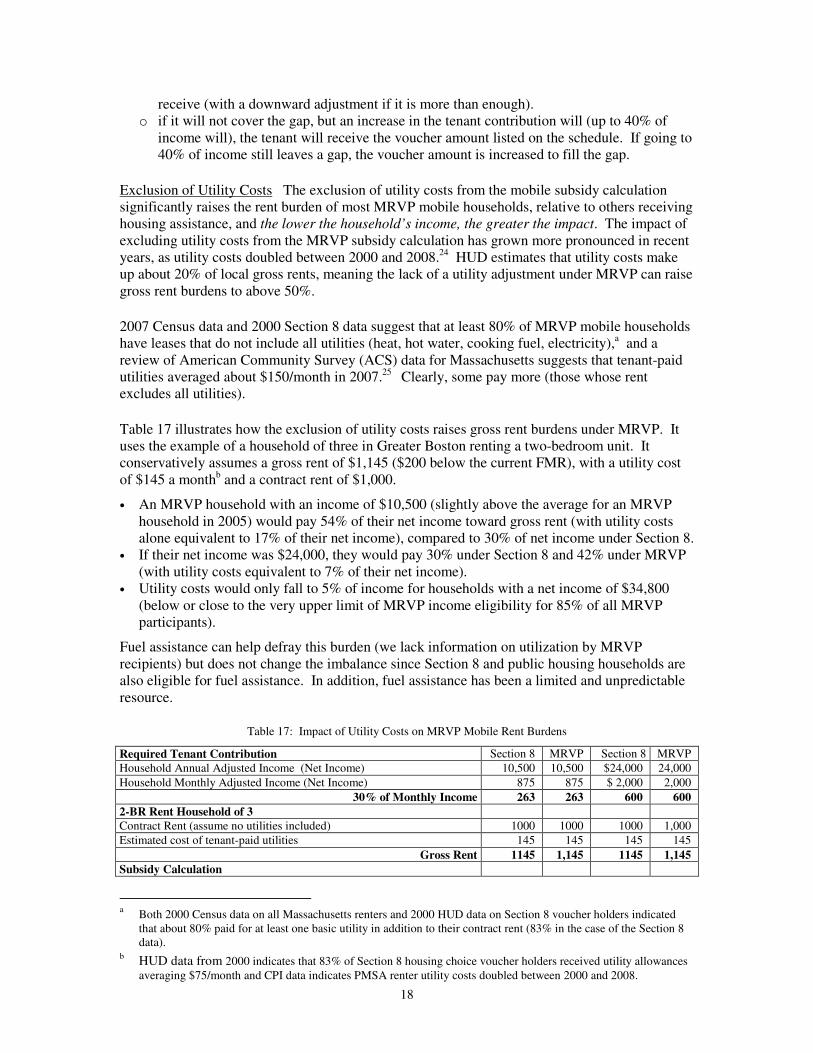
Table 17 illustrates how the exclusion of utility costs raises gross rent burdens under MRVP. It uses the example of a household of three in Greater Boston renting a two-bedroom unit. It conservatively assumes a gross rent of $1,145 ($200 below the current FMR), with a utility cost of $145 a monthb and a contract rent of $1,000.
• An MRVP household with an income of $10,500 (slightly above the average for an MRVP household in 2005) would pay 54% of their net income toward gross rent (with utility costs alone equivalent to 17% of their net income), compared to 30% of net income under Section 8.
• If their net income was $24,000, they would pay 30% under Section 8 and 42% under MRVP (with utility costs equivalent to 7% of their net income).
• Utility costs would only fall to 5% of income for households with a net income of $34,800 (below or close to the very upper limit of MRVP income eligibility for 85% of all MRVP participants).
Fuel assistance can help defray this burden (we lack information on utilization by MRVP recipients) but does not change the imbalance since Section 8 and public housing households are also eligible for fuel assistance. In addition, fuel assistance has been a limited and unpredictable resource.
Table 17: Impact of Utility Costs on MRVP Mobile Rent Burdens
Required Tenant Contribution Section 8 MRVP Section 8 MRVP
Household Annual Adjusted Income (Net Income) 10,500 10,500 $24,000 24,000
Household Monthly Adjusted Income (Net Income) 875 875 $ 2,000 2,000
30% of Monthly Income 263 263 600 600
2-BR Rent Household of 3
Contract Rent (assume no utilities included) 1000 1000 1000 1,000
Estimated cost of tenant-paid utilities 145 145 145 145
Gross Rent 1145 1,145 1145 1,145
Subsidy Calculation
a Both 2000 Census data on all Massachusetts renters and 2000 HUD data on Section 8 voucher holders indicated
that about 80% paid for at least one basic utility in addition to their contract rent (83% in the case of the Section 8 data).
b HUD data from 2000 indicates that 83% of Section 8 housing choice voucher holders received utility allowances
averaging $75/month and CPI data indicates PMSA renter utility costs doubled between 2000 and 2008.

19
Tenant Utility Allowance 145 0 145 0
Tenant share of contract rent (S8=30% of income minus utility allowance) 118 263 455 600
Additional Tenant contribution to cover rent gap 0 63 0 100
S8 or MRVP Subsidy paid to landlord 882 650 545 300
Total subsidy plus minimum tenant share for contract rent 1,145 650 1,145 300
Additional Tenant payment for utilities 0 145 0 145
Total Tenant contribution to gross rent 263 495 600 845
Tenant rent burden 30% 57% 30% 42%
Contract Rent Limits The MRVP contract rent limits are 10-15% below current HUD FMRs (40th percentile regional gross rent) for most regions except Greater Boston, since they are based on FY2005 rent estimates. This means MRVP households may not be able to rent units in all neighborhoods as the rent level MRVP will subsidize and the contract rent they will be allowed to pay is capped, even if they contribute 40% of income.
Table 18: Gap between 2009 MRVP Mobile Rent Limits and HUD FMRs (by FMR Region)
Current MAR 0 1 2 3 4
Boston 1,127 1,184 1,392 1,664 1,843
Barnstable 597 760 1,010 1,207 1,245
Brockton 827 862 1,086 1,300 1,498
New Bedford 491 647 744 891 1,155
Springfield 509 609 772 923 1,062
Worcester 592 701 840 1,033 1,147
2009 FMR
Boston 1,080 1,146 1,345 1,609 1,767
Barnstable 774 906 1,192 1,422 1,467
Brockton 965 1,004 1,265 1,513 1,896
New Bedford 583 747 855 1,024 1,382
Springfield 579 688 874 1,046 1,214
Worcester 658 757 922 1,103 1,169
Difference
Boston 47 38 47 55 76
Barnstable (177) (146) (182) (215) (222)
Brockton (138) (142) (179) (213) (398)
New Bedford (92) (100) (111) (133) (227)
Springfield (70) (79) (102) (123) (152)
Worcester (66) (56) (82) (70) (22)
MAR % over/under
Boston 4% 3% 3% 3% 4%
Barnstable -23% -16% -15% -15% -15%
Brockton -14% -14% -14% -14% -21%
New Bedford -16% -13% -13% -13% -16%
Springfield -12% -11% -12% -12% -13%
Worcester -10% -7% -9% -6% -2%
8. Priorities for Assistance
When waiting lists are open, the LHAs and RNPs take applications first come, first serve. When a voucher becomes available, they select tenants using the same priority/preference system used for state public housing,26 with displaced and homeless households receiving first priority. Within those categories, local residents receive preference.

20
Table 19: Summary of Priority Categories for MRVP
Priority Categories: 1 - Homeless due to Displacement by Natural Forces
(fire not due to the negligence or intentional act of household; earthquake, flood or other natural cause; or a disaster declared or otherwise formally recognized under disaster relief laws)
2 - Homeless due to Displacement by Public Action (urban renewal or other public improvement) (will be displaced within 90 days, or displaced within the 3 years prior to application)
3 -Homeless due to Displacement by Public Action (Code Violations) (is being displaced, or has been displaced within 90 days prior to application, by enforcement of minimum standards of fitness for human habitation established by the State Sanitary Code or local ordinances, provided that (1) neither the applicant nor a household member has caused or substantially contributed to the cause of enforcement proceedings, and (2) the applicant has pursued available ways to remedy the situation by seeking assistance through the courts or appropriate administrative or enforcement agencies.
4 -Emergency Case (under the Emergency Case Plan established by the LHA) Every LHA operating state-aided public housing or MRVP is required to have a DHCD-approved emergency case plan that describes the circumstances under which the LHA shall grant emergency case status to homeless applicants. The plan must “be reasonably reflective of the needs of persons who are homeless, in abusive situations, or encountering severe medical emergencies”. Any granting of or denial of emergency case status shall be made only after verification of circumstances warranting emergency case status. Non-receipt of requested documentation without good cause is cause for determining applicant unqualified.
5 - AHVP participant who is living in a non-permanent, transitional housing 6 - Transfer for Good Cause. 7 - Standard Applicant (all others) Preference Categories (within each priority category) (a) Local Resident. Any local resident applying for public housing receives this preference.
9. Need for Additional Vouchers to Fulfill the Commonwealth’s
Commitment to End Homelessness The need for additional housing assistance for extremely low income households is well-documented. There is also a widespread recognition that homeless families and individuals have particularly immediate needs and that the cost of housing these households in emergency shelter is extremely high. Expanding MRVP assistance offers a way to help families and individuals move from shelter to housing stability and could slowly reduce homelessness and save money since MRVP subsidy costs are lower than shelter costs.
Family homelessness has more than doubled in the past four years, with a 30% increase in the past year alone. In March 2005, there were 1,209 families in the emergency shelter system. In March 2009, there were 2,546 (with over 4,400 children) 27 at a cost of over $7.5 million/month ($3,000 per family). In FY2009, The Department of Transitional Assistance (DTA) will spend over $113 million on the emergency shelter system for families (1,900 beds) and more than $36 million more on shelters and services for homeless individuals (2,900 beds).
While much of this growth in homelessness reflects a basic problem that many very poor households cannot afford housing without a subsidy, some of it reflects inadequate public responses. Entries to the system are higher than necessary due to the underfunding of prevention programs and exits have been slowed by a lack of resources to help families relocate to housing they can afford. The 2007 report of the State’s Special Commission Relative to Ending Homelessness in the Commonwealth28 concluded current state policies need to be reorganized to target “appropriate resources to the right people at the right time and in the right locations.”
21
Estimates of how many shelter users can be assisted with short-term interventions and how many are likely to need longer term assistance vary. The Commission estimated that about 8% (1,900) of the state’s 24,000 homeless individuals need longer term assistance combined with support services. After reviewing data on the 5,000 households using the family shelter system in 2007, it estimated 75% might need medium or long-term housing assistance to achieve long-term stability. By contrast, a study of shelter use in 2004 (when the economy was strong and homelessness was one-half of current levels) found almost the opposite need distribution, with only 27% appearing to need more than short-term assistance.29
Categorization of Needs – 2007 Homelessness Commission Study
Families Of the 5,000 families using the shelter system in 2007, the Commission estimated that: • 15% (Tier 1) needed one-time help with a temporary economic problem (e.g. job loss, arrearages) • 10% (Tier 2) needed short-term support to help with moderate economic problems • 50% (Tier 3) had complex economic challenges (very low incomes) and would need longer term
rental assistance (along with access to support services and asset-building programs), and • 25% (Tier 4) had complex social and economic challenges and would likely need permanent housing
assistance. Individuals Of the approximately 24,000 homeless individuals, it estimated that • 40% (Tier 1) had short stays that could be averted with one-time assistance • 40% (Tier 2) could have avoided homelessness if housing was available to them when leaving an
institutional setting or system (e.g. corrections). • 8% (Tier 3) were chronic shelter users (1,900) and likely to need longer term financial assistance
combined with support services to live in permanent housing • 12% (Tier 4) were shelter avoiders
Even with conservative estimates, it is clear that the States needs new housing resources to address the medium- and longer-term housing needs of Tier 3 and Tier 4 households. For this reason, the Commission recommended that the State fund new MRVP vouchers and new permanently affordable housing units for extremely low income households, noting that investments in alternative housing and prevention services will eventually be defrayed by shelter bed savings (or the averting of greater shelter expenditures).
Making MRVP vouchers available to more families and individuals as part of that effort should be part of the initial strategy. Both the mobile and project-based program should be expanded;
the latter offers a change to reduce costs and help finance supportive housing. As Table 20 and
Table 21 show, funding new MRVP vouchers would enable the State to better serve homeless families and individuals at lower cost. As of March 2009, subsidy costs average $906/month for newly-issued mobile vouchers ($7,300 a year). By contrast, the average cost of providing a shelter bed (excluding service costs) in 2007 was just under $1,800/month ($2,980/month in the family shelter system and $1,000 month in shelters for individuals).
• Currently, it costs the Department of Transitional Assistance (DTA) over $140 million to support 4,800 shelter beds (2,900 for individuals and nearly 1,900 units for families).30
• By contrast, it costs $35.8 million (annualized cost) to assist 5,100 households using MRVP.
• Providing a family with 19 months of voucher assistance would cost the same ($18,000) as the state currently spends to house families in shelter for six months.
• Providing three years of voucher assistance ($38,000 assuming some rent inflation and no growth in tenant income) would cost $7,000 less than the state was spending in 2006 on its long-term families (with an average stay of 14.6 months).

22
Table 20 – Cost of Adding New Vouchers
Monthly average cost/ household
Annual average cost/ household
New House-
holds served
Annualized Cost
Year 1 Cost (assuming 12 month phase in (130/hh/month)
Mobile $1,000 $12,000 667 $8,004,000 4,002,000
Project-based $825 9,900 404 $3,999,600 1,999,800
Total $750 7,500 1071 $12,003,600 6,001,800
Shelter households $3,000 $18,000* 667 333
*assuming six month stay
Table 21 – Average Length of Stay – DTA Family Shelters31 - early 2004 entrants*
Temporary Episodic Long Stay Total
Number of cases 365 30 99 494
Average number of episodes 1 2 1 1.1
Average number of days 105 195 444 179
Total number of days 105 98 444 169
Total days used 38,491 5,559 43,977 88,327
Percentage of clients 73.9% 6.1% 20.0% 1
Percentage of total days used 43.6% 6.6% 49.8% 1
Mean cost per family in 2006 dollars $11,550 $21,450 $48,440 $19,690 *Based on study of all 494 households first entering system between December 2003 and February 2004
From a cost saving perspective, it makes sense to target the new vouchers to Tier 3 and 4 families likely to have long term assistance needs and to families who have been in shelter the longest.
10. Long-term Recommended Changes:
Over the long term, we also recommend encouraging initiatives to improve program efficiency:
� The State should budget for MRVP on a two-year basis, with year 1 funding based on maintaining a specified minimum number of tenant- and project-based vouchers for the current fiscal year and authority for DHCD to commit funding for additional vouchers up to a specified annualized cost in year 2, recognizing that full funding for the new vouchers is not needed in year 1. Funding could be linked to savings realized in the shelter system.
� Return to income limits based on a percentage of area median income, rather than 200% of the federal poverty level, consistent with all other state housing programs. Revising the income limits would provide regional equity but would have no cost, since current limits are generally below 50% of area median income and no new vouchers are being issued. There might be a small savings if more households close to 50% of median replaced lower income households upon turnover of project-based units since it would reduce subsidy costs.
� Use local Section 8 payment standards as the rent cap.
� Allow participants to continue receiving assistance until they can afford their full rent (up to the rent cap) at 30% of income, with a six month grace period of continued eligibility. This change would eliminate the current penalty imposed on MRVP participants in high cost areas when their income crosses over the 200% of poverty threshold. We estimate it would cost less than $50,000 a year on an annualized basis. Its effect on overall program costs will differ by subprogram.
� Simplify rent calculations, following the model proposed for Section 8 under pending legislation.
� Create a centralized waiting list, building on the model DHCD and NAHRO use for Section 8.

23
� Allow housing authorities to establish voluntary family self-sufficiency programs, using case management and escrow programs to participants who increase their incomes to build assets to protect against emergencies and reach long term economic sufficiency.
� Require an MRVP administrative plan, similar to what HUD requires for the Section 8 program, which outlines program policies (including any income targeting and set-asides for special populations), priorities and goals.
� Consider more far-reaching administrative reforms, such as regionalizing administration, if they would reduce per-unit overhead costs through economies of scale.

24
APPENDICES
Chapter 707 and State Voucher Units under Lease 1970-1992
Total Units under lease Mobile Project Based
March 1970 279
July 1972 897
July 1, 1980 7,376
July 1, 1983 7,503 5,500 2,000
February 1, 1985 10,953
March 31, 1989* 17,971
March 31,1990 * 19,839
June 30, 1990 * 19,624 14,911 4,713
June 30, 1991 * 17,213 12,116 5,097
June 30, 1992 * 17,160 11,780 5,380
October 31, 1992* 16,613 11,243 5,370 *including vouchers, excluding DMH
MRVP Appropriations - FY1989-FY2009
FY c707
State
Vouchers Total
Real (FY2009
dollars)
1989 90,752,729 15,000,500 105,753,229 191,946,938
1990 112,611,849 13,078,514 125,690,363 218,002,509
1991 105,283,371 11,594,880 116,878,251 191,052,264
1992 88,519,595 9,654,545 98,174,140 155,706,749
1993 75,573,405 0 75,573,405 116,482,637
1994 61,606,049 0 61,606,049 92,414,566
1995 58,424,866 0 58,424,866 85,359,237
1996 47,583,760 0 47,583,760 67,799,263
1997 42,327,556 0 42,327,556 58,370,661
1998 41,172,368 0 41,172,368 55,827,230
1999 36,131,919 0 36,131,919 48,215,500
2000 32,617,701 0 32,617,701 42,388,088
2001 35,298,397 0 35,298,397 44,369,071
2002 31,768,557 0 31,768,557 39,321,994
2003 26,668,557 0 26,668,557 32,243,008
2004 22,688,557 0 22,688,557 26,925,026
2005 24,283,345 0 24,283,345 27,909,003
2006 26,283,345 0 26,283,345 29,209,905
2007 27,483,345 0 27,483,345 29,786,743
2008 29,958,638 0 29,958,638 31,196,288
2009 33,047,202 0 33,047,202 33,047,202
change FY90-FY09 (92,643,161) (184,955,307)
% change -73.7% -84.8%
*FY2002 after 9C cuts, vetoes & Feb supp; FY2003 before agencywide cut of $3.9 million

25
MRVP Program Cuts and Restorations 1992-Present
Tenant-Based Project-Based
FY1993 Nov 1992 MRVP established
FY1997 July 1996 Admin fee raised from $15 to $25
FY1998 Nov 1997 Vouchers increased $25-50 Contract rents increased $25-50
FY2000 Dec ‘99 Freeze on turnover lifted
Feb 2000 Waiting lists re-established
May Ceiling rents eliminated
June Vouchers increased $25-50 Contract rents increased $25-50
FY2001 Nov 2000 Vouchers increased $25-50 Contract rents increased $25-50
Jan 2001 Rent increases for MHFA, RHS restored
Mar 2001 Vouchers increased $50-100
FY2002 Aug 2001 Vouchers increased $150-300 Contract rents increased $150-300
May 2002 Freeze on turnover reinstated MHFA and RHS rents frozen
FY2003 Aug 2002 All waiting lists closed
Nov 2002 Vouchers cut by $50 (mobile tenant shares increased by $50)
Tenant rent increased from 30-35% of income to 35-40%; Rents cut $30-60 (except MHFA, RHS)
FY2006 July 2005 Cap on % of income households can pay toward contract rent established (40%)
Rent increases for some MHFA, RHS units ($40-60) and for some SHARP units ($100)
Raises admin fee?
FY2008 Oct 2007 Jan 2008
October 2007: DHCD makes 100 new tenant-based vouchers available to housing authorities
January 2008: Rents cut from 2002 restored ($30-60). Rents also increased for projects that received no or only partial increases in 2006 (increases ranged from $40 for MHFA and RHS units to up to $100 for most other project-based units (Core Focus, DPH, DSS, MHP, Mod Rehab).32

26
MRVP Vouchers by Administering Housing Agency (Min. 50 Vouchers)
Data Source: DHCD Contract List (12/2008) and Leasing Report (8/2008)
Agency
TBA
leased
(Aug
2008)
% of
Total
Statewide
TBA
Leased
PBA
ACC
12/2008
PBA
Leased
(Aug
2008)
% of
PB ACC
Total
TBA + PB
leased
8/2008
GRAND TOTAL 2,197 3,663 3,003 5,200
Barnstable 48 2.2% 4 4 0.1% 52 Beverly 27 1.2% 53 41 1.4% 68
Boston 196 8.9% 525 438 14.3% 634 Braintree 4 0.2% 84 83 2.3% 87 Brockton 96 4.4% 27 27 0.7% 123
Cambridge 27 1.2% 83 70 2.3% 97 Chelsea 44 2.0% 22 22 0.6% 66 CTI 73 3.3% 13 9 0.4% 82
Greenfield 4 0.2% 98 68 2.7% 72 HAC 46 2.1% 12 12 0.3% 58 HAP 150 6.8% 276 215 7.5% 365
Holyoke 22 1.0% 124 114 3.4% 136 Lynn 100 4.6% 174 168 4.8% 268 Mashpee 19 0.9% 38 38 1.0% 57
MBHP 418 19.0% 469 281 12.8% 699 New Bedford 60 2.7% 15 13 0.4% 73 Peabody 34 1.5% 102 92 2.8% 126
RCAP 28 1.3% 38 30 1.0% 58 Southbridge 25 1.1% 56 51 1.5% 76 Springfield 57 2.6% 154 142 4.2% 199 SSHDC 82 3.7% 37 36 1.0% 118
Westfield 19 0.9% 50 50 1.4% 69 Weymouth 33 1.5% 62 59 1.7% 92 Worcester 56 2.5% 163 133 4.4% 189
Other (99 agencies) 529 24.2% 984 807 27% 1,336

27
“Old Project Based” Units under Lease - August 2008
Contracts Project type
Under
Contract
(December
2008)
Leased
(August
2008)
60 Older MHFA 1,428 1,267
28 Mod Rehab 991 839
45 SHARP 339 266
9 MHP 191 175
22 Project Specific 295 132
10 Dept. of Social Services (DSS) 92 88
6 Core Focus (downtown revitalization) 98 66
7 RHS (FmHA) 52 36
3 Dept. of Public Health (DPH) 38 28
190 3,524 2,897
Example: Voucher Schedule for Region 33 (Boston, Cambridge, Brookline) a
BEDROOM SIZE
Net Income Bracket 0 1 2 3 4 5+
0 - 1,499 722 805 944 1147 1342 1571
1,500 - 2,999 677 760 899 1102 1297 1526
3,000 - 4,499 632 715 854 1057 1252 1481
4,500 - 5,999 587 670 809 1012 1207 1436
6,000 - 7,499 542 625 764 967 1162 1391
7,500 - 8,999 497 580 719 922 1117 1346
9,000 - 10,499 452 535 674 877 1072 1301
10,500 - 11,999 407 490 629 832 1027 1256
12,000 - 13,499 362 445 584 787 982 1211
13,500 - 14,999 321 400 539 742 937 1166
15,000 - 16,499 302 355 494 697 892 1121
16,500 - 17,999 300 310 449 652 847 1076
18,000 - 19,499 300 300 404 607 802 1031
19,500 - 20,999 300 300 359 562 757 986
21,000 - 22,499 300 300 333 517 712 941
22,500 - 23,999 300 300 313 472 667 896
24,000 - 25,499 300 300 300 427 622 851
25,500 - 26,999 300 300 300 386 577 806
27,000 - 28,499 300 300 300 367 532 761
28,500 - 29,999 300 300 300 355 487 716
30,000 - 31,499 300 300 300 355 465 671
31,500 - 32,999 300 300 300 355 465 626
33,000 - 34,499 300 300 300 355 465 583
34,500 - 35,999 300 300 300 355 465 575
36,000 - 37,499 300 300 300 355 465 575
37,500 - 38,999 300 300 300 355 465 575
39,000 - 40,499 300 300 300 355 465 575
40,500 - 41,999 300 300 300 355 465 575
42,000 - 43,499 300 300 300 355 465 575
43,500 - 44,999 300 300 300 355 465 575
a MRVP divides the state into 33 regions, each with its own voucher schedule; #33 is the highest cost one.

28
Income Definitions –MRVP, State Public Housing and Section 8
State and federal housing programs use slightly different terminology and calculations to determine (1) if a household’s income is within program limits and (2) how much they should contribute to their rent. • Income is defined as (pre-tax, pre-deduction) income from all sources – wages, public assistance,
income from property, social security, SSI, unemployment, pensions, alimony, child support, lottery winnings, regularly occurring gifts, etc. - received by all household members over 18 from all sources.
• Each program excludes some forms of income and deducts certain costs when determining eligibility and rent shares.
• MRVP and State Public Housing use net income both to determine eligibility and rent shares • Section 8 uses annual income to determine eligibility and adjusted income to determine rent shares
Exclusions from Gross Income (x=fully excluded) MRVP State Public Hsg Section 8
Earned income of children 0-17 x x xa
Earned income of working child 18-20 half half none
Earnings of Full time students (not HH head, spouse) x (w/limits)b x (w/limits) x (above $480)
Payments for care of foster children, adults x
Adoption assistance payments x (above $480)
Lump asset gains (inheritances, insurance settlements) x x x
Reimbursement of medical expenses x x x
Income of live-in personal care attendant x x x
Student financial assistance x x x
Armed forces special pay (hostile fire) x
Training program stipends x x x
Incremental earnings under certain state/local training programs x x x
Earned income increase (one12-month exclusion) for households receiving TAFDC, EAEDC, SSI, SSDI or public assistance
x x
Temporary, sporadic, non-recurring gifts x x x
Food Stamps x x x
Fuel Assistance x x x
State or federal relocation payments
Payments under Domestic Volunteer Service Act x x x
Return on capital from sale of investment, real or other property x x
Fees, tuition for part-time post-secondary training x x 0
First $8,300 in wages for anyone 62+ x x 0
Gross Income/Annual Income (for S8 Income Eligibility)
Deductions
Elderlyc household or households with someone disabled 5% of gross $400d (limited) $400
Each unemancipated minor<18 (MRVP); each dependent (S8) 0 $300 480e
Each additional adult household member 0 $300 0
Heat paid by tenant 0 0
Child support and alimony payments to another household x x
Unreimbursed medical expenses >3% of gross x x x
Child care expenses to extent needed household member can work x (w/limits)f x (w/limits) x (w/limits)
Disabled care costs for an ill/incapacitated household member so another member can work; certain other in-house care costs
x (w/limits)g x (w/limits) x (w/limits)
Net Income (MRVP)/ Adjusted Income (Section 8)
x=excluded
a Section 8 definition includes foster children b MRVP and State public housing limit this to dependents aged 18-25 and limit length of time can claim. c State defines elderly households as head or co-head aged 60+ (vs. 62+ under S8) d Only allowed if the household is living in family housing and is not over-housed e S8 deduction is $480 for each family member who is under 18, a person with disabilities or a full time student f All programs cap deduction or exclusion at working member’s gross income; S8 also limits to care for
children 12 or younger; also allows to enable household member to look for work or further education.
g All three programs limit deduction to amount earned by household member; S8 also only allows to extent exceeds 3% of gross annual family income

29
Endnotes
1 “Report of the Special Commission Relative to Ending Homelessness in the Commonwealth “, page ix.
2 Utility allowances are based on unit size, building type, household size, local utility rates
3 The voucher is a document that details programs rules and the maximum amount of subsidy a household can receive based on their household income and where they live). Prior to 1983, both the federal Section 8 program and Chapter 707 program used the term “certificate” instead of voucher. Voucher became part of rental assistance terminology in 1983 when Congress created a new form of Section 8 assistance that a slightly different benefit model than the certificate program. The State stopped using the phrase certificate in 1992, when it created MRVP and HUD dropped the term in 1998, when it consolidated its two programs under modified rules.
4 Chapter 707 of the Acts and Resolves of 1966 – “An Act Providing A Program of Rental Assistance for Families of Low Income”
5 1965 Commission report, page 48
6 Section 23 Leased Housing established by the Housing Act of 1965 let housing authorities leased private rental units and subleased them to very low income households at affordable rents.
7 Median home prices rose by almost 140% in Eastern Massachusetts between 1983 and 1988, while inflation-adjusted median gross rents rose by 43% between 1980 and 1990)
8 The Housing and Urban-Rural Development Recovery Act (P.L. 98-181), signed into law by President Reagan on November 30, 1983, repealed the Section 8 New Construction and Substantial Rehabilitation programs.
9 The State had established a division called the Massachusetts Housing Partnership to help cities and towns to plan and initiate affordable housing developments by creating “local housing partnerships” with a broad-based membership (municipal officials, business leaders, lenders and housing advocates). The State provided technical assistance to the partnerships and gave them priority for funding under some programs.
10 The plaintiffs argued that the cut violated the budget language requiring that the program follow federal Section 8 rules. The State Supreme Judicial Court agreed in January 1992 (Woods v. Executive Office
of Communities and Development), finding that the subsidy cut could only be implemented as participants moved to new units.
11 Section 21 of Chapter 133 of the Acts of 1992
12 The regulation (760 CMR 49.00) was promulgated September 4, 1992, amended September 18, 1992, and made effective October 23, 1992. Further amendments went into effect in 1998 (September 1 and November 13).
13 760 CMR 49.08(8)
14 In some cases where units are for populations receiving services from a state agency; the service provider selects the household to fill an opening and then refers them to the LHA/RNP for the determination of financial eligibility)
15 Slightly higher levels apply for Hawaii and Alaska. It is set annually (usually around February).
16 There is also an asset limit of $15,000 (or 1.5 times their gross income if less). Assets include almost all personal property except non-luxury cars (e.g. all cash, savings, IRA and similar accounts, equity in real property, stocks, bonds, and insurance settlements). There is no asset limit for continued eligibility.
17 Most programs use a similar definition of gross income (generally, all pre-tax income received by all household members from all sources – wages, public assistance, pensions, alimony, child support, lottery winnings, etc.).
18 The 30-50% AMI cutoff is below the initial eligibility limit for all other state and federal housing assistance programs (60-80% of AMI).

30
19 Differences HUD and HHS adjust limits for household size account for some of this discrepancy, as do
differences in the way net income is calculated under MRVP and Section 8, but they do not affect all households equally.
20 Chapter 707 continued eligibility until the tenant’s rent share equaled the contract rent and allowed a one year grace period. State public housing regulations [(760 CMR 5. 06 (2) and (3)] now continue eligibility
for a household in family housing “until such time as 32% of its monthly net household income equals or exceeds the fair market rent (FMR) then in effect for the Section 8 Existing/Voucher Program for a unit of appropriate unit size in the area in which the LHA is located.” For households in elderly/disabled housing, they use 30% of monthly net income in the formula.
21 This is the standard state public housing and Section 8 use to set the upper limit for ongoing eligibility.
22 In cases where the formula results in a very low tenant share, HUD gives housing agencies the option of charging a minimum rent (no more than $50/ month); DHCD currently requires a minimum contribution of $25/month.
23 Fair Market Rents (FMRs) are set annually by HUD based on its estimate of lower end gross rents (40th percentile) paid by new movers. Housing authorities generally set their rent caps at or near the FMRs (HUD allows them to use slightly lower/higher caps based on market variations within the FMR area).
24 According to the Bureau of Labor Statistics, Consumer Price Index for All Urban Consumers, Fuels and Utilities, Boston CMSA, the annual index for these costs rose from 131.9 in 2000 to 264.1 in 2008.
25 The statewide difference between the median contract rent ($828) and median gross rent ($946) was $118 a month (American Community Survey 2007 – Massachusetts – Table B25069: Inclusion of Utilities in Rent (Renter-Occupied Housing Units)). Dividing the difference between the 2007 ACS
estimates of aggregate gross rent and aggregate contract rent for Massachusetts by the estimated number of renter households whose contract rent does not include all utilities yields an average difference of $150 a month for those households.
26 760 CMR 49.04(1)
27 David Abel, “State Revises Regulations on Homeless”, Boston Globe, March 28, 2009, page B1.
28 Report of the Special Commission Relative to Ending Homelessness in the Commonwealth, December 28, 2007 Available online at http://www.mass.gov/?pageID=ehedmodulechunk&L=4&L0=Home&L1=Economic+Analysis&L2=Executive+Office+of+Housing+and+Economic+Development&L3=Department+of+Housing+and+Community+Development&sid=Ehed&b=terminalcontent&f=dhcd_hc_hc&csid=Ehed
29 Dennis P. Cu8lhane, Stephen Metraux, Jung Min Park, Maryanne Schretzman and Jesse Valente, “Testing a Typology of Family Homelessness Based on Patterns of Public Shelter Utilization in Four U.S. Jurisdictions: Implications for Policy and Program Planning”, Housing Policy Debate, Volume 18, Issue 1, April 2007, page 11
30 “Report of the Special Commission Relative to Ending Homelessness in the Commonwealth “, page ix.
31 Culhane et al. (2007), page 11.
32 Projects that received an increase in prior 2 years had their 2008 increase reduced by the prior increase amount.