Embed Size (px)
Citation preview

THE MARIN WOMEN’S STUDY

Why was it initiated?Why was it initiated? What is happening now?What is happening now? What will the future bring? What will the future bring?

Why Was it Initiated?Why Was it Initiated?

100
120
140
160
180
200
220
240
90 91 92 93 94 95 96 97 98 99
Year
Age
-adj
uste
d R
ate
per
100,
000 Marin
Bay Area
UrbanCalifornia
US
Breast Cancer Incidence Trends in Marin County*
(2001-02)
* White non-Hispanic women, invasive cancers only


The Breast Cancer Incidence Rates The Breast Cancer Incidence Rates Comparison – 2004-05Comparison – 2004-05
50
100
150
200
250
90 91 92 93 94 95 96 97 98 99 0 1Year of diagnosis
50
100
150
200
250
90 91 92 93 94 95 96 97 98 99Year of diagnosis
Rat
e pe
r 10
0,00
0
Mortality
Phipps A, Clark C, Ereman R; Breast Cancer Research, June 7, 2005
Marin
SFBA
CA
US
Rates in the1990’s Re-calculated based on new Census

MANY Questions MANY Questions WHY Marin’s Breast Cancer WHY Marin’s Breast Cancer
Rates HighRates High2001-20052001-2005

Why Marin?Why Marin?
More women screening?
Lifestyle Differences?
More Toxins?
NO, slightly higher screening rates, expect 1-2
more cases a year
YES, More women in Marin: drink alcohol daily, have
fewer children, later in life, higher income/education. All would act to increase
Marin’s rates.
Data lacking on exposures
BUT – Marin women are thinner, exercise more and
report eating healthier… These
would act to decrease Marin’s
rates

Left with the questionLeft with the question
Do the women in Marin who get breast Do the women in Marin who get breast cancer have more of the risk factors that cancer have more of the risk factors that are more prevalent here? are more prevalent here?
We needed risk factor information from We needed risk factor information from women getting cancer, so we could women getting cancer, so we could answer this crucial question. answer this crucial question.

2004 - What Next?2004 - What Next? Research suggests that lifestyle risk factors play a role in Marin Research suggests that lifestyle risk factors play a role in Marin
We need to gather individual risk factors and breast health We need to gather individual risk factors and breast health information from each Marin womaninformation from each Marin woman
The County/Community IS where research needs to be – The County/Community IS where research needs to be – Community is determined and cares deeplyCommunity is determined and cares deeply
All women do not respond to risk factors in the same way, We All women do not respond to risk factors in the same way, We need to to look at gene-environment interactions need to to look at gene-environment interactions
Can we pave a way for investigating environmental toxins.Can we pave a way for investigating environmental toxins.
THE MARIN WOMEN’S STUDY WAS BORNTHE MARIN WOMEN’S STUDY WAS BORN

HISTORYHISTORY
Funded by the CDC in July 2005Funded by the CDC in July 2005 Multiple stakeholder planning meetings Multiple stakeholder planning meetings
during 2005-2006during 2005-2006 Data Collection Launched November 2006Data Collection Launched November 2006 First Research Results January 2008First Research Results January 2008
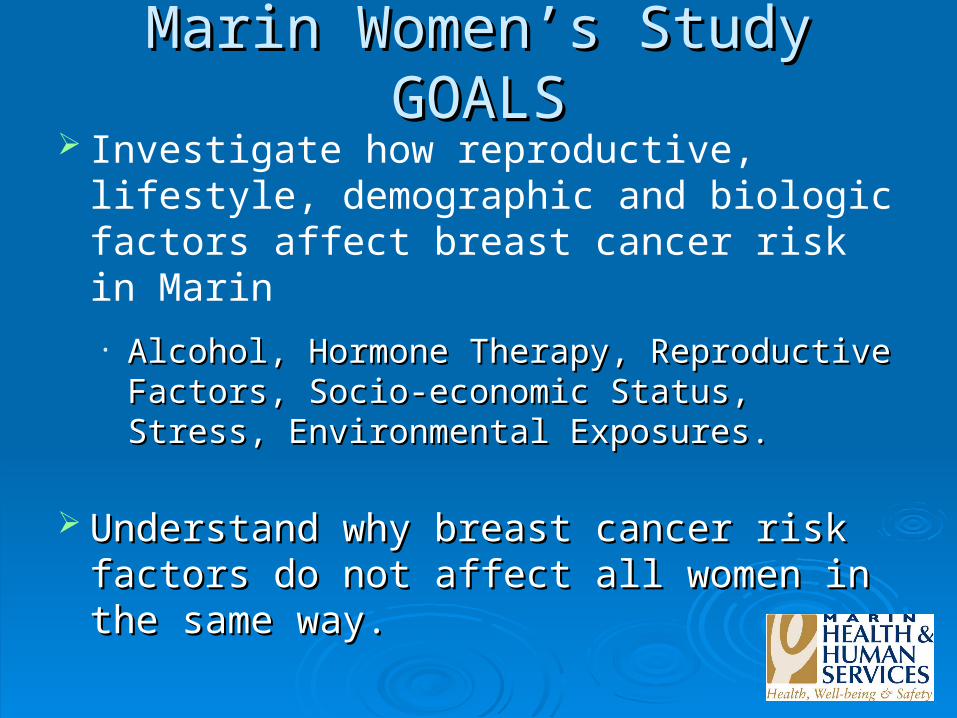
Marin Women’s Study GOALSMarin Women’s Study GOALS Investigate how reproductive, lifestyle,
demographic and biologic factors affect breast cancer risk in Marin
• Alcohol, Hormone Therapy, Reproductive Alcohol, Hormone Therapy, Reproductive Factors, Socio-economic Status, Stress, Factors, Socio-economic Status, Stress, Environmental Exposures.Environmental Exposures.
Understand why breast cancer risk factors Understand why breast cancer risk factors do not affect all women in the same way.do not affect all women in the same way.

MWS COMPONENTSMWS COMPONENTS
Community Campaign
Risk Factor Questions
Breast Health
Outcomes
Biospecimen
Breast CancerBreast Density

Who is Involved?Who is Involved?

COLLABORATIONCOLLABORATION

SCIENTIFIC ADVISORY TEAMSCIENTIFIC ADVISORY TEAM
MARIN MARIN COUNTY COUNTY DHHSDHHS
BUCK BUCK INSTITUTEINSTITUTE
KAISER KAISER MEDICAL MEDICAL GROUPGROUP
MARIN MARIN GENERAL GENERAL HOSPITALHOSPITAL
UCSFUCSF
ZERO ZERO BREAST BREAST CANCERCANCER

COMMUNITY INVOLVEMENT COMMUNITY INVOLVEMENT GROUPGROUP
Marin General Hospital Marin General Hospital Meals of Marin Meals of Marin Marin Family Action Marin Family Action Marin Friends of Women Marin Friends of Women Kaiser Permanente Kaiser Permanente Marin Center for Independent Marin Center for Independent
Living Living Zero Breast CancerZero Breast Cancer
15 Individuals & Community Groups15 Individuals & Community Groups Marin Breast Cancer CouncilMarin Breast Cancer Council Breast Cancer Resource Center Breast Cancer Resource Center American Cancer Society American Cancer Society Tina Action ProgramsTina Action Programs Fair Housing of MarinFair Housing of Marin

…MANY VOLUNTEERS!!AND

What Is Happening What Is Happening Now?Now?

STUDY SUCCESSES – Oct. 2009STUDY SUCCESSES – Oct. 2009
QUESTIONNAIREQUESTIONNAIRE Almost 14,000 Almost 14,000 QuestionnairesQuestionnaires received! received!
BIOSPECIMENBIOSPECIMEN SalivaSaliva Collection 6,000 Samples! Collection 6,000 Samples! AVON AVON fundingfunding received July 2007, Sept 2009 received July 2007, Sept 2009
CAMPAIGNCAMPAIGN CampaignCampaign – Banners, Movie Theatres, Grocers… – Banners, Movie Theatres, Grocers… 80%80% of women surveyed knows about MWS of women surveyed knows about MWS

Hormone Therapy StudyHormone Therapy Study
In ReviewIn Review

Hormone Therapy Use, 2001Hormone Therapy Use, 2001Women, ages 50+Women, ages 50+
Marin: 40.7%, California: Marin: 40.7%, California: 39.3% - used any type of 39.3% - used any type of prescription hormone prescription hormone therapy.therapy.
% of women >50 yrs. % of women >50 yrs. with a Hysterectomy: with a Hysterectomy: Marin 29.4% Marin 29.4% California- 38.1% California- 38.1% Kings County – 53.7%Kings County – 53.7%
Percentage of women with Hysterectomy, 2001 MARIN
Hysterectomy
Intact Uterus
Percentage of women with Hysterectomy, 2001 KINGS
Hysterectomy
Intact Uterus
E + P
E + P

HRT Use by Year
8.048.39
9.66
12.17
15.4
17.6
19.7420.27
20.87
22.4522.922.84 21.520.720.420.7
21.8
24.3
25.92626.426.42625.1
0
5
10
15
20
25
30
1994 1996 1998 2000 2002 2004 2006 2008
Year
%
% Combo
% E only
Women 50+ in that year, all ethnicities
HERS
WHI
HORMONE THERAPY USE BY YEAR
Estrogen Only and Estrogen plus Progestin
ESTROGEN ONLY
Estrogen/Progestin
6%

Alternative Hormone UseAlternative Hormone Use
n=1,748n=1,748 ## %%
Use (2006-07)Use (2006-07) 152152 8.7%8.7%
Soy ProductsSoy Products 4545 2.6%2.6%
Black CohoshBlack Cohosh 3939 2.2%2.2%
Combination HerbalCombination Herbal 2020 1.1%1.1%
PhytoestrogensPhytoestrogens 1111 0.6% 0.6%
OtherOther 4343 1.5%1.5%
Current E+P
Use 6%

What’s Next?What’s Next?

MWS Next StepsMWS Next Steps
Complete cleaning and scanning data into Complete cleaning and scanning data into database.database.
Complete analysis of first saliva studyComplete analysis of first saliva study Embark on second ‘spit study’!Embark on second ‘spit study’! Conduct analyses on key research Conduct analyses on key research
questions.questions. Track Hormone Therapy use - ‘re-starting’, Track Hormone Therapy use - ‘re-starting’,
replacement regimens, - Are emerging replacement regimens, - Are emerging CAMS safe? CAMS safe?

Selected Risk Factors in Women 50-80 in Selected Risk Factors in Women 50-80 in DRAFTDRAFT Marin n=5438 Marin n=5438 DRAFTDRAFT
CASESCASES Non-CasesNon-Cases SignificanceSignificance
Age at first birthAge at first birth 27.427.4 27.527.5 No DifferenceNo Difference
MenarcheMenarche 12.712.7 12.712.7 No DifferenceNo Difference
Number of ChildrenNumber of Children 1.71.7 1.61.6 SIGSIG
Months BreastfedMonths Breastfed 8.48.4 9.09.0 No DifferenceNo Difference
Former SmokerFormer Smoker 56.1%56.1% 45.9%45.9% SIGSIG
Ashkenazi Jewish Ashkenazi Jewish HeritageHeritage
13.6%13.6% 11.1%11.1% No DifferenceNo Difference
HRT Combination HRT Combination Therapy (current use)Therapy (current use)
No Obs for age No Obs for age groupgroup
Alcohol in High SchoolAlcohol in High School 29.4%29.4% 25.1%25.1% No DifferenceNo Difference

Cancer RootCancer Root
FlowerFlower
Growth similar to Growth similar to cancer in humanscancer in humans
To remind us that the To remind us that the cure is in the earth.cure is in the earth.
CONTACT INFOCONTACT INFO Web Site:Web Site:
www.mwstudy.orgwww.mwstudy.org marinwomensstudy.orgmarinwomensstudy.org
Contact Epidemiology Program for materials or Contact Epidemiology Program for materials or information: 507-4077information: 507-4077
Rochelle Ereman, Study Director 499-3056Rochelle Ereman, Study Director 499-3056
Kathy Koblick, Outreach and Campaign 507-2578Kathy Koblick, Outreach and Campaign 507-2578
Mark Powell, MD, MPH, Biospecimen 499-6969Mark Powell, MD, MPH, Biospecimen 499-6969

Percentage of Women with Percentage of Women with Hysterectomies, Hysterectomies, selected CA countiesselected CA counties
San Francisco, Santa San Francisco, Santa Cruz and Marin –Cruz and Marin –counties with lowest counties with lowest hysterectomy rates. hysterectomy rates. (24.5-30.6%)(24.5-30.6%)
Kings, Madera and Kings, Madera and Kern counties – Kern counties – highest hysterectomy highest hysterectomy rates (55-62%) rates (55-62%)
Average 41.5% CAAverage 41.5% CA
Percentage of women with Hysterectomy, 2001 MARIN
Hysterectomy
Intact Uterus
Percentage of women with Hysterectomy, 2001 KINGS
Hysterectomy
Intact Uterus
31%
62%
NOT MORE WOMEN ON HRT: Current use of HRT 35% in 2001 CA, Marin