Embed Size (px)
Citation preview

The many paths to frameshifting: kinetic modellingand analysis of the effects of different elongationsteps on programmed –1 ribosomal frameshiftingPei-Yu Liao1,2, Yong Seok Choi2, Jonathan D. Dinman3 and Kelvin H. Lee2,*
1School of Chemical and Biomolecular Engineering, Cornell University, Ithaca, NY 14853, 2ChemicalEngineering Department and Delaware Biotechnology Institute, University of Delaware, Newark, DE 18711 and3Department of Cell Biology and Molecular Genetics, University of Maryland, College Park, MD 20742, USA
Received December 28, 2009; Revised August 8, 2010; Accepted August 10, 2010
ABSTRACT
Several important viruses including the human im-munodeficiency virus type 1 (HIV-1) and the SARS-associated Coronavirus (SARS-CoV) employprogrammed �1 ribosomal frameshifting (PRF) fortheir protein expression. Here, a kinetic frameworkis developed to describe �1 PRF. The model revealsthree kinetic pathways to �1 PRF that yield twopossible frameshift products: those incorporatingzero frame encoded A-site tRNAs in the recodingsite, and products incorporating �1 frame encodedA-site tRNAs. Using known kinetic rate constants,the individual contributions of different steps ofthe translation elongation cycle to �1 PRF and theratio between two types of frameshift products wereevaluated. A dual fluorescence reporter wasemployed in Escherichia coli to empirically test themodel. Additionally, the study applied a novel massspectrometry approach to quantify the ratios of thetwo frameshift products. A more detailed under-standing of the mechanisms underlying �1 PRFmay provide insight into developing antiviraltherapeutics.
INTRODUCTION
Programmed ribosomal frameshifting (PRF) is a processwhere specific signals in the mRNA direct the ribosome toswitch reading frame at a certain efficiency. In �1 PRF,the ribosome slips 1 nt towards the 50-end of the mRNAduring translation. Several viruses, including human im-munodeficiency virus type 1 (HIV-1) and the coronavirusresponsible for severe acute respiratory syndrome(SARS-CoV), employ �1 PRF to synthesize precursorsof enzymes for their replication (1,2), and the ratio of
the zero frame to �1 frame encoded products is importantto the vitality of viruses (3–5). As such, altering �1 PRFefficiency may damage viral replication [reviewed in (6)].This suggests �1 PRF as a target for the development ofantiviral therapeutics.
Programmed �1 ribosomal frameshifting signalsusually contain three essential mRNA elements: (i) a‘slippery’ heptanucleotide sequence X XXY YYZ (X canbe any three identical nucleotides, Y is A or U and Z isnot G in eukaryotes; spaces denote the initial readingframe), where the ribosome changes the reading frame(3,7); (ii) a downstream stimulatory mRNA secondarystructure, typically a pseudoknot (8–10); and (iii) aspacer between the slippery sequence and the stimulatorysignal. It has been suggested that the stimulatory struc-tural element promotes �1 PRF by positioning theribosome to pause over the slippery sequence (11–13).The length of the spacer has also been shown to affectframeshift efficiency (7,9,14).
As PRF occurs during translation elongation, models of�1 PRF should be described within this context. Theelongation cycle can be divided into four stages. First,the ribosome selects the cognate aminoacyl-tRNA(aa-tRNA) according to the codon at the decodingcenter (decoding, DC in Figure 1). Second, the aa-tRNAmoves from A/T entry state into the A/A state to beaccommodated into the ribosome (aa-tRNA accommoda-tion, AA in Figure 1). Third, the ribosome catalysespeptidyltransfer, resulting in a peptidyl tRNA in theA-site and a deacylated tRNA in the P site(peptidyltransfer, PT in Figure 1). Fourth, the peptidyl-tRNA moves from the A-site to the P-site, carrying themRNA along, and the deacylated tRNA moves out of theP-site into the E-site from where it dissociates (transloca-tion, TL in Figure 1). Translocation opens up the riboso-mal A-site and the ribosome moves on to another roundof aa-tRNA selection.
*To whom correspondence should be addressed. Tel: +1 302 831 0344; Fax: +1 302 831 4841; Email: [email protected]
300–312 Nucleic Acids Research, 2011, Vol. 39, No. 1 Published online 7 September 2010doi:10.1093/nar/gkq761
� The Author(s) 2010. Published by Oxford University Press.This is an Open Access article distributed under the terms of the Creative Commons Attribution Non-Commercial License (http://creativecommons.org/licenses/by-nc/2.5), which permits unrestricted non-commercial use, distribution, and reproduction in any medium, provided the original work is properly cited.
Downloaded from https://academic.oup.com/nar/article-abstract/39/1/300/2409487by gueston 12 April 2018

Three major models have been proposed for the mech-anism of �1 PRF (Figure 1). One hypothesis proposesthat �1 PRF takes place during accommodation of theaa-tRNA (8,15,16). We have denoted this Pathway II. Thesimultaneous-slippage model (8) originally suggested thatpeptidyl- and aa-tRNAs simultaneously slip by one basein the 50-direction to base pair with the �1 frame codonsin the slippery site. In a refinement of this model (15), �1PRF was posited to occur when aa-tRNA andpeptidyl-tRNA are located in the A/T entry and P/Psite. The 9-A model of �1 PRF (16) built upon boththis and newly available structural data to propose thatthe �9-A movement of the anticodon loop in the50-direction during aa-tRNA accommodation is con-strained by the presence of the downstream stimulatoryRNA structural element. This creates tension on themRNA between the decoding center and the stimulatoryelement that can be relieved by decoupling of the A- andP-site tRNAs from the mRNA followed by subsequentslippage of the mRNA by one base in the 30-directionrelative to the tRNAs, resulting in a net slip readingframe by �1 base. Consistent with this model, mutationsaltering aa-tRNA accommodation were found to affect�1 PRF (18–20). However, the simultaneousslippage-based models do not explain the role of sequencesupstream of the slippery site, which have also been shown
to affect the �1 PRF efficiency (21,22). A second generalhypothesis proposes that �1 PRF occurs during trans-location. This can be modeled through two discretekinetic pathways. The first suggested that afterpeptidyltransfer, the two tRNAs move to P/E and A/Pstates, followed by an incomplete, two-base translocationevent promoted by the downstream mRNA stimulatorystructure (23). During this incomplete translocationevent, the tRNAs dissociate from the mRNA andre-pair with the �1 frame codons in the slippery site.We call this Pathway III. In support of this model,cryoelectron microscopy imaging revealed that a �1PRF stimulating pseudoknot can interact with theribosome to block the mRNA entrance channel,compromising the translocation process during �1 PRF(24). The second co-translocational model proposed thatincomplete translocation occurs one elongation cycle priorto the model by Weiss et al. (23), and that tRNAs in theribosomal E-, P- and A-sites are all involved in the process(22). This model suggests that incomplete translocationpromotes formation of a transition intermediate, andthat entry of the new aa-tRNA into the ribosome andthe tendency of tRNAs to revert to stable states drivesthe shift in reading frame. This is Pathway I. This modelis supported by the demonstration that mutations alteringE-site tRNA binding affect �1 PRF (22). However,
Figure 1. A mechanistic model of –1 programmed ribosomal frameshifting. Two translation elongation cycles are depicted at the top: the ribosomeundergoes decoding (DC), aa-tRNA accommodation (AA), peptidyltransfer (PT) and translocation (TL) twice to add two amino acids into thepolypeptide sequences. A shift in reading frame may occur at the first TL step and the ribosome decodes a �1 frame A-site codon at the recodingsite. Additionally, �1 PRF may occur during the second AA step, in which the ribosome has decoded the zero frame A-site codon. Incorporation ofthe �1 reading frame aa-tRNA starts at the following cycle. Moreover, the shift in reading frame may occur at the second TL step and incorporationof the �1 reading frame aa-tRNA starts at the following cycle.
Nucleic Acids Research, 2011, Vol. 39, No. 1 301
Downloaded from https://academic.oup.com/nar/article-abstract/39/1/300/2409487by gueston 12 April 2018

neither of the co-translocation models explain thepresence of two species of frameshift proteins producedby HIV-1 frameshifting (see next paragraph).Protein sequencing was originally employed to generate
the simultaneous slippage model, and to confirm that the�1 PRF site for HIV-1 is U UUUUUA located within the gag/pol overlap (where the P-site of the ribosome during frame-shifting is underlined) (1). Interestingly, �70% of theframeshift products contained Phe-Leu (derived fromdecoding the 0-frame UUU UUA sequence), while �30% ofthe products contained Phe–Phe (derived from decodingthe �1 frame UUU UUU sequence) at the frameshift site(1,25). Previous studies suggested that the product withPhe–Phe at the frameshift site could result from slippageof the P-site tRNA alone (1,25,26), i.e. the product pre-dicted by Pathway I, and that the �1 frame aa-tRNA issubsequently recruited to the ribosome. However, theprecise mechanism driving this process remained unclear,and no model has been proposed to date explaining thesimultaneous formation of different frameshift proteins.Here, we have developed a kinetic model of �1 PRF toexplain all of the experimental observations. This modelreveals the major steps in the translation elongation cyclethat affect �1 PRF, and reconciles all three models of �1PRF. In addition,�1 PRF efficiency was monitored in vivousing a dual fluorescence reporter (27) and the compos-itions of different frameshift proteins were analysed bymass spectrometry. The experimental approach was alsoapplied to study Human T-cell leukemia virus type 1(HTLV) pro-pol frameshift sequence. This is the firststudy to demonstrate and quantify the ratio of frameshiftproducts incorporating �1 frame A-site tRNA at this �1PRF sequence. In agreement with the model predictions,experimental perturbation of different translation stepsresulted in different levels of �1 PRF efficiency as well asin the relative ratios of two types of frameshift proteins.Our findings demonstrate that all three kinetic pathwaysare operative during �1 PRF.
Kinetic model
In our earlier study, a kinetic model successfully describedthe effects of ribosome E-, P- and A-site interactions on+1 PRF (27). A similar approach can be applied to under-stand the mechanism of �1 PRF. The mechanistic modelin the present study proposes that �1 PRF can occurduring translocation and/or aa-tRNA accommodation.Figure 1 describes the overall framework using abc deXXXY YYZ fgh sequence as an example, where spacesseparate zero frame codons and the slippery sequence isunderlined. When �1 PRF occurs during translocation,the presence of the downstream stimulatory structureforces the ribosome to translocate by two, rather thanthree, bases toward the 30-end of the mRNA, thusshifting the reading frame. If this ‘incomplete’ transloca-tion occurs to the pre-translocational ribosome aligningwith deX XXY, translation of the �1 frame begins atYYY. Alternatively, if incomplete translocation occurs tothe pre-translocational ribosome aligning with XXY YYZ,translation of the �1 frame starts at Zfg. When �1 PRFoccurs during aa-tRNA accommodation, the two tRNAs
interacting with XXY YYZ slip to base pair with XXX YYY.Consequently, translation of �1 frame starts at Zfg(Figure 1).
An elegant series of biochemical analyses have estab-lished detailed kinetic models of translocation (28) andaa-tRNA selection (29). Translocation involves EF-Gbinding to the pre-translocational ribosome, GTP hydroly-sis, unlocking conformation change, Pi release, tRNAmovement, relocking conformation change and dissoci-ation of EF-G from the post-translocational ribosome.This concept is illustrated along the top of Figure 2 fromcomponent PA (pre-translocational ribosome) to E0P0
(post-translocational ribosome). Detailed descriptions foreach rate constant are shown in Supplementary Table S1.Selection and accommodation of aa-tRNA involves initialbinding of the ternary complex EF-Tu:aa-tRNA:GTP,codon recognition, EF-Tu GTPase activation, GTPhydrolysis, dissociation of EF-Tu from the ribosome andaccommodation of the acceptor end of the aa-tRNA intothe A-site or the rejection of the aa-tRNA by proofreading.Detailed descriptions for each rate constant are shown inSupplementary Table S2. In the absence of frameshifting,progression through these steps of the elongation cycleresults in synthesis of the non-frameshift protein, calledNFS (Figure 2).
Our kinetic model suggests three possible reactionpathways that could generate �1 frameshift proteins(Figure 2). In Pathway I, blockage of the mRNA channelentrance by the downstream stimulatory structure inducesincomplete translocation with the pre-translocationalribosome positioned at deX XXY. Specifically, the readingframe shift occurs between the tRNA movement and Pirelease (rate constant rTL0), and the relocking step (rateconstant r45). Weiss et al. (23) suggested that when thetwo tRNAs move from P/E and A/P to the E/E and P/Pstates, they can un-pair from the mRNA and re-pair withthe �1 reading frame. In our model, rt represents the rateconstant for a ribosome:EF-G:GDP complex with twotRNAs in the E- and P-sites (E0P0
EFGgdp) to re-pair withthe�1 reading frame (E02P02
EFGgdp). This motion is revers-ible, as denoted by the r–t rate constant. This step isfollowed by a relocking conformational change andEF-G release from the ribosome complex. The resultingE0P0 or E02P02 (A-site unocupied) then moves on to theaa-tRNA selection step. Here, E0P0 is the post-translocational ribosome aligning with deX XXY (zeroframe) and E02P02 is the post-translocational ribosomealigning with cde XXX (–1 frame), where subscript 0means a zero frame tRNA pairing with the zero frame;subscript 02 means a zero frame tRNA pairing with the�1 frame. E0P0 may generate non-frameshift productNFS, or enter Pathway II or III described below. E02P02
can generate frameshift product FSm, which incorporatesthe �1 frame aa-tRNA in the recoding site (YYY). Inaddition, it is also possible for E02P02 to recruit a zeroframe aa-tRNA for YYZ (A0) and accommodate thisaa-tRNA into the �1 frame. In this case, frameshiftproduct FSz, which incorporates the zero frame aa-tRNAin the recoding site (YYZ), is produced (Pathway Ia).
In the second pathway, the downstream stimulatorystructure induces ribosome pausing and promotes
302 Nucleic Acids Research, 2011, Vol. 39, No. 1
Downloaded from https://academic.oup.com/nar/article-abstract/39/1/300/2409487by gueston 12 April 2018

�1 PRF during aa-tRNA accommodation. Pathway IIsuggests that simultaneous slippage of P- and A-sitetRNAs occurs during accommodation and/or beforepeptidyltransfer. In Figure 2, the process from P0A0 toP02A02 with the rate constant kpas2 describes the slippagein Pathway II. P02A02 then proceeds through peptidyl-transfer to generate FSz.
InPathway III, incomplete translocation occurswhen thepre-translocational ribosome is positioned at XXY YYZ.Consequently, translation of the �1 frame is one codondownstream of YYZ and the ribosome produces FSz. It is
important to note that while both Pathway I and III involveincomplete translocation, the Pathway I slip occurs oneelongation cycle before the Pathway III slippage event.
MATERIALS AND METHODS
Computation of the kinetic model
All pathways were mathematically described as systems ofordinary differential equations (Supplementary Data).Assuming steady state, the expressions of intermediate
Figure 2. The kinetic framework for programmed –1 ribosomal frameshifting. Top: the procedure from PA to E0P0 represents translocation, whichinvolves r1, r–1 (reversible EF-G binding), rTL0 (GTP hydrolysis, unlocking conformation change, tRNA movement and Pi release), and r45(re-locking conformation change and EF-G dissociation). The E0P0 complex then undergoes aa-tRNA selection: from E0P0 to P0A0. The selectionof aa-tRNA involves: k1, k–1 (reversible EF-Tu binding), k2, k–2 (reversible codon recognition), k345 (GTPase activation, GTP hydrolysis, EF-Tuconformation change and dissociation), and k6 (aa-tRNA rejection by proofreading), or k7 (aa-tRNA accommodation). The elongation cycle withouta –1 PRF event results in synthesis of non-frameshift proteins (NFS). Pathway I in green suggests that –1 PRF occurs during the relocking step inthe first translocation, leading to the formation of FSm. Pathway Ia indicates that the E02P02 complex may interact with a zero frame aa-tRNA andeventually produce FSz. Pathways II suggests that –1 PRF occurs during aa-tRNA selection and accommodation, resulting in FSz. Pathway IIIsuggests that –1 PRF occurs during the second translocation step, resulting in FSz production.
Nucleic Acids Research, 2011, Vol. 39, No. 1 303
Downloaded from https://academic.oup.com/nar/article-abstract/39/1/300/2409487by gueston 12 April 2018
concentrations in terms of initial reactant (PA) weresolved by Matlab v.R2008a (Mathworks Inc., Natick,MA, USA). By applying the empirically-determined rateconstants and assumed ranges of rate constants of incom-plete translocation, P- and A-site tRNA slippage(Supplementary Tables S1–S4), the amount ofnon-frameshift proteins NFS (p0a0
pt in the kineticmodel) and two types of frameshift proteins, FSm(P02A2
pt in the kinetic model) and FSz (P02A02pt and
p02a02pt in the kinetic model), were identified. The frame-
shift efficiency (FS%) in the model is defined as theamount of frameshift proteins divided by the amount oftotal proteins and multiplied by 100% [Equation (1)]. Thefraction of FSm is calculated as the amount of FSm dividedby the amount of total frameshift proteins and multipliedby 100% [Equation (2)].
FS% ¼ðFSm+FSzÞ
ðNFS+FSm+FSzÞ�100% ð1Þ
Fraction of FSmð%Þ ¼ðFSmÞ
ðFSm+FSzÞ�100% ð2Þ
Sensitivity analysis
A program was developed in Matlab v.R2008a to performan n-way analysis of variance (ANOVA). Each parameterin the model was varied over five levels: a base linevalue,±25% of the base line, a±50% of the base line.Randomly selected 10 000 parameter sets were used to cal-culate FS%. A higher F statistic indicates a larger impactof the parameter on FS%.
Plasmids and bacterial strains
Escherichia coli XL1 blue MRF0 (Stratagene, La Jolla,CA, USA) was used in all experimental studies. All con-structs were verified by DNA sequencing at the CornellBioresource Center. Construction of the dual fluorescencereporter was described earlier (27,30), except that differentlinker sequences were incorporated into the reporterplasmid (Table 1). These sequences are derived from theframeshift signal in HIV-1 group M subtype B (22) andthe pro-pol sequence in human T-cell leukemia virus type I(HTLV-1) (31). For the MB2 and TLV strains, the linkersequence was made from complementary oligonucleotides(Integrated DNA Technology, Coralville, IA, USA) andthen cloned into SalI and BamHI sites between the codingsequence of DsRed and EGFP in the reporter plasmid.For MB2UCC and MB2CCC strains, the nucleotidesequence of MB2 was mutated by site-directed
mutagenesis according to the manufacturer’s protocol(Qiagen, Valencia, CA, USA).
In vivo fluorescence assay
Cells with the appropriate plasmids were cultured in 1mlLuria-Bertani (LB) medium containing 100 mg/ml ampicil-lin with or without 0.75 mg/ml chloramphenicol in 24-wellplates for 24 h at 250 rpm and 37�C. Fluorescence wasmeasured using a plate reader (SpectraMax M5,Molecular Devices, Sunnyvale, CA, USA). Fluorescencemeasurements were performed as described earlier (27).Experimental frameshift efficiency (FS%exp) was obtainedas the ratio of green fluorescence to red fluorescence for thetest strains and normalized against the fluorescence ratio ofthe control strain. Statistical analyses were applied to alldata sets as described earlier (32). A total of 23–46 repli-cates for test strains and control strains were performed tosatisfy the minimum sample requirement for statisticalsignificance.
Protein purification and trypsin digestion
Test strains were grown in 100ml LB medium containing100 mg/ml ampicillin in 500ml flasks at 250 rpm and 37�C.After 24 h, 200 OD600 units of cells were collected by cen-trifugation at 4000g and 4�C for 20min. Cells were lysedand purified by Ni-NTA under native conditions accord-ing to the manufacturer’s protocol (Qiagen). Purifiedprotein samples were resolved by SDS–PAGE (10%w/vpolyacrylamide). Gel band excision and in-gel trypsindigestion were performed using a previously describedstandard method (33).
Mass spectrometry analysis
A representative flow chart of the mass spectrometryanalysis is shown in Supplementary Data (SupplementaryFigure S1). Trypsin-digested frameshift protein samplesresulted in target peptides spanning the recoding siteswith a single amino acid difference between FSz and FSm.These peptides were analysed by nano-flow liquid chroma-tography tandem mass spectrometry using multiplereaction monitoring (nLC-MRM/MS).
The digested sample was vacuum dried, reconstitutedwith 30 ml of 0.1% formic acid (FA), and a portion ofeach reconstituted sample was injected into Dionex 3000nLC system (Sunnyvale, CA, USA). First, the sample wasloaded onto an Acclaim PepMap 100 C18 trap column(300 mm� 5mm, 5 mm) and on-line desalting was carriedout with water (0.1% FA) at a flow rate of 30 ml/min for5min. Then, peptides trapped in the trap column were
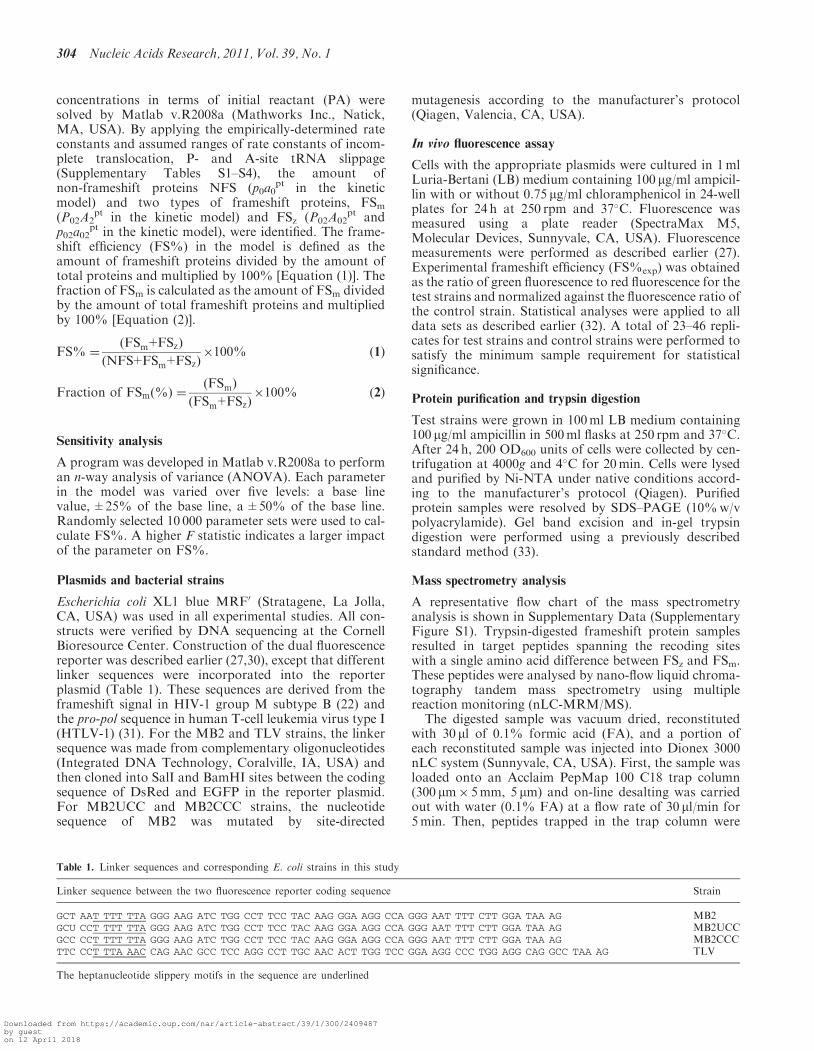
Table 1. Linker sequences and corresponding E. coli strains in this study
Linker sequence between the two fluorescence reporter coding sequence Strain
GCT AAT TTT TTA GGG AAG ATC TGG CCT TCC TAC AAG GGA AGG CCA GGG AAT TTT CTT GGA TAA AG MB2GCU CCT TTT TTA GGG AAG ATC TGG CCT TCC TAC AAG GGA AGG CCA GGG AAT TTT CTT GGA TAA AG MB2UCCGCC CCT TTT TTA GGG AAG ATC TGG CCT TCC TAC AAG GGA AGG CCA GGG AAT TTT CTT GGA TAA AG MB2CCCTTC CCT TTA AAC CAG AAC GCC TCC AGG CCT TGC AAC ACT TGG TCC GGA AGG CCC TGG AGG CAG GCC TAA AG TLV
The heptanucleotide slippery motifs in the sequence are underlined
304 Nucleic Acids Research, 2011, Vol. 39, No. 1
Downloaded from https://academic.oup.com/nar/article-abstract/39/1/300/2409487by gueston 12 April 2018
resolved on an Acclaim PepMap 100 C18 analyticalcolumn (75 mm� 15 cm, 3 mm) with a gradient of 2–50%acetonitrile with 0.1% FA over 75min. The eluent wasdirectly introduced into a 4000 QTRAP mass spectrom-eter through a Nanospray II source (Applied Biosystems,Foster City, CA, USA). For MRM, the MIDASWorkflow software (Applied Biosystems) generated a listof possible MRM transitions (Supplementary Table S5)before MS analysis. MS and MS/MS data obtainedthrough MRM were searched using Mascot (34) (v. 2.2,Matrix Science, Boston, MA, USA) within a customsequence database that included frameshift protein se-quences. During the database search, the spectral assign-ment of MS/MS was performed under parameters of MStolerance of 1.2Da, MS/MS tolerance of 0.6Da andP < 0.05 and search results were manually confirmed.Peak areas of MRM transitions were calculated usingAnalyst (v. 1.5, Applied Biosystems). Areas of peaks rep-resenting different charge states of a given peptide weresummed for their usage in calculating the fraction of FSm(%) [Equation (3)]. Samples were analysed in triplicates(except duplicates of CCC and TLV).
Fraction of FSm ð%Þ observed by MS
¼AFSm
AFSm+AFSz�100%
ð3Þ
where AFSm is the sum of peak areas at different chargestates for an FSm target peptide and AFSz is the same foran FSz target peptide in MS.
RESULTS
Mathematical model
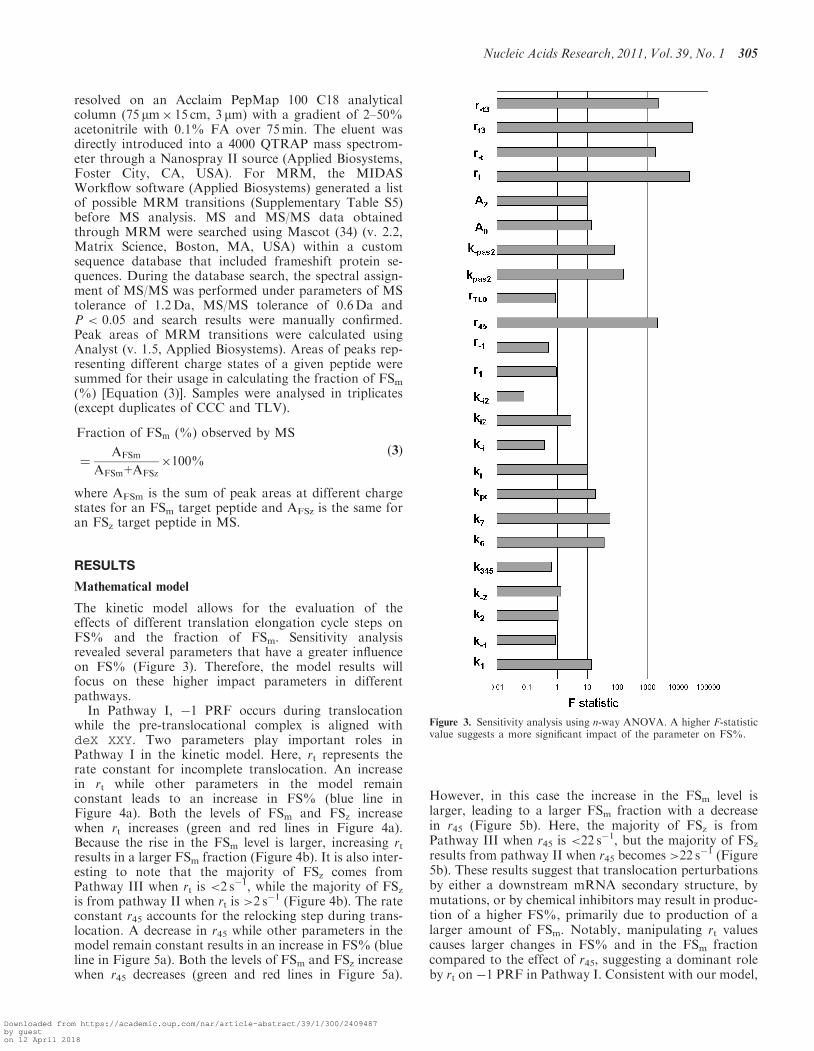
The kinetic model allows for the evaluation of theeffects of different translation elongation cycle steps onFS% and the fraction of FSm. Sensitivity analysisrevealed several parameters that have a greater influenceon FS% (Figure 3). Therefore, the model results willfocus on these higher impact parameters in differentpathways.
In Pathway I, �1 PRF occurs during translocationwhile the pre-translocational complex is aligned withdeX XXY. Two parameters play important roles inPathway I in the kinetic model. Here, rt represents therate constant for incomplete translocation. An increasein rt while other parameters in the model remainconstant leads to an increase in FS% (blue line inFigure 4a). Both the levels of FSm and FSz increasewhen rt increases (green and red lines in Figure 4a).Because the rise in the FSm level is larger, increasing rtresults in a larger FSm fraction (Figure 4b). It is also inter-esting to note that the majority of FSz comes fromPathway III when rt is <2 s
�1, while the majority of FSzis from pathway II when rt is >2 s
�1 (Figure 4b). The rateconstant r45 accounts for the relocking step during trans-location. A decrease in r45 while other parameters in themodel remain constant results in an increase in FS% (blueline in Figure 5a). Both the levels of FSm and FSz increasewhen r45 decreases (green and red lines in Figure 5a).
However, in this case the increase in the FSm level islarger, leading to a larger FSm fraction with a decreasein r45 (Figure 5b). Here, the majority of FSz is fromPathway III when r45 is <22 s�1, but the majority of FSzresults from pathway II when r45 becomes >22 s�1 (Figure5b). These results suggest that translocation perturbationsby either a downstream mRNA secondary structure, bymutations, or by chemical inhibitors may result in produc-tion of a higher FS%, primarily due to production of alarger amount of FSm. Notably, manipulating rt valuescauses larger changes in FS% and in the FSm fractioncompared to the effect of r45, suggesting a dominant roleby rt on �1 PRF in Pathway I. Consistent with our model,
Figure 3. Sensitivity analysis using n-way ANOVA. A higher F-statisticvalue suggests a more significant impact of the parameter on FS%.
Nucleic Acids Research, 2011, Vol. 39, No. 1 305
Downloaded from https://academic.oup.com/nar/article-abstract/39/1/300/2409487by gueston 12 April 2018

experimental studies demonstrated that mutating theE-site codon in the recoding site, or the use of a transloca-tion inhibitor altered FS% (22).In Pathway II, �1 PRF occurs during aa-tRNA ac-
commodation and the slippage occurs beforepeptidyltransfer. Figure 6a shows that a higher kpas2results in a higher FS%. Interestingly, the larger FS%results from an increase in FSz while the level of FSmremains at a similar level (Figure 6a). Therefore, thefraction of FSm is predicted to decrease as kpas2 increases(Figure 6b). Here, the majority of FSz is generated fromPathway III when kpas2 is <3 s�1, while the majority ofFSz is produced from pathway II when kpas2 is >3 s�1
(Figure 6b).In Pathway III, �1 PRF occurs during translocation
while the pre-translocational complex is aligned withXXY YYZ. The rate constant for the incomplete transloca-tion step is demonstrated by rt3. Figure 7a shows that a
higher rt3 promotes increased FS%. Interestingly, thelarger FS% results from an increase in FSz while thelevel of FSm remains relatively constant (Figure 7a).Therefore, the fraction of FSm is predicted to decreaseas rt3 increases (Figure 7b). In this case, the majority ofFSz is generated from Pathway II when rt3 is <1 s�1, butthe majority of FSz comes from pathway III when rt3 is>1 s�1 (Figure 7b).
In the model, kpt represents the rate constant forpeptidyltransfer, the last step in all three pathways. Themodel predicts that a decrease in kpt would result in ahigher FS% due to increased production of FSz, whileFSm synthesis remains relatively constant (Figure 8a).Consequently, a smaller fraction of FSm is observed askpt decreases (Figure 8b). In this scheme, the majority ofFSz is synthesized from Pathway II when kpt is <15 s
�1,while the majority of FSz comes from pathway III whenkpt is >15 s
�1 (Figure 8b). The model results are consistent
Figure 4. The effect of incomplete translocation during the first elong-ation cycle (represented by rt) on –1 PRF. All other parameters areassumed to be constant. (a) The effect of rt on frameshift efficiency(FS%, blue line), frameshift protein incorporating a –1 frame aa-tRNAat the recoding site (FSm, green line), and frameshift proteinincorporating a zero frame aa-tRNA at the recoding site (FSz, redline). (b) The effect of rt on the fraction of FSm and FSz.
Figure 5. The effect of the relocking step during translocation (repre-sented by r45) on –1 PRF. All the other parameters are assumed to beconstant. (a) The effect of r45 on the level of frameshift efficiency(FS%, blue line), frameshift protein incorporating a –1 frameaa-tRNA at the recoding site (FSm, green line), and frameshiftprotein incorporating a zero frame aa-tRNA at the recoding site(FSz, red line). (b) The effect of r45 on the fraction of FSm and FSz.
306 Nucleic Acids Research, 2011, Vol. 39, No. 1
Downloaded from https://academic.oup.com/nar/article-abstract/39/1/300/2409487by gueston 12 April 2018

with previous experimental observations that peptidyl-transferase inhibitors affect FS% (35).
Experimental results
To examine the model predictions, �1 PRF efficiency wasmonitored in vivo using a dual fluorescence reportersystem. In addition, compositions of the frameshiftprotein products were analysed by mass spectrometry.Analysis of the frameshift products revealed that theratio of FSz to FSm was �4:1 in MB2 cells (Figure 9),thus indicating that the vast majority of �1 PRF eventsnaturally occur through Pathways II and/or III. Themodel predicts that a smaller kpt should cause higherFS% and a lower fraction of FSm (Figure 8). A priorstudy using yeast demonstrated that inhibition ofpeptidyltransfer promoted increased rates of �1 PRF,but did not differentiate between FSm and FSzproducts (36). The model predicts that addition of
chloramphenicol, a potent peptidyltransferase inhibitorin bacteria (37), should promote increased FS%.Consistent with the model, a 2.1-fold increase in FS%exp
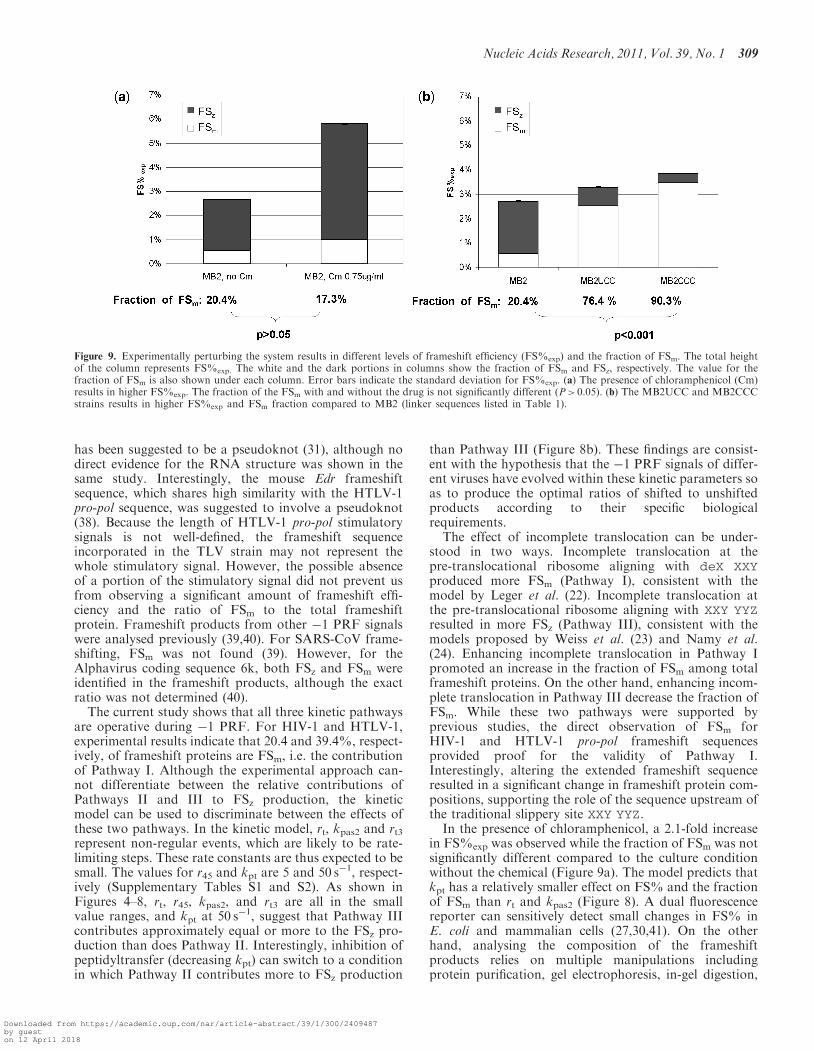
was observed in the E. coli culture containing 0.75mg/mlchloramphenicol compared to the culture without thedrug. The fractions of FSm for the culture with andwithout chloramphenicol were 17.3 and 20.4%, respective-ly (Figure 9a). Although a slight decrease in the fraction ofFSm was observed in the presence of the drug, the differ-ence was not statistically significant (P > 0.05).The frameshift sequence for HIV-1 is U AAU UUU UUA,
where a space separates each zero frame codon and theP-site of the recoding site is underlined. The E-sitetRNAGUU
Asn may form one canonical base pairing withthe �1 frame UAA. In the MB2UCC strain, the sequencewas mutated to U CCU UUU UUA (mutations shown inbold) where the E-site tRNAGGG
Pro can potentially formone G:U and two C:G interactions. In the MB2CCCstrain, the sequence was mutated to C CCU UUU UUA
Figure 6. The effect of the slippage of P- and A-site tRNAs beforepeptidyltransfer (represented by kpas2) on –1 PRF. All the other par-ameters are assumed to be constant. (a) The effect of kpas2 on the levelof frameshift efficiency (FS%, blue line), frameshift proteinincorporating a –1 frame aa-tRNA at the recoding site (FSm, greenline), and frameshift protein incorporating a zero frame aa-tRNA atthe recoding site (FSz, red line). (b) The effect of kpas2 on the fraction ofFSm and FSz.
Figure 7. The effect of incomplete translocation during the secondelongation cycle (represented by rt3) on –1 PRF. (a) The effect of rt3on the level of frameshift efficiency (FS%, blue line), frameshift proteinincorporating a –1 frame aa-tRNA at the recoding site (FSm, greenline), and frameshift protein incorporating a zero frame aa-tRNA atthe recoding site (FSz, red line). (b) The effect of rt3 on the fraction ofFSm and FSz.
Nucleic Acids Research, 2011, Vol. 39, No. 1 307
Downloaded from https://academic.oup.com/nar/article-abstract/39/1/300/2409487by gueston 12 April 2018

(mutations shown in bold) where the E-site tRNAGGGPro
can form three canonical base pairings with the �1 frameCCC. Because Pathway I requires that the E- and P-sitetRNAs interact with the �1 frame, UCC and CCC as the�1 frame E-site codons may enhance this reaction, i.e.these codons would promote an increase in rt. Themodel predicts that a larger rt should result in a higherFS% due to increased production of FSm. Consistently,1.2- and 1.4-fold increase in FS%exp are observed for theMB2UCC and MB2CCC strains compared to the MB2strain, respectively (Figure 9b). In the MB2UCC strain,76.4% of the frameshift products were FSm, and in theMB2CCC strain, 90.3% of the frameshift products wereFSm. These results suggest that changing the sequence tofavor incomplete translocation, i.e. to favor Pathway I,can dramatically alter the composition of the frameshiftproduct.To further our understanding of two types of frameshift
proteins, the HTLV-1 pro-pol frameshift sequence was
cloned into the reporter system. The extended frameshiftsequence for HTLV-1 pro-pol is C CCU UUA AAC (wherespaces separate zero frame codons and the slipperysequence is underlined). Similar to MB2CCC, the E-sitetRNAGGG
Pro can potentially form three canonical basepairings with the �1 frame CCC, which may create a fa-vorable condition for Pathway I. Consequently, a signifi-cant amount of FSm among total frameshift proteins canbe produced. Consistent with the model, the frameshiftefficiency for HTLV-1 was 4.81% and the fraction ofFSm was 39.4%.
DISCUSSION
In this study, a mathematical framework was developedfor �1 PRF. To our knowledge, this is the first kineticmodel to explain the production of two types of �1 frame-shift proteins through three distinct kinetic pathways.Using deX XXY YYZ fgh as an example, Pathway Ipredicts that a pre-translocational ribosome aligningwith deX XXY may shift reading frame during incompletetranslocation, producing the frameshift product (FSm)incorporating a �1 frame aa-tRNA in the frameshift site(codon YYY). Additionally, Pathway II predicts that aribosome can change reading frame due to simultaneousslippage of P- and A-site tRNAs for a ribosome aligningwith XXY YYZ, generating a frameshift product (FSz)incorporating the zero frame aa-tRNA in the frameshiftsite (codon YYZ). Lastly, in Pathway III, a pre-translocational ribosome aligning with XXY YYZ mayalso undergo incomplete translocation to generate FSz.
The kinetic model suggests that incomplete transloca-tion of the pre-translocational ribosome aligning with deXXXY produces FSm. Previous studies suggested that FSmmay result from slippage of a single P-site tRNA (1,25,26).However, it is not clear when and/or how this could occur.In addition, the single slippage model does not explainexperimental evidence regarding the influence of trans-location on �1 PRF (22,23). Our model suggests that inboth mechanisms, incomplete translocation and slippageof P- and A-site tRNAs participate in synthesizing frame-shift proteins to varying extents for different �1 PRFsignals. Frameshifting at the HIV-1 sequence wasreported to generate �70% FSz and 30% FSm (1,25),indicating that Pathways II and/or III exert stronger in-fluence on FS% than Pathway I. Notably, our proteinanalysis showed �80% FSz and 20% FSm for the frame-shifting signal in HIV-1 group M subtype B. This smalldiscrepancy may due to the use of different reportersystems, or differences in the quantitative methodsemployed for the assay. For the HTLV-1 pro-pol frame-shift sequence, this study observed 39.4% FSm in totalframeshift protein. This is the first study to demonstrateanother frameshift sequence that generates a significantamount of FSm in addition to HIV-1. Interestingly, asmall but observable lysine peak appeared at the corres-ponding position (–1 frame A-site codon in the recodingsite) when HTLV-1 pro-pol frameshift proteins weresequenced in the previous study (31), supporting the pro-duction of FSm. The stimulatory RNA of HTLV-1 pro-pol
Figure 8. The effect of the peptidyltransfer (represented by kpt) on –1PRF. All the other parameters are assumed to be constant. (a) Theeffect of kpt on the level of frameshift efficiency (FS%, blue line),frameshift protein incorporating a –1 frame aa-tRNA at the recodingsite (FSm, green line), and frameshift protein incorporating a zero frameaa-tRNA at the recoding site (FSz, red line). (b) The effect of kpt on thefraction of FSm and FSz.
308 Nucleic Acids Research, 2011, Vol. 39, No. 1
Downloaded from https://academic.oup.com/nar/article-abstract/39/1/300/2409487by gueston 12 April 2018
has been suggested to be a pseudoknot (31), although nodirect evidence for the RNA structure was shown in thesame study. Interestingly, the mouse Edr frameshiftsequence, which shares high similarity with the HTLV-1pro-pol sequence, was suggested to involve a pseudoknot(38). Because the length of HTLV-1 pro-pol stimulatorysignals is not well-defined, the frameshift sequenceincorporated in the TLV strain may not represent thewhole stimulatory signal. However, the possible absenceof a portion of the stimulatory signal did not prevent usfrom observing a significant amount of frameshift effi-ciency and the ratio of FSm to the total frameshiftprotein. Frameshift products from other �1 PRF signalswere analysed previously (39,40). For SARS-CoV frame-shifting, FSm was not found (39). However, for theAlphavirus coding sequence 6k, both FSz and FSm wereidentified in the frameshift products, although the exactratio was not determined (40).
The current study shows that all three kinetic pathwaysare operative during �1 PRF. For HIV-1 and HTLV-1,experimental results indicate that 20.4 and 39.4%, respect-ively, of frameshift proteins are FSm, i.e. the contributionof Pathway I. Although the experimental approach can-not differentiate between the relative contributions ofPathways II and III to FSz production, the kineticmodel can be used to discriminate between the effects ofthese two pathways. In the kinetic model, rt, kpas2 and rt3represent non-regular events, which are likely to be rate-limiting steps. These rate constants are thus expected to besmall. The values for r45 and kpt are 5 and 50 s�1, respect-ively (Supplementary Tables S1 and S2). As shown inFigures 4–8, rt, r45, kpas2, and rt3 are all in the smallvalue ranges, and kpt at 50 s
�1, suggest that Pathway IIIcontributes approximately equal or more to the FSz pro-duction than does Pathway II. Interestingly, inhibition ofpeptidyltransfer (decreasing kpt) can switch to a conditionin which Pathway II contributes more to FSz production
than Pathway III (Figure 8b). These findings are consist-ent with the hypothesis that the �1 PRF signals of differ-ent viruses have evolved within these kinetic parameters soas to produce the optimal ratios of shifted to unshiftedproducts according to their specific biologicalrequirements.The effect of incomplete translocation can be under-
stood in two ways. Incomplete translocation at thepre-translocational ribosome aligning with deX XXYproduced more FSm (Pathway I), consistent with themodel by Leger et al. (22). Incomplete translocation atthe pre-translocational ribosome aligning with XXY YYZresulted in more FSz (Pathway III), consistent with themodels proposed by Weiss et al. (23) and Namy et al.(24). Enhancing incomplete translocation in Pathway Ipromoted an increase in the fraction of FSm among totalframeshift proteins. On the other hand, enhancing incom-plete translocation in Pathway III decrease the fraction ofFSm. While these two pathways were supported byprevious studies, the direct observation of FSm forHIV-1 and HTLV-1 pro-pol frameshift sequencesprovided proof for the validity of Pathway I.Interestingly, altering the extended frameshift sequenceresulted in a significant change in frameshift protein com-positions, supporting the role of the sequence upstream ofthe traditional slippery site XXY YYZ.In the presence of chloramphenicol, a 2.1-fold increase
in FS%exp was observed while the fraction of FSm was notsignificantly different compared to the culture conditionwithout the chemical (Figure 9a). The model predicts thatkpt has a relatively smaller effect on FS% and the fractionof FSm than rt and kpas2 (Figure 8). A dual fluorescencereporter can sensitively detect small changes in FS% inE. coli and mammalian cells (27,30,41). On the otherhand, analysing the composition of the frameshiftproducts relies on multiple manipulations includingprotein purification, gel electrophoresis, in-gel digestion,
Figure 9. Experimentally perturbing the system results in different levels of frameshift efficiency (FS%exp) and the fraction of FSm. The total heightof the column represents FS%exp. The white and the dark portions in columns show the fraction of FSm and FSz, respectively. The value for thefraction of FSm is also shown under each column. Error bars indicate the standard deviation for FS%exp. (a) The presence of chloramphenicol (Cm)results in higher FS%exp. The fraction of the FSm with and without the drug is not significantly different (P> 0.05). (b) The MB2UCC and MB2CCCstrains results in higher FS%exp and FSm fraction compared to MB2 (linker sequences listed in Table 1).
Nucleic Acids Research, 2011, Vol. 39, No. 1 309
Downloaded from https://academic.oup.com/nar/article-abstract/39/1/300/2409487by gueston 12 April 2018
liquid chromatography and mass spectrometry. The multi-stage preparation may thus affect sample yields,complicating the detection of small changes in proteincomposition.A significant increase in the fraction of FSm was
observed in both MB2UCC and MB2CCC strains(Figure 9b). Mutation of the �1 frame E-site sequenceto UCC and CCC in the HIV-1 frameshift site mayenhance incomplete translocation in Pathway I byallowing more interactions between E-site tRNA and the�1 frame. This result is consistent with the model thatdifferent mechanisms exist and participate in makingframeshift proteins to different extents. The creation ofa favorable condition for one pathway can affect thecomposition of frameshift proteins significantly. To date,no mutations affecting the composition of frameshiftproteins have been reported in the literature. Notably,our experimental results show that in one case, FS% in-creases significantly without a change in the compositionof frameshift products (Figure 9a), while in anothercondition FS% increases a smaller amount but the
composition of frameshift products change dramatically(Figure 9b).
Several parameters in the kinetic model, such as rt, r–t,kpas2, k–pas2, rt3 and r–t3, have not been measured experi-mentally in the literature. The test ranges for these par-ameters are based on our current kinetic understandingof translation elongation. The rate constants for trans-location and aa-tRNA selection range from 0.47 to1980 s�1 (Supplementary Tables S1–S4). The averageprotein synthesis rate is 10–20 s�1 in prokaryotic cellsbut some codons are translated at a rate <10 s�1 (42).Therefore, a broad range (1–100 s�1), within the scope ofthe known elongation rate constants, was tested tounderstand the impact each of these unknown param-eters on �1 frameshifting (Figures 4, 6 and 7).Notably, these figures do not show the impact of theseparameters >100 s�1 because the curves level off for theparameters at this range.
Although the investigation of whether the slippage ofthe two tRNAs is a simultaneous or a sequential process isbeyond the scope of this study, a similar kinetic approach
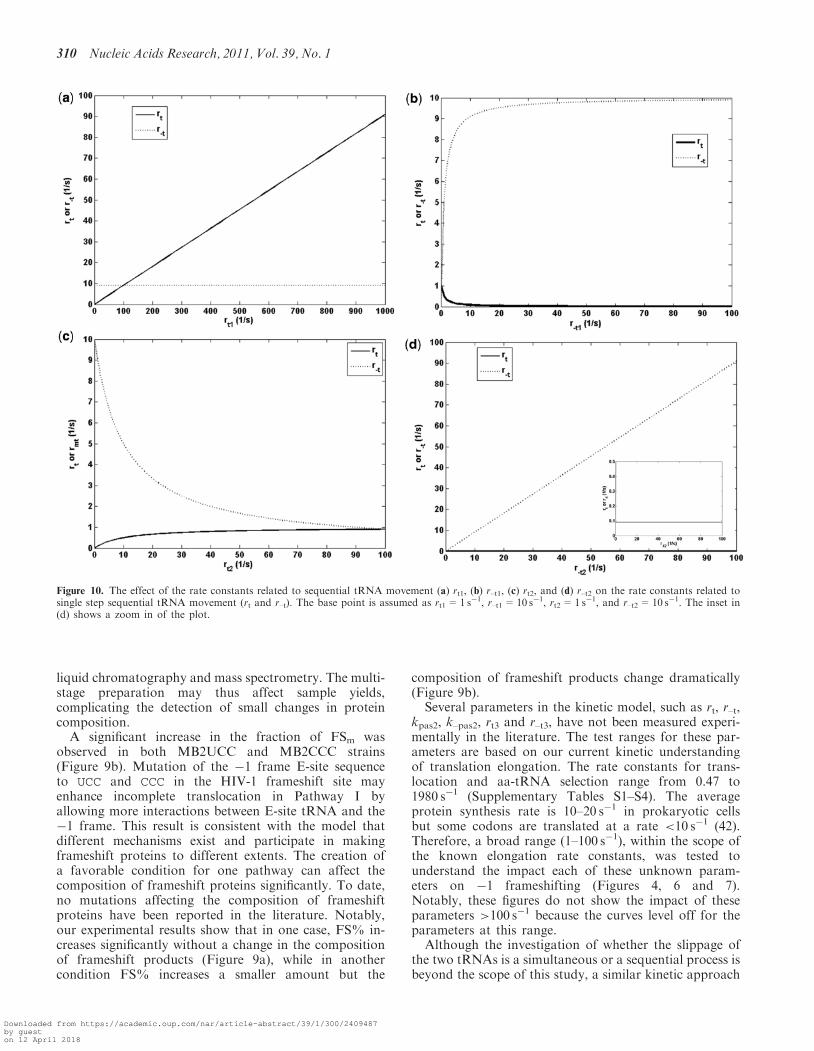
Figure 10. The effect of the rate constants related to sequential tRNA movement (a) rt1, (b) r–t1, (c) rt2, and (d) r–t2 on the rate constants related tosingle step sequential tRNA movement (rt and r–t). The base point is assumed as rt1=1 s�1, r–t1=10 s�1, rt2=1 s�1, and r–t2=10 s�1. The inset in(d) shows a zoom in of the plot.
310 Nucleic Acids Research, 2011, Vol. 39, No. 1
Downloaded from https://academic.oup.com/nar/article-abstract/39/1/300/2409487by gueston 12 April 2018
can be used to understand the effect of sequential tRNAmovement on the overall process. Using the movement ofE- and P-site tRNAs as an example, the overall movementand the sequential movement can be described as thefollowing:
One step tRNA movement (Rx.1)
E0PEFGgdt0 !
rt
r�t
E02 PEFGgdt02
Sequential tRNA movement (Rx.2)
E0PEFGgdt0 !
rt1
r�t1
E02PEFGgdt0 !
rt2
r�t2
E02PEFGgdt02
Assuming steady state, rt and r–t can be represented by rt1,r–t1, rt2 and r–t2 (Supplementary Data). Figure 10 showshow a change in the rate constants in Rx.2 can affect theoverall rate constants in Rx.1. The result suggests thatrepositioning of the E-site tRNA to the �1 frame (repre-sented by rt1) may have a larger impact than repositioningof the P-site tRNA (represented by rt2) on the slippagetoward the �1 frame (represented by rt). On the otherhand, repositioning the P-site tRNA back to zero frame(represented by r–t2) may have larger impact than repos-itioning the E-site tRNA (represented by r–t1) on theslippage toward the zero frame (represented by r–t).Similarly, the same observation also applies to themovement for P- and A-site tRNAs (kpas2, and k–pas2) inthe model.
CONCLUSION
A mathematical framework developed upon the transla-tion elongation cycle revealed three distinct kineticpathways for �1 PRF. The model describes how al-terations of these kinetic parameters can affect not onlychanges in frameshift efficiency, but also changes in thecomposition of frameshift products under different condi-tions. In addition, the model identifies the dominant par-ameters, representing steps in the translation elongationcycle, on �1 PRF. Experimentally targeting these stepsresulted in different levels of frameshifting efficiency, con-sistent with model predictions. A mutation in the �1frame E-site sequence was shown to dramatically changethe composition of frameshift products, suggesting an im-portant role for the sequence upstream of the slippery site.Our results suggest that not only the frameshift efficiency,but also the compositions of the frameshift products, areworth investigating to advance our knowledge of �1 PRF.
SUPPLEMENTARY DATA
Supplementary Data are available at NAR Online.
ACKNOWLEDGEMENTS
The authors acknowledge Abhinav Rabindra Jain forassistance in the laboratory.
FUNDING
University of Delaware (to K.H.L.); National Institutesof Health (R01 GM058859 to J.D.D.). Funding foropen access charge: University of Delaware Internalfunds.
Conflict of interest statement. None declared.
REFERENCES
1. Jacks,T., Power,M.D., Masiarz,F.R., Luciw,P.A., Barr,P.J. andVarmus,H.E. (1988) Characterization of ribosomal frameshiftingin HIV-1 gag-pol expression. Nature, 331, 280–283.
2. Thiel,V., Ivanov,K.A., Putics,A., Hertzig,T., Schelle,B., Bayer,S.,Weissbrich,B., Snijder,E.J., Rabenau,H., Doerr,H.W. et al. (2003)Mechanisms and enzymes involved in SARS coronavirus genomeexpression. J. Gen. Virol., 84, 2305–2315.
3. Biswas,P., Jiang,X., Pacchia,A.L., Dougherty,J.P. and Peltz,S.W.(2004) The human immunodeficiency virus type 1 ribosomalframeshifting site is an invariant sequence determinant and animportant target for antiviral therapy. J. Virol., 78, 2082–2087.
4. Plant,E.P. and Dinman,J.D. (2008) The role of programmed-1ribosomal frameshifting in coronavirus propagation. Front.Biosci., 13, 4873–4881.
5. Plant,E.P., Rakauskaite,R., Taylor,D.R. and Dinman,J.D. (2010)Achieving a golden mean: Mechanisms by which coronavirusesensure synthesis of the correct stoichiometric ratios of viralproteins. J. Virol., 84, 4330–4340.
6. Dinman,J.D., Ruiz-Echevarria,M.J. and Peltz,S.W. (1998)Translating old drugs into new treatments: Ribosomalframeshifting as a target for antiviral agents. Trends Biotechnol.,16, 190–196.
7. Brierley,I., Jenner,A.J. and Inglis,S.C. (1992) Mutational analysisof the ‘‘slippery-sequence’’ component of a coronavirus ribosomalframeshifting signal. J. Mol. Biol., 227, 463–479.
8. Jacks,T., Madhani,H.D., Masiarz,F.R. and Varmus,H.E. (1988)Signals for ribosomal frameshifting in the rous sarcoma virusgag-pol region. Cell, 55, 447–458.
9. Brierley,I., Digard,P. and Inglis,S.C. (1989) Characterization of anefficient coronavirus ribosomal frameshifting signal: requirementfor an RNA pseudoknot. Cell, 57, 537–547.
10. ten Dam,E.B., Pleij,C.W. and Bosch,L. (1990) RNA pseudoknots:translational frameshifting and readthrough on viral RNAs.Virus Genes, 4, 121–136.
11. Tu,C., Tzeng,T.H. and Bruenn,J.A. (1992) Ribosomalmovement impeded at a pseudoknot required for frameshifting.Proc. Natl Acad. Sci. USA, 89, 8636–8640.
12. Somogyi,P., Jenner,A.J., Brierley,I. and Inglis,S.C. (1993)Ribosomal pausing during translation of an RNA pseudoknot.Mol. Cell. Biol., 13, 6931–6940.
13. Lopinski,J.D., Dinman,J.D. and Bruenn,J.A. (2000) Kinetics ofribosomal pausing during programmed -1 translationalframeshifting. Mol. Cell. Biol., 20, 1095–1103.
14. Kollmus,H., Honigman,A., Panet,A. and Hauser,H. (1994) Thesequences of and distance between two cis-acting signalsdetermine the efficiency of ribosomal frameshifting in humanimmunodeficiency virus type 1 and human T-cell leukemia virustype II in vivo. J. Virol., 68, 6087–6091.
15. Farabaugh,P.J. (1997) Programmed alternative reading of thegenetic code. R.G. Landes Co., Austin, TX, pp. 69–102.
16. Plant,E.P., Jacobs,K.L., Harger,J.W., Meskauskas,A., Jacobs,J.L.,Baxter,J.L., Petrov,A.N. and Dinman,J.D. (2003) The 9-Asolution: How mRNA pseudoknots promote efficient programmed-1 ribosomal frameshifting. RNA, 9, 168–174.
17. Noller,H.F., Yusupov,M.M., Yusupova,G.Z., Baucom,A. andCate,J.H. (2002) Translocation of tRNA during protein synthesis.FEBS Lett., 514, 11–16.
18. Dinman,J.D. and Kinzy,T.G. (1997) Translational misreading:mutations in translation elongation factor 1alpha differentiallyaffect programmed ribosomal frameshifting and drug sensitivity.RNA, 3, 870–881.
Nucleic Acids Research, 2011, Vol. 39, No. 1 311
Downloaded from https://academic.oup.com/nar/article-abstract/39/1/300/2409487by gueston 12 April 2018

19. Harger,J.W., Meskauskas,A. and Dinman,J.D. (2002) An‘‘integrated model’’ of programmed ribosomal frameshifting.Trends Biochem. Sci., 27, 448–454.
20. Leger,M., Sidani,S. and Brakier-Gingras,L. (2004) A reassessmentof the response of the bacterial ribosome to the frameshiftstimulatory signal of the human immunodeficiency virus type 1.RNA, 10, 1225–1235.
21. Kim,Y.G., Maas,S. and Rich,A. (2001) Comparative mutationalanalysis of cis-acting RNA signals for translational frameshiftingin HIV-1 and HTLV-2. Nucleic Acids Res., 29, 1125–1131.
22. Leger,M., Dulude,D., Steinberg,S.V. and Brakier-Gingras,L.(2007) The three transfer RNAs occupying the A, P and E siteson the ribosome are involved in viral programmed -1 ribosomalframeshift. Nucleic Acids Res., 35, 5581–5592.
23. Weiss,R.B., Dunn,D.M., Shuh,M., Atkins,J.F. and Gesteland,R.F.(1989) E. coli ribosomes re-phase on retroviral frameshift signalsat rates ranging from 2 to 50 percent. New Biol., 1, 159–169.
24. Namy,O., Moran,S.J., Stuart,D.I., Gilbert,R.J. and Brierley,I.(2006) A mechanical explanation of RNA pseudoknot function inprogrammed ribosomal frameshifting. Nature, 441, 244–247.
25. Yelverton,E., Lindsley,D., Yamauchi,P. and Gallant,J.A. (1994)The function of a ribosomal frameshifting signal from humanimmunodeficiency virus-1 in Escherichia coli. Mol. Microbiol., 11,303–313.
26. Baranov,P.V., Gesteland,R.F. and Atkins,J.F. (2004) P-site tRNAis a crucial initiator of ribosomal frameshifting. RNA, 10,221–230.
27. Liao,P.Y., Gupta,P., Petrov,A.N., Dinman,J.D. and Lee,K.H.(2008) A new kinetic model reveals the synergistic effect of E-,P- and A-sites on +1 ribosomal frameshifting. Nucleic Acids Res.,36, 2619–2629.
28. Savelsbergh,A., Katunin,V.I., Mohr,D., Peske,F., Rodnina,M.V.and Wintermeyer,W. (2003) An elongation factor G-inducedribosome rearrangement precedes tRNA-mRNA translocation.Mol. Cell, 11, 1517–1523.
29. Rodnina,M.V., Gromadski,K.B., Kothe,U. and Wieden,H.J.(2005) Recognition and selection of tRNA in translation.FEBS Lett., 579, 938–942.
30. Liao,P.Y., Choi,Y.S. and Lee,K.H. (2009) FSscan: amechanism-based program to identify +1 ribosomal frameshifthotspots. Nucleic Acids Res., 30, 7302–7311.
31. Nam,S.H., Copeland,T.D., Hatanaka,M. and Oroszlan,S. (1993)Characterization of ribosomal frameshifting for expression of polgene products of human T-cell leukemain virus type 1. J. Virol.,67, 196–203.
32. Jacobs,J.L. and Dinman,J.D. (2004) Systematic analysis ofbicistronic reporter assay data. Nucleic Acids Res., 32, e160.
33. Finehout,E.J. and Lee,K.H. (2003) Comparison of automatedin-gel digest methods for femtomole level samples. Electrophoresis,24, 3508–3516.
34. Perkins,D.N., Pappin,D.J., Creasy,D.M. and Cottrell,J.S. (1999)Probability-based protein identification by searching sequencedatabases using mass spectrometry data. Electrophoresis, 20,3551–3567.
35. Dinman,J.D., Ruiz-Echevarria,M.J., Czaplinski,K. and Peltz,S.W.(1997) Peptidyl-transferase inhibitors have antiviral propertiesby altering programmed -1 ribosomal frameshifting efficiencies:development of model systems. Proc. Natl Acad. Sci. USA, 94,6606–6611.
36. Meskauskas,A., Harger,J.W., Jacobs,K.L. and Dinman,J.D.(2003) Decreased peptidyltransferase activity correlates withincreased programmed -1 ribosomal frameshifting and viralmaintenance defects in the yeast Saccharomyces cerevisiae. RNA,9, 982–992.
37. Schlunzen,F., Zarivach,R., Harms,J., Bashan,A., Tocilj,A.,Albrecht,R., Yonath,A. and Franceschi,F. (2001) Structural basisfor the interaction of antibiotics with the peptidyltransferasecentre in eubacteria. Nature, 413, 814–821.
38. Manktelow,E., Shigemoto,K. and Brierley,I. (2005)Characterization of the frameshift signal of Edr, amammalian example of programmed -1 ribosomal frameshifting.Nucleic Acids Res., 33, 1553–1563.
39. Baranov,P.V., Henderson,C.M., Anderson,C.B., Gesteland,R.F.,Atkins,J.F. and Howard,M.T. (2005) Programmed ribosomalframeshifting in decoding the SARS-CoV genome. Virology, 332,498–510.
40. Firth,A.E., Chung,B.Y., Fleeton,M.N. and Atkins,J.F. (2008)Discovery of frameshifting in alphavirus 6K resolves a 20-yearenigma. Virol. J., 5, 108.
41. Cardno,T.S., Poole,E.S., Mathew,S.F., Graves,R. and Tate,W.P.(2009) A homogeneous cell-based bicistronic fluorescence assayfor high-throughput identification of drugs that perturb viral generecoding and read-through of nonsense stop codons. RNA, 15,1614–1621.
42. Sorensen,M.A. and Pedersen,S. (1991) Absolute in vivo translationrates of individual codons in Escherichia coli. The two glutamicacid codons GAA and GAG are translated with a threefolddifference in rate. J. Mol. Biol., 222, 265–280.
312 Nucleic Acids Research, 2011, Vol. 39, No. 1
Downloaded from https://academic.oup.com/nar/article-abstract/39/1/300/2409487by gueston 12 April 2018