Embed Size (px)
Citation preview

THE MAGNET RECOGNITION PROGRAM: WHAT ARE THE EFFECTS ON FINANCIAL PERFORMANCE?
Saleema A. Karim
A dissertation submitted to the faculty at the University of North Carolina at Chapel Hill in partial fulfillment of the requirements for the degree of Doctor of Philosophy in the Department
of Health Policy and Management in the Gillings School of Global Public Health.
Chapel Hill 2014
Approved by:
George H. Pink
Kristin L. Reiter
George M. Holmes
Cheryl B. Jones
Elizabeth K. Woodard

ii
© 2014 Saleema A. Karim
ALL RIGHTS RESERVED

iii
ABSTRACT
Saleema A. Karim: The Magnet Recognition Program: What are the Effects on Financial Performance?
(Under the direction of George H. Pink)
Information asymmetry is defined as an imbalance of information between two parties
where one party has more information than another party. In health care, information asymmetry
impairs the ability of hospitals to compete effectively because customers are unable to evaluate
the quality of health care, which then influences customer selection of hospitals. In order to
reduce information asymmetry, some hospitals attain quality designations from external parties
as signals of their commitment to health care quality and quality management to patients,
providers, and payers. One particular quality designation in health care is the Magnet
Recognition Program.
Magnet Recognition has been promoted as a signal for nursing excellence and quality
patient care over the past two decades. Despite the financial investment required to attain the
designation, there has been limited research investigating Magnet Recognition as an effective
signal of quality. The purpose of this study is to evaluate the effectiveness of the Magnet
Recognition signal by examining its effect on various dimensions of hospital financial
performance: reimbursement, market share, cost inefficiency and ultimately profitability.
A pre-post research design, using control hospitals, was used to measure the effect of the
signal. Secondary data from the Medicare Cost Reports, Area Resource File, American Hospital
Association and American Nurses Credentialing Center were used. The sample consisted of a

iv
longitudinal, unbalanced panel of hospitals located in urban areas between 2000 to 2010. The
empirical analysis consists of two phases: (1) propensity score analysis and (2) difference-in
difference analysis using fixed effects and a stochastic frontier panel model with random effects.
The Magnet Recognition signal was found to have no effect on either hospital
reimbursement or market share. The lack of signal effectiveness on reimbursement and market
share may be attributed to either the signal strength, interpretability of the signal or
responsiveness to the signal. However, the signal was associated with a significant reduction of
cost inefficiency. Overall, the signal resulted in a significant increase in profitability. In
addition to affecting the appeal and demand for the designation, these results present hospital
managers and policy makers with the pathway by which the signal may impact hospital
profitability.

iv
To my parents, Amir and Laila, for your inspiration and hope. To my sisters, Hamidah and Shaidah, for your support and encouragement.
To my nieces, Imaan and Khaliya, for your love and laughter. My deepest gratitude.
Thank you.

v
ACKNOWLEDGEMENTS
The pages of this dissertation hold far more than the culmination of years of study. This
work also reflects the relationships with many generous and inspiring people I have met since
beginning my graduate work at UNC. I could never have completed this dissertation without the
help, support, guidance and efforts of many people. The list is long, but I value each
contribution to my development as a scholar, researcher and teacher.
First I would like to thank Dr. George Pink, who served as my dissertation chair and
adviser. No words can adequately convey my gratitude and indebtedness to him for the time,
labour, and care which he so generously invested in studying and commenting on the many
drafts of this dissertation. Throughout the entire process of research and writing, his advice,
direction and continuous support have been of inestimable value to me. His patience,
commitment and dedication have been major driving forces throughout my graduate career at
UNC. Thank you for taking the time to frequently meet with me and to check how things are
progressing. I have valued and appreciated your advice and insight over the past five years. I
could not have imagined a better adviser and mentor.
I would also like to express my sincere appreciation and thanks to Dr. Kristin Reiter.
Kristin has had numerous roles during my time at UNC. She has been a mentor, teacher, co-
adviser, committee member and colleague. Her patience and expert guidance helped to shape the
proposal and dissertation in its early phases. This dissertation would not exist without her
expertise and knowledge. Her advice, support and friendship have been invaluable on both an
academic and a personal level, for which I am extremely grateful.

vi
I would also like to thank my other committee members Dr. Mark Holmes, Dr. Cheryl
Jones and Dr. Elizabeth Woodard for their guidance over the past few years. These scholars
reviewed countless drafts and provided feedback not only on dissertation content, but also guided
me toward accomplishing my broader professional goals. I would also like to thank Dr. Peggy
Leatt for taking the time to review and comment on my dissertation chapters.
This dissertation would not have come to a successful completion without the help,
support and encouragement from the faculty and staff at the Department of Health Policy and
Management at UNC. Specifically, I would like to thank Dr. Morris Weinberger for his
encouragement and support and Mr. David Collins for always looking after me and making me
feel part of the UNC family.
I would also like to acknowledge the faculty and staff at the School of Health
Administration, Dalhousie University in Halifax, Nova Scotia. I am grateful to Lawrence
Nestman, Dr. David Persaud and Dr. Thomas Rathwell for supporting and encouraging my
decision to pursue a doctoral degree. I would also like to thank Dr. Joseph Byrne, Dr. Grace
Johnston, Dr. Shyuemeng Luu, Dr. Christopher Simms, Sandra Drew, Shelley Weir, Jackie
Harnish and Sally Alshazly. My decision to pursue a PhD would not have come to fruition
without your help and support.
I would also like to thank the clinicians, staff and technicians at Chapel Hill
Ophthalmology, they have always been accommodating and available when I needed my eyes
checked. A special thanks to Dr. John Wood for not only looking after my eyes, but his
willingness to listen and encourage me along in the dissertation process. I truly appreciate your
time and advice.

vii
To my friends at UNC who were an unexpected and fantastic compliment to the Health
Policy and Management PhD program. They have helped me stay sane over the past five years.
Their support and care helped me overcome setbacks and stay focused on my studies. Special
thanks to Leah Zullig, Monica Perez Jolles and Tandrea Hilliard for their friendship and positive
energy. I am also grateful to my Canadian UNC friends, Yuna Kim and Wayne Psek, for their
kindness and support. Last but not least, my friend and PhD buddy, Mona Kilany, who knew the
type of encouragement I needed to get me through to the end. Her check-ins and unwavering
belief in me were invaluable and helped keep me focused and motivated. Thank you for keeping
me on track and seeing me through this dissertation.
Outside of school, many friends and colleagues also cheered me on. I’m deeply grateful
for the support from friends near and far: Dr. Edward Cain, Dr. Andrew Travers, Dr. John
Tallon, Dr. Dave Petrie, Corinne DeMone, Tanya Fraser, Emily Morash, Sharon Oulton, Richard
Thomas, Thomas Dobson, Dr. Stacy Ackroyd-Stolarz, and Wilma Crowell. I also want to thank
Jennifer Girard, my long time Haligonian friend, for listening and cheering me on through this
entire process.
Finally, I would like to thank my family for their love, support and encouragement during
the long years of my education. My parents have instilled the value of hard work and the
importance of an education. When times were hard my father reminded me that “life is full of
challenges and without challenges, life is not fun.” I remember this saying fondly during times
of difficulty and adversity. While my parents may not understand my desire to do a doctoral
degree, it is my sincerest hope that they understand that this would never have been possible
without them supporting me every step of the way. I would also like to thank my sisters
Hamidah Lalji and Shaidah Karim, and my brother-in-laws, Aly Lalji and Scott Meixner, for

viii
their words of support and motivation and frequently tell me not to give up and keep moving
forward. Most importantly, I would like to thank my two best friends in the world, Imaan and
Khaliya. Both of them always reminded me to laugh and have fun and that anything was
possible. I learn so much from you and I love you. Thank you all for your unwavering faith and
confidence in my abilities. This has shaped me to be the person I am today. Thank you for
everything.
For any errors or inadequacies that may remain in this work, of course, the responsibility
is entirely my own.

ix
TABLE OF CONTENTS
List of Tables ................................................................................................................................ xii
List of Figures .............................................................................................................................. xiii
List of Abbreviations ................................................................................................................... xiv
Chapter 1: Introduction .................................................................................................................. 1
Problem Statement ...................................................................................................................... 1
What We Know about MR as a Quality Signal .......................................................................... 3
How this Study Fills the Gap in Knowledge ............................................................................... 4
Relevance of the Question for Policy and/or Practice................................................................. 5
Organization of the Dissertation ................................................................................................. 5
Chapter 2: Literature Review ......................................................................................................... 7
Overview ..................................................................................................................................... 7
Theoretical Background .............................................................................................................. 7
Magnet Recognition Signaling Unobserved Quality ................................................................ 13
Background of the Magnet Recognition Program..................................................................... 14
Impetus for Magnet Recognition............................................................................................... 16
The Costs of Achieving Magnet Recognition ........................................................................... 20
Outcomes of the Magnet Recognition Program ........................................................................ 25

x
Summary ................................................................................................................................... 30
Chapter 3: Study Design and Methods ........................................................................................ 34
Overview and Rationale ............................................................................................................ 34
Conceptual Framework ............................................................................................................. 34
Research Questions & Hypotheses ........................................................................................... 35
Research Design ........................................................................................................................ 38
Data ........................................................................................................................................... 39
Study Sample............................................................................................................................. 40
Variables and Measurements .................................................................................................... 42
Statistical Analysis .................................................................................................................... 50
Chapter 4: The Effect of the Magnet Recognition Signal on Hospital Reimbursement and Market Share ................................................................................................ 63
Overview ................................................................................................................................... 63
Introduction ............................................................................................................................... 63
Research Design and Methods .................................................................................................. 67
Results ....................................................................................................................................... 78
Discussion ................................................................................................................................. 84
Conclusion ................................................................................................................................. 89
Chapter 5: Cost Efficiency of Magnet Recognized Hospitals: A Stochastic Frontier Approach ......................................................................................................................... 91
Overview ................................................................................................................................... 91
Introduction ............................................................................................................................... 91

xi
Methods ..................................................................................................................................... 97
Results ..................................................................................................................................... 111
Discussion ............................................................................................................................... 113
Chapter 6: The Effect of the Magnet Recognition Signal on Hospital Financial Performance. ............................................................................................................... 120
Overview ................................................................................................................................. 120
Introduction ............................................................................................................................. 120
Research Design and Methods ................................................................................................ 123
Results ..................................................................................................................................... 132
Discussion ............................................................................................................................... 138
Conclusion ............................................................................................................................... 142
Chapter 7: Conclusion................................................................................................................ 143
What did the three studies investigate? ................................................................................... 143
What did the three studies find? .............................................................................................. 143
Is Magnet Recognition an effective signal of unobserved quality? ........................................ 145
What are the management and policy implications of the three studies? ............................... 148
References ................................................................................................................................... 150

xii
LIST OF TABLES
Table 1. Listing of variables, measures, definitions and data sources. ........................................ 47
Table 2. Hospital outcomes and measures. .................................................................................. 57
Table 3. Difference-in-difference estimators for the effect of Magnet Recognition ................... 58
Table 4. Listing of variables, measures, definitions and data sources. ......................................... 74
Table 5. Summary statistics of dependent and independent variables (N=6,581 hospital year observations) from 2000 to 2010 ............................................................ 80
Table 6. Difference-in-difference regression with hospital fixed effects .................................... 82
Table 7. Variable definitions and descriptive statistics ............................................................. 107
Table 8. Generalized likelihood-ratio tests of null hypotheses for parameters of the translog stochastic cost frontier model. ............................................................................ 108
Table 9. Parameter estimates for the frontier cost function. ...................................................... 109
Table 10. Mean inefficiency estimates for all, MR and never-MR hospitals by time-period. .. 110
Table 11. Listing of variables, measures, definitions and data sources. .................................... 129
Table 12. Summary statistics of dependent and independent variables (N=6,581 hospital year observations) from 2000 to 2010 ......................................................... 134
Table 13. Difference-in-difference regression with hospital fixed effects ................................. 136

xiii
LIST OF FIGURES
Figure 1. Signaling Timeline (Adapted from Connelly et al., 2011) ............................................. 8
Figure 2. A conceptual framework illustrating the pathway of the Magnet Recognition signal from the signaler to the receiver and the resulting hospital outcomes........................................................................................................................................................ 35
Figure 3. A pre-post research design using MR and never MR hospitals and three time periods (Pre-test, Intervention, and Post-test). ...................................................... 38
Figure 4. Consort diagram presenting the exclusion criteria used in determining the final hospital study sample. ..................................................................................................... 42
Figure 5. Absolute standardized differences in baseline covariates between
MR hospitals and never MR hospitals, before and after propensity score matching (post-match standardized difference <10% indicates excellent covariate balance). ..................... 54

xiv
LIST OF ABBREVIATIONS
AHA American Hospital Association’s Annual Survey of Hospitals
ANCC American Nurses Credentialing Center
ARF Area Resource File
HCRIS Healthcare Cost Report Information System
MR Magnet Recognition
SFA Stochastic Frontier Analysis

1
CHAPTER 1: INTRODUCTION
Problem Statement
Information asymmetry is defined as an imbalance of information between two parties,
where one party has more information than another party. This imbalance can result in
misinformation and an imbalance of power in transactions. One way to mitigate this imbalance
is via signaling theory. Various types of signals are utilized to reduce information asymmetry.
Examples of signals commonly used by organizations include branding1-3, advertising3,
reputation4, research and development5, profit status6 and quality designations.7-9
In health care, information asymmetry impairs the ability of hospitals to compete
effectively in health care markets10 because customers are unable to evaluate the quality of health
care services. This incomplete information influences consumer selection of hospitals.8 In order
to reduce information asymmetry, hospitals sometimes attain quality designations from external
parties as signals of their commitment to health care quality and quality management to patients,
providers and payers.9 One particular quality designation in health care is the Magnet
Recognition (MR) Program®.
This MR designation is an example of a signal employed by hospitals to communicate to
patients, providers and payers, the hospital’s commitment to health care quality and quality
management via nursing service excellence.9 MR can be considered a symbol of distinction11;
indeed, Karkos et al. viewed MR as a signal of nursing excellence and quality patient care.12 MR
signals to consumers and to health care providers about the quality of care, and in particular

2
nursing care, which they can expect to receive in a MR hospital13-15, which in today’s
competitive market place is an important hospital characteristic.16, 17
The American Nurses Credentialing Center (ANCC) confers the MR designation to
hospitals and long term care facilities.18, 19 The MR process is an external professional peer
review of a hospital’s environment20, with a focus on nursing, that requires the commitment of
time and the investment of substantial human and financial resources.21, 22 Hospitals seeking MR
are required to meet stringent criteria related to excellence in patient satisfaction, nurse
satisfaction and nurse sensitive clinical outcomes.23
MR designation has gained widespread attention in both research24, 25 and practice26 over
the past two decades. A MR hospital is acknowledged as a gold standard for quality nursing
care27 and is the highest level of recognition a health care organization can receive for excellence
in nursing services.14 The program has also been promoted and recommended by popular media
as a signal for nursing excellence. For example, in 2005, the U.S. News & World Report added
MR hospital designation to its set of criteria used in the selection of the best hospitals in the
U.S.20, 28 In 2010, nine of the 14 hospitals listed on the U.S. News & World Report’s Best
Hospitals Honor Roll were MR hospitals.29
Despite the financial investment required to attain the MR designation, there has been
limited research investigating MR as an effective signal of unobserved quality. The ANCC has
promoted MR as a mechanism to improve hospital financial performance30 and rationalized the
improvement through signaling to patients and clinicians that the hospital is a center for nursing
excellence and the provider of quality patient care12 leading to increased volume of patients and
corresponding increases in hospital market share15, 18, 31 and revenue.32 Unfortunately the

3
evidence in the literature about the impact of MR on hospital financial performance is largely
anecdotal in nature and lacks scientific rigor.33
Given the endorsements and increasing interest in the MR program, despite the lack of
evidence on its effectiveness, there is a notable gap in knowledge that is highly relevant in the
hospital marketplace. The purpose of this study is to evaluate the effectiveness of the MR signal
by examining its effect on the various dimensions of hospital financial performance.
What We Know about MR as a Quality Signal
Much has been published on MR and its impact on hospital, nursing and patient
outcomes.24, 25 MR hospitals are noted for their success in recruiting and retaining nurses by
creating environments that foster empowerment, autonomy, responsibility, control over
environment and positive collaborative nurse-physician relationships.34, 35 Overwhelming
research evidence demonstrates positive outcomes of MR for hospitals36, specifically related to
job satisfaction, retention of nurses, hospital marketability and patient outcomes.37 However,
there is minimal research on the association between MR and indicators of financial
performance.
The hypothesized financial benefits associated with MR have been rationalized through
the potential for cost savings38, increased volume of patients leading to increased hospital market
share15, 18, 31 and better reimbursement rates.32 However, MR requires substantial investment of
both time and resources39 thus, it is an expensive proposition for organizations interested in the
designation.40 Moreover, a recent study by Jayawardhana et al. (2014) found that inpatient costs
are higher for MR hospitals than non-MR hospitals, although MR hospitals were also found to
have higher net inpatient revenues.41 Because the costs of pursing and maintaining MR are high,

4
more research is needed to understand the effectiveness of the MR signal as it relates to hospital
financial performance.
How this Study Fills the Gap in Knowledge
Previous studies assessing the effect of signaling on firm performance have utilized small
sample sizes, cross-sectional study designs, single-site evaluations, and convenience samples of
firms, therefore limiting external validity of the results. To overcome some of these limitations,
this dissertation uses a longitudinal panel data set (addressing issues of sample size, selection
bias and omitted variable bias), and externally reported administrative and financial information,
applies a robust methodological approach, and employs innovative analytical techniques to
investigate the effectiveness of the MR signal as measured by changes in various aspects of
hospital financial performance. Importantly, the approaches used in this study control for the
fact that MR hospitals differ from non-MR hospitals. This more rigorous methodological
approach provides stronger empirical evidence of the effectiveness of the MR signal on hospital
financial performance.
The central hypothesis of this dissertation is that the MR signal will increase hospital
financial performance through increasing hospital reimbursement, market share and efficiency of
designated hospitals. The three specific aims are as follows:
• Aim 1: Determine the effect of the MR on hospital reimbursement and market share (Chapter
4).
• Aim 2: Determine the effect of the MR on hospital cost inefficiency (Chapter 5).
• Aim 3: Determine the effect of the MR on hospital financial performance (Chapter 6).

5
Relevance of the Question for Policy and/or Practice
Although the primary purpose of the MR is not to improve financial performance of
hospitals, with the current economic climate, fiscal constraints, healthcare workforce shortages,
and reduced payer reimbursements for healthcare services, hospitals may pursue this strategy to
increase competitiveness in the health care market and to improve financial performance and
viability. The pursuit of the MR is an important organizational decision that requires substantial
modifications to the structure and culture of organizations and considerable investment of time
and resources, initially and ongoing as the process continues.
The results of this dissertation have important implications for the various stakeholders
involved with MR, including the MR program, hospital managers, the nursing profession and
policy makers. The empirical evidence of the effect of the MR signal on hospital financial
performance may affect the appeal, demand and marketability of the MR program to currently
designated MR hospitals and potentially interested hospitals. Hospital managers and decision
makers may use the results as a deciding factor for undertaking the MR endeavour. The value
and contribution of the nursing profession to hospital financial performance may be recognized
as an essential component to the financial viability of hospitals. Finally, policy makers may be
interested in the cost-quality trade-offs and financial effects related to MR as other signals of
quality (e.g. Hospital Compare) are incentivized through payment policy.
Organization of the Dissertation
The sections of the dissertation are organized as follows: Chapter 2 provides background
on the MR program, a conceptual model on information asymmetry and signaling theory, and
discusses current literature on the effect of signaling on performance of corporate firms and

6
health care organizations in particular. Chapter 2 concludes by presenting the limitations of
existing studies and justification for this dissertation research. Chapter 3 describes the methods
used in the dissertation, including study design and rationale, sample, data sources, hypotheses,
and analytical approaches. Chapters 4 to 6 are manuscripts corresponding to Aims 1 to 3,
respectively, and are intended for submission to peer-reviewed journals. Chapter 7 synthesizes
the multiple findings of the dissertation, discusses its policy implications, and proposes future
potential research opportunities.

7
CHAPTER 2: LITERATURE REVIEW
Overview
This literature review serves two main purposes. First, it reviews the literature on
signaling theory and its role in reducing information asymmetry in corporate and health care
settings and presents evidence on the effectiveness of signaling unobserved quality in health care
settings. Second, it introduces MR as a signal utilized by hospitals to distinguish themselves
from competitors. Background information on MR is provided to support the application of
signaling theory to this dissertation. This includes the impetus for hospitals pursuing MR and the
journey to achieving MR. In addition, research evidence on nursing, patient and organizational
outcomes for MR hospitals is discussed, and the gaps in the MR literature are identified. The
principles of signaling theory are applied to explain the role of MR as a signal of unobserved
quality.
Theoretical Background
The Role of Signals in Information Asymmetry
Information asymmetry arises when there is imperfect information between two parties.42
For instance, information asymmetry exists when firms know more than consumers about the
services and products they sell and due to imperfect information, consumers are unable to
evaluate the product or service quality.2 If consumers are unable to distinguish high quality
firms from low quality firms, they may shift their demand to substitute products and/or services

8
or else pay a non-discriminatory price to all firms.7 Signaling is used to reduce the imbalance of
information between two parties. The quality information conveyed by signals leads consumers
to update their perceptions2, 43 about product and service quality within the context of market
conditions.44
As described by Connelly et al. (2011), the signaling process consists of four elements:
(1) the signaler, (2) the signal, (3) the receiver and (4) feedback (Figure 1). The signalers are
insiders or firms who have access to information about the product, service, or the organization
that is not available to outsiders.43
Figure 1. Signaling Timeline (Adapted from Connelly et al., 2011)
The signaler undertakes a decision or action (the signal) that communicates information
regarding some type of unobservable quality to outsiders or consumers, to express positive
organizational characteristics.43 There are two characteristics of effective signals: (1) signal
observability, or the extent to which outsiders are able to notice the signal, and (2) signal cost.
The credibility of a signal is linked with signal cost45; the costlier the signal, the less likely
imposters will imitate quality signals and the more meaningful the signal.2 Signals become
ineffective if they can be imitated by firms that do not have valid information to communicate.46

9
The receivers are outsiders or consumers who have limited information, but would like to
receive this information to make informed decisions. When signaling is effective, the signaler
benefits from an action taken by the receiver that the receiver would not have otherwise
performed. This usually involves selection of the signaler over other alternatives. In turn,
receivers gain by making more informed decisions. Lastly, feedback is the information sent back
to signalers regarding the effectiveness of their signals.43
Signaling Unobservable Firm Quality
There are a number of studies that have examined the use of specific signals to
communicate information about unobservable firm characteristics or firm quality to consumers.
These signals can take on many forms, including corporate name changes46, quality
designations7, management quality47, 48, product branding1-3, advertising expenditures3, pricing
strategies49, and warranties.3 Firms use these and other signaling strategies to communicate
unobservable quality to other firms and consumers. The effectiveness of signals depends on
various factors49 and is usually determined by examining the corresponding changes in firm
performance. According to the research literature the impact of signals on firm performance is
varied.
For instance corporate names have been known to signal a firm’s quality and reputation49
and are linked directly to its’ successes and failures. Firms considering corporate name changes
usually make large financial investments to ensure the name is consistent with the firm’s image
and strategic priorities. Corporate name changes usually result from mergers and acquisitions or
firms’ decisions to enter a new line of business. Firms may also take on a new name to signal to
customers, competitors and investors of a new approach to doing business. In order to be an

10
effective signal, the name change must be a positive signal. Previous research on corporate
name changes has demonstrated either no significant market reactions or positive but statistically
weak effects on firm performance.46 However, a study by Koku (1997), which investigated the
effects of name change in the service industry, found that corporate name change signaling, on
average, was an effective marketing strategy for firms in the service industry as measured
through increases in the firm’s mean price per earnings ratio.46
Firms may also pursue quality designations such as Total Quality Management, Business
Process Reengineering, the Malcolm Baldrige Award Criteria, Six Sigma and more recently ISO
9000, to signal unobservable attributes to stakeholders.50 For example, one study showed that
implementing the ISO 9000 Quality Management Standard, created by the International
Organization for Standardization, may act like a market signal of superior quality – such as in
supply chains where buyers are so far removed from suppliers, it is difficult for buyers to
identify high quality suppliers. Since ISO 9000 requires compliance with a wide range of quality
system standards and participation in an external audit and review, firms that complete the
management steps needed to certify with this designation signal desirable organizational
attributes, such as management commitment to ongoing improvements, lean production practices
and consistent product quality. These signals have been shown to communicate guaranteed
product quality and service from the supplier to the buyer. Research evidence indicates that ISO
9000 designated firms’ grow faster after designation and that operational improvements from
ISO 9000 do not account for the increased growth.7
Research literature also indicates that quality and reputation of a firm’s management team
is a signal of firm quality and a predictor of its future financial performance. The quality of the
management team has been theorized to improve the ability of the firm to obtain lower cost of

11
capital, to increase investor interest, and signal future expected performance.47 However, the
relationship between management quality and future financial performance has received minimal
attention in the literature.47, 48 In a research study by Chemmanur et al. (2009), reputable
managers were shown to credibly signal firm value to outsiders, therefore reducing information
asymmetry facing the firm in the equity market. This in turn resulted in improved access to the
equity markets and impacted firm financial policies. The findings also indicated that quality
management teams are more likely to select higher net present value projects and implement
them more successfully, thereby affecting the firm’s investment policy.48
Advertising expenditures and brand names are also examples of signals used by firms to
convey unobserved quality to consumers. Both these types of signals require an initial financial
investment, with the belief that the returns on investment will be recouped at a later time. Firms
that incur large advertising expenditures signal to consumers that the unobservable quality must
be valid else the firm would not be able to recover this expenditure. Similarly brand names are
supposed to communicate unobservable quality since large investments are made to build brand
equity, such as advertising, product design, and packaging modifications.3 These signals are
considered to be credible since they are associated with a commitment to high quality, thereby
increasing the consumer’s perceived quality.2 If low quality sellers were to imitate these
signaling strategies, their subsequent low quality would be revealed resulting in a loss of
investment because future sales will decrease. Therefore there is no incentive for low quality
sellers to invest in either of these signaling strategies.3 There have been various research studies
examining the relationship between unobserved quality and advertising51-53 and brand names,
and their findings regarding the effectiveness of signaling are mixed.2, 54, 55

12
Signaling Unobserved Quality in Health Care
Information asymmetry has also been shown to be a challenge for health care providers
who often struggle to effectively communicate the quality of their services to prospective
patients and/or employees.9 In order to communicate unobserved quality to both patients and
providers, hospitals use various signaling strategies. For instance, hospitals are known to use
both advertising and their status as centers of excellence as a signal to distinguish themselves and
attract patients and providers.56 In addition, health care providers also use public reporting of
quality of care information to inform patients about the large variation between providers in
quality of care and to motivate patient participation by enabling patients to make informed
choices about their health care providers.10
Not-for-profit status has also been theorized to be a signal of quality. Unlike for-profit
status, not-for-profit status is not associated with profit maximization; therefore not-for-profits
are unlikely to shirk on quality in order to reduce costs. As a result, the not-for-profit status may
be a signal that a firm will provide the quality products or services. On the contrary, Malani and
David (2008) investigated the not-for-profit signal in hospital, nursing home and child care
industries and concluded that not-for-profit status may not be an effective signal of quality.57
Hospital report cards have also been utilized as a strategy to address information
asymmetry in health care markets. Public reporting of quality information has been utilized by
policy makers to improve health care quality. Public report cards provide patients with
information to help them differentiate between quality providers and give providers incentives to
improve their quality so they can increase demand for their services. A recent study by Werner
et al. (2012) investigated the relationship between report card scores and patient choice for
nursing homes. They discovered a statistically significant, yet weak positive relationship

13
indicating that public reporting may result in a small increase in consumer choice of high-scoring
facilities.8
As an alternative to reporting quality information directly, hospitals may make decisions
that serve to indirectly communicate, or “signal”, unobservable information to consumers. This
would be accomplished by attaining a coveted quality designation which patients, providers and
payers would interpret as the hospital’s commitment of resources to quality management.58 In
the UK, the Patient’s Charter, introduced by government, defined a set of standards for public
health service with regards to service quality. If the targets identified by the Charter are met, the
providers can apply for accreditation awarded by the government – the Charter Mark. The
Charter Mark can be used to signal service quality to users of services and/or to purchasers
acting on their behalf.9 Research indicates that these types of signals affect patient’s perceptions
of hospital quality and are hypothesized to have an impact on financial performance.59 Evidence
indicates that the Charter Mark was shown to provide definite signals of service quality.9
Magnet Recognition Signaling Unobserved Quality
MR is considered to be a signal used by hospitals to communicate to consumers and
health care providers about the quality of care which they can expect to receive in a MR
hospital.13-15 MR is proposed to reduce the information asymmetry by signaling to various
stakeholders, the hospitals’ commitment to nursing excellence and quality management
strategies. It is hypothesized to be an effective signal of quality because it meets the two
conditions previously described. First, MR is directly observable by consumers because
hospitals have been shown to strongly promote receipt of the designation through marketing,

14
public display of banners, and other advertising.16, 60-62 Second, MR is costly63 and therefore
difficult to imitate for providers that do not have meaningful quality information to convey.64
The following sections present information on the MR program. It is intended to explain
and support the claim that MR is considered to be a signal used by hospitals to communicate
their commitment to quality and nursing excellence. The different interpretations of the MR
signal by patients, providers and payers and the expected responses to the signal are discussed.
The principles of signaling theory are applied to evaluate the effect of the MR signal on the
various dimensions of hospital financial performance.
Background of the Magnet Recognition Program
Over the past twenty years, there has been a growing body of evidence on the MR
program and on MR hospitals, ranging from understanding how a hospital is designated, to
evaluating the outcomes in MR hospitals. MR is a symbol of distinction11 and the highest level
of recognition that a health care organization can achieve that specifically recognizes excellence
in nursing practice.17, 65, 66 MR has also been promoted and recommended by various advocates.
In 2002, the Nurse Investment Act included provisions for grants to encourage facilities to
implement the MR to improve nurse retention. Also in 2002, the Joint Commission for the
Accreditation of Healthcare Organizations recommended the adoption of characteristics of MR.
In 2005, the U.S. News & World Report added MR to its set of criteria used in the selection of
the best hospitals in the U.S.20, 28 In 2010, nine of the 14 hospitals listed on the U.S. News &
World Report’s Best Hospitals Honor Roll were MR hospitals.29
The MR program began in 1993, with the first hospital receiving MR in 1994. Since this
time, the program has experienced substantial growth.39 Applications for MR have grown at an

15
average of 32% per year for the past five years.67 Although the number of MR hospitals has
increased from 18 in 2000 to 391 in 201230, only eight percent of the 5,815 U.S. hospitals are
designated as MR hospitals and only five hospitals internationally have earned the designation.68
MR is a credential granted by the ANCC to health care organizations demonstrating a
commitment to high standards in the delivery of nursing care and support for nursing practice
throughout the organization.18, 19 The MR program is structured on quality indicators and
standards of nursing practice as defined in the American Nurses Association’s Scope and
Standards of Nurse Administrators.18 The goals of the MR program are to promote quality in a
setting that supports professional practice, to identify excellence in the delivery of nursing
services to patients and residents, and to provide a mechanism for the dissemination of ‘best’
practices in nursing services.17, 69, 70 These principles aim to foster excellence in nursing care
services through the development of a professional nursing practice environment71, which in turn
empowers staff, endorses evidence based care, and expands the role of the nurses in the delivery
of patient care.72, 73
MR hospitals are characterized by their professional work environments, promotion of
growth and development of nurses74 and environments conducive to innovation.24 MR
organizations are considered unique because of their organizational characteristics75 and
distinctive culture, which encompass values of empowerment, pride, mentoring, nurturing,
respect, integrity, and team work.18, 66, 76 MR organizations demonstrate strong leadership and
advocacy for nursing service administration and effective communication among nurses,
physicians, and administrators.28, 77, 78 All these attributes combine to provide an environment
that enhances nurse and patient satisfaction79 and interdisciplinary relationships that contribute to
the achievement of quality clinical outcomes.79, 80

16
Impetus for Magnet Recognition
There are various reasons that motivate health care organizations to pursue MR. These
reasons include, but are not limited to, the need to attract and retain professional nurses, to
reduce costs and improve financial outcomes64, to distinguish themselves in the market place81,
to improve quality of care82 and to produce superior patient and organizational outcomes.83 A
growing body of evidence confirms the positive organizational, nursing and patient benefits
associated with MR.83, 84 As a result, health care organizations are becoming increasingly
interested in the designation as a means of accomplishing these goals.82
Instead of pursuing MR, some organizations have selectively used the MR criteria as a
guide to achieve the benefits expected from becoming a MR-like organization.12, 64 Benefits of
this approach are noted; however they do not appear to be as substantial as undergoing the
scrutiny of the application process.64 The critical self-assessment of the organization along with
the thorough review and evaluation by external appraisers provides an additional value that
selective implementation of MR criteria alone would less likely achieve.64
Although MR is focused on the achievement of excellence in nursing practice, the
organization as a whole often experiences the benefits.25 Because of these benefits, many
organizations are undertaking the challenging process of becoming recognized as a MR facility.
This next section will discuss the reasons that motivate health care organizations to pursue MR.
Recruitment and Retention of Nurses and Other Health Professionals
The shortage of nurses has impacted many health care organizations in the U.S. The
shortage has affected hospital operations, the level of services provided and driven wage costs up
by 5-8% annually.85 Nurses deliver 95% of hospitalized patient care16, however hospitals are

17
unable to maintain a supply of qualified nurses because of high turnover rates and low
retention.86 As one strategy to address these concerns, hospitals have pursued MR as a way to
recruit and retain valuable nursing staff.17 Research also indicates that MR may be a solution to
deal with the nursing shortage. The designation has been shown to give hospitals an advantage
in terms of recruiting and retaining nurses83 by creating professional practice environments
where nursing is valued. The designation is used as a recruiting tool to attract nurses seeking
employment in the best clinical practice settings.87 In addition to nurses, MR hospitals are also
acknowledged as good places to work for all employees.87 While the MR started as a way to
attract and retain nurses, it is now also used to recruit other health professionals, such as
physicians, pharmacists, and laboratory technicians.88
Patient Outcomes
As hospitals and health care systems seek strategies to improve patient safety, more are
considering the MR program as a framework for transforming nursing practice and the quality of
patient care.89 The underlying philosophy of MR is the existence of a work environment that
appreciates nursing practice and values nurses, which in turn will result in positive patient
outcomes.90 In fact, there is convincing evidence that MR organizations produce better
outcomes and demonstrate improvements in patient satisfaction.87
Marketability & Competition
MR is an effective tool in marketing services to patients, nurses and the community.16
Some organizations have placed ads in their local newspapers touting their MR designation.60
The designation provides an opportunity to promote the institution’s success and it conveys to

18
the public that it is recognized as a place to receive high quality care16, 61, 62 and that nursing
services make a positive contribution to patient outcomes.91 Organizations can also capitalize on
the designation by promoting the facility as a center for excellence, which appeals to consumers
and generates more revenue.25
In addition to marketability, MR has also been demonstrated to provide organizations
with a competitive advantage. The changing health care environment is promoting competition
between health care organizations in their acquisition of insurance contracts, qualified physicians
and the retention of qualified nurses.92 In order to survive in the competitive marketplace,
hospitals are restructuring and redesigning healthcare delivery, specifically focusing on quality
care and creating excellent nursing practice environments. MR has been shown to have a distinct
advantage in recruiting nurses and in strategic marketing to the community and may be the key
for being recognized as the community’s center for nursing excellence, which is an important
attribute in today’s competitive market place.16, 17
Quality Validation & Quality Improvement
Health care organizations may also consider MR as a means to highlight their quality
accomplishments, specifically quality care and quality of nursing department.17 The designation
provides external validation of an organization’s quality achievements93 and is used to
distinguish the organization in the health care market place.81 Health care organizations also
consider engaging in MR as a mechanism to improve quality outcomes.94 The MR program
provides a framework that helps organizations focus on establishing initiatives that improve
quality outcomes in the organization.94, 95

19
Societal Demand
Health care consumers have an expectation for quality patient care. They are more
educated due to the internet92, more involved in their own health16 and are eager to find the
hospital with the best quality of service.18 MR provides consumers with a way to help them
judge the quality of care in hospitals.96 The designation signals superior performance, and an
obligation to sustain this performance so expectations of consumers are fulfilled.18
Workplace Environment
Organizations also consider pursuing MR because the designation has been associated
with the creation of positive work environments.69, 74 MR organizations have reported the
presence of a high level of collegiality between nurses and physicians, a strong presence of
nurses in decision making about patient care, and a culture of collaboration and team work,
where creativity and innovation is encouraged.16
Financial Returns
Many health care organizations are feeling the financial pressures associated with
reduced reimbursements, nursing shortages, increased competitiveness and the changing health
care environment.12 In response, hospitals are implementing widespread innovations, such as
MR to redesign work organization, roles, processes, and practices to conserve financial
resources.33 MR is an expensive endeavour and most organizations consider the required
financial commitment a barrier to pursuing the designation. However despite the costs, some
organizations make the choice to pursue the designation as a means to improve financial health
and sustainability of their facility. These organizations state that they could not afford not to

20
pursue MR.97 The designation has been linked with higher measureable financial returns98,
improved bond ratings99 and cost savings.38
The Costs of Achieving Magnet Recognition
The achievement of MR is often referred to as a continuing journey, not a destination.100
This journey is a rigorous and lengthy process101 that requires continued investment and
commitment.20 The process requires a thorough examination and revamping of an organization’s
structure, process and delivery methods93 and involves the integration of research and evidence-
based practice into the delivery of care at every level.102 While MR is focused on nursing
practice and the pursuit of nursing excellence, it is an organization’s journey, therefore
commitment and support from the entire organization is needed in order to succeed.103
MR is also an expensive endeavour, with those desiring to achieve MR spending
thousands of dollars on the process. While there has been no consensus regarding the amount of
financial investment required, it has been reported that an organization can spend from about
$50,000 to $120,000 just in preparing for MR39 and up to a maximum of $600,000 annually for
maintaining the designation.40 Many organizations hesitate to pursue MR because they are
concerned about the financial investment, which is sometimes a barrier for health care
organizations contemplating the decision to pursue MR, despite the positive benefits associated
with the designation.63
The costs associated with the MR can be divided into three categories: (1) Costs of the
MR Application, (2) Costs of the MR Journey, and (3) Financial Investment in the Nursing and
Organizational Infrastructure. These costs vary from facility to facility, and are dependent upon

21
the organization’s existing infrastructure, culture, readiness, size of the facility and support
available to the institution.104 Each of these costs is described in detail below.
Costs of the Magnet Recognition Application
To achieve MR, a hospital is required to submit an application and comprehensive
documentation that confirms the organization’s eligibility to become a MR facility.87 There are
various costs specifically associated with the MR application and these costs vary depending on
the applicant organization. During the application process, a health care organization incurs the
following expenses: an application fee of $3,900, $100 per committee member for manuals,
appraisal fees ranging from $14,000 to $58,000 depending on hospital size, documentation
review and site visit fees of approximately $10,000, and $4,000 per year for two years’
membership in American Nursing Association’s National Database of Nursing Quality Indicators
program.39, 104 These fees are paid directly to the ANCC. These costs are incurred every four
years when the organization re-applies for re-designation.39
Costs of the Magnet Recognition Journey
A large portion of the costs related to the MR journey can be attributed to the costs
involved in the preparation of the application and relevant documentation and making
modifications to meet the standards of MR.105 During the application process, organizations are
required to either designate a staff member to manage the project or hire a MR Coordinator.87
On average, the MR Coordinator salaries range from $60,000 to $70,000 per year.97 In addition
to the MR Coordinator, the MR process also requires the involvement of nursing staff,

22
management and hospital personnel.76 In many organizations, part or full-time secretarial
support has also been utilized to leverage time of the MR Coordinator.32
Many hospitals also hire external consultants to oversee the process. Their
responsibilities include consultation about the MR application and implementation of the
standards of the MR program. Consultant time has been noted to be a large expense for those
who used consultants.99 For a fee, the ANCC also makes available consultants who provide
support for the self-assessment phase as well as the application and site visit preparation
process.87
Organizations also incur additional expenses related to the increased involvement of
nurses in all aspects of hospital operations, especially during the application process. While the
salaries of nurses and advanced practice nurses are not usually recorded as MR expenses, nurses
are valuable to the preparation of the organization and to the maintenance of the designation.
These costs associated with nursing staff involvement in the MR journey are significant. The
expenses are related to paying nursing staff for participating on MR committees and
consequently having to replace them on units, thereby also adding to the total salary expenses.99
Costs are also incurred for conferences, luncheon events, site visits, and committee
time.32 Events such as a 24-hour Magnet fair to raise awareness for an organization costs $3,000
to $4,000 per event for food and entertainment.32 One organization estimated spending $100,000
in non-salary expenses, which included conference fees, educational and celebratory events,
promotional items and awards, and graphic design supports for their communications
campaign.32 Once hospitals have been awarded MR, publicizing success is another major
expense, which consists of a full page newspaper advertisement, billboards, and television
spots.99

23
Finally, sustaining MR requires continued dedication and commitment by the nursing
department. In order to retain the designation, organizations are required to sustain the culture
and continue to exceed the standards set by the MR Program. Along with fulfilling these
responsibilities, nurses are required to be innovative and implement evidence based practice in
the hospital environment and provide new infrastructures for providing and improving nursing
care.106 The focus on these activities requires the commitment of resources, such as time,
expertise, knowledge and money. Organizations cannot continue to maintain the designation
without a continued commitment of human and financial resources.107
Financial Investment in the Nursing and Organization Infrastructure
In addition to the MR application costs and the costs associated with the MR journey,
other organizational expenses must also be incurred to ensure compliance with the MR
standards.32 The costs consist of establishing the organizational infrastructure to support the
principles of MR, such as a revised governance structure, professional development programs,
nursing research programs, and capital infrastructure, such as the implementation of information
technology.
Within most MR organizations, nurses play an influential role with extensive
involvement in committees, governance and organizational-decision making. Nurses are
expected to be represented at the senior executive level and to be able to participate in
organizational governance meetings. Thus organizations must be willing to provide nurses with
time out of clinical work and support nurse attendance at committee and council meetings.108
This may be one of the most significant expenses for the process, given the cost of labour.68

24
The MR program values education and nurse staff training. Organizations must
demonstrate support for professional development of nurses through the creation of educational
infrastructure to promote and support learning and training opportunities. In order to accomplish
this endeavour, organizations are required to invest both human and financial resources to
support both nurse-staff education and an environment that encourages continual learning.109
Organizations also support continuing education through flexible scheduling to accommodate
classroom hours.110 In addition to the management and delivery of professional development
program, expenses incurred are related to continuing education opportunities, learning
partnerships, tuition reimbursements, and professional development grants.109
The MR program also places a strong emphasis on nursing research, which requires a
substantial financial investment.68 This includes expanding journal clubs to all nursing units,
establishing a nursing research council and creating a nursing research center.111 The costs
associated with establishing and maintaining a hospital based research center are related primary
to personnel. Other costs include the materials to support the work of the research center and the
availability of the research internship, quarterly grand rounds and other educational programs.
Computer, printer and software costs are also associated with the research infrastructure,
including statistical analysis software to allow for more extensive data management and analysis
procedures.112 Some organizations have established a Nursing Research Fellowship program to
further advance nursing research in the clinical practice setting.111 Nurses are also encouraged
and assisted with the submission of manuscripts, and publications and abstracts for conference
presentations. Registration, travel and hotel expenses are paid in full for nurses invited to
present at national conferences.76

25
While the MR program does not require investment in capital infrastructure, such as
medical equipment, buildings or other capital equipment, some MR organizations are investing
in information technology support when pursuing the MR designation. The MR program does
not explicitly require that organizations use information technology; however, many of the
organizations that have achieved MR are making use of information technology, especially
electronic charting for nurses.90
Outcomes of the Magnet Recognition Program
MR has caught the interest of nurse administrators and hospital management in the U.S.
and internationally for over 20 years. While the MR was initially aimed at focusing efforts on
nurse recruitment and retention and targeting strategies for improving nursing work
environments113, it has also been associated with multiple, measureable benefits to the entire
organization.103 Numerous research studies have found statistical evidence of significant
differences between the MR and non-MR organizations.66 In addition to the research based
evidence, anecdotal evidence also exists that confirms the benefits of the designation.
Nursing Outcomes
MR hospitals have been found to have characteristics that promote and sustain
professional nursing practice.114 Nurses in MR hospitals describe their work environment as
providing greater autonomy115, allowing more control over the practice setting81, increasing level
of empowerment18 and having adequate support services to provide high-quality care.114-116 The
work environment is perceived as collaborative, as evidenced by positive nurse-physician
relationships19, 117, 118 and positive relationships among fellow nurses.28

26
In addition to the effects on working environment, the MR designation has also been
associated with a positive impact on nurse satisfaction. Nurses in MR hospitals are more
satisfied with their current jobs.18, 28 Research evidence shows that compared to non-MR
hospitals, nurses in MR hospitals have statistically significant decreases in emotional
exhaustion26 and lower rates of burnout.28 MR also appear to positively affect nurses’ health by
way of low incidence of needle stick injuries, decreased staff turnover, decreased work related
injuries, decreased fatigue and burnout, and increased career and employment satisfaction.28, 33
Occupational health injuries, musculoskeletal injuries and blood and body fluid exposures are
also lower in MR hospitals.38, 72
MR hospitals have significantly better nurse staffing, reflected in nurses caring for fewer
patients each.34, 39 Nurses at MR hospitals reported caring for one fewer patient per shift than did
the nurses in the original magnet hospitals (i.e. hospitals identified in the 1983 study119).96 Data
from the 1997 Annual Hospital Survey of the American Hospital Association (AHA) showed
that MR hospitals employed 190 full time equivalent registered nurses per 100 patients compare
to 109 registered nurses per 100 patients in community hospitals.96
MR has been associated with reduced overtime and flexible staffing schedules. RNs
employed in MR organizations reported that overtime was more often strictly voluntary, whereas
nurses in non-MR hospitals reported higher levels of overtime and felt like it was required.28, 86,
120 Another study also examined satisfaction with scheduling, including hours and flexibility and
found that MR nurses reported higher satisfaction, although comparison of hours worked and
other schedule factors were not reported.86

27
Patient Outcomes
Patient outcome is one of the most important indicators of quality care in health care
institutions.18 Improvements in nursing, through MR, are being recognized as having a major
contribution to quality and safety in patient care.38 MR has been associated with numerous
positive patient outcomes121, which include lower patient mortality and morbidity rates,
decreases in the incidence of adverse patient outcomes122 and higher overall patient
satisfaction.28, 105 A recent study showed that in MR hospitals, patients received care based on
the best and most current evidence.108
MR has demonstrated lower mortality rates and a positive influence on patient
satisfaction, which has key implications for hospitals in the current fiscally driven environment.
Patient satisfaction is considered a prime indicator of quality care123 and is of great importance
for hospital leaders, because winning and keeping consumers is fundamental for survival in the
current health care market.33 Consumers are able to use the MR designation as a reliable way to
choose a good hospital that will provide quality care.105
Organizational Outcomes
The success of MR hospitals can be attributed to the existence of an organizational
framework that promotes and sustains nursing practice. These hospitals are described as having
flat organizational structures, unit-based decision making processes, evidence based practice, a
culture of collaboration and team work, powerful nurse executives and highly qualified nurses.114
In addition to influencing nursing and patient outcomes, these organizational features have been
found to be associated with positive organizational outcomes including improved nurse
recruitment and retention, increased productivity and distinction in the health care market.

28
One of the most promoted benefits of MR is the positive effect on nurse recruitment and
retention. According to research evidence, the structural components in MR hospitals result in
high levels of nursing work satisfaction, which in turn leads to lower vacancy and turnover rates.
One MR facility reported a reduction in nursing turnover from 30% in 2000 to 12% in 2008.124
Another MR facility reported a decrease in nursing vacancy rates from 19% in 2000 to 5% in the
first quarter of 2007.125 Nurses who work at MR hospital are also more likely to stay than those
who do not work in non-MR hospitals. According to the ANCC, the average length of
employment of RNs on staff in a MR hospital is 8.35 years.126
In addition to nurse recruitment, physician and administrative recruitment has been
influenced by the MR designation. New hires have noted that MR is associated with highly
competent and coordinated staff.81 Furthermore, physician satisfaction scores are higher at MR
hospitals compared to non-MR hospitals, which also influences physician recruitment.110
MR hospitals have also been noted for recruiting highly educated nurses. A research
study conducted by Aiken et al. found that RNs working in MR have significantly higher
educational preparation. About 50% of nurses working in MR hospitals had a baccalaureate
degree as their highest level of education, compared to 34% in non-MR hospitals. Moreover,
according to the ANCC, nurses at MR hospitals are more likely to be certified in specialty areas,
maintain continuing education and participate in community programs.18
Compared to non-MR hospitals, MR hospitals have decreased utilization of agency
nurses. Most hospitals utilize agency nurses because there is both an insufficient supply of
nurses currently employed at their respective facilities and a demand for nursing care by patients.
Agency nurses are not as familiar with hospital specific policy, are not long-standing members of
the nursing unit or team, and their practices may be different than those of nurses who have

29
worked in hospitals for an extended period of time. The increased use of agency nurses is
considered a risk factor that could potentially lead to negative patient outcomes.104
The MR designation provides an increased opportunity for hospitals to market
themselves to the patients, physicians and potential nursing personnel.105, 127 Designated
organizations have reported an increase in market share since receiving MR, attributed to
increased physician referrals and consumer preference for quality patient care.110
Patients in MR hospitals were also found to have significantly shorter lengths of stay and
lower utilization of intensive care days.22, 26, 126 One study found that length of stay declined
from 4.86 days to 4.73 days in a MR hospital.128 The reduction in the average length of stay
leads to use of fewer pharmaceuticals and fewer tests116, which results in cost savings.40
Financial Outcomes
Quantifying the costs and financial benefits of MR has been a difficult task for most
organizations; one that requires further research.32 Although the ANCC website and Drenkard
argue the long-term cost savings from MR, there is no consensus that MR is a cost saving
innovation, and as discussed previously, the cost of application and sustaining MR is high.30, 38
Although there is also no evidence that overall MR hospitals cost more than non-MR
hospitals129, a recent study by Jayawardhana et al. (2014) found that inpatient costs for MR
hospitals are higher than non-MR hospitals.41
Aiken et al. states that despite the higher nurse-staffing ratios, MR hospitals will save
money. The shorter lengths of stay and fewer adverse events will lead to reduced use of high-
cost intensive care units, use of fewer pharmaceuticals, performing fewer tests – all of which are
supposed to increase efficiency and contribute to cost effective care.127, 129 A study by McCue et

30
al. (2003) found that increasing nursing staff resulted in increased operating expenses, but no
statistically significant effect on profitability.130
Proponents of MR rationalize the potential financial benefits of MR by linking the
positive organizational, nursing and patient outcomes to cost savings and improved financial
performance.38 According to the research literature, needle stick injuries, morbidity, mortality,
and turnover are lower in MR hospitals compared to non-MR hospitals; each of these variables
has an associated cost savings.32 For instance, studies have reported up to a one-third decrease in
needle stick injuries at a cost of $405 per event.38 In terms of savings from recruitment and
retention, one MR hospital reported a reduction in labour costs of $4 million each year since
2007.124 These cost savings have been attributed to a reduction in recruitment costs, reduction in
orientation costs, productivity gains, and reduced usage of agency nurses.38
According to anecdotal reports, MR may increase bond ratings for borrowing, and reduce
insurance and legal fees.125 The designation is also believed to affect an organization’s ability to
negotiate better reimbursement rates with managed care organizations, and increase
endowments.32 A descriptive study by Tuazon (2007) found that on aggregate, the MR hospitals
outperform the non-MR hospitals in terms of operating margin, total margin, and return on total
assets. However, the analysis of the data was descriptive with no statistical tests conducted when
comparing mean scores of MR and non-MR hospitals.36
Summary
Signaling Research
Although this is not a comprehensive review of the research on signalling, the preceding
literature review provides valuable insight into some of the signaling strategies used in the

31
corporate and hospital setting to signal unobservable firm or product quality to consumers and
other firms. The effect of signaling on financial ratios, firm growth, product demand, consumer
choice, and consumer perception has been assessed and shows mixed results. The concept of
signaling in hospitals has also been studied previously. The focus has been specifically on
patient response to hospital signals, such as the patient perceptions of quality and patient
selection of provider, as measures of signal effectiveness. This outcome measure provides an
indication of the effectiveness of the signal as determined by the patient; however it does not
provide the hospital with any indication of the effect of the signal on hospital performance.
The limitations of the reviewed literature include focusing only on publicly traded firms,
small sample sizes, case studies or single site evaluations, cross-sectional study design, data
collected from surveys, and the application of simple statistics instead of empirical analysis
controlling for relevant factors. While the effect of signaling on firm performance in the
corporate setting using various outcomes has been studied previously, there is minimal research
focusing on the effect of signaling on hospital performance. Specifically, there is an absence of
research examining the relationship between a hospital’s signal of unobserved quality and the
effect of the signal on the dimensions of financial performance, such as reimbursement, market
share, efficiency and profitability.
Signaling Magnet Recognition
Previous research suggests that the MR designation may signal quality information
important to multiple stakeholders including patients, payers and providers. First, MR
designation has been associated with better patient outcomes28, 105, increases in quality care27, 38,
and increases in nurse to patient ratios.34, 39 Patients are expected to interpret the MR signal and

32
respond by seeking care at or referring family and friends to the designated hospital, or by
remaining loyal to the designated facility through repeated visits. Payers (i.e. government and
insurers) are expected to interpret the MR signal and respond by steering patients to designated
hospitals to receive quality patient care18 or increasing reimbursement for health services
accordingly.32 In addition, the actions of patients and payers in response to the signal are
expected to increase the volume of patients to MR designated hospitals.15, 18, 31 Therefore, the
MR signal is believed to affect the hospital’s ability to negotiate better reimbursement rates and
shift towards a more profitable payer mix32 and increase market share through increases in
physician referrals and patient preference for quality patient care.110
MR has also been associated with the promotion of excellence in nursing care86 and
professional nursing practice131, emphasis on collaboration and team work34, 35, and creation of a
positive culture and work environment.33 Nurses and providers are expected to interpret the MR
signal and respond by seeking or maintaining employment in designated hospitals resulting in
reduced nursing turnover, reduced recruitment118, 132 and orientation costs38, reduced usage of
agency nurses38 and increased provider satisfaction.33, 60 These positive labour outcomes have
been associated with cost savings and efficiency.15, 133
The combined proposed effect of the MR signal on increasing revenue, through
increasing reimbursement and market share, and decreasing expenses, through decreasing
hospital cost inefficiency, may culminate to result in an expected improvement in financial
performance for the hospital. Signaling theory is used to develop a framework to explain the
role of MR as a signal used by hospitals to indirectly communicate the underlying quality of a
hospital’s products and services.4 MR hospitals have been theorized to signal to patients and
clinicians that the hospital is a center for nursing excellence and the provider of quality patient

33
care.12 Unfortunately, there is no clear consensus on the effectiveness of the MR signal on the
various dimensions of hospital financial performance.

34
CHAPTER 3: STUDY DESIGN AND METHODS
Overview and Rationale
This study uses a pre-post research design using retrospective administrative panel data
from 2000 to 2010. MR hospitals are matched to never MR hospitals using market and hospital
characteristics. The matched hospital sample is then used to conduct the various statistical
analyses to test each hypothesis. The empirical analysis includes a difference-in-difference
model using hospital fixed effects and a stochastic frontier analysis with random effects. The
dependent variables of interest are hospital reimbursement, hospital market share, hospital cost
inefficiency and hospital financial performance. The key explanatory variable is the MR signal.
The analyses examine the impact of the MR signal on hospital reimbursement, market share, cost
inefficiency and ultimately on financial performance, while controlling for hospital and market
characteristics.
Conceptual Framework
The conceptual framework used in this dissertation is shown in Figure 2. The signaler is
the MR hospital, the signal is the MR designation, the receivers are the patients, payers and
providers, and the feedback is the changes in hospital outcomes that are attributed to the signal.
The MR designation reduces the information asymmetry by signaling the hospitals’ commitment
and dedication to health care quality and quality management strategies to the various
stakeholders.

35
Figure 2. A conceptual framework illustrating the pathway of the Magnet Recognition signal from the signaler to the receiver and the resulting hospital outcomes.
MR is hypothesized to be an effective signal of quality because it is: 1) directly
observable by consumers through marketing, public display of banners, and other advertising by
hospitals16, 60-62, and 2) costly63 and therefore difficult to imitate for providers that do not have
meaningful quality information to convey.64
Research Questions & Hypotheses
Research Question 1: Does the MR signal increase reimbursement and market share of
designated hospitals compared to non-designated hospitals, controlling for known covariates?
MR designation has been associated with better patient outcomes28, 105, higher overall
patient satisfaction28, 105, increases in quality care27, 38, and increases in nurse to patient ratios.34,
39 As a result, patients are expected to interpret the MR signal and respond by seeking care at a

36
MR facility, referring family and friends to a MR designated hospital, or by remaining loyal to
the designated facility through repeated visits. Payers (i.e. government and insurers) are
expected to interpret the MR signal and respond by steering patients to designated hospitals to
receive quality patient care18 or by adjusting reimbursement for health services accordingly.32
Therefore the actions of patients and payers in response to the signal are expected to increase
both the health care reimbursement32 and the volume of patients to MR designated hospitals.18, 31,
134. These findings lead to hypotheses 1a and 1b:
Hypothesis 1a: The MR signal will increase reimbursement of designated hospitals when
compared to non-designated hospitals. MR is believed to affect the hospital’s ability to negotiate
better reimbursement rates with managed care organizations or result in a shift towards a more
profitable payer mix.32
Hypothesis 1b: The MR signal will increase market share of designated hospitals
compared to non-designated hospitals. MR provides an opportunity for hospitals to market
themselves105, 127 and MR is theorized to signal to patients and clinicians that the hospital is a
center for nursing excellence and the provider of quality patient care.12 The MR signal is
proposed to increase market share through increases in both physician referrals and patient
preferences for receiving quality patient care.110
Research Question 2: Does the MR signal decrease hospital inefficiency in designated
hospitals compared to non-designated hospitals, controlling for known covariates?
In addition to positive patient-level outcomes121, MR has also been associated with the
promotion of excellence in nursing care86 and professional nursing practice131, emphasis on
collaboration and team work34, 35, and creation of a positive culture and work environment.33
Providers are expected to interpret the MR signal and respond by seeking or maintaining

37
employment in designated hospitals resulting in reduced nursing turnover, reduced
recruitment118, 135 and orientation costs38, reduced usage of agency nurses38 and increased
provider satisfaction.33, 60 These positive labour outcomes have been proposed to be associated
with cost savings and operating efficiency.15, 133 These findings lead to hypothesis 2:
Hypothesis 2: The MR signal will decrease hospital cost inefficiency in designated
hospitals. MR proposes to reduce hospital cost inefficiency by increasing productivity38 and
reducing costs through nurse autonomy33, promotion of innovation131 and discovery of quality
improvements13, and the delivery of evidence based care.127, 129 The combination of all these
outcomes will result in a decrease in hospital cost inefficiency.
Research Question 3: Does the MR signal improve financial performance of designated
hospitals compared to non-designated hospitals, controlling for known covariates.
Reimbursement and market share (Research Question 1) and inefficiency (Research
Question 2) are conceptualized as pathways through which the MR signal will benefit designated
hospitals. Increasing reimbursement and market share may increase revenue generation and
decreasing hospital cost inefficiency may reduce expenditures; therefore, if the MR signal is
effective, a final outcome is expected to be an overall improvement in hospital financial
performance. This leads to hypothesis 3:
Hypothesis 3: The MR signal will improve the financial performance of designated
hospitals. This hypothesis represents the combined effects of hospital reimbursement, market
share and inefficiency. These outcomes are interrelated and have also been theorized to affect
hospital financial performance.38, 136, 137

38
Research Design
This dissertation applies a pre-post research design, using MR and never MR hospitals, to
measure the effect of the MR signal on hospital reimbursement, market share, cost inefficiency
and financial performance (Figure 3). This research design attempts to control for observable
and unobservable factors that will potentially contribute to the difference between pre-test and
post-test results and between the MR and never MR hospitals.
Figure 3. A pre-post research design using MR and never MR hospitals and three time periods (Pre-test, Intervention, and Post-test).
There are two study groups:
1. Treatment. “Magnet Recognized Hospitals” are hospitals that achieved MR anytime during
the study period.
2. Control. “Never Magnet Recognized Hospitals” are hospitals that never achieved MR prior
to, during or after the study period. This sub-sample excludes hospitals that have received
MR prior to 2000 and after 2010. The remaining never MR hospitals are used in the
matching process, described below.
There are three study periods:

39
1. Pre-test: Two years prior to the implementation period, when the hospital is not pursuing
MR.
2. Implementation: Two years prior to the initial MR designation, when the hospital is
preparing for MR. According to research literature, hospitals require approximately two
years to transform into a MR hospital.138
3. Post-test: The year of initial MR designation and subsequent years of designation. Two years
are required.
Data
This research study uses secondary data from four sources:
1. Healthcare Cost Reports Information System (HCRIS), which includes data for hospitals that
filed Medicare and Medicaid cost reports and includes hospital characteristics, utilization,
cost and charge by cost center, and other financial variables and operational characteristics.
2. Area Resource File (ARF) and other census data provide estimates of market population, area
demographics, household income and socioeconomic characteristics to describe hospital
demand and market characteristics.
3. American Hospital Association (AHA) Annual Survey, completed by most U.S. hospitals,
includes information on hospital organization structure, service lines, staffing, expenses,
physician organization structures, beds, utilization and facilities and services.139
4. American Nurses Credentialing Center (ANCC) website provides information on MR
hospitals. A current listing of MR hospitals and the years of designation are listed on the
Center’s website. The information for each MR hospital has been collected manually and
entered into an Excel® spreadsheet. This data is included in the final merged data set.

40
The four data sets are merged using both a year and a hospital identifier; however the
definition of the year variable differs in the various data sets. The HCRIS data set includes
hospital year observations organized by fiscal year and the ARF, ANCC and AHA data sets
include hospital-year observations organized by calendar year. In order to merge HCRIS data
set, a year-end variable is created using the following rule: the fiscal year end date for each
hospital-year observation (i.e. 6/30/2000) is designated as the year-end variable (i.e. 2000) and is
matched with the calendar year variable.
Study Sample
Figure 4 provides a detailed breakdown of the hospital sample and the exclusion criteria
used to obtain the final data set. The study sample is a longitudinal, unbalanced panel of MR and
never MR hospitals located in urban areas in the US from 2000 to 2010 (eleven years). The
hospital data set consists of 3,431 hospitals (31,163 hospital year observations). Of the 370
Magnet hospitals (4,070 hospital year observations) collected from the ANCC website, 315
Magnet hospitals (3,403 hospital year observations) are identified in the hospital data set. The
remaining 55 Magnet hospitals, which are not found in the hospital data set, include 27
children’s hospitals, 19 rural hospitals, five Veteran Affairs (VA) hospitals, three rehabilitation
hospitals, and one psychiatric hospital.
The study sample excludes duplicate hospital year observations (570) and hospital year
observations if days in period are less than 330 days (1,134). Also hospitals with less than eight
hospital year observations, hospitals that do not have a hospital year observation at year 2000,
and hospitals that receive MR before 2004 and after 2009 are excluded from the study sample
(1,124 hospitals). Each MR hospital must also have four consecutive years of data prior to MR

41
designation, and a maximum of two consecutive years of data following MR designation, for a
maximum of six hospital-year observations. MR hospitals with limited or missing financial data
potentially introduce noise and bias the results; therefore, only MR hospitals that have complete
data over of the required six consecutive years are included. Although this requirement reduces
the sample size, the reduction in the eligible hospital-year observations is trivial.
The final study sample consists of 23,607 hospital year observations (2,199 hospitals)
from 2000 to 2010. There are 21,072 never MR hospital year observations (1,968 hospitals) and
2,535 MR hospital year observations (231 hospitals).

42
Figure 4. Consort diagram presenting the exclusion criteria used in determining the final hospital study sample.
Variables and Measurements
Table 1 is a comprehensive list of variables, measures, definitions and data sources that
are utilized in the dissertation. The variables are grouped into four categories.
Magnet Recognition
The Magnet Recognition Designation variable identifies hospitals as either MR or never
MR. The Hospital Magnet Recognition Status variable identifies the hospital’s status during the
2000 to 2010 time period. A hospital status can be defined as either pre-test period,

43
implementation / status quo period or post-test period. Both MR and never MR hospital year
observations are categorized as either pre-period, implementation / status-quo, or post period
using a binary variable.
Financial Performance Measures
Net patient revenue per adjusted patient day is used to measure hospital reimbursement.
To account for inflation, reimbursement has been adjusted to 2010 US dollars using the Medical
Care Services Consumer Price Index.140 The total expenses, price of capital, and price of labour
are included in the cost function model to estimate hospital inefficiency.
Financial performance is measured using operating profitability, total profitability and
return on equity. Operating margin is a measure of profitability141 and frequently used to assess
the financial health of an organization142 since it is directly affected by changes in either
operating revenue or costs. This ratio focuses on core business operations and therefore excludes
investment income and other types of revenue and expenses unrelated to operating activities.143
Total margin is a measure of total profitability and includes income from both operating
and non-operating activities.144 Positive operating margin and positive total margin reflect
positive financial performance. Return on equity is a measure of organizational performance and
it measures the rate of return for each dollar in equity (net assets).145
Hospital Characteristics
Hospital characteristics include hospital size (measured by total number of beds) which is
associated with reputation, higher economies of scale and financial expertise, lower per unit
costs, and more successful strategic activity.146, 147 System affiliation (determined using the
Medicare Cost Report) indicates whether a hospital is owned by a larger system. Such

44
affiliations have been found to result in increased efficiency, lower risk, better financial
outcomes, seamless care, greater control over referrals, and greater economies of scale.146, 147
Medicare payer mix and Medicaid payer mix are calculated as the percentage of total
inpatient days attributed to Medicare and Medicaid, respectively. These measures provide an
indication of the hospital’s patient-mix 146 and the payer-mix.148 An increased dependence on
government payers, such as Medicare and Medicaid, is likely to be associated with a higher
probability of financial distress and operating losses, because these payers typically do not pay
the full average cost of care.146
Outpatient volume and inpatient volume are both common measures of hospital
productivity. Inpatient volume is measured using total inpatient days, a widely accepted measure
of inpatient workload. Outpatient volume is measured using total outpatient visits and is a
widely accepted measure of outpatient workload, when combined with total inpatient days.149
Both of these variables are included as outputs in the stochastic frontier analysis (SFA) cost
function.150
Since resource consumption varies dramatically between patients classified in different
Diagnosis Related Groups (DRGs), discharges have been adjusted by the Medicare Case Mix
Index (MCMI), which reflects the costliness of DRGs into which the hospital’s patients have
been classified. 150, 151 Since a measure of outpatient MCMI is not available, Percent Emergency
Room Visits (emergency room visits as a percent of total outpatient visits) and Percent
Outpatient Surgery (outpatient surgery as a percent of total outpatient visits) are added to control
for the outpatient case mix.152 Research indicates that patients admitted through the emergency
department and patients who require surgery tend to be more resource intensive groups of
outpatients.151

45
Teaching affiliation indicates if a hospital is a teaching hospital and is used to control for
differences in input quality.150 Teaching hospitals produce different outputs than non-teaching
hospitals (i.e. medical education)153 and are more costly than non-teaching hospitals.154
Teaching hospitals focus on training medical students and consume more inputs such as
instructors, classroom space, diagnostic tests and state of the art technology.154 Teaching
hospitals also attract sicker patients who require more resources because of the education value
this provides to the students 152, 154, 155 and there is consensus that quality of patient care tends to
be higher in teaching than in nonteaching hospitals.153 Teaching hospital status is included in the
model as a binary variable.
Ownership indicates for-profit, not-for-profit ownership or government ownership. Due
to their responsibilities to shareholders, for-profit firms are expected to more aggressively pursue
cost reduction strategies than not-for-profit firms. For-profit firms are also unlikely to be
interested in the adoption of innovations that are unproven or may raise costs39, and as a result,
may have higher operating margins than their not-for-profit counterparts.156
Market Characteristics
A hospital’s operating environment and the market demand for health care services can
also influence hospital financial performance and market share.157 The hospital’s market area is
defined as the county in which the hospital is located.
The total population in the market, the market population density and the percent of the
population age 65 and over describe the demand for hospital services in the market area. The
average per capita income, unemployment rate and poverty rate (percentage of families or
persons in poverty) measures a community’s financial ability to purchase health care services.158

46
The likelihood of a resident to bypass a hospital and seek services at another facility is
proxied by the average distance from residence to hospital, calculated as the (discharge-
weighted) average straight-line distance from the residence ZIP centroid to the local hospital.159
The hospital market share, a measure of the amount of hospital competition in the market
area, is measured as the hospital’s discharges as a percentage of the total discharges in a
hospital’s market area.159 The level of competition within a market may also influence the
likelihood of MR and a hospital’s performance. The Herfindahl-Hirschman index is a measure
of market competition and it is calculated as the sum of the squared market shares (based on
hospital discharges) of hospitals within the market area. The Herfindahl-Hirschman index
represents perfect competition when it registers a score of 0, while a score of 1 represents a
monopolistic market.156 Hospital competition measures the number of hospitals physically
located in the market area and is a measure of suppliers of health care services.
There is a large variation in the location of MR hospitals. Region, captured using U.S.
census regions, is included to control for the effect of hospital location.160 Unmeasured factors
affecting hospital financial performance and market share over time are accounted for using year
dummies.

47
Table 1. Listing of variables, measures, definitions and data sources.
Variable Measure Type Aim Data Source
Magnet Recognition
Magnet Recognition Designation
1, Magnet Recognition Hospital 0, Never Magnet Recognition Hospital
Binary Aim 1, 2, 3 ANCC
Hospital Magnet Recognition Status
0, Pre-Test 1, Implementation 1, Post-Test
Binary Aim 1, 2, 3 ANCC
Financial Characteristics
Reimbursement* Net Patient Revenue per Adjusted Patient Day = Hospital Net Operating Revenue/Adjusted Patient Day
Continuous Aim 1 HCRIS
Total Expenses* Expenditures/Wage Rate, where wage rate is (payroll expenses+employee benefits)/FTE Personnel
Continuous Aim 2 HCRIS
Price of Capital (Depreciation+Interest Expense) / Number of Beds Continuous Aim 2 HCRIS
Price of Labour (Payroll Expenses+Employee benefits) / FTE Personnel
Continuous Aim 2 HCRIS
Operating Profitability* Operating Margin (%) = [(Operating Revenues-Operating Costs)/(Operating Revenues)]*100
Continuous Aim 3 HCRIS
Total Profitability* Total Margin (%) = [(Total Revenues-Total Costs)/(Total Revenues)]*100
Continuous Aim 3 HCRIS
Return on Equity* Return on Equity (%) = [(Operating Revenues-Operating Costs)/(Equity)]*100
Continuous Aim 3 HCRIS
Hospital Characteristics

48
Variable Measure Type Aim Data Source
Hospital size Number of Staffed Beds Continuous Aim 1, 3 HCRIS
System Affiliation 1, System Affiliation; 0, Free Standing Binary Aim 1, 2, 3 HCRIS
Medicare Payer Mix Medicare Inpatient Days/Total Hospital Inpatient Days
Continuous Aim 1, 2, 3 HCRIS
Medicaid Payer Mix Medicaid Inpatient Days/Total Hospital Inpatient Days
Continuous Aim 1, 2, 3 HCRIS
Outpatient Volume Total Outpatient Visits Continuous Aim 2 HCRIS
Inpatient Volume Total Inpatient Days Continuous Aim 2 HCRIS
Medicare Case Mix Index Relative Resource Intensity of the Distribution of Diagnoses Related Groups
Continuous Aim 2 AHA
Percent Emergency Room Visits
(Emergency Department Visits/Outpatient Visits)*100
Continuous Aim 2 HCRIS
Percent Outpatient Surgery (Outpatient Surgeries/Outpatient Visits)*100 Continuous Aim 2 HCRIS
Teaching Affiliation 1, Teaching Affiliation 0, No Teaching Affiliation
Binary Aim 1, 2, 3 AHA
Ownership 1, Not-for-Profit 1, For-Profit 0, Government
Binary Aim 1, 2, 3 AHA
Market Characteristics
Population Total Population in the Market Area (1,000s) Continuous Aim 1, 3 ARF
Population Density Market Population Density (1,000 population per square miles)
Continuous Aim 1, 3 ARF
Percent of the Population 65 and Over
[Total Population Age 65 and Older in Market Area/Total Population in Market Area[*100]
Continuous Aim 1, 3 ARF

49
Variable Measure Type Aim Data Source
Income Average per Capital Income in Market Area (1,000s) Continuous Aim 1, 3 ARF
Unemployment Rate Average Unemployment Rate in Market Area Continuous Aim 1, 3 ARF
Poverty Rate Average Rate of Families or Person in Poverty in Market Area
Continuous Aim 1, 3 ARF
Distance from Residence to Hospital
Average Distance from Place of Residence to Hospital (miles)
Continuous Aim 1, 3 ARF
Hospital Market Share* Hospital Discharges/Total Discharges in Market Area
Continuous Aim 1, 3 ARF
Herfindahl-Hirschman Index The sum of squares of the market shares, expressed as a percentage, held by each firm in an industry. HHI=∑ �������
Continuous Aim 2 ARF
Hospital competition The total number of hospitals in the hospital’s geographical market.
Continuous Aim 1, 3 HCRIS
Region 1, Midwest; 1, Northwest; 1, South; 0, West Binary Aim 1, 2, 3 ARF
Year 2000=0 2001=1 … 2010=1
Continuous Aim 1, 2, 3 ARF
*Measures of Hospital Outcomes used as dependent variables. ANCC (American Nurses Credentialing Center), HCRIS (Healthcare Cost Report Information System), AHA (American Hospital Association), ARF (Area Resource File)

50
Statistical Analysis
The analysis is completed in two phases. In Phase 1, the never MR hospitals are matched
with the MR hospitals and a longitudinal data set is created. In Phase 2, the matched never MR
and MR hospital data set is used to conduct the empirical analysis and test each research
hypothesis.
Phase 1a – Matching the MR and never MR Hospitals
In a pre-post research design, both control and treatment groups are required. The current
study sample of hospitals contains MR hospitals and never MR hospitals. Since the
counterfactual of the MR hospital is not observed in the data (i.e. it is a missing value), the
objective is to use information from the never MR hospitals to impute a missing value for a
hypothetical and not observed outcome.
Since hospitals may have specific characteristics that make them more likely to become
MR, corrective methods, such as propensity score analysis, are recommended to control for
selection bias when analyzing data collected from an observational study design.161 Propensity
score analysis is used to create ideal matched hospitals. The propensity score analysis predicts
the probability that a hospital will achieve MR based on both hospital and market characteristics
for all hospitals during the year 2000 (i.e. the pre-test period). A logit model is used to generate
propensity scores:
��� ����� ��������� � 1|�� � ������ � ��
����
�! � !" # !�$%&���' ()������%���% # !� �*�� ()������%���% # !+����� # , -. �1�

51
The variables employed in the propensity score analysis include hospital characteristics:
Hospital size, System affiliation, Medicare payer mix, Medicaid payer mix, Ownership, Teaching
Affiliation and market characteristics: Population, Percent of the population 65 and over,
Income, Unemployment rate, Hospital competition and Region. The log of the predicted
probability is used as the propensity score, since it approximates a normal distribution, where p
is the predicted probability of becoming a MR hospital.
�&��%��/ ��� � log 3�455 6 -. �2�
A greedy matching algorithm is used to match MR hospitals to never MR hospitals in the
year 2000. A maximum of 1 to 4 nearest neighbour matching within a caliper with replacement
is used. The recommended caliper size is set at 0.25σp, (where 0.25σp denotes the standard
deviation for the estimated propensity scores in the sample).162 Greedy matching requires a
sizable common support region to work. Hospitals that fall outside of the common support
region are excluded since they have no matches. If the common support region is small, the
recommended procedure is to use different specifications (i.e. explanatory variables and/or
functional forms) in the logit model to predict propensity scores and re-check the size of the
common support region.163, 164
In order to create the sample for analysis, MR hospitals are matched with never MR
hospitals in the year 2000. These matched hospitals remained matched throughout the study
period. The never MR hospitals identified in the year 2000 through matching, continue as
control hospitals in the remaining years of the sample (i.e. 2001, 2002, … , 2010). The resulting
sample consist of matched MR (treatment) and never MR (control) hospitals, where Nmatch,MR

52
Hospitals = n(Nmatch,never MR Hospitals). The Nmatch,MR Hospitals is the number of MR hospitals after
matching, Nmatch,never MR Hospitals is the number of never MR hospitals after matching and n is the
number of never MR hospital matches per MR hospital. It has been suggested in the literature
that n=4 is an ideal number of never MR hospitals for each MR hospital.163 Therefore, each
matched MR hospital (1 hospital) and never MR hospitals (maximum of 4 hospitals) are
combined to form a new unit, the hospital pentad. The hospital pentad will aim to simulate the
MR hospital and its counterfactual for all three phases.
It is important to acknowledge the limitations of propensity score in matching MR
hospitals to never MR hospitals. Specifically, no two hospitals are similar in all respects despite
controlling for most characteristics. Even though the analysis plan aims to control for the
selection bias by using propensity scores and matching, it should be noted that propensity scores
only control for observed variables and do not consider the effect of unobserved variables163 in
the selection of MR. This in turn can also result in biased parameter estimates of the likelihood
of becoming MR. One of the drawbacks of using observational data to determine causal
inference is that despite controlling for potential endogeneity attributed to selection bias, there is
a possibility that the parameter estimates will be biased.163
Standardized differences are used to measure covariate balances between the MR
hospitals and never MR hospitals. The standardized difference is the absolute difference in
sample means divided by an estimate of the pooled standard deviation of the variable, expressed
as a percentage.165 The following equations are used to calculate standardized differences.
% 9�::����� � �"";<|=>?@ABCDAEC4=>FGEC@GH|<IJ?@ABCDAECK �JFGEC@GHK
K : �����LL% M����'�% -. �3�

53
% 9�::����� � �"";<|5O?@ABCDAEC45OFGEC@GH|<IPQ?@ABCDAECRS�PQ?@ABCDAECTUPQFGEC@GHRS�PQFGEC@GHT
K : ����/ M����'�% -. �4�
Balancing is considered successful if the standardized differences are less than 10%.
Standardized differences greater than 10% in absolute value indicate serious imbalance.164 In
this situation, the model predicting propensity scores is re-configured and re-run until the
matching successfully removes all significant imbalances. It is recommended using high-order
polynomial terms and/or cross-product interaction terms in the logistic regression and rerunning
the model may help to reduce imbalance between the two groups. For instance, including a
squared term of the covariate that shows significance after matching or a product of two
covariates if the correlation between the two covariates is likely to differ between the two
groups.162
The sample used for the propensity score analysis consisted of 2,199 hospitals (231 MR
hospitals and 1,968 never MR hospitals). The 231 MR hospitals are matched with 584 never MR
hospitals (some never MR hospitals were re-matched with MR hospitals). A weakness in using
the greedy matching model is the reduction in sample size attributed to a small region of
common support, where specific MR hospitals and never MR hospitals cannot be matched (i.e.
the observations fall outside the region of common support). Since each MR is matched with a
maximum of four never MR hospitals, in the year 2000 the sample consists of 231 hospital
pentads for a total of 1,152 hospitals (231 MR hospitals and 921 never MR hospitals).
Using the hospital year observations from the year 2000, standardized differences are
estimated for pre and post matching to assess pre-match imbalance and post-match balance. The
post-match standardized differences are <10% for all the covariates. This confirms that balance
between the MR and the never MR hospitals have been successfully achieved. Figure 5 displays

54
the absolute standardized differences in covariates between the MR and never MR hospitals
before and after propensity score matching.
Figure 5. Absolute standardized differences in baseline covariates between MR hospitals and never MR hospitals, before and after propensity score matching (post-match standardized difference <10% indicates excellent covariate balance).
Phase 1b – Creating the Final Data Set with Matched MR and Never MR Hospitals
The never MR hospitals generated from the propensity score analysis are then identified
in the remaining hospital year observations (from 2001 to 2010). These never MR hospital year
observations are designated as either pre-test, implementation or post-test for the years that
correspond to the pre-test, implementation and post-test of the corresponding matching MR

55
hospitals. This results in an unbalance panel data set of 12,480 hospital year observations (from
2000 to 2010), consisting of 921 never MR hospitals and 231 MR hospitals. Since each hospital
should have a maximum of 6 hospital year observations (2 hospital year observations for pre-
test, 2 hospital year observations for implementation and 2 hospital year observations for post-
test), hospital year observations that are not designated in one of these time periods are excluded
from the final data set. The final data consists of 6,581 hospital year observations consisting of
921 never MR hospitals and 231 MR hospitals. This data set is used for the multivariate
regression analysis described in Phase 2.
Phase 2 – Empirical Analysis
Descriptive Statistics
Descriptive statistics are used to summarize the data. In order to mitigate the effect of
outliers, dependent variables are censored at the 1st and 99th percentile. Bivariate analysis is used
to test for significant differences between the subgroup means for MR hospitals versus never MR
hospitals. The differences between the group means on each measure are analyzed for direction
and statistical significance using t-tests for continuous variables and chi-square test for
categorical variables. Statistical significance is set at α=0.05 for all analyses. Correlation
analysis is completed to identify potential multicollinearity among the independent variables.
The analysis is conducted using Stata 11.1 (College Station, Texas).166
Multivariate Regression Analysis
Two different multivariate regression analyses are utilized to test the hypotheses
described in this dissertation. For Research Questions 1 and 3, a difference-in-difference model

56
using hospital fixed effects is used, and for Research Question 2, a stochastic frontier analysis is
used.
Difference-in-Difference Model Using Hospital Fixed Effects
A difference-in-difference model with hospital fixed effects is used for Aims 1 and 3 of
the analysis. The following standard regression model is used for the analysis of each aim:
$%&���' WL��X�YZ� !" # !�[���X���YZ # !�\X&'�X����������]YZ # !+�%�[�%����]YZ # !̂ [���X���YZ _ \X&'�X����������]YZ # !`[���X���YZ _ �%�[�%����]YZ # !a[�X�YZ # !b$%&���' ()������%���%YZ # !c �*�� ()������%���%YZ# ,YZ -. �5�
e)�� ,YZ � fY # MYZ
where h indicates variables that vary by hospital and t indicates variables that vary by time. The
fY refers to the unobserved time-invariant variables, and the MYZ refers to the unobserved time-
variant variables. Fixed effect component, fY, captures unobserved heterogeneity across
hospitals that are fixed over time.167 This is a limitation of the study design and methodology.
Table 2 lists the Hospital outcome variables and associated measures for each aim.
Treatment is a binary indicator of MR for each hospital. The never MR hospital is the referent
variable. The ImplementationPeriod and PostTestPeriod are both binary indicators of hospital
MR status during the study period. The referent variable is the pre-test period. Time (=2000,
2001, 2002, ….,2010) control for the year effects over the study period. The regression analysis
also controls for both Hospital Characteristics and Market Characteristics. Standard errors are
clustered at the hospital level to allow for correlation within hospitals over time.

57
Table 2. Hospital outcomes and measures.
Aim Hospital Outcome Variable Measure Aim 1
Reimbursement � Net Patient Revenue per Adjusted Patient Day
Hospital Market Share � Hospital Discharges as a Percent of Total Discharges in Hospital’s Market Area
Aim 3 Profitability � Operating Margin � Total Margin � Return on Equity
Table 3 decomposes the difference-in-difference equation (Equation 5) into individual
components. Each cell corresponds to the marginal effect of the MR signal on hospital outcomes
for each phase of the study time period. The coefficient !� is a measure of the difference in
outcomes (i.e. reimbursement, market share and financial performance) between MR and never
MR hospitals during the pre-test phase of the study. This parameter estimate will determine if
the MR and never MR hospitals are similar or different at the initiation of the study. The
coefficients !� # !̂ are a measure of the difference in outcomes (i.e. reimbursement, market
share and financial performance) between MR hospitals and never MR hospitals during the
implementation phase of the study. This parameter estimate will determine the effects of the MR
signal prior to the commencement of the MR program. The coefficients !� # !` are a measure
of the difference in outcomes (i.e. reimbursement, market share and financial performance)
between MR and never MR hospitals during the post-test phase of the study. This parameter
estimate will determine the effect of the MR signal after the commencement of the MR program.
The coefficient !` is a measure of the overall effect of the MR signal on hospital outcomes (i.e.
reimbursement, market share and financial performance). This estimate is a measure of the
difference in hospital outcomes between MR and never MR hospitals and between post-test and
pre-test attributed to the MR signal. For Aims 1 and 3, !` is the main parameter of interest since

58
it is the measure of the effectiveness of the MR signal on hospital outcomes. The null hypothesis
for these analyses is that MR does not have a causal effect on hospital outcomes, !` � 0. If !` is
determined to be significant, than the hypotheses for Aims 1 and 3 cannot be rejected.
Table 3. Difference-in-difference estimators for the effect of Magnet Recognition
Pre-Test Implementation Post-Test Post-Test – Pre-Test
Never MR Hospitals !" !" # !� !" # !+ !+
MR Hospitals !" # !� !" # !� # !� # !̂ !" # !� # !+# !` !+ # !`
MR Hospitals − Never MR Hospitals
!� !� # !̂ !� # !` hi
Stochastic Frontier Analysis
Stochastic Frontier Analysis (SFA) is used in Aim 2 to estimate the effect of the MR
signal on hospital inefficiency. This method focuses specifically on cost inefficiency, which
arises when a firm does not maximize output given a set of inputs consumed and/or when the
firm does not select the optimal input mix, given the prices of inputs and the technology
available.150, 153 Estimated hospital level cost inefficiency is the percentage by which observed
costs exceed minimum costs predicted for the best-practice frontier.168
SFA is an econometric technique, which uses regression analysis to estimate a cost
function, except the difference being that inefficiency of a hospital is measured using the
residuals from the estimated equation.169 Maximum Likelihood estimation is used to estimate
the parameters of the model.170 Once the parameters in the model are estimated, the inefficiency
term is extracted from the composed error term.171

59
SFA is based on the assumption that departures from the cost frontier can be decomposed
into stochastic and deterministic factors.172 The former represents random error and the latter
represents inefficiency. The estimation of hospital cost inefficiency requires technical
assumptions about the structure of costs and about the statistical distribution of the error term
representing inefficiency.173, 174 The application of SFA to panel data has been suggested to less
likely yield biased estimates of the βs due to omitted variables and because panel models require
fewer distributional assumptions about deterministic error.152, 175
A single-stage stochastic frontier panel model with random effects is used to analyze the
determinants of cost inefficiency in MR hospitals. In this model, all of the independent variables
are included in one equation.154 This approach has the advantage of producing more efficient
parameter estimates.176 The following empirical model is used for this analysis:
[(YZ � :�jYZ, lYZ� # ∑ m�( �YZ� # �YZ -. �6�
e)�� �YZ � MYZ # LYZ
Where TC is hospital h’s total costs at time t; Y is a vector of outputs (i.e. outpatient visits and
number of inpatient days); W is a vector of input prices (i.e. price of capital and labour); CM is a
vector of variables influencing quality of care and accounts for variation across a hospital’s
outputs, such as teaching status, case mix complexity, etc., and eht is the error term. The error
term, eht, is composed of vht, which is the statistical noise (i.e. assumed to be distributed as
N(0,σ2)) and independent of uh.177 The uh consists of positive departures from the cost frontier
and represents cost inefficiency178 and is often assumed to be iid N|(0,σ2)|.169 The half normal
assumption is based on the idea that larger values of cost inefficiency are less likely than smaller

60
values of cost inefficiency.177 The observations are indexed by a hospital index h = 1, 2, …, n
and a time index t = 1, 2, …., T.152
SFA requires the specification of functional form for the cost equation. Common
functional forms used in the empirical research have been translog and Cobb-Douglas cost
functions. The translog form is preferred because of the increased flexibility; however this
requires the inclusion of an increased number of parameters to estimate and may result in
multicollinearity problems.179
The general form of the translog cost model is used to estimate the stochastic frontier for
hospitals, which is stated as the following:
ln [(YZ � p" # q pr ln jrYZs
r��
# q !t ln ltYZ # 12 q q urv ln jrYZ ln jvYZ #
s
v��
s
r��
w
t��
12 q q mtx ln ltYZ ln lxYZ
w
x��
w
t��
# q q yrt ln jrYZltYZ # q z�( �YZ # {j��YZ # MYZ # LYZ|
��� -. �7�
w
t��
s
r��
Where TC is total expenses, Y is outputs, W is input prices, CM is variables influencing quality of
care, Year is time-trend variable, vht is a two-sided randomly distributed error term, and uht is a
non-negative term, indicating the proportion by which hospital h’s costs exceed their feasible
minimum due to inefficiency.
A time-varying model proposed by Battese and Coelli is used to estimate hospital
specific cost inefficiency.180 In this model the inefficiency-effects are defined by:
LYZ � u~YZ # eYZ , LYZ � 0. -. �8�

61
where Zht is a vector of explanatory variables associated with the inefficiency-effects; δ is a
vector of unknown parameters to be estimated; and wht are unobservable random variables,
assumed to be independently distributed, obtained by truncation of the normal distribution with
mean zero and unknown variance, σ2.150
In addition to providing estimates of cost inefficiency, this model permits an estimation
of the impact of both firm specific and environmental factors on cost inefficiency.181 By
including time in the Z vector with other firm-specific variables, inefficiency can differ by firm
and by time.
The parameters of the cost frontier are simultaneously estimated by a maximum
likelihood method using the FRONTIER 4.1 program, which uses a random effects regression
technique.182 A limitation the random effects model is that the effects must be assumed to be
uncorrelated with the regressors.174 Fixed effects is an alternative to this model; however this
model cannot be used in a data set that has variables that are invariant over time.183
This model estimates inefficiency and the parameters of the inefficiency-effects variables
simultaneously (one-stage method). Inefficiency-estimates can also be obtained using a two-
stage estimation procedure, where the inefficiency-estimates from the first stage are regressed
against inefficiency-effects variables in a second stage. The two-stage estimation procedure has
been found to provide parameter estimates of the inefficiency-effect variables that are inefficient
or more likely biased than those from the one-stage method.176, 182
The cost inefficiency of the hth hospital in the tth year (where t ranges from 1 in 2000 to
11 in 2010) is defined as the ratio of the stochastic frontier total costs to observed total costs.
The stochastic total cost frontier is defined by the value total costs would be if uht (i.e., the cost
inefficiency effect) was zero (i.e., full efficiency). Therefore

62
(-YZ � ��&��LYZ� -. �9�
where CEht = cost efficiency and uht was defined previously.
This indicates that cost efficiency is no greater than 1 and the reciprocal of this quantity,
exp(uht) is no less than one. The amount by which exp(uht) exceeds one is a measure of cost
inefficiency.152, 155

63
CHAPTER 4: THE EFFECT OF THE MAGNET RECOGNITION SI GNAL ON HOSPITAL REIMBURSEMENT AND MARKET SHARE
Overview
In this Chapter, the focus is on examining the effect of the Magnet Recognition (MR)
signal on both hospital patient reimbursement and market share. If consumers and purchasers
interpret the MR designation as a signal of high quality care, then demand for MR hospitals
should increase and lead to an increase in market share and revenue. Data from the American
Hospital Association Annual Survey, Medicare Hospital Cost Reports, Area Resource File and
American Nurses Credential Center is used for the analysis. Propensity score matching is used
to select comparable hospital matches from the panel data set. The matched hospitals are used to
construct the final study sample. Then a difference-in-difference model with hospital fixed
effects is applied to the matched hospital sample to test the effect of the MR signal, while
controlling for both hospital and market characteristics. Results indicate that the MR signal does
not affect either patient reimbursement or market share of designated hospitals compared to non-
designated hospitals.
Introduction
Hospitals in the U.S. face ongoing financial challenges as they strive to achieve their
missions. These facilities are struggling to operate in a turbulent healthcare environment,
consisting of a large population of uninsured and underinsured patients79, changing

64
reimbursement policies, broadening regulatory requirements, increasing emphasis on quality care
outcomes, and declining economic conditions.11 In addition to these circumstances, hospitals are
also coping with an aging workforce, a high percentage of elderly patients, high acuity patients
and patients with multiple co-morbidities.79, 184 Despite rising costs and limited opportunities to
increase revenue, hospitals are trying to survive and maintain the delivery of high quality
healthcare services. In order to mitigate these effects and ensure continued financial viability,
many hospitals are employing strategies that will provide a distinct advantage and differentiate
them from other hospital competitors, potentially providing opportunities to increase revenue
through either market share and/or reimbursement. One way a hospital can distinguish itself is
by signaling the underlying quality of its products and services.
Signals are used to reduce information asymmetry, which is defined as an imbalance of
information between two parties, where one party has more information than another party.
Signals are often used in healthcare to communicate the underlying quality of a hospital’s
products and services. The information contained in the signal permits consumers to make
informed decisions and to distinguish between high quality and low quality products. Healthcare
providers attempt to communicate the quality of their services to prospective patients and/or
employees in a variety of ways.9 Some communicate directly using public reporting of quality of
care information.10 Others communicate indirectly, or signal, unobservable information to
consumers by attaining a costly, coveted quality designation, which the consumer can interpret
as the firm’s commitment of resources to quality management.58 The quality information
conveyed by the signal then leads consumers to update their perceptions2, 43 about product and
service quality within the context of market conditions.44

65
MR designation is an example of a signal employed by hospitals to communicate to
patients, providers and payers, the hospital’s dedication and commitment to health care quality
and quality management.9 MR is a quality designation given by the American Nurses
Credentialing Center to hospitals and long term care facilities18, 19 to recognize organizations as
centers of nursing excellence.86 Pursuing and sustaining MR requires the commitment of time
and the investment of substantial human and financial resources by the hospital,21, 22 and the
designation has gained widespread attention in both research24, 25 and practice26 over the past two
decades. MR is considered to be a symbol of distinction11 and has been theorized to signal to
patients and to health care providers, the hospital’s dedication and commitment to quality patient
care.13-15
There is growing evidence (empirical and anecdotal) that MR hospitals are associated
with positive nursing, patient and organizational outcomes.24, 25 These outcomes are interrelated
and have also been theorized to affect both hospital reimbursement and market share through
signaling delivery of quality care to payers, patients, and providers. Under this theory, payers
(i.e. government and insurers) interpret and respond to the MR signal by either 1) steering
patients to designated hospitals to receive quality patient care18 and/or 2) increasing
reimbursement for health services in high quality hospitals.32 Likewise, patients interpret the
MR signal and respond by seeking care at or referring family and friends to the designated
hospital, or by remaining loyal to the designated facility through repeated visits. Lastly,
providers interpret the MR signal by referring patients to designated hospitals where they will
receive quality patient care. Despite these theories, there have been no research studies that have
empirically evaluated the effect of the MR signal on either hospital patient reimbursement or
market share.

66
The purpose of this research study is twofold:
(1) To investigate the effect of the MR signal on hospital reimbursement. It is
hypothesized that the MR signal will increase reimbursement of designated hospitals, and
(2) To investigate the effect of the MR signal on hospital market share. It is hypothesized
that the MR signal will increase market share of designated hospitals.
This study contributes to the evidence of signaling unobserved quality by hospitals in two
ways. First, although the more general effect of signaling on firm performance using various
outcomes has been studied previously, there is minimal research investigating the effect of
signaling in the hospital industry. Second, although there is a large volume of studies conducted
on MR hospitals, these research studies have been dominated by case studies, single-site
evaluations33 and cross sectional survey studies with convenience samples of organizations and
staff respondents.185 With the increased number of MR hospitals, it is now possible to design
longitudinal research studies that address issues of modest sample size and omitted variable bias.
This study uses externally reported administrative and financial information and employs a
robust methodological approach and innovative analytical techniques to evaluating the effect of
MR on hospital reimbursement and market share.
The outcomes of this research will inform managers and policy makers about the
effectiveness of the MR signal at changing hospital reimbursement and market share, and thus its
utility as a potential strategy to improve the hospital’s marketability and financial health,
especially in a highly competitive market area.

67
Research Design and Methods
Research Design
This study applies a pre-post research design to measure the effect of the MR signal on
hospital reimbursement and market share. This research design attempts to control for
observable and unobservable factors that will potentially contribute to the difference between the
pre-test and post-test results. The observations are divided into two groups. The treatment
group, hereafter referred to as “MR hospitals”, includes hospitals that have achieved MR
anytime during the study period. The control group includes hospitals that have never achieved
MR prior to, during, or after the study period. This sub-sample excludes hospitals that have
received MR prior to 2000 and after 2010. The control hospitals are referred to as “Never-MR
hospitals”.
Three study periods are used. The pre-test period is defined as a minimum of two years
when the hospital is not pursuing MR. The pre-test period is a baseline measure, before the
hospital is actively pursuing MR. The implementation period is defined as two years prior to the
initial MR designation, when the hospital is preparing for MR. According to the research
literature, hospitals pursuing the MR designation require approximately two years to transform
and become a MR hospital.138 The implementation period aims to control for any changes in
hospital characteristics and outcomes that may occur during the transition to becoming a MR
hospital. The post-test period is defined as the year of initial MR designation and one
subsequent years of designation.
Data Sources
The hospital data for this analysis are obtained from Medicare’s Hospital Cost Report
Information System (HCRIS), the American Hospital Association’s (AHA) Annual Survey of
68
Hospitals, the Area Resource File (ARF) and the American Nurses Credentialing Center
(ANCC) website.
The four data sets are merged using both a year and a hospital identifier; however the
definition of the year variable differs in the various data sets. The HCRIS data set includes
hospital year observations organized by fiscal year and the ARF, ANCC and AHA data sets
include hospital-year observations organized by calendar year. In order to merge HCRIS data
set, a year-end variable is created using the following rule: the fiscal year end date for each
hospital-year observation (i.e. 6/30/2000) will be designated as the year-end variable (i.e. 2000)
and is matched with the calendar year variable.
Study Sample
The study sample is a longitudinal, unbalanced panel of MR and never MR hospitals
located in urban areas in the US from 2000 to 2010 (eleven years). The initial data set consists
of 3,431 hospitals (31,163 hospital year observations). Duplicate hospital year observations,
hospital year observations with fewer than 330 days in the Medicare cost report period, hospitals
with fewer than 8 hospital year observations, hospitals that do not have a hospital year
observation at year 2000, and hospitals that received MR before 2004 and after 2009 are
excluded from the data set.
In addition, to remain in the final study sample, each MR hospital must have four
consecutive years of data prior to MR designation, and two consecutive years of data following
MR designation, for a total of six hospital-year observations. MR hospitals with limited or
missing financial data potentially introduce noise and bias the results; therefore, only MR
hospitals that have complete data over the required six consecutive years are included. Although

69
this requirement reduces the sample size, the reduction in the eligible hospital-year observations
is trivial.
The final sample consists of 23,607 hospital year observations (2,199 hospitals) from
2000 to 2010. This includes 21,072 never MR hospital year observations (1,968 hospitals) and
2,535 MR hospital year observations (231 hospitals).
Propensity score analysis is used to create a study sample of matched MR hospitals and
never MR hospitals. Using data from the year 2000, the propensity score analysis predicts the
probability that a hospital will ever achieve MR as a function of hospital and market
characteristics in 2000. A greedy matching algorithm is used to match MR hospitals to never
MR hospitals in the year 2000. Following the recommendation by Guo, a 1 to 4 nearest
neighbour matching within a caliper without replacement is used.163 As suggested by
Rosenbaum, the caliper size is set at 0.25σp, (where 0.25σp denotes the standard deviation for the
estimated propensity scores in the hospital sample).162 The matches from 2000 serve as the
matches for the remainder of the study period.
This results in an unbalanced panel data set of 12,480 hospital year observations (from
2000 to 2010), consisting of 921 never MR hospitals and 231 MR hospitals. Since each hospital
should have a maximum of 6 hospital year observations (2 hospital year observations for pre-
test, 2 hospital year observations for implementation and 2 hospital year observations for post-
test), hospital year observations that are not designated in one of these time periods are excluded
from the final data set. The final study sample consists of 6,581 hospital year observations
consisting of 921 never MR hospitals and 231 MR hospitals. Standardized differences are used
to measure covariate balances between the MR hospitals and the matched never MR hospitals.

70
The post-match standardized differences are <10% for all the covariates. This confirms that
balance between the MR and the never MR hospitals has been successfully achieved.
Variables and Measurements
Table 4 is a comprehensive list of variables, measures, definitions and data sources that
are utilized in this analysis. The variables are discussed in detail below.
Dependent Variables
Net patient revenue per adjusted patient day is used to measure hospital reimbursement.
The adjusted patient day is defined as the sum of inpatient days and equivalent patient days
attributed to outpatient services. The MR signal is believed to affect the hospital’s ability to
negotiate better reimbursement rates with managed care organizations or result in a shift towards
a more profitable payer mix.32 To account for inflation, reimbursement has been adjusted to
2010 US dollars using the Medical Care Services Consumer Price Index.140
Hospital market share, a measure of the amount of hospital competition in the market
area, is measured as the hospital’s discharges as a percentage of the total discharges in a
hospital’s market area.159 The hospital’s market area is defined as the county in which the
hospital is located. MR provides an opportunity for hospitals to market themselves105, 127 and is
theorized to signal to patients and clinicians that the hospital is a center for nursing excellence
and a provider of quality patient care.12 The MR signal is hypothesized to increase market share
through increases in either payers steering patients towards a MR hospital, physician referrals or
patient preferences for quality patient care.110

71
Independent Variables – Main Explanatory Variable
The Magnet Recognition Designation variable identifies hospitals as either MR or never
MR. The Hospital Magnet Recognition Status variable identifies the time period as either pre-
test, implementation, or post-test during the six year period over which each hospital is observed.
Independent Variables – Control Variables
Hospital Characteristics
Hospital characteristics are noted to be associated with a hospital’s financial health.157
These characteristics include a hospital’s structural factors and processes, which influence
hospital operations, marketability and ability to earn revenue.
Hospital characteristics include hospital size (measured by total number of beds) which is
associated with higher economies of scale and financial expertise, lower per unit costs, and more
successful strategic activity.146, 147 System affiliation (determined using the Medicare Cost
Report) indicates whether a hospital is owned by a larger system. Such affiliations have been
found to result in increased efficiency, lower risk, better financial outcomes, seamless care,
greater control over referrals, and greater economies of scale.146, 147
Medicare payer mix and Medicaid payer mix are calculated as the percentage of total
inpatient days attributed to Medicare and Medicaid, respectively. These measures provide an
indication of the hospital’s patient-mix 146 and the payer-mix.148 An increased dependence on
government payers, such as Medicare and Medicaid, is likely to be associated with lower patient
revenue, because these payers typically do not pay the full average cost of care.146
Teaching affiliation indicates if a hospital is a teaching hospital or a non-teaching
hospital. Teaching hospitals are known to have higher costs than non-teaching hospitals.155

72
Teaching affiliation is included as a binary variable in this analysis. Ownership indicates for-
profit, not-for-profit or government ownership. These variables are included to control for
internal pressure for cost reduction associated with ownership.186 Due to their responsibilities to
shareholders, for-profit firms are expected to more aggressively pursue cost reduction strategies
than not-for-profit firms. For-profit firms are also unlikely to be interested in the adoption of
innovations that are unproven or may raise costs39, and as a result, may have higher operating
margins than their not-for-profit counterparts.156
Market Characteristics
A hospital’s operating environment and the market demand for health care services can
also influence hospital financial performance and market share.157 The hospital’s market area is
defined as the county in which the hospital is located.
The total population in the market, the market population density and the percent of the
population age 65 and over describe the demand for hospital services in the market area. The
average per capita income, unemployment rate and poverty rate (percentage of families or
persons in poverty) measures a community’s financial ability to purchase health care services.158
The likelihood of a resident to bypass a hospital and seek services at another facility is proxied
by the average distance from patient residence to hospital, calculated as the average distance
between the residence ZIP centroid of each Medicare discharge and the hospital.159 Hospital
competition measures the number of hospitals physically located in the market area and is a
measure of suppliers of health care services.
There is a large variation in the location of MR hospitals. Region, captured using U.S.
census regions, is included to control for the effect of hospital location.160 Annual unmeasured

73
factors affecting hospital financial performance and market share over time are accounted for
using year dummies.

74
Table 4. Listing of variables, measures, definitions and data sources.
Variable Measure Type Data Source
Dependent Variable
Reimbursement Net Patient Revenue per Adjusted Patient Day = Hospital Net Operating Revenue/Adjusted Patient Day
Continuous HCRIS
Hospital Market Share Hospital Discharges/Total Discharges in Market Area Continuous ARF
Magnet Recognition
Magnet Recognition Designation 1, Magnet Recognition Hospital; Never Magnet Recognition Hospital (referent)
Binary ANCC
Hospital Magnet Recognition Status Pre-Test (referent); Implementation; Post-Test Binary ANCC
Hospital Characteristics
Hospital size Number of Staffed Beds Continuous HCRIS
System Affiliation System Affiliation; Free Standing (referent) Binary HCRIS
Medicare Payer Mix Medicare Inpatient Days/Total Hospital Inpatient Days Continuous HCRIS
Medicaid Payer Mix Medicaid Inpatient Days/Total Hospital Inpatient Days Continuous HCRIS
Teaching Affiliation Teaching Affiliation; No Teaching Affiliation (referent) Binary AHA
Ownership Not-for-Profit; For-Profit; Government (referent) Binary AHA
Market Characteristics
Population Total Population in the County (1,000s) Continuous ARF
Population Density County Population Density (population per square miles) Continuous ARF

75
Variable Measure Type Data Source
Percent of the Population 65 and Over [Total Population Age 65 and Older in Market Area/Total Population in County]*100
Continuous ARF
Income Per Capita Income in Market Area (1,000s) Continuous ARF
Unemployment Rate Unemployment Rate in Market Area Continuous ARF
Poverty Rate Percent/proportion of Families or Person in Poverty in Market Area
Continuous ARF
Distance from Residence to Hospital Average Distance from Place of Residence to Hospital (miles) Continuous ARF
Hospital Competition The total number of hospitals in the hospital’s geographical market.
Continuous HCRIS
Region Midwest; Northwest; South; West (referent) Binary ARF
Year 2000 (referent); 2001…2010 Binary ARF
ANCC: American Nurses Credentialing Center, HCRIS: Healthcare Cost Reports Information System, ARF: Area Resource File, AHA: American Hospital Association
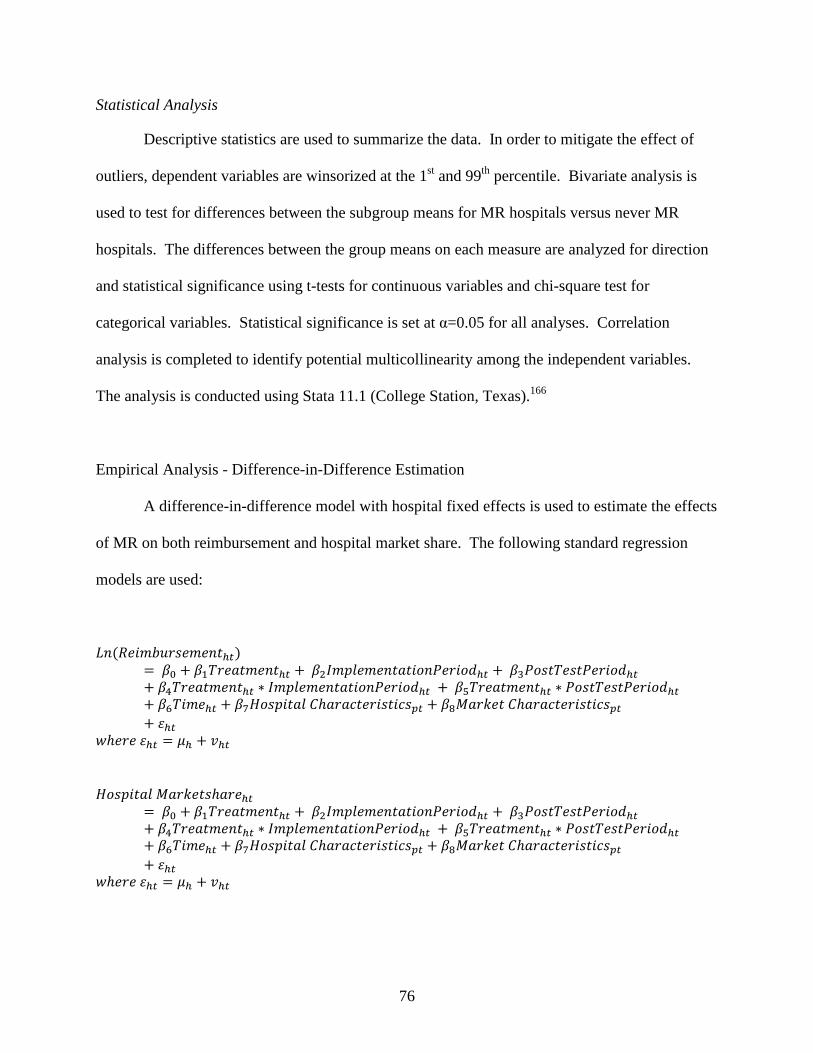
76
Statistical Analysis
Descriptive statistics are used to summarize the data. In order to mitigate the effect of
outliers, dependent variables are winsorized at the 1st and 99th percentile. Bivariate analysis is
used to test for differences between the subgroup means for MR hospitals versus never MR
hospitals. The differences between the group means on each measure are analyzed for direction
and statistical significance using t-tests for continuous variables and chi-square test for
categorical variables. Statistical significance is set at α=0.05 for all analyses. Correlation
analysis is completed to identify potential multicollinearity among the independent variables.
The analysis is conducted using Stata 11.1 (College Station, Texas).166
Empirical Analysis - Difference-in-Difference Estimation
A difference-in-difference model with hospital fixed effects is used to estimate the effects
of MR on both reimbursement and hospital market share. The following standard regression
models are used:
������X�L%�X���YZ�� !" # !�[���X���YZ # !�\X&'�X����������]YZ # !+�%�[�%����]YZ # !̂ [���X���YZ _ \X&'�X����������]YZ # !`[���X���YZ _ �%�[�%����]YZ # !a[�X�YZ # !b$%&���' ()������%���%5Z # !c �*�� ()������%���%5Z# ,YZ
e)�� ,YZ � fY # MYZ
$%&���' �*��%)��YZ� !" # !�[���X���YZ # !�\X&'�X����������]YZ # !+�%�[�%����]YZ # !̂ [���X���YZ _ \X&'�X����������]YZ # !`[���X���YZ _ �%�[�%����]YZ # !a[�X�YZ # !b$%&���' ()������%���%5Z # !c �*�� ()������%���%5Z# ,YZ
e)�� ,YZ � fY # MYZ

77
where h indicates variables that vary by hospital and t indicates variables that vary by time. The
fY refers to the unobserved time-invariant variables, and the MYZ refers to the unobserved time-
variant variables.
The coefficient !� is a measure of the difference in reimbursement and hospital market
share between MR and never MR hospitals during the pre-test phase of the study. This estimate
determines if the MR and never MR hospitals are similar or different at the initiation of the
study. However, since this variable is invariant over time, !� cannot be estimated using hospital
fixed effects regression. Fixed Effects Vector Decomposition (FEVD) is an econometric tool
that has been recommended to estimate the coefficient of time-invariant variables.187
Unfortunately, while the parameter estimates for the time-invariant variables are correct, the
standard errors produced from the FEVD are biased downward, resulting in false conclusions
about statistical significance.188
The coefficient !+ is a measure of the difference in reimbursement and hospital market
share from the pre-test period to the post-test period for never MR hospitals. This estimate
measures the change in the reimbursement and hospital market share that are attributed to market
and hospital factors. The summation !+ # !` is the difference in reimbursement and hospital
market share from the pre-test period to the post-test period for the MR hospitals. Thus, the
difference, !`, is the net effect of the MR signal on reimbursement and hospital market share.
This estimate is a measure of the difference in reimbursement and hospital market share between
MR and never MR hospitals and between post-test and pre-test attributed to the MR signal. In
this study, !` is the main parameter of interest since it is a measure of the effectiveness of the
MR signal on both reimbursement and hospital market share.

78
Results
Table 5 presents the descriptive statistics of the study sample. A comparison between
MR hospitals and never MR hospitals reveals that MR hospitals receive higher reimbursement
and have higher market share than never MR hospitals. The net patient revenue per adjusted
patient day for MR hospitals is $3,518 versus $3,118 for never MR hospitals (p=0.000) and the
hospital market share for MR is 19.5% versus 18.0% for never MR hospitals (p=0.045).
Table 6 presents the difference-in-difference estimates of the effect of the MR signal on
hospital reimbursement and market share, controlling for hospital and market characteristics and
including hospital fixed effects. Since the Magnet Recognition Hospitals (MR hospitals and
never MR hospitals), Hospital size (Total beds), and Regions (Northeast, Midwest, and South)
variables are time-invariant, these variables do not remain in the regression model.
The results of the difference-in-difference regression model indicate that the relationship
between the MR signal and both reimbursement and hospital market share is modest – a 1.7
percent increase in revenue and 0.31 percentage point increase in market share – but both are
statistically non-significant. The results also indicate that for-profit hospitals have an 11%
greater reimbursement compared to government hospitals and hospitals affiliated with a teaching
institution have 3.3% lower reimbursement compared to non-teaching affiliated hospitals.
Table 6 also shows that Medicare payer mix, population density, percent of population 65
and over, hospital competition and year variables are significantly associated with hospital
market share. A one percentage point increase in Medicare payer mix is associated with a 0.058
percentage point increase in hospital market share. Population density and percent of population
65 and over are associated with 0.018 and 0.70 percentage point decreases in hospital market
share, respectively. An increase of one additional hospital in a hospital’s market area is

79
associated with a 0.13 percentage point decrease in hospital market share. All the year variables
(from 2001 to 2010) are associated with a significant increase in hospital market share compared
to the year 2000, suggesting increasing market share over the eleven year time period. This can
be attributed to an increase in the number of total discharges per hospital per year potentially due
to population growth in the hospital’s market area.

80
Table 5. Summary statistics of dependent and independent variables (N=6,581 hospital year observations) from 2000 to 2010
All Hospitals (N=6,581 hospital year observations & 1,152
hospitals)
Never Magnet Recognition Hospitals
(N=5,246 hospital year observations & 921
hospitals)
Magnet Recognition Hospitals
(N=1,335 hospital year observations & 231
hospitals)
P Value
Mean Standard Deviation Mean
Standard Deviation Mean
Standard Deviation
Dependent variable Reimbursement* 3,203.72 1,051.92 3,117.64 1,006.67 3,518.54 1,149.75 0.000 Hospital market share (%) 18.30 24.30 18.00 24.40 19.50 23.90 0.045
Magnet Hospital Recognition Status
Pre-test (%) 33.10 - 33.10 - 33.00 - 0.895 Implementation (%) 34.50 - 34.50 - 34.40 - 0.924 Post-test (%) 32.40 - 32.30 - 32.70 - 0.818
Hospital Characteristics Hospital size (Total beds) 445.00 333.00 439.00 340.00 466.00 302.00 0.080 System affiliation (%) 29.70 - 29.70 - 29.60 - 0.948 Medicare Payer Mix (%) 38.50 14.30 38.30 15.00 39.00 11.30 0.094 Medicaid Payer Mix (%) 11.90 9.70 12.00 10.10 11.50 7.83 0.090 Not-for-profit hospital (%) 86.10 - 86.00 - 86.20 - 0.844 For-profit hospital (%) 4.30 - 4.40 - 4.00 - 0.505 Government hospital (%) 9.60 - 9.60 - 9.80 - 0.820 Teaching Affiliation (%) 66.60 - 66.50 - 67.20 - 0.662
Market Characteristics Population (1,000s) 3,588.04 4,782.68 3,571.45 4,800.64 3,653.22 4,712.57 0.577 Population density 726.00 737.00 722.00 742.00 742.00 718 0.376 Percent of Population 65 and over (%)
12.00 2.45 12.00 2.48 12.10 2.35 0.422
Income 37,192.05 7,137.81 37,139.18 7,104.58 37,399.79 7,265.89 0.234 Unemployment Rate (%) 5.29 1.79 5.30 1.79 5.25 1.79 0.327

81
All Hospitals (N=6,581 hospital year observations & 1,152
hospitals)
Never Magnet Recognition Hospitals
(N=5,246 hospital year observations & 921
hospitals)
Magnet Recognition Hospitals
(N=1,335 hospital year observations & 231
hospitals)
P Value
Mean Standard Deviation
Mean Standard Deviation
Mean Standard Deviation
Poverty Rate 11.50 2.52 11.50 2.55 11.60 2.43 0.075 Distance from Residence to Hospital
16.60 8.56 16.70 8.61 16.20 8.35 0.046
Hospital competition 10.30 14.50 10.20 14.60 10.90 14.1 0.135 Region
West 14.70 - 15.10 - 13.30 - 0.105 Midwest 31.50 - 31.10 - 33.40 - 0.098 Northeast 19.40 - 19.00 - 21.00 - 0.089 South 34.30 - 34.90 - 32.2 - 0.068
Year 2000 (%) 3.90 - 3.90 - 3.90 - 0.958 2001 (%) 6.60 - 6.60 - 6.60 - 0.996 2002 (%) 9.00 - 9.00 - 9.00 - 0.975 2003 (%) 10.80 - 10.80 - 10.90 - 0.924 2004 (%) 12.70 - 12.70 - 12.60 - 0.913 2005 (%) 13.90 - 14.00 - 13.90 - 0.984 2006 (%) 13.40 - 13.40 - 13.30 - 0.949 2007 (%) 10.70 - 10.70 - 10.70 - 0.983 2008 (%) 8.20 - 8.20 - 8.30 - 0.853 2009 (%) 6.40 - 6.40 - 6.30 - 0.920 2010 (%) 4.40 - 4.40 - 4.50 - 0.861
*Adjusted for 2010 dollars according to the Consumer Price Index.

82
Table 6. Difference-in-difference regression with hospital fixed effects
Dependent Variable ln(Reimbursement) Hospital Market Share (%)
Coefficient Robust SEs Coefficient Robust SEs Hospital Intervention
Magnet Recognition Hospitala, f - - - -
Magnet Recognition Hospital Status Implementationb −0.011 0.0059 −0.18* 0.083 Post-testb −0.010 0.0088 −0.24 0.14 Magnet Recognition*Implementation 0.0037 0.010 0.31 0.17 Magnet Recognition*Post-test 0.017 0.011 0.21 0.22
Hospital Characteristics Hospital Sizef - - - - System affiliation −0.0084 0.0074 −0.031 0.099 Medicare Payer Mix 0.0020 0.0012 0.058** 0.016 Medicaid Payer Mix −0.00018 0.00084 −0.0051 0.011 Not-for-profit hospitale 0.046 0.038 −0.0042 0.22 For-profit hospitale 0.11* 0.052 0.36 0.50 Teaching Affiliation −0.033* 0.013 0.48 0.40
Market Characteristics Population (1,000s) 0.000021 0.000075 0.00053 0.00079 Population Density 0.00023 0.00044 −0.018** 0.0061 Percent of Population 65 and over 0.0295 0.0168 −0.70* 0.29 Income 0.0000012 0.0000023 −0.000053 0.000052 Unemployment Rate 0.00020 0.0037 −0.11 0.077 Poverty Rate 0.00017 0.0024 0.025 0.073 Distance from Residence to hospital −0.0025 0.0026 −0.099 0.056 Hospital competition 0.0027 0.0025 −0.13** 0.032
Region

83
Dependent Variable ln(Reimbursement) Hospital Market Share (%)
Coefficient Robust SEs Coefficient Robust SEs Northeastd, f - - - - Midwestd, f - - - - Southd, f - - - -
Time Year 2001c −0.0091 0.012 0.27* 0.13 Year 2002 c 0.0039 0.015 0.55* 0.25 Year 2003 c 0.021 0.017 0.71* 0.32 Year 2004 c 0.026 0.020 1.03* 0.41 Year 2005 c 0.025 0.022 1.13* 0.51 Year 2006 c 0.028 0.027 1.41* 0.64 Year 2007 c 0.027 0.031 1.84* 0.73 Year 2008 c 0.0015 0.037 2.65** 0.87 Year 2009 c 0.020 0.044 3.31** 0.97 Year 2010 c 0.038 0.049 3.81** 1.08
Constant 7.30** 0.34 39.48** 6.37 Number of Hospital Year Observations 6,154 6,428 Number of Hospitals 1,098 1,136 F Statistic (28, 1,097) = 3.72
p = 0.000 (28, 1,135)=2.38
p = 0.000
aReference is control hospitals; bReference is the pre-test period; cReference is year 2000; dReference is west; eReference is government hospitals; fTime invariant variables. *Statistically significant at the 5% level. **Statistically significant at the 1% level. Fixed effects are at the hospital level.

84
Discussion
Hospitals are motivated to pursue MR for a variety of reasons. These reasons include,
but are not limited to, distinguishing themselves in the market place81, increasing market share15,
18, 31 and negotiating better reimbursement rates with payers32, such as managed care
organizations32, all reasons which may result in potential increases in revenues.136 This
relationship is rationalized through the reputation effect of MR, which is proposed to be a marker
of distinction. The designation provides an opportunity to promote the institution’s success and
it signals to the public that it is recognized as a place to receive high quality care.16, 61, 62 In
addition, the designation acknowledges that nursing services make a positive contribution to
patient outcomes91 thus attracting patients and increasing reimbursement rates, correspondingly
increasing hospital market share and hospital reimbursement.
This study measured the effect of the MR signal on both hospital reimbursement and
hospital market share. In contrast to findings from previous descriptive studies, the empirical
results from this analysis indicate that the MR signal does not have an effect on either hospital
reimbursement or hospital market share.32 Increases in patient volume, which increases hospital
market share, is influenced by various intermediate factors, such as employers, insurers,
managed care organizations, and referring physicians.189 All of these factors may override the
overall effect of the MR signal on hospital market share. In terms of hospital reimbursement, the
major payers include both the government and private health insurers. Government payers
reimburse hospitals using prospective payment systems and may be less responsive to adjusting
reimbursement rates for MR hospitals; whereas private health insurers and managed care
organizations may be more agreeable to negotiating reimbursement rates with these hospitals.
Positive adjustments in reimbursement rates may encourage and reward the focus on quality

85
service delivery and reduction in redundancies of service provision. Any potential increases in
reimbursement rates by private health insurers may be diminished by limited increases or
reductions in reimbursement by government payers.
In terms of hospital ownership, for-profit hospitals appear to receive higher
reimbursement rates compared to government hospitals. This may reflect a greater focus by for-
profit hospitals on well-insured patients or relatively profitable medical services.190 On the
contrary, teaching affiliation was found to be negatively associated with reimbursement rates.
This result is consistent with previous studies that showed teaching hospitals have patients with
more complex health problems requiring both more intensive care and longer inpatient stays that
results in a lower reimbursement per patient day compared to non-teaching hospitals.191
Medicare payer mix was determined to be positively associated with hospital market
share. An increase in Medicare inpatient days is likely attributed to an increase in the volume of
Medicare patients, which may be attributed to population served by the hospital. Population
density, hospital market penetration and the percent of population 65 and over are all negatively
associated with hospital market share. The negative relationship with population density and
hospital competition can be explained by the fact that an increase in the population of an area
increases the number of firms (hospitals) in the area, leading to a reduction in the hospital market
share.192 The negative relationship between the percent of the population 65 and over on market
share is unexpected. The negative effect of the percent of population 65 and over on market
share may be attributed either to a reduction in accessing care from the hospital and accessing
care from other sources such as home care.193

86
Implications
Hospital Market Share
Market share is an indicator used by firms to measure their ability to attract customers
and their success in the market area. Hospitals publicize their MR designation to raise awareness
and to market themselves to patients, nurses and the community.60 Hospitals promote their MR
using full page newspaper advertisements, billboards, websites and television spots.99 The
various forms of advertisement provide an opportunity to promote MR and communicate to the
public that the hospital is recognized as a place to receive high quality care16, 61, 62 and that
nursing services make positive contributions to patient outcomes.91 Hospitals incur enormous
costs in the promotion of the MR. One organization estimated spending $100,000 on educational
and celebratory events, promotional items, and graphic design supports for their communications
campaign.32
Despite the use of costly advertisements and promotional materials, the study results
indicate that the MR signal does not appear to have an effect on hospital market share. This may
have numerous implications for both the MR program and hospitals. From the perspective of the
MR program, both the validity and interpretability of the MR signal by may be debateable;
specifically in-terms of the signal’s ability to attract patients and improve reimbursement. The
MR signal may either not be signalling “nursing excellence and the provider of quality patient
care12” as previously considered or the MR signal may not be interpreted as “superior hospital
performance and the delivery of quality health care services18” by payers, patients and providers.
The ambiguity of the MR signal may have undesirable consequences for the MR program in-
terms of promoting the designation as a mechanism to increase hospital market share.
These results may also prompt hospital CFOs and CEOs to re-evaluate the resources
allocated to the promotion and advertising of MR. Furthermore, the marketing strategy used

87
when promoting the MR signal may need to be reviewed and perhaps revised. While MR has
been associated with various positive benefits for patients, nurses and the organization, these
benefits may not be carried in the MR signal. There may be weaknesses in the MR signal that
may explain the study results. For instance, these benefits may not be in the message carried by
the MR signal. Although MR hospitals are acknowledged as centers of nursing excellence and
the gold standard for nursing care, these accolades and honours may not be communicated by the
MR signal. The MR signal may also not be interpreted by the stakeholders. Patients and
providers may either not associate quality care or nursing excellence with the MR designation or
understand the importance of nursing services to the delivery of quality patient care. Lastly, the
MR signal may not be eliciting the expected response to the signal. While the MR signal may be
recognized and interpreted, patients, payers and providers may not be responding for various
reasons. These reasons may include a lack of urgency to respond and limited control in decision
making for a hospital visit. Despite recognizing the MR signal, the individual may not respond
immediately due to the lack of urgency, i.e. he or she does not need to go to the hospital at that
moment. However, in the case of an emergency, when a patient does need to visit a hospital, the
patient will have limited decision making control; the decision will be determined either by the
physician, the paramedics or the location of the nearest facility that meets the needs of the patient
and the provider.
Hospital Reimbursement
Hospitals and payers try to negotiate reimbursement rates that are fair to both parties. In
order to gain leverage when negotiating reimbursement rates, hospitals often use quality metrics
that demonstrate that the hospital is achieving high quality standards. Quality metrics emphasize

88
the hospital’s commitment to quality management and may even give hospitals an added
advantage in negotiations.194 MR hospitals are recognized for their commitment to nursing
excellence and quality patient care 17 and a growing body of evidence confirms the positive
organizational, nursing and patient benefits associated with Magnet Recognition.83, 84
Regardless of the many positive outcomes for nurses, patients and organizations
associated with MR28 and the emphasis on quality and safety in patient care38, this study
indicates that the MR signal does not have an effect on hospital reimbursement. From the
perspective of hospitals, the CFOs and CEOS may not be leveraging the MR signal as a means to
highlight their quality accomplishments to negotiate better reimbursement rates from the payers.
However, from the payers’ perspective, payers may be unaware that MR signals hospitals
that are classified as the gold standard because of their emphasis on quality and excellence in
nursing care195 90, 196 and may not respond to the signal as predicted. With an increase in the
number of hospitals with MR or an increase in other signals used by hospitals, the MR signal
may lose its distinctiveness and become weakened in the presence of other signals. In this case
hospitals are no longer able to differentiate themselves as centers of excellence in nursing care.
On the contrary, payers may recognize and correctly interpret the MR signal, but may not
consider the information communicated by the signal as important or as valued as other quality
signals utilized by hospitals.
Limitations
There are a few limitations associated with this study. Primarily, there are a number of
variables of interest that were not included in the analysis due to inaccessibility of the data or
inability to measure specific variables, potentially resulting in biased parameter estimates in the
proposed empirical analysis. For example, the scope of services provided has been found to be

89
strongly associated with likelihood of pursuing Magnet designation 197, but is not available in the
existing data set. In addition, the existence of other process management techniques, hospital’s
management style, and measures of organizational culture are unobservable but could affect how
a hospital is managed both financially and operationally. However, the use of fixed effects
regression was intended to control for variables such as these and all other unmeasured fixed
hospital characteristics, which may be time invariant.
Although the analysis attempted to match MR hospitals to never MR hospitals, no two
hospitals are similar in all respects. Propensity scores only control for observed variables and do
not consider the effect of unobserved variables163 in the decision of hospitals to seek MR. For
example, a hospital may seek MR if other quality measures are decreasing. This non-random
decision to seek MR can thus result in biased parameter estimates of the likelihood of MR.
Although the ANCC website lists the current MR designated hospitals, it does not
provide information on hospitals that applied for MR but were unsuccessful, hospitals that are
currently undergoing the transformation to become MR recognized, or hospitals that had their
MR status rescinded due to non-compliance with the program’s requirements.
Conclusion
MR is not intended to improve hospital reimbursement or hospital market share.
However, the MR signal is promoted as a means to inform payers, patients and providers about
the hospital’s commitment to quality and patient care, consequently leading to increases in
market share and increases in reimbursement. However, the results from this study indicate that
the MR signal has no effect on either of these outcomes. Possible explanations may include the
strength of the MR signal, the message carried by the MR signal, the interpretation of the

90
message in the MR signal, and the response or action after receiving the MR signal. All of these
intermediate components that determine a signal’s effectiveness may have contributed to the
results found in this study.
The pursuit of MR is an important organizational decision resulting in substantial
modifications to the structure of organizations and requires considerable investment of time and
resources, initially and ongoing as the process continues. Knowledge of the limited benefit of
the MR signal on hospital reimbursement and hospital market share may cause CEOs and CFOs
of MR hospitals to re-evaluate the advertising and marketing resources dedicated to promoting
and signaling the designation to patients, providers and payers. Resources may be re-allocated to
other pathways that are positively impacted by the MR signal.

91
CHAPTER 5: COST EFFICIENCY OF MAGNET RECOGNIZED HO SPITALS: A STOCHASTIC FRONTIER APPROACH
Overview
This study examines the impact of the Magnet Recognition (MR) signal on hospital cost
inefficiency during the period 2000 to 2010. The panel design includes 1,020 hospitals. The
primary sources of data are the American Hospital Association’s Annual Survey of Hospitals,
Medicare Cost Reports, the Area Resource File, and the American Nurses Credentialing Center.
Hospital cost inefficiency is estimated using a regression technique called stochastic frontier
analysis. The results indicate that overall mean estimated cost inefficiency is lower for MR
hospitals (12.12%) when compared to never MR (15.46%) and cost inefficiency decreased over
the study period. A decrease in cost inefficiency is associated with system affiliation and an
increase in cost inefficiency is associated with for-profit ownership and unemployment rate.
Introduction
Efficiency can be defined as the relationship between inputs and outputs.150 In a
perfectly competitive environment, firms operating inefficiently should go out of business in the
long run, however this is not the case for hospitals. Market imperfections permit inefficient
hospitals to survive and continue operations.198 When resources are combined inefficiently, the
firm incurs increased costs.199 However, applying the concept of efficiency to hospital care is
not straightforward, because neither the outputs produced nor the quality of care is uniform

92
across hospitals.200 In other words, hospitals in the U.S. are described as inefficient because of
the high costs and less-than average outcomes.152
It is assumed that hospitals select a set of inputs that will minimize costs of production
given a certain level of output. The production process, described by the production function,
converts inputs, such as medical and non-medical personnel, buildings, and equipment, into a
given level of output, such as the number of discharges and outpatient visits. However, previous
research has indicated that, on average, hospitals do not achieve minimum costs, which implies
the presence of inefficiency in the production process. Due to the highly decentralized nature of
hospitals, with multiple specialized departments within each hospital, the presence of
inefficiencies is not unexpected.198
Hospitals are being exposed to various approaches to increase the focus on improving
efficiency. Health plans are using provider efficiency ratings in network selection, pay-for-
performance programs, or steering patients toward efficient providers through lower copayments
and/or public reporting.201 One of the major goals of Medicare’s Prospective Payment System
(PPS), which pays hospitals a fixed rate per case, is to promote efficiency by rewarding hospitals
that are able to keep their costs below the PPS rates, and penalizing those that are not.200 The
Medicare Payment Advisory Commission has advocated using efficiency measurements to
improve value in the Medicare program.202 In a time when resources are limited, improving
efficiency is important as this allows more services to be produced from a constant level of
resources without compromising quality.
The MR Program is an option proposed to improve efficiency in hospitals. MR is a
quality designation awarded to hospitals by the ANCC for demonstrating commitment to high
standards in the delivery of nursing care and support for nursing practice throughout the

93
organization.18, 19 MR is proposed to be a marker of distinction and a signal of superior
performance.18 Signals, such as MR, have been utilized by both healthcare and non-healthcare
corporations to communicate unobservable information to stakeholders. Hospitals use signals to
distinguish themselves from other facilities and to attract patients and providers.56
The MR signal has been associated with the promotion of excellence in nursing care86
and professional nursing practice131, a philosophy of evidence-based practice114, emphasis on
collaboration and team work34, 35, and creation of a positive culture and work environment.33
Designated hospitals are recognized as centers of nursing excellence86, which signals to
consumers and to health care providers about the quality of care which they can expect to receive
or provide in a MR hospital.13-15 Providers, such as nurses and physicians, are expected to
interpret the MR signal and respond by seeking or maintaining employment in designated
hospitals resulting in reduced nursing turnover, reduced recruitment118, 132 and orientation costs38,
reduced usage of agency nurses38 and increased provider satisfaction.33, 60 These positive labour
outcomes have been associated with cost savings and efficiency.15, 133
A large amount of literature has been published on MR hospitals. Research has identified
that MR is related to positive outcomes, not only for nursing staff, but also for health care
organizations and patients.24, 25 MR has also been postulated to improve efficiency by creating a
hospital work environment that is professionally stimulating and rewarding for nurses131, which
promotes nurse autonomy and gives nurses greater control over their work15, thereby also
improving retention and decreasing turnover of nurses.118, 132 Improvements in hospital
efficiency may be due to increasing productivity38 and reducing costs through nurse autonomy33,
promotion of innovation131 and discovery of quality improvements13, and the delivery of
evidence based care.127, 129 The combination of all these outcomes will result in an increase in

94
efficiency. Despite these claims, there is no research literature on the influence of the MR signal
on hospital cost inefficiency.
The popularity of the designation has motivated research on the effects of the MR signal
on hospital financial performance and efficiency. With respect to efficiency, a number of
researchers have suggested that the MR signal reduces inefficiency in hospitals by promoting a
culture of collaboration, innovation and evidence based practice114 resulting in the delivery of
both cost effective care15, 133 and quality patient care.12
This study uses stochastic frontier analysis (SFA) to investigate the effect of the MR
signal on hospital inefficiency, controlling for various hospital and market factors. Since the
availability of financial resources is limited, there is an increased focus on reducing
inefficiency.176 The results from this study will determine the relationship between the MR
signal and hospital cost inefficiency, along with identifying the impact of internal factors and
external pressures on cost inefficiency.
The effect of the MR signal on hospital cost inefficiency is important from a managerial,
nursing profession and policy perspective. Hospital managers are worried about reducing
inefficiency and improving overall financial performance. The results of this study can be used
to decide whether or not pursuing MR is a potential option in light of the current fiscally
constrained environment. Hospital managers are also dealing with a nursing shortage, which
affects both hospital operations and the quality of services provided.72 MR may be a potential
solution to deal with the nursing shortage. MR has been hypothesized to give hospitals an
advantage in terms of recruiting and retaining nurses83 by signalling their dedication to a
professional practice environment where nursing is valued and considered indispensable to the
overall success of an organization.115 In turn, nurses may view the MR signal as an indicator of a

95
hospital that is dedicated to nursing excellence and values the contribution of the nursing
profession to hospital operations and the delivery of patient care. Nurses may consider MR a
condition of future or continued employment with a hospital.
Policy makers and payers are interested in controlling the costs of health care without
reducing access and compromising quality. The current focus is on restructuring reimbursement
methods to incentivize providers to focus on reducing costs and enhancing quality patient care.
The results from this study may provide another opportunity by which cost inefficiency may be
reduced. MR may be considered as a potential solution for healthcare organizations to consider
as they restructure and transition to a value based health care delivery system.
Using Stochastic Frontier Analysis to Measure Hospital Cost Inefficiency
Earlier studies that focused on determining hospital inefficiency focused on costs as an
indirect measure of cost inefficiency. The assumption in these studies was efficiency must be
increasing if costs are decreasing (or being contained). Unfortunately this assumption may not
hold true. Cost containment can occur as a result from either decreases in inefficiency or
decreases in the number of services and/or the quality of services or even perhaps from changing
the product mix from more expensive to less expensive outputs.153 Due to this limitation,
various other methods were employed to obtain a direct measure of hospital inefficiency, such as
ratio analysis or ordinary lease squares regression. These methods were also found to have a
number of weaknesses. For instance, ratio analysis relies on arbitrary inefficiency criteria and
ordinary least squares regression results in biased parameter estimates.203 Frontier techniques
were developed to overcome these weaknesses. Frontier methods, which include both SFA and
Data Envelop Analysis, determine the best practice frontier and measure inefficiency as the
distance between actual firm performance and a best practice frontier.150, 153

96
SFA is a common method used to estimate cost inefficiency in hospitals. In previous
research, SFA has been applied to estimate cost inefficiency of Critical Access Hospitals173,
teaching hospitals155, hospitals that are part of a network or members in a system151, 176 and
hospitals that are associated with health maintenance organizations.152 SFA has also been
applied to study cost inefficiency in non-healthcare industries such as the container port
industry204, airport industry205, and banking industry.206
This is the first SFA-based study to examine the impact of the MR signal on hospital cost
inefficiency. SFA is parametric technique which can be used to estimate the cost inefficiency of
an organization by comparing actual performance with an estimated or theoretical best practice
frontier. Intuitively, SFA creates a theoretical best practice frontier using actual hospital data
and measures a hospital’s inefficiency as the distance from the hospital’s actual performance to
the frontier.150 The cost inefficiency of a hospital is defined as the ratio of observed total costs to
the best practice, stochastic frontier total costs. The best practice frontier is defined by the value
that total costs would be if full efficiency were attained.169, 203
SFA is based on the assumption that departures from the cost frontier can be decomposed
into stochastic and deterministic factors.172 The former represents random error and the latter
represents inefficiency. The estimation of hospital cost inefficiency requires technical
assumptions about the structure of costs and about the statistical distribution of the error term
representing inefficiency.173, 174 The application of SFA to panel data has been suggested to less
likely yield biased estimates of the coefficients due to omitted variables and because panel
models require fewer distributional assumptions about deterministic error.152, 175

97
Methods
Data Sources
This study is based on panel data for urban hospitals for the period 2000 to 2010 (T =
11). The random effects frontier model used in this study can incorporate an unbalanced panel
design.182 The individual hospital constitutes the level of analysis. The market area is defined as
the county, which is frequently used in hospital studies.152
The hospital data for this analysis is obtained from Medicare’s Hospital Cost Report
Information System (HCRIS), the American Hospital Association’s (AHA) Annual Survey of
Hospitals, the Area Resource File (ARF) and the American Nurses Credentialing Center
(ANCC) website. The four data sets are merged using both a year and hospital identifier.
Propensity score analysis was used on a larger sample of hospitals to match MR hospitals
to never MR hospitals as a correction procedure for selection bias. Matched hospitals in the base
year (2000) remained matched during the remaining study period (2001 to 2010). The resulting
hospital sample contained MR hospitals (the treatment group) and never MR hospitals as the
comparison group. After eliminating hospitals with incomplete data and implausible values, the
final sample contained 1,020 hospitals (5,491 hospital year observations) for the period 2000 to
2010.
Research Design
The analysis utilized in this research study assumes that costs are determined as follows:
[(�Z � :�j�Z , l�Z� # ��Z -. �1�

98
where TC represents total costs; Y is a vector of outputs; W is a vector of input prices; and e is
the error term, which can be decomposed as follows:
��Z � M�Z # L�Z -. �2�
where v is statistical noise (i.e. assumed to be distributed as N(0, σ2)) and u consists of positive
departures from the cost frontier and represents cost inefficiency (i.e. the percentage by which
observed costs exceed minimum costs predicted for a given level of output and input prices) for
which a distribution must also be assumed.186 Frequently, u is assumed to follow a half-normal
distribution and is always nonnegative (i.e. assumed to be distributed as N+(0, σ2))207; however
there is no theoretical reason for the selection of this or other distributional forms.177 The use of
a general distribution, such as a truncated normal distribution is recommended as an
alternative.180 According to the literature, the various assumptions about the distribution of u
appear to have little impact on estimated inefficiencies.152 The observations are indexed by a
hospital index i=1,2,…n and a time index t=1, 2,…,T.
Model Specifications
SFA requires the specification of functional form for the cost equation. Common
functional forms used in the empirical research have been translog and Cobb-Douglas cost
functions. The translog form is preferred because of the increased flexibility; however this
requires the inclusion of an increased number of parameters to estimate and may result in
multicollinearity problems.179

99
The general form of the translog cost model is used to estimate the stochastic frontier,
which is stated as the following:
ln [(�Z � p" # q pr ln jr�Zs
r��
# q !t ln lt�Z # 12 q q urv ln jr�Z ln jv�Z #
s
v��
s
r��
w
t��
12 q q mtx ln lt�Z ln lx�Z
w
x��
w
t��
# q q y�r ln jr�Zlt�Z # q z�( ��Z # {j���Z # M�Z # L�Z|
��� -. �3�
w
t��
s
r��
Where TC = Total expenses; Y = outputs; W = input prices; CM = outpatient case-mix adjusters
influencing quality of care; Year is a time-trend variable; and vit and uit are variables previously
described.
A time-varying model proposed by Battese and Coelli is used to estimate hospital
specific inefficiency.180 In this model the inefficiency-effects are defined by:
L�Z � u~�Z # e�Z , L�Z � 0. -. �4�
where Zit is a vector of explanatory variables associated with the inefficiency-effects; δ is a
vector of unknown parameters to be estimated; and Wit are unobservable random variables,
assumed to be independently distributed, obtained by truncation of the normal distribution with
mean zero and unknown variance, σ2.150
In addition to providing estimates of cost inefficiency, this model permits an estimation
of the impact of both firm specific and environmental factors on cost inefficiency.181 By

100
including time in the Z vector with other firm-specific variables, inefficiency can differ by firm
and by time.
The parameters of the cost frontier are simultaneously estimated by a maximum
likelihood method using the FRONTIER 4.1 program, which uses a random effects regression
technique.182 A limitation the random effects model is that the effects must be assumed to be
uncorrelated with the regressors.174 Fixed effects is an alternative to this model; however this
model cannot be used in a data set that has variables that are invariant over time.183 This model
estimates inefficiency and the parameters of the inefficiency-effects variables simultaneously
(one-stage method). Inefficiency-estimates can also be obtained using a two-stage estimation
procedure, where the inefficiency-estimates from the first stage are regressed against
inefficiency-effects variables in a second stage. The two-stage estimation procedure has been
found to provide parameter estimates of the inefficiency-effect variables that are more inefficient
or biased than those from the one-stage method.176, 182
The cost inefficiency of the ith hospital in the tth year (where t ranges from 1 in 2000 to
11 in 2010) is defined as the ratio of the stochastic frontier total costs to observed total costs.
The stochastic total cost frontier is defined by the value total costs would be if uit (i.e., the cost
inefficiency effect) was zero (i.e., full efficiency). Therefore
(-�Z � ��&��L�Z� -. �5�
where CEit = cost efficiency and uit was defined previously.
This indicates that cost efficiency is no greater than 1 and the reciprocal of this quantity,
exp(uit) is no less than one. The amount by which exp(uit) exceeds one is a measure of cost
inefficiency.152, 155

101
Cost Function Variables
For the specification of the stochastic frontier cost function, the approach by Rosko
(2011) is followed.150 First, the assumption of linear homogeneity in input prices is imposed by
normalizing the cost equation by the price of labour. Therefore the dependent variable is the
logarithm of (total expenses/the price of labour.) The continuous output and input price
variables are also in natural log form. The output and input price variables are all entered
directly and as squared and cross-product terms. These variables are assumed to influence the
cost of transforming resources into services.177 Descriptive statistics of the variables used in the
study are presented in Table 7.
Two inputs, capital and labour, are included in the cost function model. The use of
financial inputs determine whether the total cost of labour, supplies and capital can be reduced
through more efficient production or substitution of less costly inputs.201 The price of labour is
calculated by the average annual salary per full-time-equivalent employee and the price of
capital is calculated by the depreciation and interest expense per bed.
Hospital outputs are considered to be exogenous, an assumption that is common to
hospital cost studies.154 Outpatient visits and inpatient days are included as outputs in the cost
function. 152
Teaching hospital is a structural measure of quality. These hospitals produce different
outputs than non-teaching hospitals (i.e. medical education)153 and are more costly than non-
teaching hospitals.154 Teaching hospitals focus on training medical students and consume more
inputs such as instructors, classroom space, diagnostic tests and state of the art technology.154
Teaching hospitals also attract sicker patients who require more resources because of the
education value this provides to the students. 152, 154, 155 According to Rosko (2007), the quality

102
of patient care tends to be higher in teaching than in nonteaching hospitals.153 Teaching hospital
status is included in the model as a binary variable.
Since hospital outputs are heterogeneous, it is important to control for variations in case
mix. Consequently the ratio of outpatient surgeries to total outpatient visits and the ratio of
Emergency Department Visits/Outpatient Visits are used to control for variations in outpatient
case mix. Research indicates that patients who require surgery and patients seen in the
emergency department tend to be a more resource intensive group of outpatients.155 In order to
control for heterogeneity in inpatient output, Medicare Case Mix Index is included in the
analysis since patients with different diagnoses have different resource requirements.173 Time
trend is also included, which is recommended as a proxy for improvements in medical and
organizational technology.177 Therefore, this variable measures whether hospitals have been
adopting a more expensive technology over time.
Inefficiency Effects Variables
Variables that are proposed to influence inefficiency are also included in the SFA model.
These variables influence the cost inefficiency with which resources are transformed into
services.177 The estimated coefficients provide an indication of the association between the
internal hospital environment and the external pressures on cost inefficiency.
To assess the impact of the MR signal on hospital efficiency, a vector of binary variables
representing MR, the three phases of the study and interaction effects are included in the
regression. The Magnet Recognition Designation variable is a binary variable, which identifies
hospitals as either MR or never MR. The Hospital Magnet Recognition Status variable, also a
binary variable, identifies the hospital status during the 2000 to 2010 time period. A hospital’s
status can be categorized as either pre-test period, implementation period or post-test period.

103
The primary variable of interest is the interaction between MR and Post-test (Magnet
Recognition*Post-test). This variable measures the change in cost inefficiency for MR hospitals
compared to the never-MR hospitals.
Hospital reimbursement impacts profits and creates incentives for hospitals to become
more efficient. Two variables, Medicare share and Medicaid share of total inpatient days are
used to represent a hospital’s payer mix and the regulatory pressures of public payers. Medicare
and Medicaid are federal and state payers, and both contribute to a large proportion of hospital
revenues. Hospitals face the prospect of providing predominantly unprofitable medical care to
patients covered by Medicare or Medicaid.208 According to Cleverly and Harvey (1992) (as
cited in Trussel, 2010), it is unlikely that Medicare reimbursements cover the full costs of
treating patients.146 It is postulated that Medicare’s prospective payment system impairs the
financial health of hospitals because the reimbursements fail to cover the hospital’s actual costs
of patient care.146 Both Medicare and Medicaid increase the financial risk of the hospitals,
leading hospitals to become more financially prudent and cost conscience; therefore both
Medicare and Medicaid shares should be inversely related to cost inefficiency. Since Medicaid
reimbursement rates are lower than Medicare rates, it is expected that Medicaid share will have a
larger effect on inefficiency than Medicare share.152
The Herfindahl-Hirschman Index (HHI) is a measure of industry concentration in a
market area. For hospitals, it is a measure of the distribution of discharges in a hospital’s market
area. The HHI is calculated by summing the squares of the market shares of discharges for all of
the hospitals in the county. A value of 1 is indicative of a monopolistic market and measures
close to 0 is indicative of a highly competitive environment. As the number of hospitals increase
in a market area, the competition among hospitals also increases.155 As a result, hospitals have

104
an incentive to increase efficiency. Therefore it is expected that as HHI decreases, hospital
efficiency should increase.152
System affiliation indicates whether a hospital is owned by a larger system. Such
affiliations have been found to result in increased efficiency, lower risk, better financial
outcomes, seamless care, greater control over referrals, greater economies of scale146, 147, and the
elimination of duplicative administrative functions.176 A hospital’s Ownership status influences
the emphasis placed on earning profits. Compared to not-for-profit hospitals, for-profit hospitals
focus on earning profits, increasing shareholder wealth and reducing inefficiency.154, 209 To
represent ownership form, a binary variable is used, 1 for for-profit hospitals and 0 otherwise.152
Uncompensated care increases the financial risk of hospitals and leads hospitals to focus
efforts to recoup costs and reduce inefficiency. Since a measure of the amount of
uncompensated care provided by hospitals is not available, unemployment rate is used as a proxy
measure in the regression. Unemployment rate has been found to be correlated with the
percentage of population without insurance since most health insurance coverage is obtained
from the place of employment.210 Shifts in the cost frontier are measured using a time trend
variable equal to 1 in 2000, 2 in 2001 up to 11 in 2011, which measures the impact of the cost
changes in technology over time.177 Table 7 presents the definitions and descriptive statistics of
variables used in the stochastic frontier regression equation.
Model Selection and Specification
In order to estimate a stochastic frontier cost model, a number of null hypotheses are
tested to select the specification that best fits the model. The final model is not directed by
theory, but based on the results of various restriction tests. Table 8 presents the results of
hypotheses tests that examine a number of restrictions.

105
Hypothesis tests are performed using the likelihood-ratio test: λ=−2[ln[L(H0)] –
ln[L(H1)]]. Where ln[L(H0)] and ln[L(H1)] are obtained from the log-likelihood function under
the null hypothesis (the restrictive model) and the alternative hypothesis (the unrestricted model)
respectively and λ is the generalized likelihood statistic. If the null hypothesis is true, λ has a
Chi-square distribution with degrees of freedom equal to the difference between the number of
parameters estimated under null and alternative hypothesis.151 If the restriction has minimal
impact on the parameter estimates, the value of the log likelihood function will not change much
and the null hypothesis will not be rejected. Chi square statistics (or mixed Chi-square) 211with
critical values at the p < 0.05 level are used to test the hypotheses.
When attempting to select the preferred model for this analysis the following decisions
need to be made: (1) Should an Ordinary Least Squares (OLS) or SFA be used in the
estimation? (2) Should a Cobb-Douglas or translog function be used? (3) Should inefficiency-
effects variables be included in the model? and (4) What theoretical distribution should the
composed error follow, a truncated normal distribution or a half-normal distribution?
First, in order to determine if SFA is a more appropriate estimation technique than OLS
regression, the hypothesis, γ = 0, is tested. Where γ = σu2/(σv
2 + σu2), σu
2 is the measure of
inefficiency (i.e. one sided error) and σv2 is statistical noise (i.e. classical random error term).
Larger values of γ imply that the variance of the inefficiency effects represents larger proportions
of the total variance of the error terms u and v.152 Accepting the null hypothesis (H0: γ = 0)
implies that σu2 is zero; therefore the parameters can be estimated using an OLS regression. The
results of the likelihood-ratio tests indicate that the OLS regression is rejected and the SFA is
used.

106
Second, likelihood-ratio tests are applied to determine whether the Cobb-Douglas or the
translog function should be used for the analysis. While the translog function is used frequently
because of the flexibility it provides, this function requires many independent variables which is
a concern for studies with small sample sizes. Therefore, the Cobb-Douglas function may be
considered as an alternative option. In the Cobb-Douglas function the parameters of the higher
order output and input price variables are restricted to zero. The results of the likelihood-ratio
tests indicate that the Cobb-Douglas frontier model is rejected and the translog model is used.176
Third, the inclusion of inefficiency effects variables to the model is tested. The null
hypothesis that δ1 = δ12 = 0 is tested.153, 176 The results support the rejection of the null
hypothesis, which implies that the inefficiency variables have a significant impact on cost
inefficiency and are therefore included in the model.176
Fourth, the theoretical probability distribution of the inefficiency-effects, ui, must be
made. The half-normal distribution has been used frequently; however there is no a priori
justification for the use of any specific distribution for the cost inefficiency-effects, ui. The
appropriateness of using the half-normal distribution is tested against the truncated-normal
distribution.176 The results of the likelihood-ratio test indicated that the truncated normal
distribution should be used in the analysis. While the mean estimated inefficiency may vary
under the different distributions, the relative inefficiency is minimally affected.
The results of the restriction tests support the use of SFA using a translog function, with a
composed error that assumes a truncated normal distribution, and the inclusion of inefficiency
effects related to internal and external environmental factors.

107
Table 7. Variable definitions and descriptive statistics
Variable Description Mean Standard Deviation
Total Expenses* Total expenses / Price of Labour 11.67 0.90 Outpatient Visits* Outpatient visits 12.09 0.97 Inpatient Days* Inpatient days 11.01 1.09 Price of Capital* Depreciation and interest expense per bed 10.59 1.03 Price of Labour* Annual salary per full-time equivalent employee 7.44 0.31 Emergency Room Visits (%) (Emergency department visits/outpatient visits)*100 25.94 16.97 Outpatient Surgery (%) (Outpatient surgery/outpatient visits)*100 5.45 16.97 Medicare Case Mix Index Medicare Case Mix Index 1.50 0.25 Teaching Affiliation (%) Binary variable (1,0) for hospitals that are teaching hospitals 61.91 48.56 Efficiency Effects Variables Magnet Recognition Hospital (%) Binary variable (1,0) for Magnet Recognition hospital 19.85 39.89 Pre-test (%) Binary variable (1,0) for Magnet Recognition status during
pre-test period 33.29 47.13
Implementation (%) Binary variable (1,0) for Magnet Recognition status during implementation period
34.27 47.47
Post-test (%) Binary variable (1,0) for Magnet Recognition status during post-test period
32..43 46.82
Unemployment Rate Average unemployment rate in hospital’s market area 5.27 1.79 For Profit (%) Binary variable (1,0) for investor-owned hospitals 4.50 20.73 System Affiliation (%) Binary variable (1,0) for system affiliation 28.72 45.25 Medicare Share (%) (Medicare inpatient days/total inpatient days)*100 39.01 14.39 Medicaid Share (%) (Medicaid inpatient days/total inpatient days)*100 11.02 8.98 Herfindahl-Hirschman Index Index for concentration of hospital discharges 0.17 0.24
*Indicates transformed by natural logarithm

108
Table 8. Generalized likelihood-ratio tests of null hypotheses for parameters of the translog stochastic cost frontier model.
Null hypothesis Test statistic λλλλ ��i� value Decision Implication
H0: γ = 01 2,509.07 17.672 Reject Use SFA instead of OLS. H0: βij = 0 2,862.24 18.31 Reject Use the translog model instead of the Cobb-Douglas model. H0: δ1 = δ12 = 03 1,699.27 22.36 Reject Include inefficiency variables in the model. H0: u = 04 209.59 3.81 Reject Use truncated-normal distribution rather than half-normal
distribution for residuals. 1 γ = σu
2/(σv2 + σu
2), where v represents the classical random error and u the inefficiency residual, so larger values of γ indicate that a greater proportion of the regression residuals is due to inefficiency. 2 The critical value is taken from table 1 of Kodde and Palm211 because a mixed Chi-square distribution must be used. 3 δ1 = δ12 = 0 represents the coefficients estimated for the inefficiency effects variables. 4 The truncated-normal distribution has a placement parameter, u (estimated as δ0 in Table 9). The half-normal distribution is a special case in which δ0 is restricted to 0.

109
Table 9. Parameter estimates for the frontier cost function.
Variable Coefficient t-ratio Constant 4.944 8.874** Outpatient Visits 0.775 10.191** Outpatient Visits Squared 0.032 4.551** Inpatient Days −0.649 −11.076** Inpatient Days Squared 0.160 36.634** Outpatient Visits x Inpatient Days −0.130 −12.431** Price of Capital 1.300 3.347** Price of Capital Squared 1.197 18.164** Price of Capital x Outpatient Visits −0.184 −5.068** Price of Capital x Inpatient Days 0.255 7.321** Emergency Room Visits (%) 0.000 0.801 Outpatient Surgery (%) 0.004 17.562** Medicare Case Mix Index 0.411 22.424** Teaching Affiliation 0.078 9.708** Year 0.019 15.434** Inefficiency effects δ0 −7.576 −50.392** δMagnet Recognition 0.097 1.534 δImplementation 0.389 4.324** δPost-test 0.466 4.359** δMagnet Recognition x Implementation −1.838 −16.144** δMagnet Recognition x Post-test −1.841 −15.071** δUnemployment Rate (%) 0.034 2.000* δFor Profit 0.049 4.755** δSystem Affiliation −0.078 −2.408* δMedicare Share (%) −0.002 −1.053 δMedicaid Share (%) 0.014 7.052** δHHI 0.492 5.910** δYear −0.009 −3.965** σ
2 0.893 45.771** γ = σu
2/(σv2 + σu
2) 0.952 618.056** Log-likelihood 49.36
*p < 0.05 **p < 0.01

110
Table 10. Mean inefficiency estimates for all, MR and never-MR hospitals by time-period.
All Hospitals MR Hospitals Never MR Hospitals
Time-period N Mean Standard Deviation
N Mean Standard Deviation
N Mean Standard Deviation
Pre-period 1,828 0.1341 0.0861 358 0.1248 0.0712 1,470 0.1708 0.1225 Implementation 1,882 0.1325 0.1050 372 0.1235 0.0997 1,510 0.1688 0.1173 Post-period 1,781 0.1170 0.0878 360 0.1154 0.0923 1,421 0.1236 0.0653 Total time-period 5,491 0.1278 0.0938 1,090 0.1212 0.0890 4,401 0.1546 0.1073

111
Results
The parameters of the cost frontier were estimated using the simultaneous maximum
likelihood method in the FRONTERI 4.1 program.182 Table 9 presents the results for parameters
estimated by the frontier cost function.
Cost Function Variables
The estimated coefficients for Price of Capital and some of the output variables (or their
square or interaction terms) have parameter estimates that were either insignificant or
counterintuitive. According to Rosko and Mutter (2010), this should not be unexpected due to
the high correlations between the variables.173 While multicollinearity impacts the reliability of
the parameter estimates for the output variables and the Price of Capital167, it does not introduce
a bias in the inefficiency estimates.180 Since the purpose of this study is not to investigate the
cost function parameters, the trans-log cost function is retained.
Both Outpatient Surgery (%) and Medicare Case Mix Index have coefficients that are
positive and significant, which is expected. Increases in the proportion of outpatient surgery or
increases in Medicare Case Mix Index increase resource utilization and therefore increase costs.
As expected, hospitals that are affiliated with teaching institutions are 7.8% more expensive than
non-teaching hospitals.
Inefficiency Effects Variables
The primary variable of interest is the interaction between Magnet Recognition and Post-
test, which indicates whether MR hospitals are more or less cost efficient than the comparison
group of never MR hospitals. The results in Table 9 indicate that the cost-inefficiency estimates
are negatively associated with MR in the post-test period. This suggests that compared to never

112
MR hospitals, MR hospitals are more efficient (p<0.01). These results confirm the statements
made in the research literature that MR hospitals are more efficient.15, 131
The estimated results show a positive and significant coefficient of for-profit ownership,
which indicates that for-profit hospitals in the sample are more cost inefficient than not-for profit
hospitals (p<0.01). The positive coefficient for the Herfindahl-Hirschman Index (p<0.01)
indicates that there is more cost inefficiency in markets where output is concentrated in fewer
hospitals. This result has also been found in a number of other studies.152, 176 According to
Rosko (2001), profit maximizing firms with monopoly power are likely to increase profits by
producing less output at higher prices or by changing the product mix to less expensive outputs
thereby reducing costs.152
A higher unemployment rate is associated with more cost inefficiency which is
anticipated (p<0.05). The coefficient on Medicaid Share is positive and significant. This finding
suggests that Medicaid payment is associated with increased cost inefficiency, which is an
unexpected result. System affiliation was associated with reduced cost inefficiency (p<0.05),
which is consistent with results that this structural feature has operational benefits. Hospitals
that are part of a multihospital system may have the ability to provide services at lower costs and
greater efficiency by collaborating on service delivery.151
The positive coefficient of the time-trend variable in the cost function suggests that all
hospitals (i.e. both MR and never MR hospitals) have been adopting more expensive technology.
However, the time trend variable in the inefficiency effects variables is negative. This means
that inefficiency decreased during the study period.

113
Estimated Inefficiency
Table 10 presents the mean estimated cost inefficiency by year for all hospitals, MR and
never-MR hospitals. The mean estimated cost inefficiency score for the entire sample was
0.1278 or 12.78%, which lies in the ranges of inefficiency estimates found in other studies.151, 152,
154, 155, 172, 173, 176 The MR hospitals had lower overall cost inefficiency (12.12%) than the never
MR hospitals (15.46%). Over the three time periods, the mean cost inefficiency for both groups
is declining. The largest decrease in mean inefficiency score occurred from the implementation
period to the post-period for both MR and never MR hospitals.
Discussion
This study has provided some interesting results about the relationship between the MR
signal and hospital cost inefficiency. While the MR signal has been promoted to increase
productivity and reduce hospital costs, this is the first national panel study to investigate the
relationship between the MR signal and inefficiency using SFA. The estimated results indicate
that MR hospitals have lower cost inefficiency than the comparison group of never-MR
hospitals. These findings support the hypothesis of this study and confirm the claims stated in
the literature that the MR designation increases efficiency and contributes to cost-effective
care.127, 129
The purpose of this study is to determine the effect of the MR signal on hospital cost
inefficiency. As discussed previously, MR is theorized to signal the promotion of excellence in
nursing care86 and professional nursing practice131, emphasis on collaboration and team work34,
35, and creation of a positive culture and work environment.33 Research has confirmed that a
professional practice environment supports nurses to function at the highest scope of clinical
practice, to work effectively in an interdisciplinary team of caregivers, and to mobilize resources

114
quickly.75 In fact, the evidence suggests that hospitals with a poor working environment are
associated with higher costs.116
Providers are expected to interpret the MR signal and respond by seeking or maintaining
employment in designated hospitals resulting in reduced nursing turnover, reduced
recruitment118, 132 and orientation costs38, reduced usage of agency nurses38 and increased
provider satisfaction.33, 60 According to research evidence, MR hospitals result in high levels of
nursing work satisfaction, which in turn leads to lower vacancy and turnover rates. One MR
facility reported a reduction in nursing turnover from 30% in 2000 to 12% in 2008.124 Another
MR facility reported a decrease in nursing vacancy rates from 19% in 2000 to 5% in the first
quarter of 2007.125 Nurses who work at MR hospital are also more likely to stay than those who
work in non-MR hospitals. According to the ANCC, the average length of employment of RNs
on staff in a MR hospital is 8.35 years.126
This reduction in nursing turnover in MR hospitals is postulated to be linked to an
associated savings of $64,000 per nurse.38 One MR hospital reported a reduction in labour costs
of $4 million each year since 2007.124 These cost savings have been attributed to a reduction in
recruitment costs, reduction in orientation costs, and productivity gains.38 MR has been
hypothesized to give hospitals an advantage in terms of recruiting and retaining nurses83 by
creating professional practice environments where nursing is valued. The designation is used as
a recruiting tool to attract nurses seeking employment in the best clinical practice settings.87 MR
hospitals are acknowledged as good places to work for all employees, not just nurses.87
MR is now also used to recruit other health professionals, such as physicians,
pharmacists, and laboratory technicians.88 New hires have noted that MR is associated with

115
highly competent and coordinated staff.81 Furthermore, physician satisfaction scores are higher
at MR hospitals compared to non-MR hospitals, which also influences physician recruitment.110
It is important to note that in addition to the MR signal, this reduction in cost inefficiency
may also be attributed to the operational changes that result due to the implementation of MR
program. For instance, cost savings associated with MR have also been rationalized through the
delivery of cost effective patient care, such as lower average lengths of stay, use of fewer
pharmaceuticals, and fewer tests resulting in a reduction in average patient costs.15, 133 A
research study found that length of stay declined from 4.86 days to 4.73 days in a Magnet
Recognized hospital.128 It has been postulated the improvement in the nurses’ work
environment, attributed to MR, has been linked to reduction in medical errors and adverse patient
outcomes.23, 116 A study by Lake et al. found that patients in MR hospitals had a 5% lower fall
rate after controlling for multiple factors that influence fall risk.212 Another study in 2007, using
National Database on Nursing Quality Indicators data reports fall rates in MR hospitals to be
10.3% lower than the non-MR hospitals. Pressure ulcer rates have also been reported to be lower
in MR organizations. A 2008 study reported that patients who had received care for a hip
fracture were less likely to develop decubitus ulcer in MR versus non-MR hospitals.38 These
fewer adverse events could lead to reduced use of high-cost intensive care units, which are
supposed to increase efficiency and contribute towards cost effective care.127, 129
Prior research evidence appears to support the contribution of both the MR signal and
operational changes on hospital cost inefficiency. Unfortunately, the results from this study
cannot be used to determine between the reductions in cost inefficiency attributed to the MR
signal and/or the operational changes from the MR program. However, a recent study by
Jayawardhana et al. (2014) found evidence that MR hospitals result in a significant increase in

116
inpatient costs, a 2.46% increase in inpatient costs on average.41 These findings indicate that
there may be limited costs savings resulting from the delivery of inpatient health care services in
MR hospitals. Therefore, perhaps the operational and structural changes due to the
implementation of MR and the provision of cost-effective patient care may not be fully
responsible for the reduction in hospital cost inefficiency. Instead, a plausible reason for the
reduction in hospital cost inefficiency found in this study may be attributed to and associated
with the MR signal.
Policy Implications
The results from this study suggest that MR hospitals are more efficient than never-MR
hospitals. The reduction in inefficiency may be attributed to either or both the signaling effect of
MR or the operational changes in hospitals due to MR. While the MR program is not intended to
improve efficiency of hospitals, the study results support the claims of additional benefits related
to the designation. This may have numerous implications.
For instance, this may result in an increase in demand for MR by hospitals interested in
recruiting and retaining providers, especially nurses. Hospitals are now starting to realize that
nursing shortages lead to increasing costs88, which is attributed to the increased use of agency
nurses (who are reimbursed at higher rates), increased overtime of nurses, and many other
factors.85 The financial health of a hospital is in jeopardy if they do not have a strong nursing
department and cannot survive as a good health care facility.99 MR has been hypothesized to
give hospitals an advantage in terms of recruiting and retaining nurses83 by creating professional
practice environments where nursing is valued. With the nursing shortage, hospitals may use
MR as a potential recruiting strategy to attract highly qualified nurses and other health care
providers seeking employment to their organization.17

117
The MR signal may communicate standards and expectations established by hospitals.
Such that, when seeking employment, nurses may also be more discriminating when making
their selections and may require or only consider MR hospitals as places of employment. This
may hinder the ability of non-MR hospitals to attract and retain nurses and other providers to
their respective facilities.
There may also be an increase in the demand and appeal for MR by hospitals due to the
potential cost savings that may result because of the restructuring and operational changes that
take place during the transition to becoming a MR hospital.213 With the reductions in provider
payments that are occurring, government and advocacy agencies may consider promoting MR or
components of MR as pathways to not only improve quality, but also to reduce costs and
improve efficiency. Thus potentially ensuring the financial viability of the hospital and
maintaining access to services by the community.
MR is a costly endeavour for hospitals. In light of these results, CEOs and CFOs will
need to carefully contemplate their decisions to pursue MR in terms of the costs and the future
cost savings that will result. Hospital managers of MR hospitals should be attentive to the
specific changes and restructuring of health care delivery in their hospitals, since certain features
may positively influence cost inefficiency.
The analysis of cost inefficiency in hospitals can make a major contribution to improving
health services. The current health care system in the U.S. is undergoing major changes to
ensure the sustainability of the system. The Patient Protection and Affordable Care Act focuses
on increasing access, improving quality and reducing costs. The current payment systems are
being restructured to incentivize providers to reduce costs, focus on the delivery of evidence
based care, and encourage the delivery high quality care in an efficient manner. Opportunities to

118
increase revenue generation through reimbursement for hospitals may be limited. In order to
continue operations and to be financially viable, hospitals will need to emphasize the delivery of
cost effective care, while maintaining high quality.
Limitations
It is important to note that the results presented in this study are estimates of relative cost
inefficiency and may differ from true cost inefficiency. SFA measures differences in
inefficiency between hospitals in relation to a theoretical best practice frontier.
Despite the inclusion of a number of cost variables, the results may be affected by
omitted variable bias or measurement error. While the distribution of the error term may have
minimal impact on the estimates of relative cost inefficiency of the hospital sample, it may
impact the magnitude of the point estimates.176 In other words, while the relative inefficiency
estimates will remain true, the mean values may change if a different theoretical probability
distribution is selected to represent the residual.177
A number of efficiency analysis studies using SFA with longitudinal panel data have
been conducted using the random effects regression technique.182 This technique is known to
have a few limitations. First, in this model the cost inefficiency error components must be
assumed to be uncorrelated with the regressors. A violation of this assumption may lead to
inconsistent inefficiency estimates.152
An alternative method is the application of a fixed effect regression approach.183 The
fixed effects regression does not require making the assumption that inefficiency is uncorrelated
with the regressors and does not require a distribution assumption about the error components.152
However, this approach will capture the effects of all unobservable variables that vary across
hospitals, but are time invariant for each hospital. Furthermore, consistent estimation of

119
inefficiency requires a large number of observations per hospital. This study used a panel of 6 or
fewer observations per hospital which may result in inconsistent estimates. In addition, the fixed
effects approach assumes that hospital inefficiency is time invariant, i.e. the change in
inefficiency is the same over time for each hospital. This assumption may not hold true if a
hospital responds to environmental pressures by increasing efficiency in different amounts.152, 176
With the availability of a long panel, this assumption may be relaxed by using an approach that
allows time-varying inefficiency.153
The inclusion of quality variables to the SFA, such as mortality or readmission rate, may
be appropriate if quality requires additional resources. For instance, reductions in quality might
be falsely attributed to increases in cost inefficiency. In fact, changes in quality might be
affected by improvements in processes, as well as, by increases in the number and quality of
inputs. Rosko and Mutter (2007) recommend the inclusion of multiple quality outcome
measures that capture the multifaceted nature of hospital quality153 such as patient outcomes and
severity of illness.152 The inclusion of quality variables is constrained by the availability of valid
quality measures for a national sample of hospitals. However, several researchers have included
quality measures in frontier analysis of health care organizations and have found that these
variables had minimal impact on results.152, 209

120
CHAPTER 6: THE EFFECT OF THE MAGNET RECOGNITION SI GNAL ON HOSPITAL FINANCIAL PERFORMANCE.
Overview
This study examines the effect of the MR signal on hospital financial performance. Data
from the American Hospital Association Annual Survey, Medicare Hospital Cost Reports, Area
Resource File and American Nurses Credential Center are used for the analysis. To control for
selection bias, propensity score analysis is applied to match MR hospitals to never MR hospitals.
The final study sample includes the matched hospitals. A difference-in-difference model with
hospital fixed effects is applied to the matched hospital sample to test the effect of MR signal,
while controlling for both hospital and market characteristics. Results indicate that the MR
signal improves the financial performance of designated hospitals compared to non-designated
hospitals.
Introduction
Signals have an important role in reducing the existence of information asymmetry.
Information asymmetry is defined as an imbalance of information between two parties, where
one party has more information than another party. This imbalance can result in misinformation
and an imbalance of power in transactions. In health care, information asymmetry impairs the
ability of hospitals to compete effectively in health care markets10 because stakeholders are
unable to evaluate the quality of health care. This incomplete information influences selection of

121
hospitals by payers, patients and providers8, which may negatively influence a hospital’s
financial viability.
Signals are often used in healthcare to communicate the underlying quality of a hospital’s
products and services. The information contained in the signal permits stakeholders to make
informed decisions and to distinguish between high quality and low quality products. Healthcare
providers attempt to communicate the quality of their services to prospective patients and/or
employees in a variety of ways.9 Some communicate directly using public reporting of quality of
care information to enable patients to make informed choices about their health care providers.10
Others communicate indirectly, or signal, unobservable information to consumers by attaining a
costly, coveted quality designation, which the consumer can interpret as the firm’s commitment
of resources to quality management.58 The quality information conveyed by the signal then leads
consumers to update their perceptions2, 43 about product and service quality.44
MR designation is an example of a signal employed by hospitals to communicate their
commitment towards health care quality and quality management to patients, providers and
payers.9 MR is a quality designation given by the ANCC to hospitals and long term care
facilities18, 19 to recognize organizations as centers of nursing excellence.86 Pursuing and
sustaining MR requires the commitment of time and the investment of substantial human and
financial resources21, 22 and the designation has gained widespread attention in both research24, 25
and practice26 over the past two decades. MR is considered to be a symbol of distinction11 and
has been theorized to signal that the hospital is a center for nursing excellence and the provider
of quality patient care12, which is an important attribute in today’s competitive market place.16, 17
MR signals to patients and to health care providers about the hospital’s dedication and
commitment to quality patient care.13-15

122
There is growing evidence (empirical and anecdotal) that MR hospitals are associated
with positive nursing, patient and organizational outcomes.24, 25 These outcomes are interrelated
and have also been theorized to affect hospital financial performance through signaling the
delivery of quality care to consumers, thereby increasing cost savings, revenue, and market
share. Despite these claims, there have been no research studies that have empirically evaluated
the effect of the MR signal on the financial performance of hospitals. The purpose of this
research study is to investigate the effect of the MR signal on hospital financial performance.
This study builds on existing evidence on the effects of signaling unobserved quality in
two ways. First, although the effect of signaling on firm financial performance has been widely
studied in the corporate setting, there is minimal research focusing on the effect of signaling in
hospitals, many of which are not-for-profit.
Second, although there are a large number of studies conducted on MR hospitals that
have considered financial performance as an outcome, none has specifically examined the
signaling effect of MR. Existing studies are predominantly case studies, single-site evaluations33
or cross sectional surveys using convenience samples of organizations and staff respondents.185
With the increased number of MR hospitals in existence over an extended period of time,
it is now possible to design longitudinal research studies that address issues of sample size and
omitted variable bias, allowing robust evaluation of the effectiveness of the MR signal. This
study uses externally reported administrative and financial information, and employs a robust
methodological approach and innovative analytical techniques to evaluate the effect of MR on
hospital financial performance.

123
Research Design and Methods
Research Design
This study applies a pre-post research design to measure the effect of the MR signal on
hospital financial performance. The design attempts to control for observable and unobservable
factors that will potentially contribute to any difference between the pre-test and post test results
by dividing hospitals into two groups. The treatment group includes hospitals that have achieved
MR anytime during the study period, and is referred to as MR hospitals. The control hospitals
are referred to as “Never-MR hospitals.”
Three study periods are used. The pre-test period is defined as a minimum of two years
when the hospital is not pursuing MR. The pre-test period is a baseline before the hospital is
considering pursuing MR. The implementation period is defined as two years prior to the initial
MR designation, when the hospital is preparing for MR. According to the research literature,
hospitals pursuing the MR designation require approximately two years to transform and become
a MR hospital.138 The implementation period aims to control for any changes in hospital
characteristics and outcomes that may occur during the transition to becoming a MR hospital.
The post-test period is defined as the year of initial MR designation and subsequent years of
designation. A minimum of two years post-recognition are required.
Data Sources
The hospital data for this analysis are obtained from Medicare’s Hospital Cost Report
Information System (HCRIS), the American Hospital Association’s (AHA) Annual Survey of
Hospitals, the Area Resource File (ARF) and the American Nurses Credentialing Center
(ANCC) website.

124
The four data sets are merged using both a year and a hospital identifier; however the
definition of the year variable differs in the various data sets. The HCRIS data set includes
hospital year observations organized by fiscal year and the ARF, ANCC and AHA data sets
include hospital-year observations organized by calendar year. In order to merge HCRIS data
set, a year-end variable is created using the following rule: the fiscal year end date for each
hospital-year observation (i.e. 6/30/2000) will be designated as the year-end variable (i.e. 2000)
and is matched with the calendar year variable. This will permit the four data sets to be merged.
The final merged data set will be used in this analysis.
Study Sample
The study sample is a longitudinal, unbalanced panel of MR and never MR hospitals
located in urban areas in the US from 2000 to 2010 (eleven years). The initial data set consists
of 3,431 hospitals (31,163 hospitals year observations). Duplicate hospital year observations,
hospital year observations with fewer than 330 days in the Medicare cost report period, hospitals
with fewer than 8 hospital year observations, hospitals that do not have a hospital year
observation at year 2000, and hospitals that received MR before 2004 and after 2009 are
excluded from the data set.
In addition, to remain in the final study sample, each MR hospital must have four
consecutive years of data prior to MR designation, and a minimum of two consecutive years of
data following MR designation, for a maximum of six hospital-year observations. MR hospitals
with limited or missing financial data potentially introduce noise and bias the results; therefore,
only MR hospitals that have complete data over a minimum of six consecutive years are
included. Although this requirement reduces the sample size, the reduction in the eligible
hospital-year observations is trivial.

125
The final sample consists of 23,607 hospital year observations (2,199 hospitals) from
2000 to 2010. This includes 21,072 never MR hospital year observations (1,968 hospitals) and
2,535 MR hospital year observations (231 hospitals).
Propensity score analysis is used to create a study sample of matched MR hospitals and
never MR hospitals. Using data from the year 2000, the propensity score analysis predicts the
probability that a hospital will ever achieve MR as a function of hospital and market
characteristics in 2000. A greedy matching algorithm is used to match MR hospitals to never
MR hospitals in the year 2000. Following the recommendation by Guo, a 1 to 4 nearest
neighbour matching within a caliper without replacement is used.163 As suggested by
Rosenbaum, the caliper size is set at 0.25σp, (where 0.25σp denotes the standard deviation for the
estimated propensity scores in the hospital sample).162 The matches from 2000 serve as the
matches for the remainder of the study period.
This results in an unbalanced panel data set of 12,480 hospital year observations (from
2000 to 2010), consisting of 921 never MR hospitals and 231 MR hospitals. Since each hospital
should have a maximum of 6 hospital year observations (2 hospital year observations for pre-
test, 2 hospital year observations for implementation and 2 hospital year observations for post-
test), hospital year observations that are not designated in one of these time periods are excluded
from the final data set. The final study sample consists of 6,581 hospital year observations
consisting of 921 never MR hospitals and 231 MR hospitals. Standardized differences are used
to measure covariate balances between the MR hospitals and the matched never MR hospitals.
The post-match standardized differences are <10% for all the covariates. This confirms that
balance between the MR and the never MR hospitals has been successfully achieved.

126
Variables and Measurements
Table 11 is a comprehensive list of variables, measures, definitions and data sources that
are utilized in this paper.
Dependent Variables
MR is proposed to improve a hospital’s financial performance either through increasing
revenue38 or decreasing expenses.30 Together or individually, these changes may result in an
increase in profitability and therefore have an impact on hospital financial performance.
Financial performance is measured using operating profitability, total profitability and return on
equity. Operating margin is a measure of profitability141 and frequently used to assess the
financial health of an organization142 since it is directly affected by changes in either operating
revenue or costs. This ratio focuses on core business operations and therefore excludes
investment income and other types of revenue and expenses unrelated to operating activities.143
Total margin is a measure of total profitability and includes income from both operating and
non-operating activities.144 Operating margin and total margin greater than zero indicate
profitability (revenues are greater than expenses) and margins less than zero indicate losses
(revenues are less than expenses.). Return on equity is another measure of financial performance
and it measures the rate of return for each dollar in equity (net assets).145
Independent Variables – Main Explanatory Variable
The Magnet Recognition Designation variable identifies hospitals as either MR or never
MR. The Hospital Magnet Recognition Status variable identifies the time period as either pre-
test, implementation, or post-test during the six year period over which each hospital is observed.

127
Independent Variables – Control Variables
Hospital Characteristics
Hospital characteristics are noted to be associated with a hospital’s financial health.157
These characteristics include a hospital’s structural factors and processes, which influence
hospital operations, marketability and ability to earn revenue.
Hospital characteristics include hospital size (measured by total number of beds) which is
associated with higher economies of scale and financial expertise, lower per unit costs, and more
successful strategic activity.146, 147 System affiliation (determined using the Medicare Cost
Report) indicates whether a hospital is owned by a larger system. Such affiliations have been
found to result in increased efficiency, lower risk, better financial outcomes, seamless care,
greater control over referrals, and greater economies of scale.146, 147
Medicare payer mix and Medicaid payer mix are calculated as the percentage of total
inpatient days attributed to Medicare and Medicaid, respectively. These measures provide an
indication of the hospital’s patient-mix 146 and the payer-mix.148 An increased dependence on
government payers, such as Medicare and Medicaid, is likely to be associated with lower patient
revenue, because these payers typically do not pay the full average cost of care.146
Teaching affiliation indicates if a hospital is a teaching hospital or a non-teaching
hospital. Teaching hospitals are known to have higher costs than non-teaching hospitals.155
Teaching affiliation is included as a binary variable in this analysis. Ownership indicates for-
profit, not-for-profit ownership or government ownership. These variables are included to
control for internal pressure for cost reduction associated with ownership.186 Due to their
responsibilities to shareholders, for-profit firms are expected to more aggressively pursue cost
reduction strategies than not-for-profit firms. For-profit firms are also unlikely to be interested

128
in the adoption of innovations that are unproven or may raise costs39, and as a result, may have
higher operating margins than their not-for-profit counterparts.156
Market Characteristics
A hospital’s operating environment and the market demand for health care services can
also influence hospital financial performance.157 The hospital’s market area is defined as the
county in which the hospital is located.
The total population in the market, the market population density and the percent of the
population age 65 and over describe the demand for hospital services in the market area. The
average per capita income, unemployment rate and poverty rate (percentage of families or
persons in poverty) measures a community’s financial ability to purchase health care services.158
The likelihood of a resident to bypass a hospital and seek services at another facility is proxied
by the average distance from patient residence to hospital, calculated as the average distance
between the residence ZIP centroid of each Medicare discharge and the hospital.159 The hospital
market share, a measure of the amount of hospital competition in the market area, is measured as
the hospital’s discharges as a percentage of the total discharges in a hospital’s market area.159
Hospital competition is measures the number of hospitals physically located in the market area
and is a measure of suppliers of health care services.
There is a large variation in the location of MR hospitals. Region, captured using U.S.
census regions, is included to control for the effect of hospital location on both the likelihood of
becoming a MR hospital and the existence of regional differences.160 Annual unmeasured
factors affecting hospital financial performance and market share over time are accounted for
using year dummies.

129
Table 11. Listing of variables, measures, definitions and data sources.
Variable Measure Type Data Source
Dependent Variable
Operating Profitability Operating Margin (%) = [(Operating Revenues-Operating Costs)/(Operating Revenues)]*100
Continuous HCRIS
Total Profitability Total Margin (%) = [(Total Revenues-Total Costs)/(Total Revenues)]*100
Continuous HCRIS
Reinvestment Return on Equity (%) = [(Operating Revenues-Operating Costs)/(Equity)]*100
Continuous HCRIS
Magnet Recognition
Magnet Recognition Designation 1, Magnet Recognition Hospital; Never Magnet Recognition Hospital (referent)
Binary ANCC
Hospital Magnet Recognition Status Pre-Test (referent); Implementation; Post-Test Binary ANCC
Hospital Characteristics
Hospital size Number of Staffed Beds Continuous HCRIS
System Affiliation System Affiliation; Free Standing (referent) Binary HCRIS
Medicare Payer Mix Medicare Inpatient Days/Total Hospital Inpatient Days Continuous HCRIS
Medicaid Payer Mix Medicaid Inpatient Days/Total Hospital Inpatient Days Continuous HCRIS
Teaching Affiliation Teaching Affiliation; No Teaching Affiliation (referent) Binary AHA
Ownership Not-for-Profit; For-Profit; Government (referent) Binary AHA
Market Characteristics
Population Total Population in the County (1,000s) Continuous ARF

130
Variable Measure Type Data Source
Population Density County Population Density (population per square miles) Continuous ARF
Percent of the Population 65 and Over [Total Population Age 65 and Older in Market Area/Total Population in Market Area]*100
Continuous ARF
Income Per Capita Income in Market Area (1,000s) Continuous ARF
Unemployment Rate Unemployment Rate in Market Area Continuous ARF
Poverty Rate Percent/proportion of Families or Person in Poverty in Market Area
Continuous ARF
Distance from Residence to Hospital Average Distance from Place of Residence to Hospital (miles) Continuous ARF
Hospital Market Share Hospital Discharges/Total Discharges in Market Area Continuous ARF
Hospital Competition The total number of hospitals in the hospital’s geographical market.
Continuous HCRIS
Region Midwest; Northwest; South; West (referent) Binary ARF
Year 2000 (referent); 2001…2010 Binary ARF
ANCC: American Nurses Credentialing Center, HCRIS: Healthcare Cost Reports Information System, ARF: Area Resource File, AHA: American Hospital Association

131
Statistical Analysis
Descriptive statistics are used to summarize the data. In order to mitigate the effect of
outliers, dependent variables are winsorized at the 1st and 99th percentile. Bivariate analysis is
used to test for differences between the subgroup means for MR hospitals versus never MR
hospitals. The differences between the group means on each measure are analyzed for direction
and statistical significance using t-tests for continuous variables and chi-square test for
categorical variables. Statistical significance is set at α=0.05 for all analyses. Correlation
analysis is completed to identify potential multicollinearity among the independent variables.
The analysis is conducted using Stata 11.1 (College Station, Texas).166
Empirical Analysis - Difference-in-Difference Estimation
A difference-in-difference model with hospital fixed effects is used to estimate the effects
of MR on hospital performance:
��������' ��:X����YZ� !" # !�[���X���YZ # !�\X&'�X����������]YZ # !+�%�[�%����]YZ # !̂ [���X���YZ _ \X&'�X����������]YZ # !`[���X���YZ _ �%�[�%����]YZ # !a[�X�YZ # !b$%&���' ()������%���%5Z # !c �*�� ()������%���%5Z# ,YZ
e)�� ,YZ � fY # MYZ
where h indicates variables that vary by hospital and t indicates variables that vary by time. The
fY refers to the unobserved time-invariant variables, and the MYZ refers to the unobserved time-
variant variables.
The coefficient !� is a measure of the difference in financial performance between MR
and never MR hospitals during the pre-test phase of the study. This estimate determines if the

132
MR and never MR hospitals are similar or different at the initiation of the study. However, since
this variable is invariant over time, !� cannot be estimated using hospital fixed effects
regression. Therefore this parameter will not be estimated in the regression. Fixed Effects
Vector Decomposition (FEVD) is an econometric tool that has been recommended to estimate
the coefficient of time-invariant variables.187 Unfortunately, while the parameter estimates for
the time-invariant variables are correct the standard errors produced from the FEVD are biased
downward, resulting in false conclusions about statistical significance.188
The coefficient !+ is a measure of the difference in financial performance from the pre-
test period to the post-test period for never MR hospitals. This estimate measures the change in
the financial performance share that is attributed to market and hospital factors. The summation
!+ # !` is the difference in financial performance from the pre-test period to the post-test period
for the MR hospitals. Thus, the difference, !`, is the net effect of the MR signal on financial
performance. This estimate is a measure of the difference in financial performance between MR
and never MR hospitals and between post-test and pre-test attributed to the MR signal. In this
study, !` is the main parameter of interest since it is a measure of the effectiveness of the MR
signal on financial performance.
Results
Table 12 presents the descriptive statistics of the study sample. A comparison between
MR hospitals and never-MR hospitals reveals that MR hospitals are better financial performers.
The operating profitability (5.6% versus 3.65%), total profitability (5.71% versus 2.89%) and
return on equity (6.75% versus 4.49%) are significantly higher for MR hospitals than non-MR

133
hospitals. Another notable difference between the MR and never-MR hospitals include that MR
hospitals have a significantly higher market share (19.4% versus 17.9%).
Table 13 presents the results of the difference-in-difference regression model. Since
Magnet Recognition, Hospital size, and Region are time-invariant, these variables do not remain
in the regression model.
Results indicate that there is an overall positive and statistically significant relationship
between the MR signal and both operating profitability and total profitability (p<0.05) between
the pre-test and the post-test periods. The MR signal is associated with a 1.21 percentage point
increase in operating profitability and a 0.86 percentage point increase in total profitability.
Table 12 also shows that Medicaid payer mix, not-for-profit and for-profit ownership,
and poverty rate are significantly associated with operating profitability. Medicaid payer mix is
associated with a 0.069 percentage point decrease in operating profitability. In comparison to
government hospitals, both not-for-profit and for-profit ownership are associated with a 4.41 and
5.52 percentage point decrease in operating margin. Lastly, a one percentage point increase in
poverty rate is associated with a 0.30 percentage point increase in operating margin.
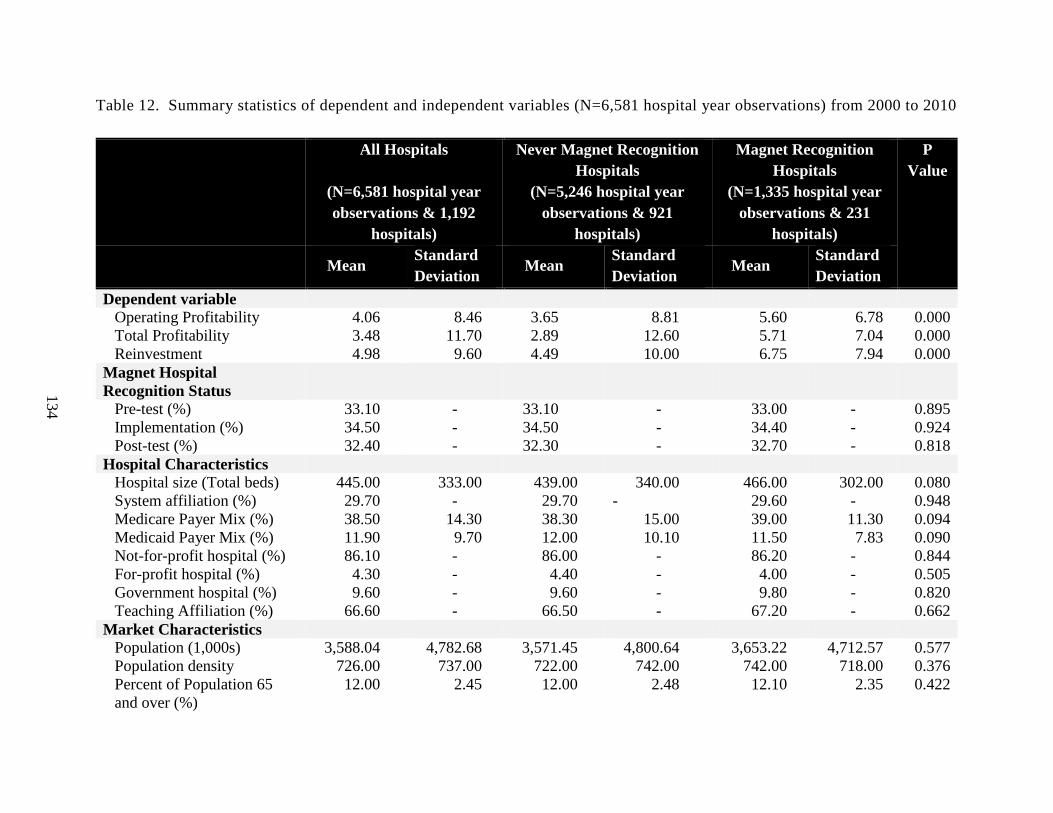
134
Table 12. Summary statistics of dependent and independent variables (N=6,581 hospital year observations) from 2000 to 2010
All Hospitals
(N=6,581 hospital year observations & 1,192
hospitals)
Never Magnet Recognition Hospitals
(N=5,246 hospital year observations & 921
hospitals)
Magnet Recognition Hospitals
(N=1,335 hospital year observations & 231
hospitals)
P Value
Mean Standard Deviation
Mean Standard Deviation
Mean Standard Deviation
Dependent variable Operating Profitability 4.06 8.46 3.65 8.81 5.60 6.78 0.000 Total Profitability 3.48 11.70 2.89 12.60 5.71 7.04 0.000 Reinvestment 4.98 9.60 4.49 10.00 6.75 7.94 0.000
Magnet Hospital Recognition Status
Pre-test (%) 33.10 - 33.10 - 33.00 - 0.895 Implementation (%) 34.50 - 34.50 - 34.40 - 0.924 Post-test (%) 32.40 - 32.30 - 32.70 - 0.818
Hospital Characteristics Hospital size (Total beds) 445.00 333.00 439.00 340.00 466.00 302.00 0.080 System affiliation (%) 29.70 - 29.70 - 29.60 - 0.948 Medicare Payer Mix (%) 38.50 14.30 38.30 15.00 39.00 11.30 0.094 Medicaid Payer Mix (%) 11.90 9.70 12.00 10.10 11.50 7.83 0.090 Not-for-profit hospital (%) 86.10 - 86.00 - 86.20 - 0.844 For-profit hospital (%) 4.30 - 4.40 - 4.00 - 0.505 Government hospital (%) 9.60 - 9.60 - 9.80 - 0.820 Teaching Affiliation (%) 66.60 - 66.50 - 67.20 - 0.662
Market Characteristics Population (1,000s) 3,588.04 4,782.68 3,571.45 4,800.64 3,653.22 4,712.57 0.577 Population density 726.00 737.00 722.00 742.00 742.00 718.00 0.376 Percent of Population 65 and over (%)
12.00 2.45 12.00 2.48 12.10 2.35 0.422

135
All Hospitals
(N=6,581 hospital year observations & 1,192
hospitals)
Never Magnet Recognition Hospitals
(N=5,246 hospital year observations & 921
hospitals)
Magnet Recognition Hospitals
(N=1,335 hospital year observations & 231
hospitals)
P Value
Mean Standard Deviation
Mean Standard Deviation
Mean Standard Deviation
Income 37,192.05 7,137.81 37,139.18 7,104.58 37,399.79 7,265.89 0.234 Unemployment Rate (%) 5.29 1.79 5.30 1.79 5.25 1.79 0.327 Poverty Rate 11.50 2.52 11.50 2.55 11.60 2.43 0.075 Distance from Residence to Hospital
16.60 8.56 16.70 8.61 16.20 8.35 0.046
Hospital competition 10.30 14.5 10.20 14.60 10.90 14.10 0.135 Hospital market share (%) 18.20 24.3 17.90 24.40 19.40 23.90 0.045
Region West 0.147 - 0.151 - 0.133 - 0.105 Midwest 0.315 - 0.311 - 0.334 - 0.098 Northeast 0.194 - 0.190 - 0.210 - 0.089 South 0.343 - 0.349 - 0.322 - 0.068
Year 2000 (%) 0.039 - 0.039 - 0.039 - 0.958 2001 (%) 0.066 - 0.066 - 0.066 - 0.996 2002 (%) 0.090 - 0.090 - 0.090 - 0.975 2003 (%) 0.108 - 0.108 - 0.109 - 0.924 2004 (%) 0.127 - 0.127 - 0.126 - 0.913 2005 (%) 0.139 - 0.139 - 0.139 - 0.984 2006 (%) 0.134 - 0.134 - 0.133 - 0.949 2007 (%) 0.107 - 0.107 - 0.107 - 0.983 2008 (%) 0.082 - 0.082 - 0.083 - 0.853 2009 (%) 0.064 - 0.064 - 0.063 - 0.861 2010 (%) 0.044 - 0.044 - 0.045 - 0.920

136
Table 13. Difference-in-difference regression with hospital fixed effects
Dependent Variable Operating Profitability Total Profitability Return on Equity
Coefficient Robust SEs
Coefficient Robust SEs
Coefficient Robust SEs
Hospital Intervention Magnet Recognition Hospitala, f - - - - - - Magnet Recognition Hospital Status Implementationb 0.12 0.28 −0.28 0.28 0.15 0.45 Post-testb −0.030 0.46 −0.51 0.47 0.20 0.77 Magnet Recognition*Implementation 0.36 0.38 0.36 0.35 −0.47 0.60 Magnet Recognition*Post-test 1.21* 0.49 0.86* 0.43 0.088 0.71 Hospital Characteristics Hospital Sizef - - - - - - System affiliation 0.065 0.39 0.044 0.360 0.423 0.640 Medicare Payer Mix 0.034 0.048 0.029 0.040 0.110 0.070 Medicaid Payer Mix −0.069* 0.030 −0.048 0.030 −0.120* 0.050 Not-for-profit hospitale −4.41* 2.13 −1.46 1.33 4.55** 1.75 For-profit hospitale −5.52* 2.62 −2.76 2.02 2.31 3.10 Teaching Affiliation −1.19 0.75 0.12 0.65 −2.93 1.63 Market Characteristics Population (1,000s) −0.0039 0.0032 −0.0024 0.0027 −0.0038 0.0048 Population Density 0.013 0.019 0.008 0.017 0.014 0.028 Percent of Population 65 and over −1.18 0.84 −1.31 0.73 −0.16 1.08 Income 0.000050 0.00011 0.00 0.00 0.00 0.00 Unemployment Rate 0.043 0.18 0.00 0.17 0.010 0.26 Poverty Rate 0.30* 0.13 0.16 0.13 0.097 0.18 Distance from Residence to hospital −0.0026 0.13 −0.016 0.09 0.086 0.19 Hospital Competition −0.043 0.15 −0.25 0.13 0.19 0.26 Hospital Market Share (%) 8.31 5.19 7.21 5.13 2.91 5.05 Region Northeastd, f - - - - - -

137
Dependent Variable Operating Profitability Total Profitability Return on Equity
Coefficient Robust
SEs Coefficient Robust
SEs Coefficient Robust
SEs Midwestd, f - - - - - - Southd, f - - - - - - Time Year 2001c 0.14 0.70 −0.59 0.55 −0.96 0.99 Year 2002 c 0.73 0.84 −0.69 0.72 −1.13 1.15 Year 2003 c 0.66 0.94 −0.058 0.85 −0.51 1.30 Year 2004 c 0.92 1.07 0.69 0.96 0.37 1.53 Year 2005 c 1.32 1.19 1.21 1.09 0.086 1.72 Year 2006 c 0.93 1.38 1.36 1.30 −0.31 2.02 Year 2007 c 1.77 1.56 2.31 1.48 −0.20 2.32 Year 2008 c 0.29 1.91 −0.84 1.78 −3.97 2.79 Year 2009 c 1.25 2.20 0.74 2.05 −1.89 3.22 Year 2010 c 3.09 2.39 3.49 2.23 0.11 3.62
Constant 18.96 14.64 21.26 12.68 −4.60 23.01
Number of Hospital Year Observations 6,122 6,065 5,929 Number of Hospitals 1,100 1,103 1,097
F Statistic (29, 1099)=4.42 p=0.000
(29, 1102)=12.18 p=0.000
(29,1096)=8.15 p=0.000
aReference is control hospitals; bReference is the pre-test period; cReference is year 2000; dReference is west; eReference is government hospitals; fTime invariant variables. *Statistically significant at the 5% level. **Statistically significant at the 1% level. Fixed effects are at the hospital level.

138
Discussion
The primary finding of this study is that the MR signal results in an increase in hospital
profitability. Specifically, the MR signal is associated with a 1.21 percentage point increase in
operating margin and a 0.86 percentage point increase in total margin. This translates to a $1.21
million increase in operating margin and $0.86 million increase in total operating margin for
every $100 million in revenue. Based on the regression estimates, an average MR hospital has
an operating margin of 5.61% and a total margin of 4.96% compared to an operating margin of
3.71% and a total margin of 3.72% for an average never-MR hospital.
These findings support the claims made in the various sources of literature that the non-
financial benefits resulting from MR will result in improved financial performance. These non-
financial benefits, which include improved retention and decreased turnover of nurses118, 132,
improved satisfaction for all clinical staff15, 86, improved patient quality and safety120, 214, and
increased customer attraction for hospital selection96, all correspond to potential for cost savings
and increased revenue opportunities38 that can improve financial performance.
A recent study by Jayawardhana et al. (2014) found evidence that MR hospitals result in
a significant increase in both inpatient costs and inpatient revenues.41 However, in order to
achieve higher profitability (both operating and total profitability), the increase in inpatient costs
would need to be offset by higher net inpatient revenue. In a previous research study, the author
investigated the effect of MR signal on market share and reimbursement. In contrast to findings
from previous descriptive studies, the empirical results from this analysis indicate that the MR
signal does not have an effect on either hospital reimbursement or hospital market share.32
These findings imply that the MR signal does not result in an increase a hospital’s revenue.

139
The author also investigated the effect of the MR signal on hospital cost inefficiency
applying a SFA, using total hospital expenses in the analysis. The results from this study
indicate that the MR signal is associated with a significant (p<0.01) reduction in hospital cost
inefficiency, which may be attributed to either the signaling effect of MR and/or operational and
process changes that occur due to the transition to becoming a MR hospital. Decreases in
hospital cost inefficiency are related to a reduction in hospital expenditures and increased
productivity.131 In the study by Jayawardhana et al. (2014) MR was found to increase inpatient
costs by 2.46%41, which suggests that any potential cost savings due to the delivery of cost
effective patient care may be trivial, since on average inpatient costs appear to increase instead of
decrease. This increase in inpatient costs in MR hospitals41 supports the hypothesis that the
reduction in cost inefficiency may be due to the MR signal. The increases in hospital
profitability observed in this study may be attributed to a reduction in expenditures instead of
increases in either market share or reimbursement.
Medicaid payer mix was found to have a negative effect on operating margin which is
consistent with the findings in the literature. It has been shown that hospitals that are dependent
on Medicaid have a higher probability of closing, a higher probability of bond rating downgrades
and a lower profitability.146 In terms of hospital ownership, both not-for-profit and for-profit
hospitals have lower operating margins than government hospitals, which was unexpected.
Property rights theory suggests that for-profit hospitals will be more focused on earning profits
than not-for-profit hospitals. These results can be explained by the internal pressures to reduce
costs and increase efficiency that are associated with ownership. Government hospitals likely
have more pressure to reduce costs because of their accountability to the public, when compared
to not-for-profit and for-profit hospitals.

140
Also of interest is that poverty rate is associated with an increase in operating margin.
This was an unexpected finding. Poverty rate is considered to be an indicator of a community’s
financial ability to purchase health care services. Hospitals located in areas with higher poverty
rates may respond by reducing inefficiencies and focusing on cost saving strategies, which may
lead to improvements in operating margin.
Implications
The results of this study suggest that MR hospitals are more profitable than non-MR.
This finding has implications for providers, policy makers, and the ANCC itself. First and
foremost, hospital CNOs may now be more encouraged to pursue MR designation. In an era of
scarce resources, some CNOs may have been reluctant to approach senior management and
Boards with what could be considered costly proposals.. Removal or at least reduction of this
barrier may empower nurse executives and lead to a new focus on nursing excellence in some
hospitals.
Fewer CEOs and CFOs may perceive MR as a costly endeavour and may consider the
pursuit of the designation due to the potential positive financial benefits. CEOs and CFOs have a
fiduciary responsibility to invest scarce capital resources in ways that maximize benefit to the
organization. Senior managers now have evidence that pursuing MR recognition will not
necessarily adversely affect the financial health of the organization and indeed may improve it.
This study strengthens the argument for MR, which has been perceived as a costly pursuit with
negligible returns on the requisite investment.
Government, accreditation and industry organizations may support or require hospitals to
attain MR. With the emphasis on reduction in reimbursement and linking reimbursement to the
delivery of quality care, hospitals are facing challenges that impact their future sustainability and

141
ability to continue operations. MR may be a potential solution to help hospitals to continue to be
financially viable while still improving quality of care by focusing on quality management,
efficiency and cost containment. Although MR is a costly endeavour, hospitals may be
encouraged to pursue MR through either the provision of financial support, financial incentives,
or changes in reimbursement.
From the perspective of the ANCC itself, the study results may enhance the reputation
and the perceived value of MR, may lead to more applications for MR, and increase the visibility
and popularity of MR. The ANCC now has evidence of the financial benefits of the Magnet
designation. However, as the demand for MR increases and more hospitals seek to become MR,
the distinction and exclusivity attached to the MR signal may become weakened or diluted. To
prevent this from happening, the ANCC may become more selective in bestowing hospitals with
the MR designation by utilizing more rigor in review criteria.
Limitations
There are a few limitations associated with this study. Primarily, there are a number of
variables of interest that were not included in the analysis due to inaccessibility of the data or
inability to measure specific variables, potentially resulting in biased parameter estimates in the
proposed empirical analysis. For example, the scope of services provided has been found to be
strongly associated with likelihood of pursuing Magnet designation 197, but is not available in the
existing data set. In addition, the existence of other process management techniques, hospital’s
management style, and measures of organizational culture are unobservable but could affect how
a hospital is managed both financially and operationally. However, the use of fixed effects
regression was intended to control for variables such as these and all other unmeasured fixed
hospital characteristics, which may be time invariant.

142
Although the analysis attempted to match MR hospitals to never MR hospitals, no two
hospitals are similar in all respects. Propensity scores only control for observed variables and do
not consider the effect of unobserved variables163 in the decision of hospitals to seek MR. For
example, a hospital may seek MR if other quality measures are decreasing. This non-random
decision to seek MR can thus result in biased parameter estimates of the likelihood of MR.
Although the ANCC website lists the current MR designated hospitals, it does not
provide information on hospitals that applied for MR but were unsuccessful, hospitals that are
currently undergoing the transformation to become MR recognized, or hospitals that had their
MR status rescinded due to non-compliance with the program’s requirements.
Conclusion
Although the primary purpose of the MR is not to improve financial performance of
hospitals, with the current economic climate, fiscal constraints, healthcare workforce shortages,
and reduced reimbursements, hospitals might be contemplating pursuing this strategy to increase
competitiveness in the health care market and to improve financial performance. The pursuit of
the MR is an important organizational decision resulting in substantial modifications to the
structure and culture of organizations and requires considerable investment of time and
resources, initially and ongoing as the process continues. Knowledge of the pathway by which
the MR signal effects hospital financial performance can be the deciding factor for hospital
managers and decision-makers interested in undertaking this endeavour.

143
CHAPTER 7: CONCLUSION
What did the three studies investigate?
This dissertation research aims to address the existence of information asymmetry in
health care organizations by applying signaling theory to investigate the effect of MR on the
various dimensions of financial performance. The three research studies in Chapters 3 to 6
investigated whether the MR signal has an impact on a hospital’s financial performance. MR is
proposed to be a signal of unobserved quality utilized by hospitals. According to signaling
theory, hospitals signal their commitment to nursing excellence and quality care through the MR
designation. The signal is received by payers, patients, and providers. Their responses and
actions to the signal will influence three different intermediate outcomes: increasing
reimbursement, increasing market share, and/or reducing cost inefficiency. An increase in
reimbursement and/or market share will increase revenue and decreasing hospital cost
inefficiency will reduce hospital expenditures. The combined effect will be an increase in
hospital profitability.
What did the three studies find?
Although MR signal has been hypothesized to improve reimbursement through
negotiations with payers32 and increase market share by increasing patient volume through
signaling to patients and providers the hospital’s commitment to patient quality15, 18, 31, the results
in Chapter 4 do not support these hypotheses. The effect of the MR signal on hospital market

144
share and hospital reimbursement, while controlling for hospital and market characteristics,
indicate that the MR signal has no influence on either of these intermediate outcomes.
MR has also been associated with the promotion of excellence in nursing care86 and
professional nursing practice131, emphasis on collaboration and team work34, 35, and creation of a
positive culture and work environment.33 Providers are expected to interpret the MR signal and
respond by seeking or maintaining employment in designated hospitals resulting in reduced
nursing turnover, reduced recruitment118, 132 and orientation costs38, reduced usage of agency
nurses38 and increased provider satisfaction.33, 60 The combination of these outcomes is
hypothesized to improve hospital efficiency by increasing productivity and reducing costs. The
results in Chapter 5 indicate that MR decreases hospital cost inefficiency of designated hospitals
compared to control hospitals. This finding supports the hypothesis of this study, and confirms
the claims stated in the literature that MR increases hospital efficiency.127, 129 However, in
addition to the MR signal, the improvement in efficiency may also be attributed to operational
and structural changes in the hospital. The requirements of attaining MR may result in changes
in the hospital’s policies and procedures, leading to the delivery of cost effective patient care and
therefore a reduction in cost inefficiency. Unfortunately, the distinction between these two
pathways cannot be determined.
Finally, there is growing evidence (empirical and anecdotal) that MR hospitals are
associated with positive nursing, patient and organizational outcomes.24, 25 These outcomes are
interrelated and have been theorized to affect hospital financial performance through three
pathways: (1) cost savings, (2) increased revenue, and (3) market share, all through signaling
delivery of quality care to payers, patients and providers. The results in Chapter 6 show that the
MR signal results in an increase in hospital profitability. The results from Chapter 4 indicate that

145
the increases in profitability are not attributed to either hospital reimbursement or hospital
market share, since the MR signal did not have a significant effect on either of these outcomes.
However, the increases in profitability may be due to a reduction in costs, occurring though
improvements in hospital efficiency, which is confirmed in Chapter 5. The results in Chapter 5
show that MR is associated with a decrease in hospital cost inefficiency. However, this decrease
may be due to either the signaling of MR to providers or the changes in the hospital’s structure,
process and delivery methods93 that are required to become a MR. Unfortunately, the
contribution of each pathway to the reduction in cost inefficiency is unknown. However, a
recent study found an increase in average inpatient costs for MR hospitals41, which may question
the ability of a MR hospital to reduce costs in the provision of cost effective care.
Is Magnet Recognition an effective signal of unobserved quality?
The premise of this study was to determine the effectiveness of MR as a signal of
unobserved quality. MR is considered to be a signal used by hospitals to communicate to
consumers and health care providers about the care which they can expect to receive in a MR
hospital.13-15 MR is proposed to reduce the information asymmetry by signaling to various
stakeholders, the hospitals’ commitment to nursing excellence and quality management
strategies. It is considered to be an effective signal of quality because it meets the two conditions
previously described. First, MR is directly observable by consumers because hospitals have
been shown to strongly promote receipt of the designation through marketing, public display of
banners, and other advertising.16, 60-62 Second, MR is costly63 and therefore difficult to imitate for
providers that do not have meaningful quality information to convey.64

146
The effectiveness of the MR signal is determined by its impact on the various dimensions
of hospital financial performance: reimbursement, market share, cost inefficiency and
profitability. Previous research suggests that the MR designation may signal quality information
to multiple stakeholders including patients, payers and providers. It is hypothesized that if the
MR signal is effective, these stakeholders will respond accordingly and the signaling hospital
will experience an increase in hospital reimbursement32, market share15, 18, 31, efficiency15, 133 and
profitability.38, 136, 137
However, from the results of this study, it can be concluded that the effectiveness of the
MR signal is limited. The MR signal did not appear to elicit the expected outcome from the
hospital. In other words, it had no effect on either hospital reimbursement or market share. This
result may be explained by a number of factors. The signaling environment may hamper or
strengthen the signaling effect. A noisy environment, such as the existence of multiple different
signals may diminish the observability of the signal. According to Connelly et al. (2011), signal
effectiveness is also dependent upon the characteristics of the signal, such as signal strength,
signal visibility, signal clarity, and signal frequency which are used to describe the detectability
of a signal. Even if the signal is strong, the effectiveness may be determined by the
characteristics of the receiver of the signal. The signal will not be recognized if the receiver is
not looking for the signal or if the receiver is unable to interpret the signal.43
On the contrary to the findings listed above, MR was found to result in a decrease in
hospital inefficiency, which supports the stated hypothesis. The MR signal has been
hypothesized to reduce hospital inefficiency through reduced nursing turnover, reduced
recruitment118, 132 and orientation costs38, reduced usage of agency nurses38 and increased
provider satisfaction.33, 60 However, structural and operational changes attributed to the MR

147
program may also be responsible for these findings.93 Unfortunately, the results of this study
cannot determine the pathway by which hospital cost inefficiency is reduced. A recent study
found that inpatient costs increased in MR hospitals41, instead of decreased costs as proposed by
Mason (2003).127, 129 The increased inpatient costs in MR hospitals may weaken the argument
that cost efficiency is due to the delivery of cost-effective care, but instead may be due to the MR
signal and its reduction in nursing personnel costs, as stated previously. The effectiveness of the
MR signal in this pathway may be due to the characteristics of the receiver, in this case the
provider. Since MR is a designation given to hospitals for their dedication and commitment to
nursing excellence and quality patient care, providers such as nurses may seek out and interpret
this signal when selecting future employment.
The combined effect of the MR signal was found to result in a significant increase in
hospital profitability. This increase in hospital profitability may be explained by the reduction in
hospital inefficiency, which is associated with a decrease in hospital expenses. Given the
findings of these three studies, the effectiveness of the MR signal appears to vary depending on
the receiver. Overall, the MR signal can be described as weak and unrecognizable. First, the
signal does not appear to be readily detected by receivers. Second, the signaling frequency is
hindered due to the small number of MR hospitals currently in existence, thereby limiting the
number of MR signals that are produced. Third, the signal fit, which is the correlation between
the MR signal and hospital’s unobservable quality (the focus on nursing excellence and quality
patient care) is diminished. The signal effectiveness is also determined by the characteristics of
the receivers. In order for a signal to be effective, the receiver needs to be actively scanning the
environment for the signal. In this study, specifically the payers and patients may not be actively
seeking out the MR signal, so these parties may be unaware of the existence of the MR signal

148
and do not respond as expected. Different receivers also interpret signals differently than others
do. Providers like nurses and physicians, may be more aware of the MR signal, since it is a
hospital designation, and may have a different interpretation of this signal when compared to
patients and payers, who may have a completely different interpretation.43
What are the management and policy implications of the three studies?
First, for a signal to be effective, it needs to valid, recognizable, interpretable and elicit
the appropriate response. No impact between MR and hospital reimbursement suggests that
hospital CEOs and CFOs may not be leveraging MR as a means to highlight their quality
accomplishments to negotiate better reimbursement rates from payers. In turn, the payers may
not recognize, not interpret, and/or not respond to the MR signal. Payers may either be unaware
or not value that MR hospitals are acknowledged as providers of excellence in nursing care.213
Although previous research suggests that quality metrics emphasize the hospital’s commitment
to quality management and may even give hospitals an added advantage in negotiations194, the
MR signal does not appear to provide this benefit.
Second, no impact between MR signal and hospital market share indicates that hospital
executives and policy makers should carefully consider the financial resources dedicated to
publicizing MR. Hospitals incur enormous costs in the promotion of MR. Full page newspaper
advertisements, billboards, websites and television spots are used to promote MR in an attempt
to raise awareness and to market themselves to patients, nurses and the community.60 While MR
has been associated with various positive benefits for patients, nurses and the organization, these
benefits may not be communicated by the MR signal to these various stakeholders, perhaps due
to weaknesses in the signal.

149
Third, In light of the reduction in reimbursements payment methods and an increased
focus on cost reduction and quality improvement, there may be an increased in demand by
hospitals interested in pursuing the designation as a means to remain financially viable. Policy
makers may consider promoting MR or components of MR as pathways to not only improve
quality, but also to reduce costs and improve efficiency.
Fourth, from the perspective of the MR program, the study results may enhance the
reputation and the perceived value of MR and may lead to more applications for MR and
increase the visibility and popularity of MR. For hospitals, fewer CEOs and CFOs may perceive
MR as a costly endeavour and may consider the pursuit of the designation due to the potential
positive financial benefits. For government, accreditation and industry organizations may
support or require hospitals attain MR as a means to improve quality and sustainability.
Finally, these results present hospital managers and policy makers with the pathway by
which the MR signal has an impact on hospital profitability and the need to review and
comprehend the structure and processes that lead to the improvement in hospital profitability.
The primary purpose of the MR is not to improve reimbursement, increase market share, or
reduce cost inefficiency. However, with the current economic climate, fiscal constraints,
healthcare workforce shortages, and reduced reimbursements, hospitals might be contemplating
pursuing this strategy to increase competitiveness in the health care market and to improve
financial performance. The pursuit of the MR is an important organizational decision resulting
in substantial modifications to the structure and culture of organizations and requires
considerable investment of time and resources, initially and ongoing as the process continues.

150
REFERENCES
1. Rao AR, Qu L, Ruekert RW. Signaling Unobservable Product Quality through a Brand Ally. J Market Res 1999;36:pp. 258-268.
2. Erdem TT. Brand Equity as a Signaling Phenomenon. Journal of consumer psychology 1998;7:131-157.
3. Kirmani AA. No Pain, No Gain: A Critical Review of the Literature on Signaling Unobservable Product Quality. J Market 2000;64:66-79.
4. Roberts PPW. Corporate reputation and sustained superior financial performance. Strategic Manage J 2002;23:1077-1093.
5. Gelb DS, Siegel P. Intangible assets and corporate signaling. Rev Quant Finance Account 2000;15:307-323.
6. Malani AA. Does Nonprofit Status Signal Quality? The Journal of legal studies 2008;37:551-576.
7. Terlaak AA. The effect of certification with the ISO 9000 Quality Management Standard: A signaling approach. Journal of economic behavior & organization 2006;60:579-602.
8. Werner RRM. Do consumers respond to publicly reported quality information? Evidence from nursing homes. J Health Econ 2012;31:50-61.
9. O'Neill C, Largey A. The role of quality standards-accreditation in redressing asymmetry of information in health care markets. Health Policy 1998;45:33-45.
10. Faber M, Bosch M, Wollersheim H, et al. Public Reporting in Health Care: How Do Consumers Use Quality-of-Care Information?: A Systematic Review. Med Care 2009;47:1.
11. Parsons ML, Cornett PA. Sustaining the pivotal organizational outcome: magnet recognition. J Nurs Manag 2011;19:277-286.
12. Karkos B, Peters K. A Magnet community hospital: Fewer barriers to nursing research utilization. J Nurs Adm 2006;36:377-382.
13. Jenkins M, Fields B. Pursuing Magnet(R) designation as a system or as individual entities: what is the right decision? J Nurs Adm 2011;41:172-178.
14. Hancock B. Magnet recognition: the Rush experience. J Christ Nurs 2006;23:22-25.
15. Buchan J. Magnet hospitals: what's the attraction? Nurs Stand 1997;12:22-25.

151
16. Bumgarner SD, Beard EL,Jr. The magnet application: pitfalls to avoid. J Nurs Adm 2003;33:603-606.
17. Smith EL. Making the magnet commitment. J Nurses Staff Dev 2003;19:272-6; quiz 277-8.
18. Lash AA, Munroe DJ. Magnet designation: A communique to the profession and the public about nursing excellence. Medsurg Nurs 2005;Suppl:7-12; quiz 13.
19. Gerhardt WE, VanKuiken D. Assessing magnet readiness using the nursing work index-revised survey. J Nurs Adm 2008;38:429-434.
20. Goode CJ, Krugman ME, Smith K, et al. The pull of magnetism: a look at the standards and the experience of a western academic medical center hospital in achieving and sustaining Magnet status. Nurs Adm Q 2005;29:202-213.
21. Rich VL, Barnsteiner JH. Achieving Magnet designation. Pa Nurse 2007;62:25-26.
22. Caskey L. Magnet hospitals: another look at a challenge for nurses. Okla Nurse 2002;47:26.
23. Gokenbach V, Drenkard K. The outcomes of Magnet environments and nursing staff engagement: a case study. Nurs Clin North Am 2011;46:89-105.
24. Hill KS. Magnet hospitals: recruiting and retaining nurses. Nurs Clin North Am 2011;46:xiii-xiv.
25. Westendorf JJ. Magnet recognition program. Plast Surg Nurs 2007;27:102-104.
26. Lewis C. Magnet status application. J Vasc Nurs 2008;26:65-66.
27. Patient satisfaction planner. Magnet facility credits communication for success. Hosp Peer Rev 2008;33:35-37.
28. Ulrich BT, Buerhaus PI, Donelan K, et al. Magnet status and registered nurse views of the work environment and nursing as a career. J Nurs Adm 2009;39:S54-62.
29. Morgan SH. Magnet learning communities. J Nurs Care Qual 2011;26:197-198.
30. ANCC. ANCC Magnet Recognition Program, 2011. 2011. Available at: http://nursecredentialing.org/Magnet.aspx. Accessed 9/26/2011.
31. Gaguski M. Magnet status--what's the attraction? ONS News 2006;21:1, 4-6.
32. Smith AP. Paving and resurfacing the road to Magnet: devil in the details--part II. Medsurg Nurs 2007;16:32-34.

152
33. Havens DS, Aiken LH. Shaping systems to promote desired outcomes. The magnet hospital model. J Nurs Adm 1999;29:14-20.
34. Kelly LA, McHugh MD, Aiken LH. Nurse outcomes in magnet(R) and non-magnet hospitals. J Nurs Adm 2011;41:428-433.
35. Ridley J, Wilson B, Harwood L, et al. Work environment, health outcomes and magnet hospital traits in the Canadian nephrology nursing scene. CANNT J 2009;19:28-35.
36. Tuazon N. Is Magnet a money-maker? Nurs Manage 2007;38:24, 26, 28-31.
37. Upenieks VV. What constitutes effective leadership? Perceptions of magnet and nonmagnet nurse leaders. J Nurs Adm 2003;33:456-467.
38. Drenkard K. The business case for Magnet. J Nurs Adm 2010;40:263-271.
39. Abraham J, Jerome-D'Emilia B, Begun JW. The diffusion of Magnet hospital recognition. Health Care Manage Rev 2011;36:306-314.
40. Russell J. Journey to Magnet: cost vs. benefits. Nurs Econ 2010;28:340-342.
41. Jayawardhana J, Welton JM, Lindrooth RC. Is There a Business Case for Magnet Hospitals? Estimates of the Cost and Revenue Implications of Becoming a Magnet. Med Care 2014.
42. Signaling Theory – An Introduction | Kiran Dhanwada Available at: http://kirandhanwada.com/2009/08/24/signaling-theory-–-an-introduction/. Accessed 7/11/2012.
43. Connelly BBL. Signaling Theory: A Review and Assessment. Journal of management 2011;37:39-67.
44. Dawar NN. The signaling impact of low introductory price on perceived quality and trial. Mark Lett 1997;8:251-259.
45. Talmor E. Asymmetric information, signaling, and optimal corporate financial decisions. Journal of Financial and Quantitative analysis 1981;16:413-435.
46. Koku PPS. Corporate name change signaling in the services industry. The Journal of services marketing 1997;11:392-408.
47. McGuire JB, Schneeweis T, Branch B. Perceptions of firm quality: A cause or result of firm performance. Journal of Management 1990;16:167-180.
48. Chemmanur TJ, Paeglis I, Simonyan K. Management quality, financial and investment policies, and asymmetric information. Journal of Financial and Quantitative Analysis 2009;44:1045.

153
49. Heil OO. Toward a theory of competitive market signaling: A research agenda. Strategic Manage J 1991;12:403-418.
50. Benner MJ. ISO 9000 practices and financial performance: A technology coherence perspective. J Oper Manage 2008;26:611.
51. Archibald RB, Haulman CA, Moody Jr CE. Quality, price, advertising, and published quality ratings. Journal of Consumer Research 1983:347-356.
52. Abe M. Price and advertising strategy of a national brand against its private-label clone: A signaling game approach. Journal of Business Research 1995;33:241-250.
53. Caves RE, Greene DP. Brands' quality levels, prices, and advertising outlays: empirical evidence on signals and information costs. International Journal of Industrial Organization 1996;14:29-52.
54. Erdem T, Swait J, Valenzuela A. Brands as signals: A cross-country validation study. J Market 2006:34-49.
55. Erdem T, Swait J. Brand credibility, brand consideration, and choice. Journal of Consumer Research 2004;31:191-198.
56. Herbig P, Milewicz J. Market Signaling in Hospitals. J Hosp Mark 1993;7:135-145.
57. Malani A, David G. Does nonprofit status signal quality? The Journal of Legal Studies 2008;37:551-576.
58. Boulding W, Kirmani A. A consumer-side experimental examination of signaling theory: do consumers perceive warranties as signals of quality? Journal of Consumer Research 1993:111-123.
59. Nelson EC, Rust RT, Zahorik A, et al. Do patient perceptions of quality relate to hospital financial performance? J Health Care Mark 1992;12:6-13.
60. Lewis CK, Matthews JH. Magnet program designates exceptional nursing services. Am J Nurs 1998;98:51-52.
61. Aiken LH, Havens DS, Sloane DM. The Magnet Nursing Services Recognition Program. Am J Nurs 2000;100:26-35; quiz 35-6.
62. Schlag MK, Sengin KK, Shendell-Falik N. Achieving magnet status. Nurs Adm Q 1998;22:1-10.
63. Pinkerton SE. The financial return on Magnet recognition. J Contin Educ Nurs 2005;36:51-52.

154
64. Vekony A, Halford M, Fowler T, et al. Hutt Valley DHB achieves Magnet recognition. Nurs N Z 2007;13:16-18.
65. Riehl M. Why you should consider working at a magnet hospital. Nursing 2007;37 Suppl Career:39.
66. Morgan SH, Lahman E, Hagstrom C. The Magnet Recognition Program: transforming healthcare through excellence in nursing services. J Nurs Care Qual 2006;21:119-120.
67. Wolf G, Triolo P, Ponte PR. Magnet recognition program: the next generation. J Nurs Adm 2008;38:200-204.
68. Duchene PM. Magnet recognition: one hospital's journey. Health Prog 2010;91:29-33.
69. Brahm N, Kelly-Rehm M, Farmer KC. Collaboration: what can health-care organizations learn about pharmacist retention from Magnet status hospitals? Res Social Adm Pharm 2009;5:382-389.
70. Roberts D. The Magnet philosophy: a prescription for nursing excellence. Medsurg Nurs 2007;16:6.
71. Brady-Schwartz DC. Further evidence on the Magnet Recognition program: implications for nursing leaders. J Nurs Adm 2005;35:397-403.
72. Ma CC, Hwang PW, Alexander JW. Taiwanese nurses' cognition and attitudes towards the Magnet Hospitals Recognition Programme. Int Nurs Rev 2010;57:78-84.
73. Delaney KR, Lynch P. Magnet forces: a structure for a transformation in inpatient psychiatric nursing. J Am Psychiatr Nurses Assoc 2008;14:346-352.
74. Ingle LL. Is obtaining magnet status valuable? J Nurses Staff Dev 2004;20:187-8; author reply 188.
75. Walker K, Middleton S, Rolley J, et al. Nurses report a healthy culture: results of the Practice Environment Scale (Australia) in an Australian hospital seeking Magnet recognition. Int J Nurs Pract 2010;16:616-623.
76. Weeks SK, Smith BC, Hubbartt E. Magnet recognition for nursing excellence--is your organization there yet? Rehabil Nurs 2006;31:48-51.
77. Dean-Baar S. Magnet Recognition Program illuminates nursing roles. Rehabil Nurs 2003;28:38.
78. Mueller C. Demonstrating excellence, attaining Magnet status. Creat Nurs 2002;8:7-8.

155
79. Grant B, Colello S, Riehle M, et al. An evaluation of the nursing practice environment and successful change management using the new generation Magnet Model. J Nurs Manag 2010;18:326-331.
80. Lindgren CL, Elie LG, Vidal EC, et al. Transforming to a computerized system for nursing care: organizational success within Magnet idealism. Comput Inform Nurs 2010;28:74-78.
81. Smith A. Paving and resurfacing the road to Magnet: the perspective and wisdom of Magnet-designated coordinators--part I. Medsurg Nurs 2007;16:29-31, 37.
82. Bliss-Holtz J, Winter N, Scherer EM. An invitation to Magnet accreditation. Nurs Manage 2004;35:36-42; quiz 43.
83. Houser B, Milton D. The Magnet pregnancy: phases of the journey to excellence. J Nurs Adm 2006;36:513-517.
84. Conerly C, Thornhill L. The Magnet site visit: your time to shine. Nursing 2010;40 Suppl:36-37.
85. Coile RC,Jr. Magnet hospitals use culture, not wages, to solve nursing shortage. J Healthc Manag 2001;46:224-227.
86. Trinkoff AM, Johantgen M, Storr CL, et al. A comparison of working conditions among nurses in Magnet and non-Magnet hospitals. J Nurs Adm 2010;40:309-315.
87. Jurkovich P, Karpiuk K, King CA. Magnet recognition: examples of perioperative excellence. AORN J 2010;91:292-299.
88. Greene J. Attracting nurses. Why magnet hospitals succeed. Trustee 2003;56:20-3, 1.
89. Day C. Engaging organizational support for the Magnet journey. Nurs Manage 2008;39:44-48.
90. Anderson HJ. Magnet hospitals rely on I.T. Health Data Manag 2008;16:70, 72, 74.
91. Grindel C, Roman M. The medical-surgical nurse: being a Magnet for excellence. Medsurg Nurs 2005;Suppl:4, 34.
92. Kassulke S. Becoming a Magnet hospital: the role of the perianesthesia nurse. J Perianesth Nurs 2004;19:71-77.
93. Jasovsky DA, Dornan LM, Geisler L, et al. Magnet demographic data: creating a system to streamline the process. J Nurs Adm 2005;35:490-496.
94. Cox KS, Carroll C, Sexton K. Achieving Magnet status: demonstrating nursing excellence. Kans Nurse 2005;80:1-2.

156
95. Steinbinder A. Bumps on the road to Magnet designation: achieving organizational excellence. Nurs Adm Q 2009;33:99-104.
96. Aiken LH, Havens DS, Sloane DM. Magnet nursing services recognition programme. Nurs Stand 2000;14:41-47.
97. Smith AP. Paving and resurfacing the road to Magnet: part III--unique organizational characteristics. Medsurg Nurs 2007;16:35-37.
98. Cox K, Drenkard K. Magnet innovations and outcomes in children's healthcare. J Pediatr Nurs 2011;26:105-106.
99. Havens DS, Johnston MA. Achieving magnet hospital recognition: chief nurse executives and magnet coordinators tell their stories. J Nurs Adm 2004;34:579-588.
100. Broom C, Tilbury MS. Magnet status: a journey, not a destination. J Nurs Care Qual 2007;22:113-118.
101. Middleton S, Griffiths R, Fernandez R, et al. Nursing practice environment: how does one Australian hospital compare with magnet hospitals? Int J Nurs Pract 2008;14:366-372.
102. Wallace B. The Magnet(R) journey of a community hospital. Am J Nurs 2011;111:30-31.
103. Luzinski C. Introducing the official leadership journal of the magnet recognition program(R). J Nurs Adm 2011;41:389-390.
104. Magnet makes an attractive marketing tool. Health Care Strateg Manage 2006;24:1, 13-6.
105. Frazier SC. Magnet home care agencies: a professional way to impact quality and retention. Home Healthc Nurse 2003;21:603-610.
106. Upenieks VV, Sitterding M. Achieving magnet redesignation: a framework for cultural change. J Nurs Adm 2008;38:419-428.
107. Rourke DR. The hospital library as a "magnet force" for a research and evidence-based nursing culture: A case study of two magnet hospitals in one health system. Med Ref Serv Q 2007;26:47-54.
108. Wise NJ. Maintaining magnet status: establishing an evidence-based practice committee. AORN J 2009;90:205-213.
109. Halfer D. Supporting nursing professional development: a magnet hospital's story. J Nurses Staff Dev 2009;25:135-140.
110. Poduska DD. Magnet designation in a community hospital. Nurs Adm Q 2005;29:223-227.

157
111. Atkinson M, Turkel M, Cashy J. Overcoming barriers to research in a Magnet community hospital. J Nurs Care Qual 2008;23:362-368.
112. Ingersoll GL, Witzel PA, Berry C, et al. Meeting Magnet research evidence-based practice expectations through hospital-based research centers. Nurs Econ 2010;28:226-35; quiz 236.
113. Pieper SK. Retaining staff the magnet way: fostering a culture of professional excellence. Healthc Exec 2003;18:12-17.
114. Inglis T. Seeking magnet hospital status. A TNA member's account of the arduous application process. Tex Nurs 2000;74:7, 10-2.
115. Robinson CA. Magnet nursing services recognition: transforming the critical care environment. AACN Clin Issues 2001;12:411-423.
116. Armstrong F. Magnet hospitals: what's the attraction? Aust Nurs J 2005;12:14-5, 17.
117. Reigle BS, Stevens KR, Belcher JV, et al. Evidence-based practice and the road to Magnet status. J Nurs Adm 2008;38:97-102.
118. Raso R. Talk among staff: unions, magnet status. Nurs Manage 2007;38:72.
119. Buchan J. Still attractive after all these years? Magnet hospitals in a changing health care environment. J Adv Nurs 1999;30:100-108.
120. Stubenrauch JM. Working conditions at magnet hospitals. Am J Nurs 2010;110:16-17.
121. Jayawardhana J, Welton JM, Lindrooth R. Adoption of national quality forum safe practices by Magnet(R) hospitals. J Nurs Adm 2011;41:350-356.
122. Gillispie V. Be a magnet, or just look like one. Colo Nurse 2005;105:12.
123. Cleary PD, McNeil BJ. Patient satisfaction as an indicator of quality care. Inquiry 1988;25:25-36.
124. Speagle A. Building a magnet culture. Colo Nurse 2009;109:3-4.
125. Saver C. Magnet status helps ORs attract and hold on to their nursing staff. OR Manager 2007;23:1, 13-4.
126. The attraction of magnet nursing services. Tex Nurs 2001;75:8-9.
127. Mason DJ. Nursing's best kept secret. Magnet hospitals can save health care. Am J Nurs 2000;100:7.

158
128. Mondino K. The road to excellence: Magnet designation, the Beacon Award, and primary nursing. Crit Care Nurs Clin North Am 2005;17:163-7, x.
129. Romano M. A strong attraction. As hospitals seek 'magnet' status to retain nurses and improve care, some see the program as little more than a pricey marketing gimmick. Mod Healthc 2002;32:28-32, 34.
130. McCue M. Nurse staffing, quality, and financial performance. J Health Care Finance 2003;29:54.
131. Clark ML. The Magnet Recognition Program and evidence-based practice. J Perianesth Nurs 2006;21:186-189.
132. Upenieks VV. The interrelationship of organizational characteristics of magnet hospitals, nursing leadership, and nursing job satisfaction. Health Care Manag (Frederick) 2003;22:83-98.
133. Kramer M, Schmalenberg C. Magnet hospitals: Part I. Institutions of excellence. J Nurs Adm 1988;18:13-24.
134. Buchan J. Magnet hospitals. Attraction of opposites. Health Serv J 2002;112:22-24.
135. Upenieks VV. What's the attraction to Magnet hospitals? Unlimited opportunity, resources, and autonomy draw nurses to these empowering facilities. Nurs Manage 2003;34:43-44.
136. Shetty YK. The quest for quality excellence: lessons from the Malcolm Baldrige Quality Award. S.A.M.advanced management journal 1993;58:34.
137. Hendricks KB. Firm characteristics, total quality management, and financial performance. J Oper Manage 2001;19:269.
138. Guanci G. Destination magnet: charting a course to excellence. J Nurses Staff Dev 2005;21:227-235.
139. Healthcare Market Research Reports: AHA Data Available at: http://www.ahadata.com/ahadata/html/AHASurvey.html. Accessed 11/24/2011.
140. Bureau of Labor Statistics Data Available at: http://data.bls.gov/pdq/SurveyOutputServlet. Accessed 2/14/2014.
141. Resnick AS, Corrigan D, Mullen JL, et al. Surgeon contribution to hospital bottom line: not all are created equal Ann Surg 2005;242:530-7; discussion 537-9.
142. Langabeer J. Predicting financial distress in teaching hospitals J Health Care Finance 2006;33:84-92.

159
143. Pink GH, Howard HA, Holmes GM, et al. Differences in Measurement of Operating Margin. 2008;17.
144. Zelman WN. Financial management of health care organizations : an introduction to fundamental tools, concepts, and applications. San Francisco, CA: Jossey-Bass; 2009.
145. Gapenski LC. Healthcare finance : an introduction to accounting and financial management. Chicago: AUPHA/HAP; 2005.
146. Trussel JM, Patrick PA. Evaluating Financial Distress in Rural Pennsylvania Hospitals. 2010.
147. Kim TH. Factors associated with financial distress of nonprofit hospitals Health Care Manag (Frederick) 2010;29:52-62.
148. Bazzoli G, Andes S. Consequences of hospital financial distress Hosp Health Serv Adm 1995;40:472-495.
149. Harrison JP, Coppola MN, Wakefield M. Efficiency of federal hospitals in the United States. J Med Syst 2004;28:411-422.
150. Rosko MMD. What Have We Learned From the Application of Stochastic Frontier Analysis to U.S. Hospitals? Medical care research and review 2011;68:75S-100S.
151. Rosko MD, PROENCA EJ. Impact of network and system use on hospital X-inefficiency. 2002;2002:C1-C6.
152. Rosko MD. Cost efficiency of US hospitals: a stochastic frontier approach. Health Econ 2001;10:539.
153. Rosko MMD. Stochastic Frontier Analysis of Hospital Inefficiency: A Review of Empirical Issues and an Assessment of Robustness. Medical care research and review 2007;65:131-166.
154. Rosko MD. Impact of internal and external environmental pressures on hospital inefficiency. Health Care Manag Sci 1999;2:63-74.
155. Rosko MD. Performance of US teaching hospitals: a panel analysis of cost inefficiency. Health Care Manag Sci 2004;7:7-16.
156. Weech-Maldonado R. Does quality of care lead to better financial performance?: the case of the nursing home industry. Health Care Manage Rev 2003;28:201.
157. Whiteis DG. Hospital and community characteristics in closures of urban hospitals, 1980-87 Public Health Rep 1992;107:409-416.

160
158. NORC Walsh Center for Rural Health Analysis. Financially Distress Rural Hospitals in Four States - Policy Analysis Brief. 2004;2.
159. McCue MJ, McCall N, Hurley RE, et al. Financial Performance and Participation in Medicaid and Medi-Cal Managed Care. Available at: http://www4.cms.gov/HealthCareFinancingReview/downloads/01Winterpg69.pdf. Accessed 6/16/2011.
160. Census Bureau Home Page Available at: http://www.census.gov/. Accessed 7/22/2011.
161. Rubin DB. Estimating causal effects of treatments in randomized and nonrandomized studies. J Educ Psychol 1974;66:688-701.
162. Rosenbaum PR. Optimal Matching for Observational Studies. Journal of the American Statistical Association 1989;84:pp. 1024-1032.
163. Guo S, Fraser MW. Propensity Score Analysis Statistical Methods and Applications. ; 2010.
164. D’Agostino RB. Tutorial in biostatistics: Propensity score methods for bias reduction in the comparison of a treatment to a non-randomized control group. Stat Med 1998;17:2265-2281.
165. Austin PC. A critical appraisal of propensity-score matching in the medical literature between 1996 and 2003. Stat Med 2008;27:2037-2049.
166. Stata Statistical Software: Release 11. College Station, TX: StataCorp LP.[computer program].
167. Wooldridge J. Introductory econometrics: A modern approach. : Cengage Learning; 2012.
168. Mutter RL, Greene WH, Spector W, et al. Investigating the impact of endogeneity on inefficiency estimates in the application of stochastic frontier analysis to nursing homes. Journal of Productivity Analysis 2013:1-10.
169. Jacobs R. Alternative methods to examine hospital efficiency: data envelopment analysis and stochastic frontier analysis. Health Care Manag Sci 2001;4:103-115.
170. Herr A. Cost and technical efficiency of German hospitals: does ownership matter? Health Econ 2008;17:1057-1071.
171. Assaf A, Matawie K. Estimation and decomposition of cost efficiency in the health care food service sector: an extended stochastic frontier approach. IMA Journal of Management Mathematics 2008;19:75-86.
172. Rosko MD. Impact of HMO penetration and other environmental factors on hospital X-inefficiency. Med Care Res Rev 2001;58:430-454.

161
173. Rosko MD, Mutter RL. Inefficiency differences between critical access hospitals and prospectively paid rural hospitals. J Health Polit Policy Law 2010;35:95-126.
174. Newhouse JP. Frontier estimation: How useful a tool for health economics? J Health Econ 1994;13:317-322.
175. Gannon B. Testing for variation in technical efficiency of hospitals in Ireland. Economic and Social Review 2005;36:273.
176. Rosko MD, Proenca J, Zinn JS, et al. Hospital inefficiency: What is the impact of membership in different types of systems? Inquiry 2007;44:335-349.
177. Lovell CK. Frontier analysis in healthcare. Int J Healthcare Technol Manage 2006;7:5-14.
178. McKay NL, Deily ME, Dorner FH. Ownership and changes in hospital inefficiency, 1986-1991. Inquiry 2002;39:388-399.
179. Coelli TJ, Rao DSP, O'Donnell CJ, et al. An introduction to efficiency and productivity analysis. : Springer; 2005.
180. Battese GE, Coelli TJ. A model for technical inefficiency effects in a stochastic frontier production function for panel data. Empirical economics 1995;20:325-332.
181. Hjalmarsson L, Kumbhakar SC, Heshmati A. DEA, DFA and SFA: a comparison. Journal of Productivity Analysis 1996;7:303-327.
182. Coelli TJ. A guide to FRONTIER version 4.1: A computer program for stochastic frontier production and cost function estimation 1996.
183. Schmidt P, Sickles RC. Production frontiers and panel data. Journal of Business & Economic Statistics 1984;2:367-374.
184. Upenieks VV. Assessing differences in job satisfaction of nurses in magnet and nonmagnet hospitals. J Nurs Adm 2002;32:564-576.
185. Lundmark VA. Magnet Environments for Professional Nursing Practice. In: R. G. Hughes, ed. Patient Safety and Quality: An Evidence-Based Handbook for Nurses. Rockville (MD); 2008.
186. Nedelea IC, Fannin JM. Efficiency Analysis of Rural Hospitals: Parametric and Semi-parametric Approaches. 2012.
187. Plumper T, Troeger VE. The estimation of time-invariant variables in panel analyses with unit fixed effects. Social Science Research Network, Working Paper 2004.

162
188. Greene W. Fixed effects vector decomposition: a magical solution to the problem of time-invariant variables in fixed effects models? Political Analysis 2011;19:135-146.
189. Goldstein SM. Empirical support for the Baldrige Award framework in US hospitals. Health Care Manage Rev 2002;27:62.
190. Horwitz JR. Making profits and providing care: comparing nonprofit, for-profit, and government hospitals. Health Aff (Millwood) 2005;24:790-801.
191. Frick AP, Martin SG, Shwartz M. Case-mix and cost differences between teaching and nonteaching hospitals. Med Care 1985;23:283-295.
192. Bradford DF. The economics of property-casualty insurance. : University of Chicago Press; 2007.
193. Radomski L. What happens when Medicare cuts hospital prices? Assessing the impact on inpatient discharges among the elderly. Find Brief 2013;16:1-3.
194. 4 Ways to Gain Leverage in Payor Contract Negotiations Available at: http://www.beckershospitalreview.com/hospital-management-administration/4-ways-to-gain-leverage-in-payor-contract-negotiations.html. Accessed 2/22/2014.
195. Pappas S. Porter Hospital achieves Magnet designation-nursing reflects on meaning. Colo Nurse 2009;109:9.
196. Doreen F, Robinson C. "Magnet" status as markers of healthy work environments. Interview by Joanne Disch. Creat Nurs 2002;8:4-6.
197. Mayer JD, Kohlenberg ER, Sieferman GE, et al. Patterns of rural hospital closure in the United States Soc Sci Med 1987;24:327-334.
198. Zhivan NNA. U.S. hospital efficiency and adoption of health information technology. Health Care Manag Sci 2012;15:37-47.
199. Pratt WR. What does free cash flow tell us about hospital efficiency? A stochastic frontier analysis of cost inefficiency in California hospitals. J Health Care Finance 2010;37:35-44.
200. Zuckerman S. Measuring hospital efficiency with frontier cost functions. J Health Econ 1994;13:255.
201. Hussey PS, De Vries H, Romley J, et al. A systematic review of health care efficiency measures. Health Serv Res 2009;44:784-805.
202. Medicare Payment Advisory Commission. Report to the Congress: Increasing the value of Medicare. : Medicare Payment Advisory Commission; 2006.

163
203. Jacobs R, Smith PC, Street A. Measuring efficiency in health care: analytic techniques and health policy. : Cambridge University Press; 2006.
204. Cullinane K, Wang T, Song D, et al. The technical efficiency of container ports: comparing data envelopment analysis and stochastic frontier analysis. Transportation Research Part A: Policy and Practice 2006;40:354-374.
205. Oum TH, Yan J, Yu C. Ownership forms matter for airport efficiency: A stochastic frontier investigation of worldwide airports. J Urban Econ 2008;64:422-435.
206. Lang G, Welzel P. Mergers among German cooperative banks: a panel-based stochastic frontier analysis. Small business economics 1999;13:273-286.
207. Skinner J. What do stochastic frontier cost functions tell us about inefficiency? J Health Econ 1994;13:323.
208. Grube ME. The big squeeze in search of a sustainable future for suburban community hospitals Healthc Financ Manage 2006;60:56-65.
209. Zuckerman S, Hadley J, Iezzoni L. Measuring hospital efficiency with frontier cost functions. J Health Econ 1994;13:255-280.
210. Diehr P. Estimating county percentages of people without health insurance. Inquiry 1991;28:413-419.
211. Kodde DA, Palm FС. NOTES AND COMMENTS WALD CRITERIA FOR JOINTLY TESTING EQUALITY AND INEQUALITY. Econometrica 1986;54:1243-1248.
212. Lake ET, Shang J, Klaus S, et al. Patient falls: Association with hospital Magnet status and nursing unit staffing. Res Nurs Health 2010;33:413-425.
213. Morgan SH. The Magnet Model as a framework for excellence. J Nurs Care Qual 2009;24:105-108.
214. Chen YM, Johantgen ME. Magnet Hospital attributes in European hospitals: a multilevel model of job satisfaction. Int J Nurs Stud 2010;47:1001-1012.