Embed Size (px)
Citation preview

The Machinery of ComplexNetwork Theory:
From Network Measures to Network Robustness
Michelle GirvanUniversity of
Maryland

Traditional vs. Complex SystemsApproaches to Networks
Traditional Questions:Social Networks:Who is the mostimportant person inthe network?
Graph Theory:Does there exist a cyclethrough the network thatuses each edge exactlyonce?
Complex Systems Questions:What fraction of edges have to be removed to
disconnect the graph?
What kinds of structures emerge from simplegrowth rules?

The field of complex networksexists at the intersection of…
• Graph Theory• Statistical Physics• Computer Science: Algorithms &
Networks• Nonlinear Dynamics• Social Network Theory• Complex Systems

Areas of Network ResearchStructural Complexity• The wiring diagram could be an intricate tangle, far from
perfectly regular or perfectly random.• The network could include different classes of nodes• The edges could be heterogeneous with different weights,
directions and signs.
Dynamical Complexity• Dynamics on the network: processes could be taking place on
the fixed network.• Dynamics of the network: the network itself could be evolving
in time.

Network Measures
• Average path lengths• Clustering coefficients• Degree distributions
• Degree correlations• Community structure• Hierarchy• And many more…

Clustering
C = Probability that two of a node’s neighbors arethemselves connected
In a random graph: Crand ~ 1/N (if the averagedegree is held constant)

(a) World-Wide Web(b) Coauthorship
networks: computerscience, high energyphysics, condensedmatter physics,astrophysics
(c) Power grid of thewestern United Statesand Canada
(d) Social network of 43Mormons in Utah
Degree distributions for various networks

Friendship network of studentsin a U.S. school. Friendships aredetermined by asking theparticipants, and hence aredirected, since A may say that Bis their friend but not vice versa.Vertices are color codedaccording to race, as marked,and the split from left to right inthe figure is clearly primarilyalong lines of race. The splitfrom top to bottom reflects adivision between middle schooland high school students.
Assortative MixingIn assortatively mixed networks, like verticestend to connect preferentially to one another.

Assortative Mixing by Degree
• A network is said to be assortatively mixed by degreeif high degree vertices tend to connect to other highdegree vertices
• A network is disassortatively mixed by degree if highdegree vertices tend to connect to low degree vertices.
AssortativeScale-free network
DisassortativeScale-freenetwork

Measured assortativity for variousnetworks
M.E.J Newman and M. Girvan, Mixing Patterns andCommunity Structure in Networks (2002).
Network Motifs
R. Milo et al., Science 298, 824 (2002)
MotifsSubgraphs that have asignificantly higher density inthe observed network than inthe randomizations of thesame.
Randomized networks:Ensemble of maximally randomnetworks preserving the degreedistribution (or some otherfeature(s)) of the originalnetwork.

R Milo et al., Science 298, 824-827 (2002).

Community Structure
• Community detection based on centralityindices:– Node betweenness -- The betweenness
centrality of a vertex i is the number ofshortest paths between pairs of othervertices which run through i.
– Edge betweenness -- Similarly, thebetweenness of an edge j is the number ofshortest paths between pairs of nodeswhich run along j.

Algorithm for Detecting Communities
1. Calculate the betweenness for all edges in thenetwork.
2. Remove the edge with the highest betweenness.3. Recalculate betweennesses for all edges affected by
the removal.4. Repeat from step 2 until no edges remain.

Quantifying the Community Structure• Each level of the hierarchical tree represents a division of the network into
a certain number of communities.• Let eij be the fraction of edges that connect a node in community i to a
node in community j. For a system of S communities, e is an S x Smatrix.
• Define ai=Σj eij , i.e. ai is the fraction of edges attached to vertices incommunity i.
• The level of community structure can then be quantified with a modularitycoefficient Q:
Q = Σi eii – Σi ai2
which has the following properties:- Q = 0 when there is no community structure.- Q approaches 1 as S gets large and the network displays perfectmodularity. Q = 1 – 1/S for a perfectly modular network of S equally sizedcommunities.- When the network is divided into a certain number of communities, Q islargest when the communities are equal in size.- The minimum value of Q likes in the range –1 < Q < 0

Zachary’s Karate Club

Hierarchy in Graphs
Clauset, Moore, Newman, submitted

Network Robustness and Resilience:Percolation as a Starting Point
Ordinary Percolation on Lattices: Fill in each link (bondpercolation) or site (site percolation) with probability p andask questions about the sizes of connected components.

Q: What happens as we increase theprobability, p, of filling in each site?
• For low values of p, we see small islands ofconnected components.
• At a critical value of p, a giant component forms. Agiant component is a connected component thatoccupies a finite fraction of the system, in the limitof infinite system size. At the critical point, there isa power law distribution of the size of connectedcomponents.
• Above the critical value, the giant componentoccupies an increasingly large fraction of thesystem. If we look at the mean component sizeexcluding the giant component, we observe acharacteristic component size.
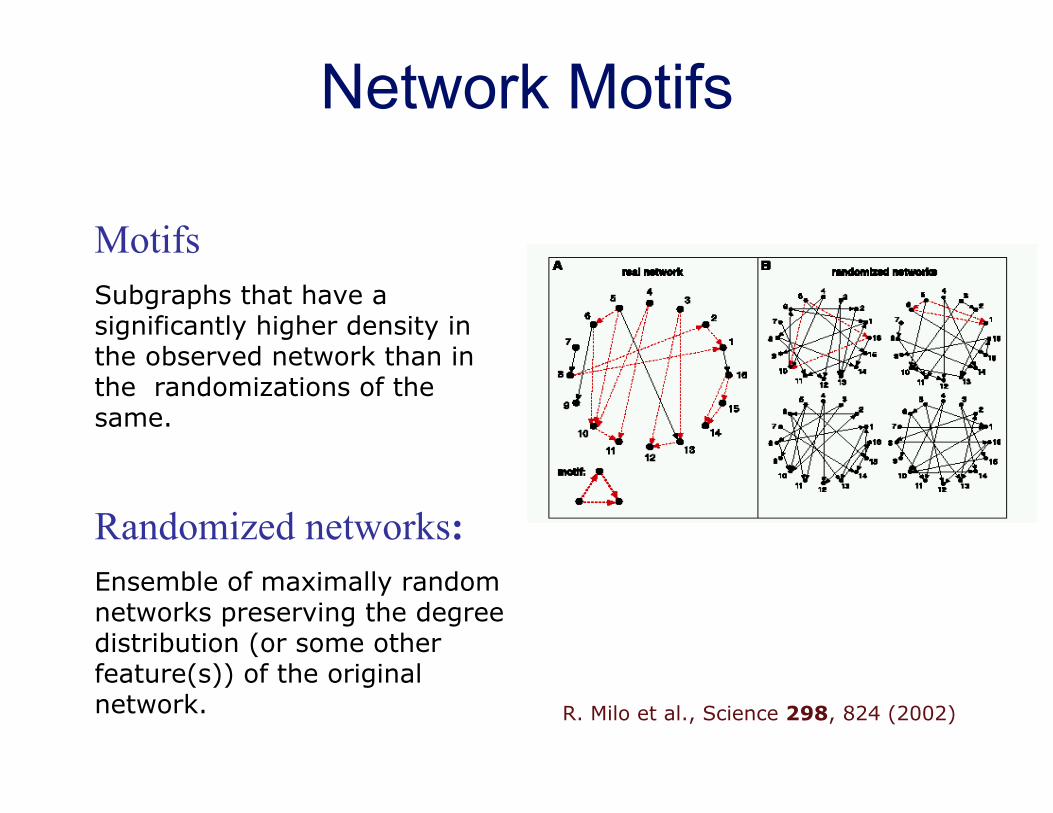
Percolation on Complex Networks
• Percolation can be extended to networks ofarbitrary topology.
• We say the network percolates when a giantcomponent forms.
Site Percolation Bond Percolation

How does percolation relate tonetwork resilience?
• We consider the resilience of the network to theremoval of its vertices (site percolation) or edges(bond percolation).
• As vertices (or edges) are removed from the network,the average path length will increase.
• Ultimately, the giant component will disintegrate.• Networks vary according to their level of resilience to
vertex (or edge) removal.

Percolation in Poisson Random Graphs
We can study the percolationprocess either by varyingoccupation probability, or someother parameter of the networkedsystem. Here, we considerPoisson (Erdos-Renyi) randomgraphs in which our tuningparameter is the average degree ofthe system.
Mean com
ponent size
Mean degree z
Size
of t
he G
iant
Com
pone
nt

Robustness and fragility of scale free networks
Mean vertex–vertex distance on agraph representation of the Internet atthe autonomous system level, asvertices are removed one by one. Ifvertices are removed in random order(squares), distance increases onlyvery slightly, but if they are removedin order of their degrees, starting withthe highest degree vertices(circles),then distance increases sharply. Wesay the network is resilient to randomremoval of vertices, but sensitive totargeted removal.
R. Albert, H. Jeong, and A.-L. Barabasi, Attack and errortolerance of complex networks, Nature, 406 (2000), pp.378–382.

Resilience of skewed networks to randomremovals
Occupation probability ( 1 - probability of node removal)Size
of t
he g
iant
com
pone
nt
Size of the giant component as a function of the occupation probability forthree different degree distributions, decreasing skewness from left to right.
D. S. Callaway, M. E. J. Newman, S. H. Strogatz, and D. J. Watts, Network robustness and fragility: Percolation on random graphs, Phys. Rev. Lett., 85 (2000), pp. 5468–5471.

Calculating the phase transition for networks with arbitrarydegree distributions that are otherwise random
• Let pk be the probability densityfunction for the degrees of nodes inthe network.
• Let qk be the probability densityfunction for the degree of a node atthe end of a randomly chosen edge:qk=k pk/ <k>.
• Let f be the occupation probability foreach edge.
• Assume that we start with onenode and we want to find the sizeof the component connected tothat node.
• Let zn be the number of neighborsreachable in n steps.
• zn+1 = zn x the average excessdegree of nodes reachable in nsteps (the expectation value of (k-1) over the distribution qk) x theoccupation probability, f
zn+1=f zn(<k2>-<k>)/<k>• Critical value of f:
f=<k>/(<k2>-<k>)
f
S

How does assortative mixing impactpercolation?
• In assortatively mixednetworks, the phasetransition occurs sooneras the tuning parameteris increased.
• When the tuningparameter is well pastthe critical point, thesize of the giantcomponent is largest fordisassortative networks.

Some cautionary tales ofcomplex networks…
Barabasi et al. showed that the internet wasfragile to a targeted attack of high degree nodes.This is true, but slightly misleading. Thenetwork they looked at was on the level ofautonomous systems, groups of singly managedcomputers each consisting of thousands ofmachines. The cost of disabling high degreenodes in the network is expected to be muchhigher than the cost of disabling a random node.

Poor sampling approaches can alsogive us misleading results
A Clauset, C Moore, - Arxiv preprint cond-mat/0312674, 2003 - arxiv.org

Outlook for the Field
• We have focused primarily on developingmeasures to characterize these complexnetworks, we need to move away from apurely structural point of view to a moredynamical point of view.
• Current approaches in complex networktheory generally work in the large networklimit. We need to expand our toolbox to handsmaller networks with the same rigor.