Embed Size (px)
Citation preview

1
The loss-bet paradox: Actuaries, accountants, and other numerate people rate numerically
inferior gambles as superior
Ellen Peters (Psychology Department, The Ohio State University),
M.G. Fennema (Accounting Department, Florida State University),
Kevin E. Tiede (Psychology Department, The Ohio State University and University of
Koblenz-Landau)
[in press, Journal of Behavioral Decision Making]
Number of words = 9,767; total incl title page, abstract, bibliography, figure, and tables = 12,743
Acknowledgements: Funding was provided by grants through the National Science Foundation
(SES-1155924 and -1558230) to the first author. We gratefully acknowledge assistance and/or
advice from Martin Tusler, Tyler MacDonald, Hayley Svensson, Paul Slovic, Jairo Ramos, Leaf
van Boven, and three anonymous reviewers.

2
Abstract (240 words out of 250 max)
Psychologists have convincingly demonstrated that preferences are not always stable and,
instead, are often “constructed” based on information available in the judgment or decision
context. In four studies with experts (accountants and actuaries in Studies 1 and 2, respectively)
and a diverse lay population (Studies 3 and 4), the evidence was consistent with the highly
numerate being more likely than the less numerate to construct their preferences by rating a
numerically inferior bet as superior (i.e., the bets effect). Thus, the effect generalizes beyond a
college-student sample, and preference construction differs by numeracy. Contrary to prior
thinking about preference construction, however, high expertise and high ability (rather than
low) consistently related to the paradoxical phenomenon. Results across studies including Study
3’s experimental modifications of the task supported the hypothesized number-comparison
process (and not a lack of expertise with monetary outcomes and probabilities or numeracy-
related differences in attention to numbers) as the effect’s underlying cause. The bets effect was
not attenuated by Study 4’s instructions to think about what would be purchased with bet
winnings. Task results combined with free-response coding supported the notion that highly
numerate participants have a systematic and persistent inclination for doing simple and complex
number operations that drive their judgments (even after controlling for non-numeric
intelligence). Implications for three types of dual-process theories are discussed. The results
were inconsistent with default-interventionist theories, consistent or unclear with respect to fuzzy
trace theory, and consistent with interactive theories.

3
It is often assumed that human beings “have” preferences for objects and attributes and
their choices reflect these preferences. Psychologists, however, have convincingly demonstrated
that preferences are not always stable and, instead, are “constructed” from information available
in the judgment or decision context (Lichtenstein & Slovic, 2006). In a classic example,
participants shown two gambles, one with a higher probability to win and the other with a higher
amount to win, tended to choose the higher probability gamble, but were willing to pay more for
the gamble with the higher winning amount (Lichtenstein & Slovic, 1971). In the present paper,
we examined another gamble task in which decision makers judge the attractiveness of a single
gamble, either with or without a small loss, but otherwise identical. The bet with the small loss is
objectively worse, but judged as more attractive on average (hereafter called the “bets effect”).
However, only some judges (the highly numerate) demonstrate this puzzling effect, which we
propose as evidence for a systematic information-processing inclination that is revealed in the
judgment process. This inclination produces more preference construction among those with
fewer cognitive constraints, contrary to prior thinking about preference construction being more
likely with more constraints.
In this paper, we describe the bets effect and examine the roles of affect and the related
concept of evaluability. We next describe numeracy’s role and prior evidence for an inclination
among the highly numerate to perform more number operations in judgment and choice tasks,
consistent with the hypothesized number-comparison explanation for the bets effect. Then, in
four experimental studies using this extremely simple, primarily numeric, task, we examine
alternative explanations through modifications to the task and recruited samples to add to the
growing literatures on numeracy and preference construction.

4
The bets effect and some alternative explanations
Slovic et al. (2002) first reported results using this task in which one group of participants
rated the attractiveness of a simple gamble (7/36 chances to win $9; otherwise, win $0; this is the
No-Loss condition) on a scale from 0 (not at all an attractive bet) through 20 (extremely
attractive bet); a second group used the same scale to rate a similar gamble with a small loss
(7/36 chances to win $9; 29/36 chances to lose 5¢; the Loss condition). The results were
anomalous from the perspective of economic theory as mean ratings of the superior No-Loss and
inferior Loss gambles were, respectively, 9.4 and 14.9; i.e., the “bets effect”. The effect cannot
be explained by averaging (i.e., a choice option may be evaluated as the average of its
components) because averaging predicts that adding a 5¢ loss to an option with positive payoffs
would make it less attractive (Anderson, 1974; Troutman & Shanteau, 1976). Instead, the effect
appeared due to feelings about the $9 that emerged from judges comparing the $9 with the 5¢
loss in the Loss condition and deriving more positive affect to the $9; no such comparison was
available in the No-Loss condition. Consistent with this hypothesized process is evidence that
integral feelings to the $9 (e.g., participants were asked “How good or bad is $9?” in both
conditions) were quite positive in the Loss condition (as if people used the comparison to
understand how they felt about the $9), but were about neutral in the No-Loss condition.
Bateman et al. (2007) tested a series of additional possible explanations. First, the effect
cannot be explained by a response-mode effect as they demonstrated a similar effect whether
using the usual 0-20 attractiveness rating, freely drawn circles, or a choice between each gamble
and a fixed amount. Second, some colleagues have suggested that the presence of the small loss
makes the bet more exciting. This explanation, however, was not supported as Bateman et al.
5
demonstrated that the effect was substantially the same when a 5¢ gain replaces the 5¢ loss and
that the effect diminished when the 5¢ loss was replaced with a larger (and perhaps more
exciting) 25¢ loss. Finally, under conditions of joint evaluation where people rate both bets side-
by-side, the No-Loss bet was judged as more attractive than the Loss bet, indicating little
excitement for it.
Instead, Bateman et al. (2007) confirmed the finding’s original explanation based on the
concepts of affect and evaluability (Hsee, 1996a, 1996b, 1998), stating that “Hsee’s work on
evaluability is noteworthy because it shows that even very important attributes may not be used
by a judge or decision maker unless they can be translated precisely into an affective frame of
reference” (p. 367). In multiple studies, they replicated the bets effect and the small loss’s impact
on affect to the $9. They also demonstrated that probabilities were easier to evaluate than
monetary outcomes for simple gambles such as that in the No-Loss condition. In particular, they
suggested that probabilities carry a more precise impression and are weighted more in judgments
than monetary payoffs because probabilities are on a bounded scale that allows them to be
evaluated as good vs. bad without other context whereas a payoff such as $9 is relatively abstract
and difficult to evaluate (to feel how good or bad it is) in the absence of a comparison. Finally,
they found that attractiveness was correlated primarily with affect for probability in the No-Loss
condition and primarily with affect for payoff in the 5¢ Loss condition. Thus, the loss seemed to
enhance the affective meaning and importance of the gamble payoff.
Numeracy, number operations, and the bets effect
Peters et al. (2006) further hypothesized that the effect would be due to more numerate
individuals who would be more likely or able than the less numerate to attend to numeric

6
outcomes, compare them, and, therefore, derive greater positive affect to the $9. Peters et al.
confirmed the hypothesized interaction, and the highly numerate’s greater positive affect to the
$9 partially mediated the effect of the 5¢ loss on bet attractiveness. The interaction was further
replicated controlling for non-numeric intelligence (Peters & Bjalkebring, 2015). It is unclear,
however, whether the effect depended on the highly numerate’s habit to attend more to numeric
outcomes (with subsequent processing then being relatively automatic) or on the highly
numerate’s greater inclination to do number operations such as the hypothesized comparison
process. Given population differences in numeracy and numeracy’s effects on important health
and financial outcomes (e.g., Peters et al., 2017), understanding the decision processes of more
and less numerate individuals is important.
Past research is consistent with both possible processing inclinations (number attention
and number operations). First, the more numerate prefer numbers more than the less numerate
(Fagerlin et al., 2007). They seek out more information and spend more time on numeric
decision tasks compared to the less numerate. In one study, this increased time in task partially
mediated numeracy’s effects on superior decisions (Ghazal, Cokely, & Garcia-Retamero, 2014).
When making choices among gambles, the more numerate attended to and sought out more
information, processing numeric information in more depth (Jasper, Bhattacharya, & Corser,
2017). Second, they are more likely to do various number operations. They transform provided
numbers into their alternative frame and are less susceptible to framing effects (e.g., 26%
mortality=74% survival and 10% chance to win=90% chance to lose; Peters et al., 2006; Peters
& Levin, 2008; Cokely & Kelley, 2009). They do more arithmetic in consumer and gambling
tasks (Graffeo, Polonio, & Bonini, 2015; Peters & Bjalkebring, 2015).

7
Less numerate individuals instead rely more on heuristic information processing. They
are more likely than the highly numerate to use information that is easier than numbers to
evaluate, including narratives, concrete descriptions of people, and integral affect from non-
numeric information such as scary outcomes (Betsch, Haase, Renkewitz, & Schmid, 2015;
Pachur, Hertwig, & Steinmann, 2012; Scherer et al., 2017). In addition, the less numerate tend to
be more susceptible than the highly numerate to incidental affect unrelated to the decision object
at hand, using it rather than decision-relevant numeric information (e.g., Peters et al., 2009;
Traczyk & Fulawka, 2016). The highly numerate (more than the less numerate) derive greater
integral affective meaning from numbers and number comparisons and use that integral affect in
their judgments (Peters et al., 2006; Petrova et al., 2014). Thus, everyone may be given the same
information, but process and use it differently depending on their numeracy.
In the present paper, we propose that more and less numerate individuals construct
preferences differently because the highly numerate not only have more math ability than the less
numerate, but they also have a relatively stable greater inclination to use their ability and perform
number operations, including the hypothesized number comparison in the bets task (they have a
“hammer” and use it). It is possible, however, that greater attention to the numeric outcomes
could lead inevitably to the effect. Also unclear is whether the less numerate have the ability
necessary to show the effect or whether high numeric ability per se is required. We test these
ideas using experimental and coded free-response data.
The bets effect and alternative hypotheses
Some other unstudied explanations for the bets effect also exist. For example, the effect
could be due to participants, usually college students, having inadequate experience with money

8
and probabilities so that the bet’s numeric attributes were relatively meaningless. If true, then
their responses may be more labile and prone to preference construction due to this lack of
familiarity and experience (Payne et al., 1999). In the present paper, we examine this possibility
by testing whether extremely numerate individuals with vastly more experience with numbers
and probabilities nonetheless would demonstrate a similar bets effect.
Hypothesis One (H1): Individuals who have extensive experience with and
understanding of monetary values and probabilities (accountants in Study 1 and
actuaries in Study 2) would demonstrate the Loss vs. No-Loss bets effect.
Alternatively and consistent with Jasper et al.’s (2017) results, it may be that the less
numerate simply do not attend as much to the numeric outcomes. Given attention’s critical role
in decision processes (Krajbich, Armel, & Rangel, 2010), simply making either the 5¢ loss or the
$9 more salient then may result in the less numerate processing the bet in the same manner as the
highly numerate. Thus, numeracy differences in inclinations for number operations may not
exist. Instead, the highly numerate may simply have a habit of attending more to numbers; the
number comparison and other processes then may ensue for all individuals once they attend to
the numbers.
Hypothesis Two (H2): Making the 5¢ loss or the $9 win in the Loss bet more
salient would encourage all individuals to attend to and process information in a
manner similar to the highly numerate in the original Loss condition (Study 3).
Changing the order of the loss information also could cause individuals to attend more to
one or both outcomes and use them in a number comparison. We present the same Loss bet, but

9
with the outcome order reversed.
Hypothesis Three (H3): Presenting the possible loss before rather than after the
possible gain would encourage individuals to attend to and process information in
a manner similar to the highly numerate in the original Loss condition (Study 3).
The original hypothesized process for the bets effect, however, has never been tested
explicitly. If the bets effect is due to the hypothesized comparison of the magnitudes of the win
and loss, then we should be able to increase the effect’s size in the Loss condition by making the
number comparison salient.
Hypothesis Four (H4): Asking people how much bigger the $9 is as compared to
the 5¢ loss would increase ratings of the Loss bet (Study 3).
Alternatively, individuals simply may ignore or dismiss the conflicting loss information
because the small loss has little impact on overall value. This explanation is consistent with prior
results with the less numerate; when the less numerate received the loss information, their ratings
appeared no different than if they had not received it (Peters & Bjalkebring, 2015; Peters et al.,
2006). If the small loss has little impact on overall value for the less numerate, then the
manipulations to test H1-H4 should not affect results.
We also attempted to attenuate the bets effect. We reasoned that asking participants to
"imagine what you would do with your $9 winnings” prior to rating the bet would cause the
highly numerate, in particular, to compare the $9 in both conditions to amounts larger than 5¢
(e.g., the cost of lunch), thus reducing the bets effect. If confirmed, the results would be similar
to those found by Bateman et al. (2007) when a 25¢ loss replaced the 5¢ loss and reduced the

10
effect.
Hypothesis Five (H5): Asking people to imagine what they would do with their
$9 winnings would decrease the bets effect among the highly numerate (Study 4).
In the present paper, we conducted four studies to test alternative hypotheses. Studies 1
and 2 were conducted with expert accountants and actuaries, respectively, who have significant
experience and familiarity with dollar values and probabilities, thus testing H1 (that highly
numerate individuals with extensive experience and understanding of monetary values and
probabilities nonetheless would tend to compare monetary amounts and demonstrate the Loss vs.
No-Loss effect). In Study 3, we examined four modifications of the Loss condition, along with
the original No-Loss and Loss conditions in attempts to replicate the original effect with
numeracy and to test H2-H4 (that outcome salience, order of the loss, and instructions to
compare numbers, respectively, would alter responses in the Loss condition). Study 4 employed
a 2 (Loss vs. No-Loss Bet) x 2 (Imagine $9 winnings vs. No instruction) between-subjects design
to test H5 (that instructions to imagine the $9 winnings would attenuate the original bets effect
among the highly numerate); we included non-numeric intelligence measures to offset concerns
that effects could be attributed to general intelligence.
The bets effect has been robust. Power analyses based on prior published results suggests
that detecting the bets effect with 80% power at p<.05 would require n=36-80 per condition
(d=.64-.96) in a population with at least some college if one does not take numeracy into account
and n=24-76 per condition (d=.66-1.17) in a highly numerate population with at least some
college (Bateman et al., 2007; Peters & Bjalkebring, 2015; Peters et al., 2006). To power the
11
interaction with numeracy, about N=137 (d=.34) would be needed (Peters et al., 2006). All
studies in the present paper are adequately powered.
Study 1 – The accountants
As mentioned earlier, prior highly numerate samples (e.g., college undergraduates) who
demonstrated the bets effect may have lacked adequate experience with monetary values and
probabilities to allow them stable valuations, thus causing them to construct the bets effect.
Study 1’s sample instead is comprised of accountants who play critical roles in the preparation
and examination of financial records, including taxes, for individuals and corporations. We also
assessed numeracy so that we could compare the numeracy skills of accountants with prior
populations tested. Thus, we test H1 (that the bets effect would emerge in a highly numerate
sample with extensive experience with monetary outcomes).
Methods
Participants were 58 certified public accountants (CPAs) who volunteered for the study
during a continuing education conference. In a between-subjects design, participants were
randomly assigned to one of two conditions and asked to rate the attractiveness of playing a bet,
using a 21-point scale ranging from 0 (not at all an attractive bet) to 20 (extremely attractive bet).
Half of participants responded to the No-Loss bet ‘‘7/36 chances to win $9 and 29/36 chances to
win nothing’’ while the other half responded to the Loss bet ‘‘7/36 chances to win $9 and 29/36
chances to lose 5¢.” They then responded to 14 numeracy items and demographic questions.

12
Results and Discussion
Demographics. Participants (41% female; mean age=56.9 years, SD=10.2; 98% CPAs)
averaged 32.5 years of full-time accountant experience (median=34, SD=10.3, range=1-51
years). Their major area of practice varied (37% tax, 20% government, 6% audit, 39% industry,
and 8% consulting; percentages total more than 100% due to multiple responses).
Numeracy. Mean numeracy (out of a possible 14 correct) for the accountants was 11.2,
Median=12, SD=2.0, Range=5-14. Compared to a U.S.-representative sample (Galesic & Garcia-
Retamero, 2010), the accountants scored higher (see Table 1). They also scored higher compared
to a convenience sample of individuals with at least some trade school or college (see the right-
hand column of Table 1).
Bets Task. We conducted a regression analysis predicting bet attractiveness from
condition (-.5=No-Loss, +.5=Loss) and numeracy (continuous and mean-centered), model
R2=.20, F(2,53)=6.63, p=.003. Participant accountants rated the objectively worse loss bet as
more attractive than the no-loss bet, mean attractiveness=10.5 and 7.4, respectively, t(54)=1.95,
p=.054, Cohen’s d = 0.55, a medium-sized effect that replicated earlier results with
undergraduate students (Peters et al., 2006) albeit without the numeracy interaction (we did not
have adequate sample size and power to detect the interaction). Consistent with prior results,
more numerate accountants rated both bets as more attractive than the less numerate (respective
means=10.5 and 7.3, t(54)=2.0, p=.054).
Thus, extensive experience with dollar amounts did not diminish the bets effects. Instead,
even among these professionals, the presence of the 5¢ loss appeared to drive a number-

13
comparison process that resulted in a higher valuation for the (objectively worse) bet. Compared
to prior results, accountants were as or more biased in this task as predicted by an inclination to
perform simple number operations associated with greater numeracy.
Study 2 – The actuaries
In Study 2, we attempted to replicate and extend our effects in another professional
population, actuaries whose job is to compile and analyze statistics, in order to calculate financial
consequences of risk in insurance and pension programs. They are an important group of
professionals who use mathematics, statistics, and financial theory to study uncertain future
events; their decisions have important consequences for the stability of health insurance and
pension plans. As a result, they have extensive expertise and experience with monetary valuation
and probabilities, and they are likely to be highly numerate (we did not assess their numeracy).
Studying the bets effect with them allows us to test whether the effect will emerge in a sample
with high numeric ability and superior experience with and understanding of the values of both
dollar outcomes and probabilities (H1).
Methods
Participants were 80 volunteers from the spring meeting of the Society of Actuaries. The
actuaries were randomly assigned to one of the same two conditions of the bets task as in Study 1
and rated the attractiveness of their bet on the same 0-20 scale. Participants then rated their affect
(“How good or bad does the $9 win make you feel?” on a scale from -3=very bad to +3=very
good) and affective precision (“How clear a feeling do you have about the goodness or badness
of the $9 win?” on a scale from 0=not at all clear to 6=very clear); the identical questions were

14
asked with respect to the 7/36 chance of winning. They reported demographic items last.
Results and Discussion
Demographics. Participants (68% male, 28% female, 4% no response; mean age=41.7
years, SD=10.2) averaged 16.6 years of actuarial experience (SD=10.3, range=1-51 years). They
were highly educated (58% held only a bachelor’s degree; 42% had more education); 69%
majored in math or statistics.
Bets Task. As hypothesized (H1), participant actuaries rated the objectively worse Loss
bet as more attractive than the No-Loss bet, mean attractiveness=15.3 and 10.5, respectively,
t(78)=3.57, p=.001, a large effect size (Cohen’s d =0.81) that replicates earlier results with
accountants (Study 1) and non-professional participants. Descriptively, examination of Table 2
reveals that the actuaries rated both Loss and No-Loss bets as more attractive than Peters et al.’s
(2006) highly numerate undergraduates and showed a mean bets effect that was larger than the
undergraduates (about a 5-point difference for the actuaries vs. a 3-point difference among
highly numerate undergraduates). Similar to prior results with highly numerate undergraduates,
the loss’s presence caused the affective meaning of the $9 to change, even among highly
experienced actuaries; the $9 win felt better in the presence vs. absence of the loss, mean
affect=1.68 and 0.53, respectively, t(77)=3.98, p<.001.1
1 They also had more clear feelings about the $9 in the presence vs. absence of the 5¢ loss (mean
clarity=4.59 and 3.62, respectively, t(78)=2.4, p=.018). Unlike the undergraduates, the actuaries
did not have significantly more positive feelings to the 7/36 chances of winning (mean affect to
7/36=0.66 and 0.11, respectively, with and without the loss, t(77)=1.5, p=.138). Similar to the

15
Some actuary participants also handwrote notes on the side of the page (the study was
done in pencil-and-paper form). Their responses were coded as indicating whether they had
considered the numbers (by writing one or more numbers down) and/or had asked about the bet’s
cost. Although these free responses rarely included an explicit mention of comparing the $9 and
5¢ loss, more Loss than No-Loss participants indicated some kind of number consideration (27%
and 10%, respectively, χ2 (df=1)=3.80, p=.051; their responses often suggested an expected-
value calculation although it was rarely completed in full). No-Loss participants were more
likely to question instead how much the bet might cost to play (0% and 10%, respectively, in the
Loss and No-Loss conditions, p=.038; see also Chesney & Peters, 2015). Both results point
towards these highly numerate individuals either using a readily available numeric comparison
(the 5¢ loss) or searching for a comparison (asking about cost when a comparison was otherwise
not available in the No-Loss condition).
Results of Studies 1 and 2 supported the existence of the bets effect outside of a college-
student population. We not only replicated the findings with non-student adult participants, but
with two particularly expert and numerate samples that allowed us to test whether earlier results
might have depended on those participants’ lack of experience with monetary values and
probabilities. The results with actuaries and accountants clearly indicated otherwise. Their
substantially greater expertise with monetary outcomes and probabilities (as compared to prior
samples), however, did not protect them from demonstrating the bets effect. We conclude that
undergraduates, their feelings towards the winning chances were more clear in the loss’s
presence vs. absence (mean clarity=4.5 and 3.6, respectively, t(78)=2.0, p=.044).

16
both actuaries and accountants have a stable inclination, based on their high numeric abilities, to
do number operations such as the hypothesized comparison process of the present bets effect.
Nonetheless, some questions remain. The actuaries’ free responses did not point directly to the
hypothesized number-comparison process (although their more positive affect to the $9 in the
presence vs. absence of the loss was consistent with it). Also unclear was whether less numerate
populations cannot show the bets effect due to their lower ability, or whether they can be
encouraged to attend to and/or compare the monetary outcomes and thereby show the bets effect.
Study 3 – Testing modifications of the Loss condition to examine process
In Study 3, we tested four possible mechanisms for attractiveness ratings in the Loss
condition. In six between-participants conditions, we included the original Loss and No-Loss
conditions as well as four modified Loss conditions in which we manipulated the salience of
outcomes (by presenting either the $9 win or the 5¢ loss in a larger font), the order of the loss,
and the presence of a prime for the hypothesized number-comparison process. We also asked
participants to indicate why they rated the bet as they did and analyzed their coded responses.
Methods
We aimed to have 100 participants per condition for a total of 600 participants on
Amazon Mechanical Turk (MTurk). We collected data from 626, and 605 participants completed
the present paper’s bets task and objective numeracy scale. Participants also completed unrelated
tasks. The bets task was completed after consent, followed by a consumer choice task, subjective
numeracy scale (Fagerlin et al., 2007), 11 items concerning confidence in math ability and
driving skills, a symbolic-number-mapping task (Siegler & Opfer, 2003), 7 objective numeracy

17
items modified from prior studies, and demographics. Participants were paid $1.50 and took 17
minutes, on average, to complete all tasks.
The bet conditions. Participants were randomly assigned to one of six bet conditions and
asked to rate their bet attractiveness on Study 1’s 0-20 scale. The conditions included: (1) and (2)
the original No-Loss and Loss conditions used in Studies 1 and 2; (3) Big-5 Loss, a Loss
condition in which “lose 5¢” was presented in 20-point Qualtrics font; the rest of the text
remained in the smaller default Qualtrics font (about 12-point font); (4) Big-9 Win, a Loss
condition in which “win $9” was presented in 20-point Qualtrics font; remaining text was in the
smaller default Qualtrics font; (5) Reverse, a Loss condition in which the order of the win and
loss were reversed (“29/36 to lose 5¢” and then “7/36 to win $9.00”); and, finally, (6) Number-
comparison Instruction, a Loss condition in which participants were told “Before you rate this
bet, please consider the following question: How much bigger is the $9 win than the 5¢ loss?”.
After indicating their attractiveness rating, participants were asked “What did you think
about while you were deciding how attractive the bet would be to play? Please write down your
thoughts in the box below.” Free responses were coded by two independent coders to indicate
mentions of having identified a bet element (the amount to win, the amount to lose, the
probability of winning, the probability of losing, or the pie chart); evaluated a bet element;
performed a comparison (of the two probabilities, of the amounts to win and lose, or asking
about the bet’s cost); or performed a calculation (expected value or other). See Table 3. The two
coders agreed on 94.7% of responses and resolved all differences together.
Results and Discussion
Data cleaning. We removed participants who had duplicate IP addresses and surveys

18
started within one minute of each other (n=27), went too quickly to have reasonably responded
(n=6), or went so slowly that the study likely was completed in multiple sessions (n=6), leaving
us with a final sample n=566.
Demographics and numeracy. Participants were 49% female (mean age=39.4 years,
SD=12.3, range=18-77); 84% were white and 45% had at least a 2-year college degree. Mean
numeracy (out of a possible 7 correct) was 3.4, median=4, SD=1.7, range=0-7.
Original bets effect. We conducted a multiple regression analysis to test the effects of
condition, objective numeracy, and their interaction on bet attractiveness ratings (SPSS Process
Macro, Model 1 was used for all Study 3 linear regressions; Hayes, 2013). The model included
bet condition (0=Loss, 1=No-Loss), objective numeracy (numeracy was used in its continuous,
mean-centered form in all analyses throughout the paper unless otherwise indicated), and their
interaction as the independent variables, and attractiveness ratings as the dependent variable.
Results indicated a significant interaction, t(165)=-2.03, p=.044, such that the highly numerate
rated the Loss bet as significantly more attractive than the No-Loss bet as compared to the less
numerate (see Figure 1 for predicted means at each level of numeracy; model F(3, 165)=14.94,
p<.001, R2=.21). Thus, we replicated the original bets effect interaction with numeracy; the less
numerate demonstrated a greater bets effect than usual.
Coding of free responses was consistent with this interaction (see Table 3). First, because
the comparison of the $9 and 5¢ was not possible in the No-Loss condition, we examined a
possible numeracy difference in the Loss condition only. Consistent with the bets effect and a
tendency for number comparisons, 26.4% of the highly numerate mentioned comparing the $9 to
the 5¢ loss compared to only 12.5% of the less numerate (Wald χ2 (df=1)=5.26, p=.022). For the

19
remaining coded responses, logistic regressions were conducted for each coded response with
condition (0=Loss, 1=No-Loss), numeracy, and their interaction as predictors. We describe here
only those codes that resulted in a significant interaction as they would be the most likely
explanations of the bets effect (for additional results, see Note 1 of Table 3). Only two significant
interactions, both concerning probabilities, emerged between numeracy and bet condition.
Among the less numerate, a smaller proportion identified the probability of winning in the Loss
vs. No-Loss condition (55.0% and 78.0%, respectively, vs. the highly numerate 69.8% and
71.4%, respectively; interaction b=-.45, Wald χ2(df=1)=4.64, p=.031). A similar pattern of
results emerged for mention of the pie chart (data not shown) although fewer than 10%
mentioned it (interaction b=-1.45, Wald χ2(df=1)=4.22, p=.040). Thus, whereas the highly
numerate demonstrated more evidence of comparing the $9 to the 5¢ loss, the less numerate may
have found the probability of winning less salient in the Loss condition as if the addition of the
5¢ loss distracted them from the possibility of winning. This possibility is not entirely consistent
with the attractiveness results, however, because the less numerate did rate the Loss bet as
somewhat higher than the No-Loss bet (although less so than the highly numerate).
The coded responses also provided some support for Bateman et al.’s (2007) ideas that
the monetary outcome is easier to process in the presence vs. absence of the 5¢ loss and
probabilities can be simpler to process than monetary outcomes. Specifically, the frequency of
mentions of the win amount was higher in the Original Loss compared to No-Loss condition
(68.8% and 36.8%, respectively, χ2(df=1)=17.2, p<.001). In addition, participants in the Original
No-Loss condition mentioned the probability of the win more frequently than the amount to win
(75.0% and 36.8%, respectively, McNemar’s χ2(df=1)=18.23, p<.001). Although probability
20
calculations are known to be difficult, evaluating probabilities in simple gambles appears easier,
likely due to the bounded nature of the probability scale.
Test the salience hypothesis, H2 (that making the 5¢ loss or the $9 win more salient
would encourage greater Loss-bet attractiveness). We conducted two separate multiple
regression analyses comparing the Original-Loss condition to each of the two salience
conditions. In both cases, we regressed attractiveness ratings onto bet condition (0=Original
Loss, 1=Big-5 Loss or Big-9 Loss), numeracy, and their interaction. In the first regression that
included the Big-5 Loss condition, a nonsignificant interaction emerged, p=.636. We dropped the
interaction term and conducted the analysis again (model F(2, 196)=11.26, p<.001, R2=.10).
More numerate individuals rated both bets as more attractive than the less numerate (b=1.15,
t(196)=4.73, p<.001); bet condition was not a significant predictor (p=.861). Consistent with
making the loss more salient (even though its salience did not affect the bet’s attractiveness),
mentions of the amount to lose increased from 61.3% to 71.7% in the Original-Loss vs. Big-5
Loss conditions (Wald χ2(df=1)= 3.96, p=.046). No other condition differences existed in the
coded responses.
In the second regression that included the Big-9 Loss condition, a nonsignificant
interaction emerged, p=.120. After dropping the nonsignificant interaction term and conducting
the analysis again (model F(2, 180)=7.28, p=.001, R2=.08), more numerate individuals rated both
bets as more attractive than the less numerate (b=0.90, t(180)=3.72, p<.001); bet condition was
not a significant predictor (p=.344). Inconsistent with making the win more salient, mentions of
the amount to win were similar in the two conditions (68.8% and 68.9%, respectively, in the
Original-Loss vs. Big-9 Loss conditions). No condition differences existed in the coded

21
responses. Thus, we concluded that the salience of the 5¢ loss and the $9 win made little to no
difference (other than participants mentioned the 5¢ loss more often when it was made salient).
Test the order hypothesis, H3 (that presenting the $9 win after the 5¢ loss might
encourage greater Loss-bet attractiveness). We conducted a multiple regression analysis of bet
attractiveness with bet condition (0=Original Loss, 1=Reversed Loss), objective numeracy, and
their interaction as independent variables. Results indicated a nonsignificant interaction, p=.225.
After dropping the interaction term and conducting the analysis again (model F(2, 195)=7.29,
p=.001, R2=.07), more numerate individuals rated both bets as more attractive than the less
numerate (b=0.97, t(195)=3.75, p<.001); bet condition was not a significant predictor (p=.695).
No condition differences existed in coded responses. Thus, we concluded that the order of the
gain and loss did not alter Loss bet ratings.
Test the number-comparison hypothesis H4 (that instructing people to assess how
big the $9 was compared to the 5¢ loss would increase ratings of the Loss bet). We
conducted a multiple regression analysis to test the effects of condition (0=Loss, 1=Number-
Comparison Instruction Loss), numeracy, and their interaction on bet attractiveness ratings.
Results indicated a nonsignificant interaction, p=.493. We dropped the interaction term and
conducted the analysis again (model F(2, 186)=12.60, p<.001, R2=.12). As in prior analyses,
more numerate individuals rated both bets as more attractive than the less numerate (means =
13.9 and 10.9, respectively, b=1.10, t(186)=4.55, p<.001). In addition, however, the Number-
Comparison-Instruction condition increased attractiveness ratings relative to the Original-Loss
condition (b=1.87, t(186)=2.25, p=.026; mean attractiveness ratings were 13.4 and 11.7,

22
respectively2). In this case, we examined the one coded response that differed marginally by
condition; specific mention of the 5¢ loss (not included in Table 3) increased marginally in the
Instructions condition compared to the Original-Loss condition (47.9% and 35.5%, respectively,
b=.526, Wald χ2(df=1)=3.09, p=.079) and did not interact with numeracy. These findings could
suggest that focusing greater attention on the loss increased the effect; however, we know from
the Big-5 Loss condition that increasing the salience of the 5¢ did not alter perceived
attractiveness. Instead, the data were most consistent with the Instruction condition causing
participants to attend more to the loss and compare it to the $9. Unfortunately, the data did not
support greater mentions of the comparison of the $9 to the 5¢ loss (9.7% vs. 16.7% reported the
comparison, respectively, in the Original-Loss vs. Instructions conditions, p=.505). This lack
may have been due to it being too obvious to mention because it was part of the instructional set.
No other condition differences existed in the coded responses.
Thus, the experimental data support the hypothesized number-comparison process as the
underlying mechanism for the original Bets effect; requesting the number comparison increased
bet attractiveness among more and less numerate participants. Other possible explanations (e.g.,
outcome salience) were not supported.
Numeracy differences in coded responses. We also examined numeracy differences in
coded responses across conditions. Using logistic regression for each coded response and linear
2 Attractiveness means among the highly numerate were 14.6 and 12.0 in the Number-
Comparison-Instruction and Original-Loss conditions, respectively, whereas among the less
numerate, they were 12.0 and 9.7.

23
regression for Table 3’s average number of identifications, evaluations, comparisons, and
calculations, we examined the overall effect of numeracy after controlling for the effect of
condition (we did not include their interaction). As expected and in Table 3’s Identification
section, a large proportion of participants mentioned a probability (either win, loss, and/or pie
chart), and no numeracy differences existed (see the last two columns of Table 3). Mentions of
the amounts to win and lose were also frequent, and the highly numerate were more likely than
the less numerate to mention them (Wald χ2(df=1) equaled, respectively, for win and loss
amounts, 15.28, p<.001 and 27.22, p<.001). Similar to Identification results, numeracy was not a
significant predictor of Table 3’s probability evaluations. More vs. less numerate individuals,
however, were more likely to mention evaluations of both the win and the loss outcomes (Wald
χ2(df=1) equaled, respectively, 4.26, p=.039 and 20.41, p<.001). These results provided further
evidence consistent with Bateman et al. (2007) in that identification and evaluation appear easier
for probabilities than outcomes in this task given that numeracy differences only appeared for the
latter outcomes.
For Table 3’s Comparisons, no numeracy difference appeared in the comparison of
probabilities, but the proportion performing this operation was also low (<10%). The proportion
of participants comparing monetary amounts also was low but depended on numeracy.
Specifically, the highly numerate were about twice as likely to mention comparing the $9 with
the 5¢ loss (Wald χ2(df=1)=12.10, p=.001). Similar to the actuaries who we speculated were
searching for another point of comparison, the highly numerate also were more likely to question
the bet’s cost than the less numerate, Wald χ2(df=1)=23.87, p<.001. For Calculations, the
proportion of participants mentioning a calculation was low, but, as expected, the highly

24
numerate were significantly more likely to mention either an expected-value or other calculation
(Wald χ2(df=1) equaled, respectively, 11.66, p=.001 and 25.58, p<.001).
Thus, highly numerate judges identified and evaluated monetary outcomes more than the
less numerate and also did more number operations (both simpler outcome comparisons and
more complex calculations) in the task (see Table 3). Less clear is what might have been most
important to judging bet attractiveness. As an exploratory analysis and recognizing that free
responses are an imperfect reflection of processing, we conducted a regression analysis of
attractiveness using numeracy and the average numbers of identifications, evaluations,
comparisons, and calculations (see Table 3) as predictors. Consistent with number operations
being key to ratings in this task, more numerate judges and judges coded as performing more
comparisons and calculations judged the bet as more attractive (respectively, numeracy b=.58,
t(560)=3.68, p<.001; comparisons b=1.39, t(560)=2.58, p=.010; and calculations b=1.64,
t(560)=2.45, p=.015) than those who were less numerate or were coded as performing fewer
comparisons and calculations.
Overall, these results are consistent with the performance of number operations affecting
preference construction, and the highly numerate having a stable inclination to do those number
operations more often; thus, preference construction differs by numeracy. Simply attending more
to the outcomes was insufficient to produce the subsequent processing necessary for the bets
effect to emerge. The Instruction-condition results supported the number-comparison process
being a numeracy-based inclination rather than a requirement of their ability (the manipulation
increased average attractiveness ratings among highly numerate individuals, suggesting that not
all highly numerate individuals had done the comparison in the Original-Loss condition) and the

25
process not being out of the reach of less numerate individuals (whose average ratings also
increased with instruction).
Study 4 – Testing instructions to imagine $9 and intelligence
In Study 4, we examined whether priming participants to make a different numeric
comparison (to what they would do with their winnings) would attenuate the bets effect; we
expected the highly numerate to compare the $9 to prices greater than 5¢. In addition, prior
literature has indicated that the bet condition by numeracy effect was not due to general
intelligence (e.g., Peters et al., 2006 and Peters & Bjalkebring, 2015 controlled, respectively for
SAT scores and measures of vocabulary and working memory). In Study 4, we included
measures of vocabulary, non-verbal reasoning, and need for cognition in an attempt to replicate
and extend these prior findings.
Methods
We aimed to have 100 MTurk participants per condition for a total of 400 participants
and ended up with 474 participants (data were collected simultaneously for two pilot conditions
not relevant to the present study). Participants also completed unrelated tasks. The bets task was
completed after consent, followed by a response time task, and the 18-item need for cognition
measure (Cacioppo, Petty, & Kao, 1984). Participants were paid $0.75 and took about 8 minutes,
on average, to complete all tasks. Data from a 7-item objective numeracy test (modified from
Cokely, Galesic, et al., 2012 and Lipkus et al., 2001), 36-item vocabulary test (Ekstrom, French,
Harman, & Derman, 1976), and 10-item reasoning test (modified from Raven’s Progressive
matrices, Dørum, 2008; Raven, 2000) had been collected in a session seven weeks earlier.

26
The bet conditions. Participants were randomly assigned to one of four bet conditions
and were asked to rate their bet attractiveness on Study 1’s 0-20 scale. The conditions included:
(1) and (2) the original No-Loss and Loss conditions used in prior studies; (3) and (4) the same
two original conditions preceded with instructions “Before you rate this bet, please imagine what
you would do with your $9 winnings.”
Results and Discussion
Data cleaning. We removed participants with IP addresses outside the US (n=1), who
failed two or more of three attention checks (n=3), whose overall completion time was more than
ten times longer than the next participant (n=1), and whose completion times in their Instruction
condition were three standard deviations or more above the mean (n=11); final n=458.
Demographics, numeracy, non-numeric intelligence, and need for cognition.
Participants were 50.7% female, with an average age=39.5 years, SD=11.4, range=20-75; 84.5%
were white and 69.2% had at least a 2-year college degree. Mean numeracy (out of a possible
seven correct) was 2.9, median=3, SD=2.0, range=0-7. Mean vocabulary (out of a possible 36
correct) was 24.7, median=26.0, SD=5.4, range=10-35. Due to a programming error, we lost 111
participants’ data for Raven’s Matrices, leaving us with n=347 for those analyses. Mean Raven’s
matrices (out of a possible 10 correct) was 5.6, median=6.0, SD=1.9, range=0-10. Finally, the
average need for cognition (NFC) score was 3.5, median=3.7, SD=1.0, range=1-5. Correlations
with numeracy were r=.406 (vocabulary), r=.437 (Raven’s), and r=.173 (NFC), p’s<.01.
Does Instruction condition modify the Bets effect by numeracy interaction? We
conducted a multiple regression analysis of bet attractiveness ratings and tested the effects of
instruction condition (0=present, 1=absent), bet condition (0=Loss, 1=No-Loss), objective

27
numeracy (coded with the highest numeracy score as zero and lower values being increasingly
negative), and their interactions. Results indicated that the hypothesized three-way interaction
was not significant (p=0.909). We dropped the three-way interaction term and then the
nonsignificant two-way interaction between instruction and loss conditions, rerunning the
analysis each time (final model F(5, 452)=13.69, p<.001, R2=.132). The Loss bet was rated as
more attractive than the No-Loss bet (b=-6.16, t(1,452)=-5.25, p<.001; respective means=10.4
and 6.6). The simple effects of Instruction and numeracy were not significant.
These simple effects were modified by two significant two-way interactions. First, the
results indicated that we replicated the original bets effect interaction with numeracy.
Specifically, the highly numerate rated the Loss bet as significantly more attractive than the No-
Loss bet as compared to the less numerate (see Figure 1 for predicted means at each numeracy
level, interaction t(452)=-2.24, p=.025). In addition, Instruction condition interacted with
numeracy, t(452)=2.01, p=.045, such that the presence vs. absence of instructions marginally
increased ratings among the less numerate (means=8.5 and 7.1, respectively, t(216)=1.83,
p=.069) whereas it had no effect on rated attractiveness of the bets among the highly numerate
(means = 8.9 and 9.3, respectively, t(238)=-.49, p=.625).
We also examined numeracy’s effects after controlling for vocabulary, NFC, and Raven’s
in a second analysis. Specifically, we regressed numeracy onto these three variables (to remove
their shared variance) and then used the numeracy residuals in our final model above with bet
condition, instruction condition, numeracy residual, and the numeracy residual’s interaction with
the two condition variables (final model F(5, 341)=12.76, p<.001, R2=.158). Bet condition (b=-
7.41, t(340)=-4.25, p<.01), numeracy residual (b=.214, t(340)=2.58, p=.01), and the bet
condition by numeracy residual interaction (b=-.68, t(340)=-1.98, p=.052) remained significant.

28
The instruction condition by numeracy interaction fell to nonsignificant (p=.46). We also
conducted three separate regressions of bet attractiveness that used numeracy residuals from each
individual measure. These regressions produced similar results (all numeracy residual by bet
condition interactions, p<.05). Thus, the effect appears specific to numeracy although, of course,
the possibility of measurement error and missing third variables limit our ability to make firm
conclusions.
These results were inconsistent, however, with our initial hypothesis H5 because the
presence of Instructions to think about what the participant would do with their $9 winnings did
not modify the numeracy by bet effect interaction. Instead, a second significant interaction with
numeracy emerged, with less numerate individuals perceiving both Loss and No-Loss bets as
more attractive in the presence of Instructions vs. the highly numerate who were not affected by
Instructions. We speculate that the less numerate may have used their integral feelings about the
concrete object they would buy as information to increase perceived attractiveness (recall that, in
past studies, their feelings about the $9 tended to be neutral, e.g., Peters et al., 2006, and they
tend to be affected less by numeric information and more by concrete descriptions, e.g., Peters,
2012); the highly numerate were less influenced by the instructions as if they had already
considered possible concrete outcomes, or because their feelings about the $9 were deemed more
relevant to their ratings. This interaction effect, however, was nonsignificant after controlling for
our three non-numeracy measures.
General Discussion
The paradox of the bets effect is that the addition of a small loss to one of two otherwise

29
identical bets causes an objectively worse bet to be rated as subjectively more attractive, a clear
case of preference construction and the importance of minor variations in context. That the effect
resides more in highly numerate samples makes it more interesting because preference instability
and construction are thought to occur more among individuals with greater cognitive constraints.
In addition, preference construction generally happens more among individuals who lack
experience or familiarity with attributes or options (Lichtenstein & Slovic, 2006; Payne,
Bettman, & Schkade, 1999). Instead, not only did the effect occur more in populations with
fewer cognitive constraints (the highly numerate, Studies 1-4) but it occurred as much or more
among highly numerate accountants and actuaries (Studies 1-2) who averaged many years of
experience in their respective fields (32.5 and 16.6 years, respectively) and therefore with the
monetary outcomes and probabilities critical to the judgment. The accountants, and especially
the actuaries, have extensive experience with similar “bets” in the real world. Despite that
experience, the small-loss context changed how the actuaries felt about the identical $9 and how
they valued the bet.
In Study 3, we tested plausible alternative mechanisms for the numeracy difference in the
bets effect in a non-expert population. First, we replicated the original effect and found that the
highly numerate were more likely than the less numerate to mention comparing the $9 and 5¢
loss, consistent with the hypothesized number-comparison process. Because such data are
correlational, we also experimentally tested other mechanisms. In particular, we tested and found
no support for the effect being due to the highly numerate attending more to the numeric
outcomes as might have been expected based on prior research (e.g., Jasper et al., 2017); neither
varying the visual salience of either monetary outcome or changing the order in which they were

30
presented influenced Loss-condition results. Instead, H4 (that asking people to compare the
magnitudes of the monetary outcomes would increase ratings of the Loss bet) was supported;
ratings of both the more and less numerate increased relative to the Original-Loss condition. It
was not that the less numerate dismissed the small loss as having little impact on the bet’s value;
instead, the data were most consistent with them not knowing the value of an abstract $9 and not
thinking to compare it to the loss until instructed.
Thus, prior speculation was supported concerning a number-comparison process being
critical to this task’s preference construction. The present studies’ results also point towards
numeracy-based preference construction that goes beyond this comparison. First, the highly
numerate did not seem to always compare the payoffs (or weight the comparison as much) in the
Loss condition given that the comparison Instructions affected them as much as the less
numerate. Second, Study 3’s coded responses indicated more reports of identifications,
evaluations, and comparisons of outcomes (but not probabilities) among the more than less
numerate. The highly numerate also indicated more calculations. However, only more vs. fewer
number operations (comparisons and calculations) were associated with greater bet attractiveness
whereas identifying and evaluating more pieces of information were not. These results point
towards the existence and importance of a more general number-operation inclination among the
highly numerate that is critical to the bet’s attractiveness and is consistent with prior research
(Cokely & Kelley, 2009; Peters & Bjalkebring, 2015). Study 4 results demonstrated that the
highly numerate’s number-comparison inclination was persistent in the face of instructions to
consider an alternative comparison (i.e., instructions to consider what they would do with the
$9). Thus, the bets effect generalized beyond a college-student population (generalizability is

31
often questioned in psychological studies; Peterson, 2001) and appears to be caused by a
persistent inclination to compare numbers associated with greater numeric abilities (Studies 1-4)
and instruction (Study 3).
Responses in this artificial, carefully constructed, task highlight information-processing
differences between more and less numerate individuals. The results are interesting, in part,
because, compared to the less numerate, the highly numerate generally make better decisions
with numbers and experience better health and financial outcomes (Peters et al., 2017). In this
task, however, the highly numerate make worse judgments. Although highly numerate
individuals could calculate the bets’ expected values ($1.75; $1.71) and rate the No-Loss bet as
superior, the expected values likely lacked evaluability (participants saw only one bet), similar to
the difficult-to-evaluate $9 in the No-Loss condition. Instead, the evidence is consistent with the
highly numerate comparing outcomes, which leads to the inferior judgment (although it could be
argued that the small loss allowed the highly numerate to recognize the goodness of this positive
expected-value bet).
Implications of a number-comparison inclination beyond the bets task
Although deliberating more with numbers is generally thought to help the highly
numerate make better choices and experience better outcomes, the highly numerate also may
“overuse” number operations and show results that appear less rational. Besides the present bets
effect, in Kleber et al.’s (2013) Study 2, participants read about five children at risk of starvation
and asked how much they would be willing to donate to help them. In three between-subjects
conditions, the researchers manipulated the reference-group size (no reference group, out of 10
children, out of 1000 children). More numerate individuals (but not the less numerate) were

32
willing to donate more in response to the smaller reference group (and greater proportional help)
as if they had calculated donation effectiveness (i.e., I could help 50% [or 0.5%] of the children
at risk) despite the fact that their donation would always help exactly five children.
It may be that the highly numerate also will be more likely than the less numerate to
show other effects such as Hsee et al.’s (2003) medium maximization. In these studies,
participants choosing between two tasks that required more or less effort (but rewarded the same)
chose the more effortful task when relatively uninformative numbers (points that could be won)
were used as if they were informative. We suspect that the highly numerate will “use their
hammer” and chose more effort whereas the less numerate will ignore the numbers and perform
better in the task. The highly numerate may be more likely to show a variety of decision effects
that involve numeric comparisons including well-known evaluability effects (Hsee, 1996a,b), the
asymmetric dominance effect observed in choice experiments (Huber, Payne, & Puto, 1982),
Prospect Theory’s reference dependency (Kahneman & Tversky, 1979), and the house-money
effect (Thaler & Johnson, 1990).
Implications of lower numeracy
We know more about the preference-construction processes of the highly numerate in the
highly numeric bets task than we do about those of the less numerate. As suggested by Reyna et
al. (2009), however, “the most informative research would test specific hypotheses about how
people who are low vs. high in numeracy process information differently” (p. 967). The less
numerate were not affected by the small loss and were never more likely than the highly
numerate in Study 3 to give any coded response. They may have found the bet more attractive
with Study 4’s instruction to consider what they would do with their winnings; however,

33
although the interaction of instruction with numeracy was significant, the effect on the less
numerate (based on a median split) was marginal and the interaction effect was nonsignificant
after controlling for shared variance between numeracy and vocabulary, non-numeric reasoning,
and need for cognition. Past literature points towards the less numerate relying more on simpler
and often non-numeric information in judgments (e.g., incidental emotions) whereas the more
numerate use concurrently presented numbers instead (Traczyk & Fulawka, 2016). In the present
task, the less numerate may have formed their attractiveness ratings by thinking about what they
might purchase with their winnings, current mood states, or reliance on single attributes such as
the possibility of winning or a priori preferences for gambling in general.
More generally, in the present task, the less numerate were less likely to do numeric
comparisons, but this difference is not always found. For example, Fagerlin, Zikmund-Fisher,
and Ubel (2005) found that women who estimated (vs. did not estimate) their own chances of
breast cancer frequently and substantially overestimated their risk. When then shown the
comparison to their personal numeric risk, they felt relieved and less at risk for breast cancer.
More and less objectively numerate women responded similarly as if all individuals had
compared the two numbers. Such lack of a numeracy effect could be due to these probabilities
being easier to evaluate (similar to the ease of processing probabilities in the bets task). We think
it more likely that health motivation played a role, and that all women were powerfully
motivated to understand their personal risk. Findings such as these may help researchers to
identify boundary conditions so that we can better understand the conditions under which more
and less numerate individuals compare vs. do not compare numbers. In the present bets task, the
highly numerate were more likely to; the less numerate, however, could when instructed in Study
34
3. Identifying boundary conditions for information processing is important, both theoretically
and practically. It seems likely that differentiation by numeracy will occur more often when
motivation is low, comparisons are not salient, and attentional resources are limited (Gilbert et
al., 1988). Additional research in the present bets task and other tasks should examine these
issues further.
Implications for dual-process theories
Numeracy research has sometimes been described within a dual-process theory
framework (Peters, 2012; Reyna et al., 2009). Not all dual-process models are identical,
however, and they make some different predictions, particularly with respect to two questions
important to the present bets effect. First, the theories differ in terms of which process is thought
to produce superior decisions. Popular default-interventionist theories (also called serial-
interventionist models) assume that the intuitive System 1 process provides generally reasonable
default responses that guide behavior; the deliberative System 2 then may detect an error and
override the intuition, replacing it with a better, reflective response (e.g., Stanovich & West,
2000; Stanovich, 2009; Kahneman, 2003). Thus, the deliberative process produces superior
judgments and decisions. Because numeracy is considered a deliberative process and greater
numeracy is associated with a greater non-normative bets effect, default-interventionist theories
are inconsistent with these findings. The effect, however, is consistent with Fuzzy Trace Theory
(FTT; Reyna, Nelson, et al., 2009; Reyna et al., 2003) as well as interactive dual-process theories
(Cognitive Experiential Self Theory [CEST], Epstein, 1994, 2000; affect heuristic, Slovic et al.,
2002, 2004) that have sometimes been grouped incorrectly with default-interventionist theories
(e.g., Reyna et al., 2009). Both types of dual-process theories allow for better or worse decisions

35
to emerge from either process. Epstein (2000), for example, states “This is not meant to suggest
that the [deliberative] mind is always superior. The inferential, [deliberative] mind and the
learning, experiential mind each has its advantages and disadvantages” (p. 671).
Second, the highly numerate have more positive integral affect to the $9 in the presence
of the small loss (e.g., Peters et al., 2006; the present Study 2). Peters et al. (2006) suggested that
the integral affect was due to the highly numerate deliberating more with numbers to produce the
affective input; in other words, the dual processes interact to inform one another and the
judgment itself. Default-interventionist theories are inconsistent with the two processes
interacting in this manner; they allow for System 2 to correct an incorrect System 1 response but
not to provide an informative affective response to System 1. Interactive theories do allow for
complex interactions between the two processes. Thus, in the affect heuristic, for example, “We
now recognize that the experiential mode of thinking and the analytic model of thinking are
continually active, interacting in what we have characterized as ‘the dance of affect and reason’”
(Slovic, Finucane, Peters, & MacGregor, 2004, p. 314). In CEST, “The two systems operate in
parallel and are interactive. All behavior is assumed to be influenced by a combination of both
systems, with their relative contribution varying from minimal to maximal along a dimension”
(p. 671, Epstein, 2000).
FTT also appears consistent with greater numeracy producing integral affect to the $9. In
fact, it is explicit that people with greater expertise (e.g., due to numeracy) rely more on intuitive
gist (e.g., integral affect) (Reyna et al., 2009). Interactive theories and FTT differ somewhat in
their explanation of what produces this affect. Interactive theories can explain it through a
deliberative process of number comparisons associated with greater numeracy whereas FTT can

36
explain it through greater experience/expertise with numbers (e.g., greater numeracy) producing
automatic gist understanding (deliberation does not have to be involved). The two types of
theories, however, make the same behavioral predictions in this task.
However and potentially inconsistent with FTT (but consistent with interactive theories),
the less numerate in Study 3 can produce the bets effect with instruction (a verbatim process
rather than an automatic process produces the effect). In addition, the highly numerate in Study 3
reported doing more verbatim calculations even without instruction (e.g., expected-value and
other calculations in Table 3; see also Cokely & Kelley, 2009). This use of more verbatim
number operations by the highly numerate appears inconsistent with FTT which claims “an
overarching preference for gist representations (as opposed to verbatim representations)” (Reyna,
2004, p. 61) that increases with greater expertise. In fact, not only do the highly numerate do
these operations more, but number operations are more arguably the basis of their judgments
based on regression analyses that revealed that reported comparisons and calculations predicted
attractiveness ratings whereas reported identifications and evaluations did not. It does remain
possible, however, that the calculations produced a gist response that we could not code.
Comparing the $9 to the 5¢, for example, alters affect to the $9; the highly numerate may also
have a gist response to their calculation results. Overall, however, the free response data are
more consistent with participants relying on calculations and comparisons (arguably verbatim
representations, particularly for calculations) and not on evaluations which are more clearly gist
representations. Thus, verbatim processes appeared to drive attractiveness ratings more, which
could be seen as inconsistent with FTT.

37
Conclusion
Preference construction can result from stable and persistent processing inclinations
related to numeric skills. Bets-effect findings reveal that preference construction is not limited to
cognitively-constrained individuals and less familiar contexts. Instead, greater cognitive capacity
based on numeracy produced constructed preferences even among some of our most experienced
populations (e.g., actuaries). Given that numeric processing determines part of our unparalleled
ability to control our world (e.g., in science, health, finances), understanding stable processing
inclinations (for both the more and less numerate) should enable us to build better judgment-and-
decision-making models and to ascertain better prescriptive solutions in decisions with real
consequences.

38
References
Anderson, N. H. (1974). Cognitive algebra: Integration theory applied to social attribution.
Advances in Experimental Social Psychology, 7, 1-101.
Bateman, I., Dent, S., Peters, E., Slovic, P., & Starmer, C. (2007). The affect heuristic and the
attractiveness of simple gambles. Journal of Behavioral Decision Making, 20, 365-380.
Betsch, C., Haase, N., Renkewitz, F., & Schmid, P. (2015). The narrative bias revisited: What
drives the biasing influence of narrative information on risk perceptions?. Judgment and
Decision Making, 10(3), 241.
Cacioppo, J. T., Petty, R. E., & Kao, C. F. (1984). The efficient assessment of “need for
cognition.” Journal of Personality Assessment, 48, 306–307.
Chesney, D. & Peters, E. (2015). Math priming improves judgments. Poster session presented at
the Annual Convention of the Association for Psychological Science, New York, NY.
Cokely, E. T., Galesic, M., Schulz, E., Ghazal, S., & Garcia-Retamero, R. (2012). Measuring risk
literacy: The Berlin numeracy test. Judgment and Decision Making, 7(1), 25-47.
Cokely, E. T., & Kelley, C. M. (2009). Cognitive abilities and superior decision making under
risk: A protocol analysis and process model evaluation. Judgment and Decision Making,
4(1), 20.
Dørum, O. (2008). Mensa IQ Test. Retrieved October 16, 2017, from http://test.mensa.no
Ekstrom, R. B., French, J. W., Harman, H., & Derman, D. (1976). Kit of factor-referenced
cognitive tests (Rev. ed.). Princeton, NJ: Educational Testing Service.
Epstein, S. (1994). Integration of the cognitive and the psychodynamic unconscious. American
Psychologist, 49(8), 709.
Epstein, S. (2000). The rationality debate from the perspective of cognitive-experiential self-

39
theory. Behavioral and Brain Sciences, 23(5), 671-671.
Fagerlin, A., Zikmund-Fisher, B. J., & Ubel, P. A. (2005). How making a risk estimate can
change the feel of that risk: Shifting attitudes toward breast cancer risk in a general public
survey. Patient Education and Counseling, 57(3), 294-299.
Fagerlin, A., Zikmund-Fisher, B. J., Ubel, P. A., Jankovic, A., Derry, H. A., & Smith, D. M.
(2007). Measuring numeracy without a math test: development of the Subjective
Numeracy Scale. Medical Decision Making, 27(5), 672-680.
Galesic, M., & Garcia-Retamero, R. (2010). Statistical numeracy for health: a cross-cultural
comparison with probabilistic national samples. Archives of Internal Medicine, 170(5),
462-468. doi: 10.1001/archinternmed.2009.481.
Ghazal, S., Cokely, E. T., & Garcia-Retamero, R. (2014). Predicting biases in very highly
educated samples: Numeracy and metacognition. Judgment and Decision Making, 9(1),
15.
Gilbert, D. T., Pelham, B. W., & Krull, D. S. (1988). On cognitive busyness: When person
perceivers meet persons perceived. Journal of Personality and Social Psychology, 54(5),
733.
Graffeo, M., Polonio, L., & Bonini, N. (2015). Individual differences in competent consumer
choice: the role of cognitive reflection and numeracy skills. Frontiers in Psychology, 6,
844.
Hayes, A. F. (2013). Introduction to Mediation, Moderation, and Conditional Process Analysis.
A Regression-Based Approach. 2013. New York: Guilford.
Hsee, C. K. (1996a). Elastic justification: How unjustifiable factors influence judgments.
Organizational Behavior and Human Decision Processes, 66, 122-129.

40
Hsee, C. K. (1996b). The evaluability hypothesis: An explanation for preference reversals
between joint and separate evaluations of alternatives. Organizational Behavior and
Human Decision Processes, 67, 242-257.
Hsee, C. K. (1998). Less is better; When low-value options are valued more highly than high-
value options. Journal of Behavioral Decision Making, 11, 107-121.
Hsee, C. K., Yu, F., Zhang, J., & Zhang, Y. (2003). Medium maximization. Journal of Consumer
Research, 30(1), 1-14.
Huber, J., Payne, J. W., & Puto, C. (1982). Adding asymmetrically dominated alternatives:
Violations of regularity and the similarity hypothesis. Journal of Consumer
Research, 9(1), 90-98.
Jasper, J. D., Bhattacharya, C., & Corser, R. (2017). Numeracy Predicts More Effortful and
Elaborative Search Strategies in a Complex Risky Choice Context: A Process‐Tracing
Approach. Journal of Behavioral Decision Making, 30(2), 224-235.
Kahneman, D. (2003). Maps of bounded rationality: Psychology for behavioral
economics. American Economic Review, 93(5), 1449-1475.
Kahneman, D., & Tversky, A. (1979). Prospect theory: An analysis of decision under risk.
Econometrica, 47, 263-291
Kleber, J., Dickert, S., Peters, E., & Florack, A. (2013). Same numbers, different meanings: How
numeracy influences the importance of numbers for pro-social behavior. Journal of
Experimental Social Psychology, 49(4), 699-705.
Krajbich, I., Armel, C., & Rangel, A. (2010). Visual fixations and the computation and
comparison of value in simple choice. Nature Neuroscience, 13(10), 1292-1298,
doi:10.1038/nn.2635

41
Lichtenstein, S., & Slovic, P. (1971). Reversals of preference between bids and choices in
gambling decisions. Journal of Experimental Psychology, 89(1), 46.
Lichtenstein, S., & Slovic, P. (Eds.). (2006). The Construction of Preference. New York:
Cambridge University Press.
Lipkus, I. M., Samsa, G., & Rimer, B. K. (2001). General performance on a numeracy scale
among highly educated samples. Medical Decision Making, 21(1), 37-44.
Pachur, T., Hertwig, R., & Steinmann, F. (2012). How do people judge risks: Availability
heuristic, affect heuristic, or both? Journal of Experimental Psychology: Applied, 18(3),
314-330.
Payne, J. W., Bettman, J. R., & Schkade, D. A. (1999). Measuring constructed preferences:
Towards a building code. Journal of Risk and Uncertainty, 19(13), 243270
Peters, E. (2012). Beyond comprehension: The role of numeracy in judgments and decisions.
Current Directions in Psychological Science, 21(1), 31 - 35.2
Peters, E. & Bjalkebring, P. (2015). Multiple numeric competencies: When a number is not just a
number. Journal of Personality and Social Psychology, 108(5), 802-822.
Peters, E., Dieckmann, N. F., Västfjäll, D., Mertz, C. K., Slovic, P., & Hibbard, J. H. (2009).
Bringing meaning to numbers: The impact of evaluative categories on decisions. Journal
of Experimental Psychology: Applied, 15(3), 213–227.
Peters, E. & Levin, I. P. (2008). Dissecting the risky-choice framing effect: Numeracy as an
individual-difference factor in weighting risky and riskless options. Judgment and
Decision Making, 3(6), 435–448.
Peters, E., Shoots-Reinhard, B., Tompkins, M.K., Schley, D., Meilleur, L., Sinayev, A., Tusler,
M., Wagner, L., & Crocker, J. (2017). Improving numeracy through values affirmation

42
enhances decision and STEM outcomes. PLoS ONE, 12(7): e0180674.
Peters, E., Västfjäll, D., Slovic, P., Mertz, C. K., Mazzocco, K., & Dickert, S. (2006). Numeracy
and decision making. Psychological Science, 17(5), 407-413.
Peterson, R. A. (2001). On the use of college students in social science research: Insights from a
second-order meta-analysis. Journal of Consumer Research, 28(3), 450-461.
Petrova, D. G., van der Pligt, J., Garcia-Retamero, R. (2014). Feeling the numbers: on the
interplay between risk, affect, and numeracy. Journal of Behavioral Decision Making,
27(3), 191-199. doi:10.1002/bdm.1803
Raven, J. (2000). The Raven’s Progressive Matrices: Change and Stability over Culture and
Time. Cognitive Psychology, 41(1), 1–48. https://doi.org/10.1006/cogp.1999.0735
Reyna, V. F. (2004). How people make decisions that involve risk: A dual-processes
approach. Current Directions in Psychological Science, 13(2), 60-66.
Reyna, V. F., Lloyd, F. J., & Brainerd, C. J. (2003). Memory, development, and rationality: An
integrative theory of judgment and decision making. In S. L. Schneider & J. Shanteau
(Eds.) Emerging perspectives on judgment and decision research. Cambridge University
Press. Pp. 201-245.
Reyna, V. F., Nelson, W. L., Han, P. K., & Dieckmann, N. F. (2009). How numeracy influences
risk comprehension and medical decision making. Psychological Bulletin, 135(6), 943.
Scherer, L. D., Yates, J. F., Baker, S. G., & Valentine, K. D. (2017). The influence of effortful
thought and cognitive proficiencies on the conjunction fallacy: Implications for dual-
process theories of reasoning and judgment. Personality and Social Psychology
Bulletin, 43(6), 874-887.
Siegler, R. S., & Opfer, J. E. (2003). The development of numerical estimation: Evidence for

43
multiple representations of numerical quantity. Psychological Science, 14(3), 237-250.
Slovic, P., Finucane, M., Peters, E., MacGregor, D. G. (2002). Rational actors or rational fools:
Implications of the affect heuristic for behavioral economics. Journal of Socio-
Economics, 31(4), 329-342.
Slovic, P., Finucane, M. L., Peters, E., & MacGregor, D. G. (2004). Risk as analysis and risk as
feelings: Some thoughts about affect, reason, risk, and rationality. Risk Analysis, 24(2),
311-322.
Stanovich, K. E. (2009). Distinguishing the reflective, algorithmic, and autonomous minds: Is it
time for a tri-process theory. In two minds: Dual processes and beyond, 55-88.
Stanovich, K. E., & West, R. F. (2000). Individual differences in reasoning: Implications for the
rationality debate?. Behavioral and Brain Sciences, 23(5), 645-665.
Thaler, R. H., & Johnson, E. J. (1990). Gambling with the house money and trying to break
even: The effects of prior outcomes on risky choice. Management Science, 36(6), 643-
660.
Traczyk, J., & Fulawka, K. (2016). Numeracy moderates the influence of task-irrelevant affect
on probability weighting. Cognition, 151, 37-41.
Troutman, C. M., & Shanteau, J. (1976). Do consumers evaluate products by adding or
averaging attribute information? Journal of Consumer Research, 3(2), 101-106.
Weller, J. A., Dieckmann, N. F., Tusler, M., Mertz, C. K., Burns, W. J., & Peters, E. (2013).
Development and testing of an abbreviated numeracy scale: A Rasch analysis approach.
Journal of Behavioral Decision Making, 26(2), 198-212.

44
Figure 1. Predicted attractiveness means by numeracy and bet condition in Studies 3 and 4
0
2
4
6
8
10
12
14
16
18
0 1 2 3 4 5 6 7
Original Loss - Study 3
Original No Loss - Study 3
Loss - Study 4
No Loss - Study 4Pre
dic
ted a
ttra
ctiv
enes
s
Numeracy

45
Table 1. Comparison of percent correct on numeracy items among accountants (Study 2), a
nationally representative sample from Galesic and Garcia-Retamero (2010) and low/high
education adults in Peters et al. (2007). Missing responses indicate items that were not asked.
Numeracy Question Percent Correct
Galesic &
Garcia-
Retamero,
2010,
Table 2
Peters et al., 2007,
Table 1
Accoun
tants in
Study 1
US
sample
Less
Educ
(<=high
school
degree)
More Educ
(some trade
school or
college or
more)
Imagine that we flip a fair coin 1,000 times. What is your best guess about
how many times the coin will come up heads in 1,000 flips?
88% 73%
In the Bingo Lottery, the chance of winning a $10 prize is 1%. What is
your best guess about how many people would win a $10 prize if 1,000
people each buy a single ticket for Bingo Lottery?
86% 58% 36% 60%
In the Daily Times Sweepstakes, the chance of winning a car is 1 in 1,000.
What percent of tickets of Daily Times Sweepstakes win a car?
57% 23% 13% 33%
Imagine that we roll a fair, six-sided die 1,000 times. Of 1,000 rolls, how
many times do you think the die would come up even (2, 4, or 6)?
85% 57% 50% 65%
Which of the following numbers represents the biggest risk of getting a
disease? 1 in 100, 1 in 1,000, 1 in 10
95% 75% 83% 94%
Which of the following represents the biggest risk of getting a disease? 1%,
10%, 5%
95% 83% 88% 96%
If the chance of getting a disease is 10%, how many people would be
expected to get the disease out of 1,000?
91% 83% 69% 86%
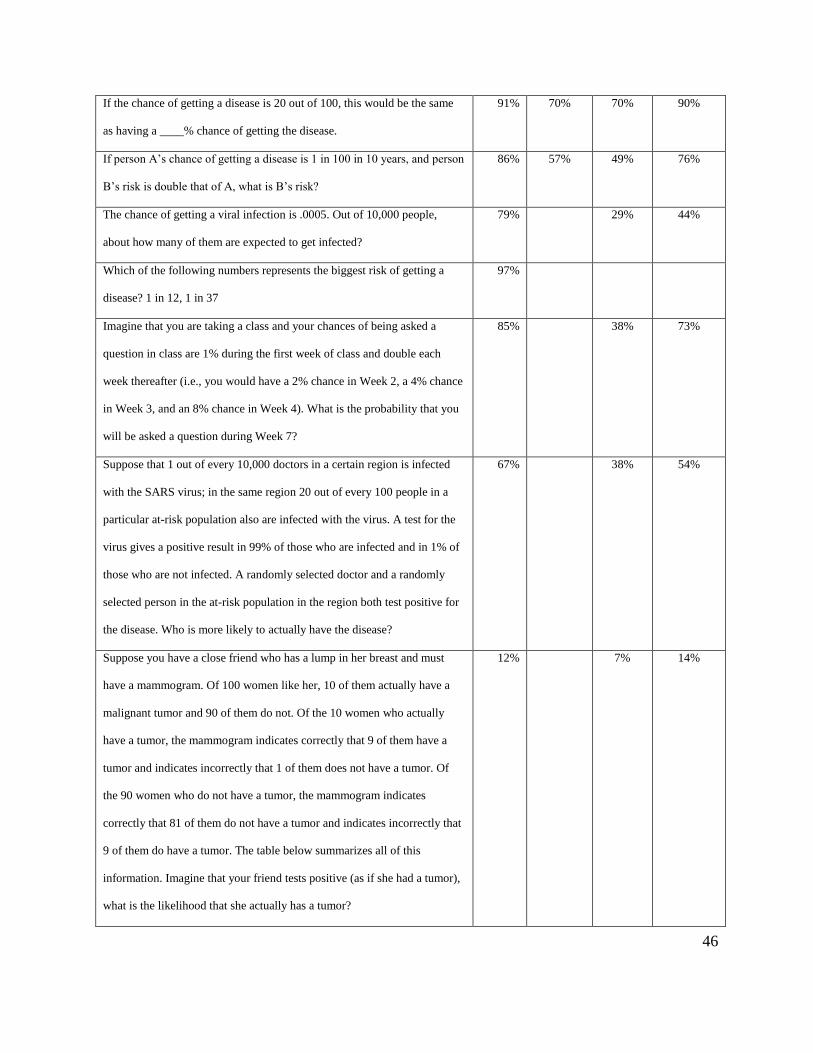
46
If the chance of getting a disease is 20 out of 100, this would be the same
as having a ____% chance of getting the disease.
91% 70% 70% 90%
If person A’s chance of getting a disease is 1 in 100 in 10 years, and person
B’s risk is double that of A, what is B’s risk?
86% 57% 49% 76%
The chance of getting a viral infection is .0005. Out of 10,000 people,
about how many of them are expected to get infected?
79% 29% 44%
Which of the following numbers represents the biggest risk of getting a
disease? 1 in 12, 1 in 37
97%
Imagine that you are taking a class and your chances of being asked a
question in class are 1% during the first week of class and double each
week thereafter (i.e., you would have a 2% chance in Week 2, a 4% chance
in Week 3, and an 8% chance in Week 4). What is the probability that you
will be asked a question during Week 7?
85% 38% 73%
Suppose that 1 out of every 10,000 doctors in a certain region is infected
with the SARS virus; in the same region 20 out of every 100 people in a
particular at-risk population also are infected with the virus. A test for the
virus gives a positive result in 99% of those who are infected and in 1% of
those who are not infected. A randomly selected doctor and a randomly
selected person in the at-risk population in the region both test positive for
the disease. Who is more likely to actually have the disease?
67% 38% 54%
Suppose you have a close friend who has a lump in her breast and must
have a mammogram. Of 100 women like her, 10 of them actually have a
malignant tumor and 90 of them do not. Of the 10 women who actually
have a tumor, the mammogram indicates correctly that 9 of them have a
tumor and indicates incorrectly that 1 of them does not have a tumor. Of
the 90 women who do not have a tumor, the mammogram indicates
correctly that 81 of them do not have a tumor and indicates incorrectly that
9 of them do have a tumor. The table below summarizes all of this
information. Imagine that your friend tests positive (as if she had a tumor),
what is the likelihood that she actually has a tumor?
12% 7% 14%
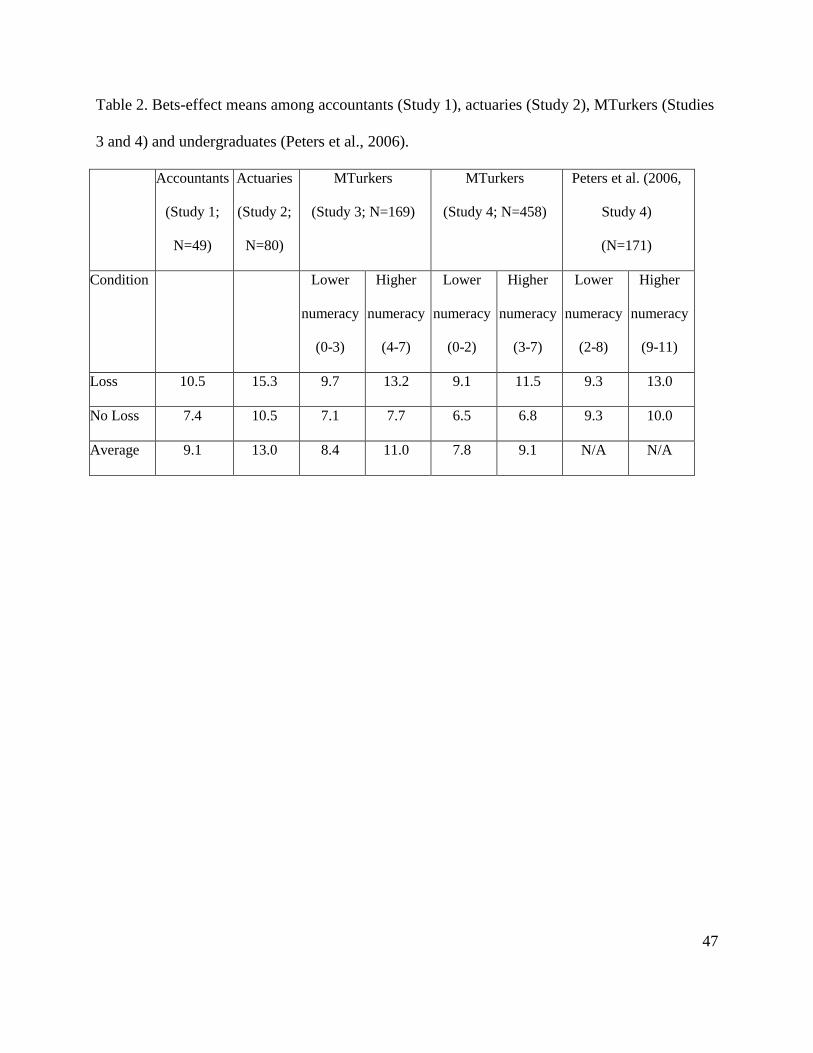
47
Table 2. Bets-effect means among accountants (Study 1), actuaries (Study 2), MTurkers (Studies
3 and 4) and undergraduates (Peters et al., 2006).
Accountants
(Study 1;
N=49)
Actuaries
(Study 2;
N=80)
MTurkers
(Study 3; N=169)
MTurkers
(Study 4; N=458)
Peters et al. (2006,
Study 4)
(N=171)
Condition Lower
numeracy
(0-3)
Higher
numeracy
(4-7)
Lower
numeracy
(0-2)
Higher
numeracy
(3-7)
Lower
numeracy
(2-8)
Higher
numeracy
(9-11)
Loss 10.5 15.3 9.7 13.2 9.1 11.5 9.3 13.0
No Loss 7.4 10.5 7.1 7.7 6.5 6.8 9.3 10.0
Average 9.1 13.0 8.4 11.0 7.8 9.1 N/A N/A

48
Table 3. Proportion of Study 3 participants mentioning each coded response type
Cognitive
operation
types
Coded response Original
Loss
(n=93)
Original
No-Loss1
(n=76)
Salience
Big-5 Loss1
(n=106)
Salience
Big-9 Win1
(n=90)
Reverse
Order1
(n=105)
#comparison
Instruction1
(n=96)
Less
numerate
(n=274)
More
numerate2 (n=292)
Identification Probability of win 63.4% 75.0%b 53.8% 67.8%
c 59.0% 58.3% 60.2% 64.0%
Probability of loss 30.1% 18.4% 33.0% 32.2% 31.4% 32.3% 28.5% 31.5%
Pie chart 2.2% 5.3% 5.7% 2.2% 2.9% 2.1% 3.3% 3.4%
Amount to win 68.8% 36.8%a,c
61.3%a 68.9% 65.7% 68.7% 54.7% 70.0%
d
Amount to lose 61.3% 11.8%a 71.7%
a,c 62.2%
c 65.7%
c 70.8% 50.0% 67.8%
d
Avg # of identifications 2.26 1.47a 2.25
c 2.33
c 2.25
c 2.32 1.97 2.37
d
Comparison Comparison p(win) and p(lose) 7.5% 5.3% 9.4% 8.9% 9.5% 11.5% 9.5% 8.2%
Cost of bet 3.2% 11.8%c 3.8%c 7.8%
c 3.8% 6.2% 1.5% 9.9%
d
Comparison $9 vs. 5¢ loss 9.7% 0.0% 14.2%c 17.8%
c 15.2%c 16.7%
c 9.1% 19.5%
d
Avg # of comparisons .31 .17c .27
c .34
c .29 .34
c .20 .38
d
Calculation Expected value calculation 2.2% 1.3% 0.9%c 2.2%
c 1.0% 1.0%
c 0.0% 2.7%
d
Other calculation 17.2% 18.4%c 9.4%
c 15.6%
c 12.4%
c 16.7%
c 6.2% 22.6%
d
Avg # of calculations .19 .20c .10
c .18
c .13
c .17
c .06 .25
d
Evaluation Feeling or evaluation of
probability to win
34.4% 42.1% 24.5% 21.1% 26.7% 27.1% 28.5% 29.1%
Feeling or evaluation of
probability to lose
10.8% 5.3% 16.0% 15.6% 12.4% 10.4% 11.3% 12.7%
Feelings or evaluation about win 22.5% 15.8% 20.8% 18.9% 21.0% 26.0% 18.6% 23.3%d
Feelings or evaluation about loss 40.9% 5.3%a 50.0% 38.9% 41.9% 40.6% 30.3% 44.5%
d
Avg # of evaluations 1.09 .68a 1.11 .94 1.02 1.04 .89 1.10
d
Notes:
1 Coded responses for each bet condition were compared separately to the Original Loss condition in logistic regressions controlling
for numeracy (in the comparison of Loss vs. No-Loss, numeracy’s interaction with condition was also included because it was the
only time the interaction predicted attractiveness); similar linear regressions were conducted for the average number of each operation

49
type. a indicates a significant difference in the indicated condition vs. the Original Loss condition;
b indicates a significant interaction
between numeracy and the comparison of the original Loss and No-Loss conditions; c indicates a significant numeracy difference
when controlling for the condition comparison (and the interaction when the two Original conditions were compared).
2 In a separate set of analyses, we included all participants (all conditions) and examined whether numeracy differences existed,
controlling for dummy variables of each condition. d indicates a significant numeracy difference.