Embed Size (px)
Citation preview

1
The Little Ice Age glacier maximum in Iceland and the North Atlantic Oscillation: Evidence from Lambatungnajökull, southeast Iceland TOM BRADWELL, ANDREW J. DUGMORE AND DAVID E. SUGDEN Bradwell, T., Dugmore., A.J. & Sugden, D.E.: The Little Ice Age glacier maximum in Iceland
and the North Atlantic Oscillation: Evidence from Lambatungnajökull, southeast Iceland.
This paper examines the link between Late Holocene fluctuations of Lambatungnajökull, an
outlet glacier of the Vatnajökull ice cap in Iceland, and variations in climate.
Geomorphological evidence is used to reconstruct the pattern of glacier fluctuations; whilst
lichenometry and tephrostratigraphy are used to date glacial landforms deposited over the last
~400 years. Moraines dated using two different lichenometric techniques indicate that the
most extensive period of glacier expansion occurred shortly before c. AD 1795, probably
during the 1780s. Recession over the last 200 years was punctuated by re-advances in the
1810s, 1850s, 1870s, 1890s and c. 1920, 1930 and 1965. Lambatungnajökull receded more
rapidly in the 1930s and 1940s, than at any other time during the last 200 years. The rate and
style of glacier retreat since 1930 compare well with other similar-sized, non-surging, glaciers
in southeast Iceland, suggesting that the terminus fluctuations are climatically driven.
Furthermore, the pattern of glacier fluctuations over the 20th century broadly reflects the
temperature oscillations recorded at nearby meteorological stations. Much of the climatic
variation experienced in southern Iceland, and the glacier fluctuations that result, can be
explained by secular changes in the North Atlantic Oscillation (NAO). Advances of
Lambatungnajökull generally occur during prolonged periods of negative NAO index. The
main implication of this work relates to the exact timing of the Little Ice Age in the Northeast
Atlantic. Mounting evidence now suggests that the period between AD 1750-1800, rather
than the late 19th century, represented the culmination of the Little Ice Age in Iceland.
Tom Bradwell1 (e-mail: [email protected]), Andrew J. Dugmore, D.E. Sugden, School of GeoSciences, University of Edinburgh, EH8 9XP, UK. 1Present address: British Geological Survey, West Mains Road, Edinburgh, EH9 3LA, UK
2
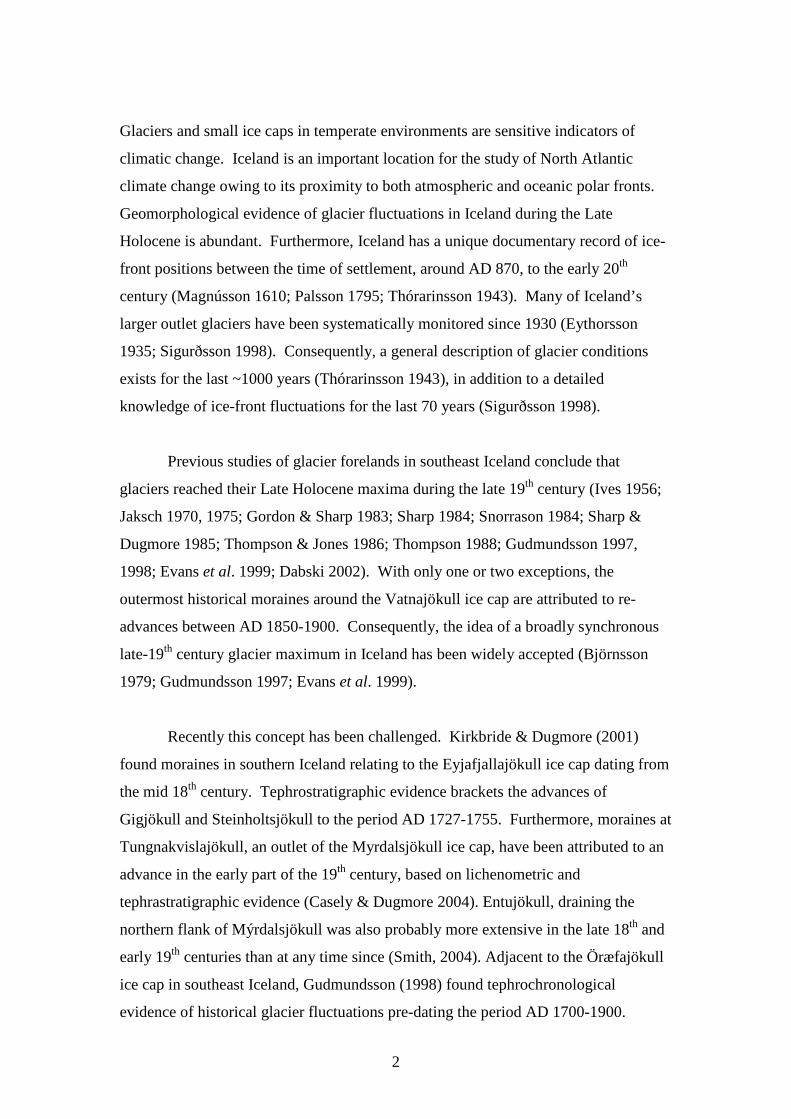
Glaciers and small ice caps in temperate environments are sensitive indicators of
climatic change. Iceland is an important location for the study of North Atlantic
climate change owing to its proximity to both atmospheric and oceanic polar fronts.
Geomorphological evidence of glacier fluctuations in Iceland during the Late
Holocene is abundant. Furthermore, Iceland has a unique documentary record of ice-
front positions between the time of settlement, around AD 870, to the early 20th
century (Magnússon 1610; Palsson 1795; Thórarinsson 1943). Many of Iceland’s
larger outlet glaciers have been systematically monitored since 1930 (Eythorsson
1935; Sigurðsson 1998). Consequently, a general description of glacier conditions
exists for the last ~1000 years (Thórarinsson 1943), in addition to a detailed
knowledge of ice-front fluctuations for the last 70 years (Sigurðsson 1998).
Previous studies of glacier forelands in southeast Iceland conclude that
glaciers reached their Late Holocene maxima during the late 19th century (Ives 1956;
Jaksch 1970, 1975; Gordon & Sharp 1983; Sharp 1984; Snorrason 1984; Sharp &
Dugmore 1985; Thompson & Jones 1986; Thompson 1988; Gudmundsson 1997,
1998; Evans et al. 1999; Dabski 2002). With only one or two exceptions, the
outermost historical moraines around the Vatnajökull ice cap are attributed to re-
advances between AD 1850-1900. Consequently, the idea of a broadly synchronous
late-19th century glacier maximum in Iceland has been widely accepted (Björnsson
1979; Gudmundsson 1997; Evans et al. 1999).
Recently this concept has been challenged. Kirkbride & Dugmore (2001)
found moraines in southern Iceland relating to the Eyjafjallajökull ice cap dating from
the mid 18th century. Tephrostratigraphic evidence brackets the advances of
Gigjökull and Steinholtsjökull to the period AD 1727-1755. Furthermore, moraines at
Tungnakvislajökull, an outlet of the Myrdalsjökull ice cap, have been attributed to an
advance in the early part of the 19th century, based on lichenometric and
tephrastratigraphic evidence (Casely & Dugmore 2004). Entujökull, draining the
northern flank of Mýrdalsjökull was also probably more extensive in the late 18th and
early 19th centuries than at any time since (Smith, 2004). Adjacent to the Öræfajökull
ice cap in southeast Iceland, Gudmundsson (1998) found tephrochronological
evidence of historical glacier fluctuations pre-dating the period AD 1700-1900.

3
Svínafellsjökull, Virkisjökull and Kvíárjökull possess small moraine fragments dating
from around the 13th century, implying that all three glaciers were more extensive
than in later centuries. The moraine in front of Svínafellsjökull is a composite feature
and probably also marks the extent of a pre-historic advance (c. 2000 yrs BP), as well
as a more recent advance in the early 18th century (1727-1755) (Gudmundsson 1998).
Breiðamerkurjökull, a surging outlet glacier, is known to have fluctuated around its
maximum position throughout the 19th century (Evans & Twigg 2002). Bradwell
(2004a) also found evidence of late 18th and early 19th century advances at two
glaciers draining the southern flanks of Öræfajökull. The outermost moraine fragment
at Fjallsjökull, dated using the gradient of the lichen size-frequency distribution,
probably formed during the 1780s (Bradwell 2004a).
The question of glacier synchrony in Iceland is complicated somewhat by the
presence of subglacial volcanic centres. The ice caps of Öræfajökull, Eyjafjallajökull
and Mýrdalsjökull are all situated on active volcanoes. Öræfajökull has erupted only
twice in the last 1000 years – in 1362 and 1727 – leading some to conclude that there
may be a connection between periods of volcanic activity and glacier advances
(Gudmundsson 1998; Larsen 2000). Regardless of any apparent connection, there is
still some doubt as to whether the marginal fluctuations of ice caps draining active
volcanoes are truly representative of climatic change (Thórarinsson 1943; Sturm et
al., 1991). Hence, the findings of Gudmundsson (1998), Kirkbride & Dugmore
(2001), Bradwell (2004a), and Casely & Dugmore (2004) may not be applicable
across Iceland as a whole.
4
Rationale and study area
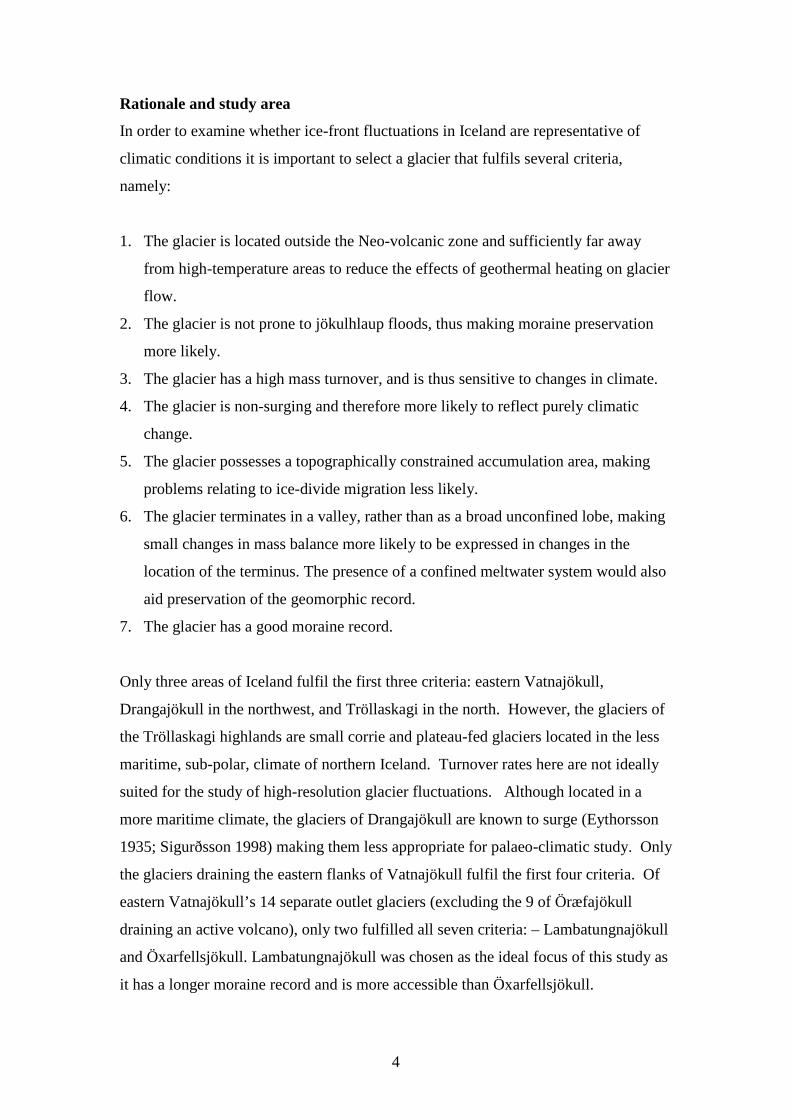
In order to examine whether ice-front fluctuations in Iceland are representative of
climatic conditions it is important to select a glacier that fulfils several criteria,
namely:
1. The glacier is located outside the Neo-volcanic zone and sufficiently far away
from high-temperature areas to reduce the effects of geothermal heating on glacier
flow.
2. The glacier is not prone to jökulhlaup floods, thus making moraine preservation
more likely.
3. The glacier has a high mass turnover, and is thus sensitive to changes in climate.
4. The glacier is non-surging and therefore more likely to reflect purely climatic
change.
5. The glacier possesses a topographically constrained accumulation area, making
problems relating to ice-divide migration less likely.
6. The glacier terminates in a valley, rather than as a broad unconfined lobe, making
small changes in mass balance more likely to be expressed in changes in the
location of the terminus. The presence of a confined meltwater system would also
aid preservation of the geomorphic record.
7. The glacier has a good moraine record.
Only three areas of Iceland fulfil the first three criteria: eastern Vatnajökull,
Drangajökull in the northwest, and Tröllaskagi in the north. However, the glaciers of
the Tröllaskagi highlands are small corrie and plateau-fed glaciers located in the less
maritime, sub-polar, climate of northern Iceland. Turnover rates here are not ideally
suited for the study of high-resolution glacier fluctuations. Although located in a
more maritime climate, the glaciers of Drangajökull are known to surge (Eythorsson
1935; Sigurðsson 1998) making them less appropriate for palaeo-climatic study. Only
the glaciers draining the eastern flanks of Vatnajökull fulfil the first four criteria. Of
eastern Vatnajökull’s 14 separate outlet glaciers (excluding the 9 of Öræfajökull
draining an active volcano), only two fulfilled all seven criteria: – Lambatungnajökull
and Öxarfellsjökull. Lambatungnajökull was chosen as the ideal focus of this study as
it has a longer moraine record and is more accessible than Öxarfellsjökull.

5
Lambatungnajökull
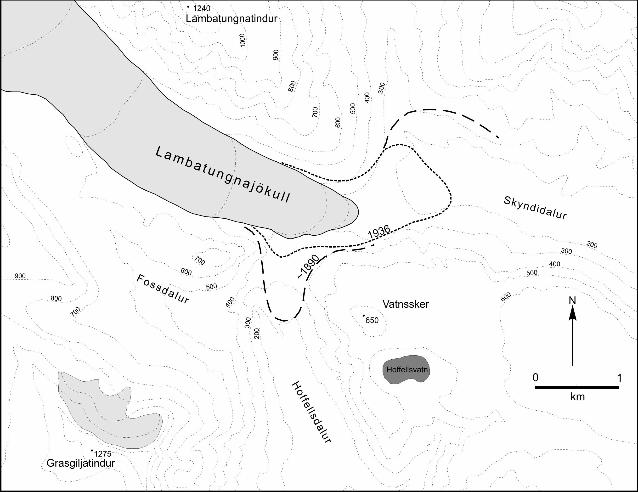
Lambatungnajökull is a little-studied glacier draining from the mountains of north-
eastern Vatnajökull (Fig. 1). It is a medium-sized warm-based outlet glacier that
flows east. The overall surface long-profile of the glacier is relatively steep, falling
almost 1000 m in only 10 km distance. The glacier has a high-elevation accumulation
area (>1000 m a.s.l.) constrained by the underlying topography. The current ablation
area, defined by the late-summer snowline, comprises ~35% of the glacier’s total
area. Calculations based on the 1982 topographic survey place the equilibrium line at
980 m altitude (AAR = 0.6) (Fig. 2), in broad agreement with the ELA of 1000-1100
m derived by Ahlmann & Thórarinsson (1937). Lambatungnajökull presently flows
in a relatively narrow U-shaped valley called Skyndidalur. The floor of this trough is
~600 m below the surrounding mountains. Unlike many other glaciers in Iceland that
terminate as broad lobes on level outwash plains, Lambatungnajökull and its
associated meltwater system are confined by precipitous valley sides to the north and
south.
Present knowledge of glacier fluctuations at Lambatungnajokull
Information regarding the former extent of Lambatungnajökull is limited. No detailed
studies of the glaciers in this area have been published, possibly owing to their
relative inaccessibility. However, there are fragmentary pieces of documentary,
cartographic and photographic evidence relating to ice-marginal fluctuations of
Lambatungnajökull over the last 400 years.
Direct observations
Although the ice-flow is presently confined to one valley, eye-witness accounts state
that during previous periods of glacier growth the ice breached a col in the valley side
and overflowed into the neighbouring valley of Hoffellsdalur. Sigurdur Thórarinsson
visited Lambatungnajökull briefly in the summer of 1938. Thórarinsson (1943: p.6)
states that the glacier was “just leaving the pass from Hoffellsdalur to Skyndidalur”
during the autumn of 1938 and, with the aid of a map prepared in 1936 by the Danish
Geodetic Survey, he partially sketched the glacier’s extent in c. 1890 according to the
farmer at Hoffell (Thórarinsson 1943: fig. 3) (Fig. 3). Thórarinsson believed this limit

6
represented the “maximum extent in historical time” (i.e. the last ~1000 years) (1943:
p.6). Thoroddsen (1913-15: III, p.216) stated that the glacier in Hoffellsdalur reached
the valley floor in 1894. Thórarinsson, probably quoting from Thoroddsen, also says
that in 1894 the main lobe of the glacier “ran right across Skyndidalur” and thus had
retreated 700-800 m by 1936 (Fig. 3).
More recently, the retreat of the southern margin of Lambatungnajökull was
monitored by the farmer at Hoffell between 1935 and 1945 (Sigurðsson 1998). The
glacier is listed in the Icelandic Glaciological database as Hoffellsdalsjökull.
Documentary / anecdotal evidence
Árni Magnússon’s Chorographica written in c. AD 1705 tells of a path that was only
accessible when the margin of Lambatungnajökull did not occupy the col in
Hoffellsdalur. Soon after c. 1650 the path was impassable “owing to glaciers”. In
1936 this path became accessible once again, allowing farmers access into the valley
of Fossdalur and the interior of Vatnajökull. Thórarinsson states that
Lambatungnajökull must therefore have been smaller in c.AD 1640 than in the early
1930s (Thórarinsson 1943: p.7).
A further written account by Sigurður Stefánsson of Holt farm in 1746 (quoted
in Thórarinsson, 1943: p.6) states that the river flowing in Hoffellsdalur was a
‘bergvatn’ not a glacial meltwater river (‘jökulsá’). This led Thórarinsson (1943: p.6)
to propose that Lambatungnajökull was less extensive in 1746 than in 1936. However
the validity of this statement could be questioned, since even during periods of more
extensive glaciation the Hoffellsá river drains a predominantly non-glacial catchment.
Any glacial meltwater streams emanating from Lambatungnajökull may have been
sufficiently diluted by the influx of water from non-glacial sources to appear as
‘bergvatn’ on arrival at Holt, 15 km downstream.

7
Cartographic evidence
Maps of Iceland date back to the early 15th century. However, the scale and accuracy
of these earliest maps make them of little use for quantitative studies of glacier
fluctuations. The first detailed trigonometrical survey of Iceland was carried out by
the Danish General Staff between 1902 and 1904. Unfortunately, Lambatungnajökull
and much of eastern Vatnajökull remained unsurveyed until 1936. The first accurate
topographic maps of this area were published in 1938 at 1:100,000 scale (sheets 106,
107). The National Land Survey of Iceland produced revised sheets in 1962, 1983 and
1998.
Lambatungnajökull also appears on the 1:50,000 US Army Series (C762) maps
compiled from aerial photographs taken in 1945-46 (sheets 55 & 56). These maps
were revised in 1988-90 using high-resolution satellite images. Cartographic
evidence shows that c. 1000 m of ice-front recession has occurred at
Lambatungnajökull since 1936.
Photographic evidence
Aerial photographs of Iceland, taken at regular intervals since 1945, provide a
valuable source of information regarding ice-front fluctuations during the last 60
years. Aerial photography of Vatnajökull was carried out by the US Army in 1945-
46, and by the National Land Survey of Iceland in 1957, 1960-61, 1967, 1982, 1989-
90 and 1998. Five aerial sorties capture the terminus of Lambatungnajökull between
1946 and 2000 (3 of these are shown in Fig. 4).
The former extent of Lambatungnajökull at various times over the last four
centuries has been deduced from historical sources, aerial photographs, published
maps and observations (Fig. 5). Since 1936 the position of the ice margin can be quite
well constrained. However, prior to the mid-20th century, knowledge of
Lambatungnajökull is limited. Documentary historical sources have been used to infer
the approximate position of the glacier front during previous centuries (eg.
Thórarinsson 1943). Yet certain assumptions, particularly regarding the glacier extent
in the 17th and 18th centuries, should be treated with caution.

8
Methods
This study uses geomorphological mapping combined with lichenometry and
tephrochronology to reconstruct the glacial history of Lambatungnajokull in detail.
All landforms relating to glaciation in the valleys of Skyndidalur and Hoffellsdalur
were mapped. Particular emphasis was placed on features relating to ice-marginal
positions; namely end and lateral moraines, ice-contact ramps and fans, abandoned
overflow channels, ice-dammed lake shorelines and erosional trimlines.
Lichenometric investigations were carried out on all moraines.
During 1998 and 1999 approximately 300 yellow-green Subgenus
Rhizocarpon lichens were measured on each of 45 moraine fragments relating to the
former margin of Lambatungnajökull. All lichen measurements were of the longest
axis and all surveys were conducted on ice-proximal slopes. Care was taken to restrict
measurements to thalli of Rhizocarpon section Rhizocarpon and exclude lichens of
section Alpicola, known to grow at different rates (Innes 1982, 1983). Owing to the
difficulties surrounding field identification to the species level, thalli were only
identified to the section level as recommended by Innes (1982, 1985) using the
criteria of Poelt (1988). Consequently, to avoid misidentification, thalli less than 5
mm in diameter were omitted from the survey. Rhizocarpon section Rhizocarpon
(formerly known as the Geographicum group (Runemark 1956)) includes the species
Rhizocarpon geographicum (L.) DC. (Cernohorský 1977). Measurements were made
to the nearest millimetre and were conducted within a fixed area (normally 30-50 m2).
Elongate and misshapen thalli were included in the survey; coalescent thalli were not.
Measurements were restricted to non-vesicular basaltic rocks, which are abundant in
the study area. Over 15 000 lichens were measured in total.
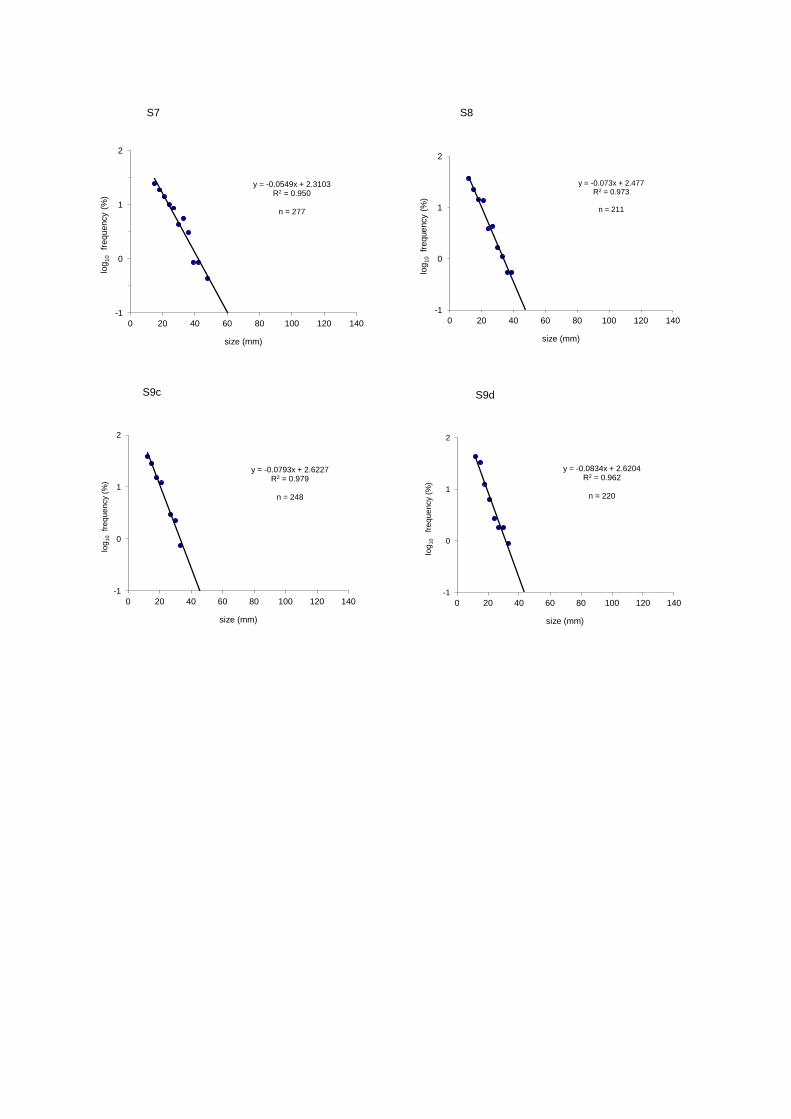
Size-frequency graphs were generated for each lichen survey. Linear
regression analyses, using the least-squares regression method, were calculated for
each size-frequency distribution. Surface exposure ages were derived using both the
largest lichen (in a fixed area) and the gradient of the size-frequency (log10)
distribution, as recommended by Bradwell (2001, 2004a). This study also chose to
use the lichen-dating curves presented in Bradwell (2001, 2004a) rather than curves
derived by other workers. This was for 3 main reasons: firstly, most previous workers

9
in southeast Iceland have carried out lichenometric surveys using the whole landform
(e.g. Jaksch 1975; Thompson & Jones 1986; Evans et al. 1999). These studies cannot
be directly compared with those using a fixed area, as the size of the largest lichen
recorded depends on the size of the area searched (Innes, 1984). Secondly, the curves
presented by Bradwell (2001, 2004a) were constructed using only clearly identifiable
surfaces of undisputed age and similar size, unlike some previous studies (e.g. Jaksch
1975; Evans et al. 1999). Finally, most previous studies in Iceland have used the
average of the five largest lichens as the best measure of surface age. However, recent
lichenometric research has shown that a description of the lichen size-frequency
distribution presents a statistically robust and more powerful technique than using the
single largest or several largest lichen thalli (Caseldine 1991; Bull & Brandon, 1998;
Bradwell 2004a, McKinzey et al. 2004; Lowell et al. 2005).
Pits were dug where soils had accumulated between moraines. Tephra layers
were identified based on visible properties (eg. colour, texture, stratigraphy) and,
where possible, stratigraphically correlated. Soil accumulation rates were used to
constrain minimum landform ages in some circumstances.
Results
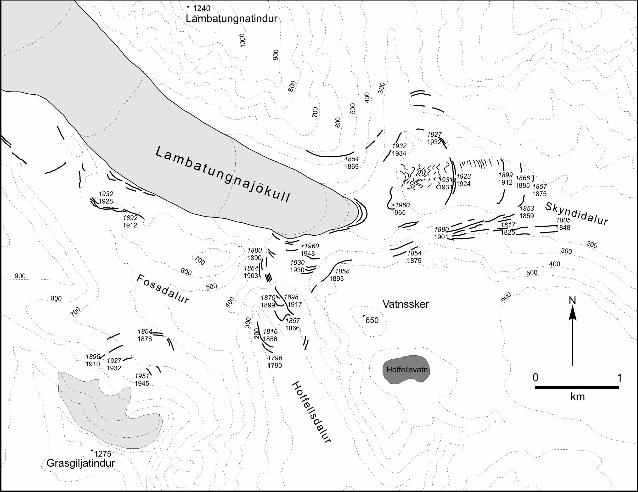
There are numerous landforms in Skyndidalur, Hoffelsdalur and Fossdalur relating to
the former extent of Lambatungnajökull. Two different lichenometric approaches
were used to date moraines in the study area – the size of the largest lichen in a fixed
area and the gradient of the lichen size-frequency distribution. Exposure ages were
derived using the curves constructed by Bradwell (2001, 2004a) (Figs. 6 & 7). The
results of the lichenometric surveys on the moraines are shown in Figures 9 and 10
and Tables 1, 2, & 3.
The largest-lichen technique produces younger exposure ages than the
gradient technique in all but a few cases, typically of 5 to 25%. According to the
gradient technique, the outermost moraine in Hoffellsdalur (H4) on which
lichenometry was conducted yields a surface exposure date of AD 1796 ± 12. A
similar age of 1805 ± 12 was derived for the outermost lateral moraine in Skyndidalur
(S4). Later recessional moraines in both valleys were exposed around 1855 ± 7, 1880
± 6, 1898 ± 4 and 1930 ± 6, according to the gradient technique. A closely spaced
10
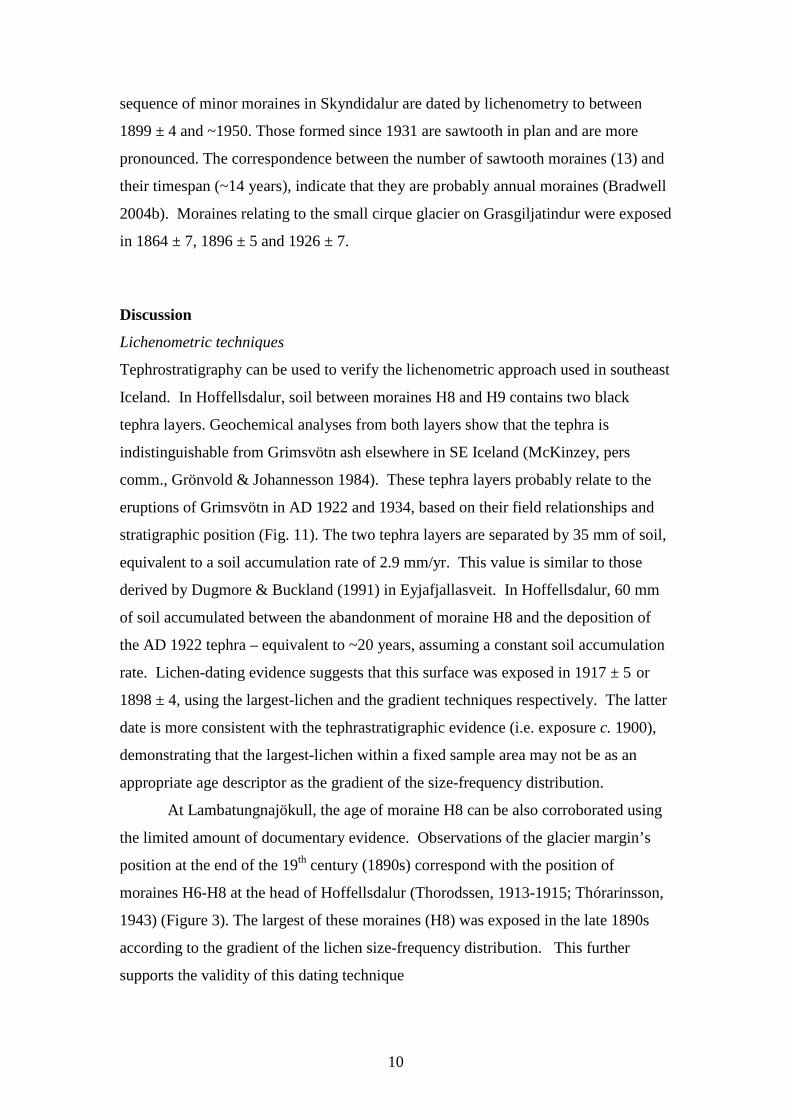
sequence of minor moraines in Skyndidalur are dated by lichenometry to between
1899 ± 4 and ~1950. Those formed since 1931 are sawtooth in plan and are more
pronounced. The correspondence between the number of sawtooth moraines (13) and
their timespan (~14 years), indicate that they are probably annual moraines (Bradwell
2004b). Moraines relating to the small cirque glacier on Grasgiljatindur were exposed
in 1864 ± 7, 1896 ± 5 and 1926 ± 7.
Discussion
Lichenometric techniques
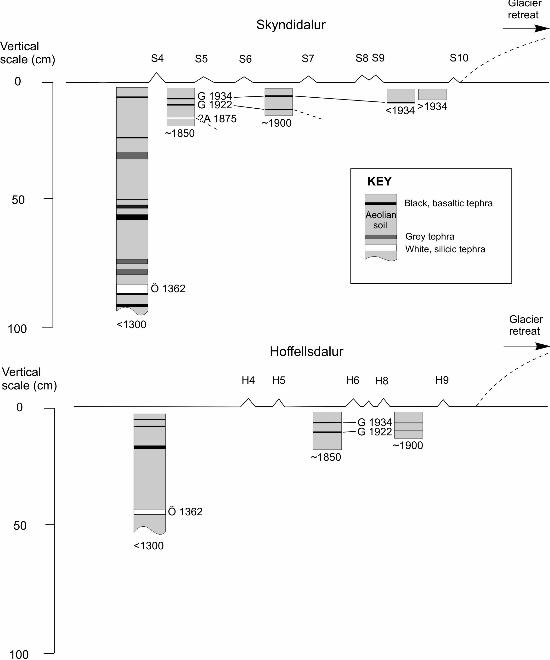
Tephrostratigraphy can be used to verify the lichenometric approach used in southeast
Iceland. In Hoffellsdalur, soil between moraines H8 and H9 contains two black
tephra layers. Geochemical analyses from both layers show that the tephra is
indistinguishable from Grimsvötn ash elsewhere in SE Iceland (McKinzey, pers
comm., Grönvold & Johannesson 1984). These tephra layers probably relate to the
eruptions of Grimsvötn in AD 1922 and 1934, based on their field relationships and
stratigraphic position (Fig. 11). The two tephra layers are separated by 35 mm of soil,
equivalent to a soil accumulation rate of 2.9 mm/yr. This value is similar to those
derived by Dugmore & Buckland (1991) in Eyjafjallasveit. In Hoffellsdalur, 60 mm
of soil accumulated between the abandonment of moraine H8 and the deposition of
the AD 1922 tephra – equivalent to ~20 years, assuming a constant soil accumulation
rate. Lichen-dating evidence suggests that this surface was exposed in 1917 ± 5 or
1898 ± 4, using the largest-lichen and the gradient techniques respectively. The latter
date is more consistent with the tephrastratigraphic evidence (i.e. exposure c. 1900),
demonstrating that the largest-lichen within a fixed sample area may not be as an
appropriate age descriptor as the gradient of the size-frequency distribution.
At Lambatungnajökull, the age of moraine H8 can be also corroborated using
the limited amount of documentary evidence. Observations of the glacier margin’s
position at the end of the 19th century (1890s) correspond with the position of
moraines H6-H8 at the head of Hoffellsdalur (Thorodssen, 1913-1915; Thórarinsson,
1943) (Figure 3). The largest of these moraines (H8) was exposed in the late 1890s
according to the gradient of the lichen size-frequency distribution. This further
supports the validity of this dating technique

11
Across the study as a whole, the gradient of the size-frequency distribution
tends to represent the age of older surfaces more accurately than the largest lichen
within the distribution. The standard errors associated with the age-size curve and
age-gradient curve are comparable for the period ~1800-1925. However, the precision
of the age-gradient curve decreases significantly on surfaces less than 70 years old,
due its exponential form. Aerial photographic evidence also suggests that the largest
lichen is a more accurate and precise age indicator on surfaces deposited in the last
~60-70 years (Bradwell 2004a, 2004b). Crucially, the chronology and ultimately the
climatic interpretation of glacier fluctuations in the study area will differ depending
on the technique used.
Based on all the available geomorphological and lichenometrical evidence, the
glacier advances or stillstands that deposited the larger moraines at
Lambatungnajökull occurred immediately prior to the following times (AD):
Hoffellsdalur – 1796, 1816, 1857-64, 1870-80, 1892-99, 1926-30, 1965; Skyndidalur
– 1805, 1817, 1853-58, 1870-80, 1899, 1923, 1931-34, 1965.
Wider significance
The record of Late Holocene glacier fluctuations reconstructed for
Lambatungnajökull spans the last ~250 years (Figs. 12 & 13). The outermost
moraines in Hoffelsdalur and Skyndidalur, on which meaningful lichenometric results
were obtained, show that Lambatungnajökull reached its Little Ice Age maximum
towards the end of the 18th century, probably between ~1780 and 1795. Since then,
the glacier has undergone rapid retreat punctuated by periods of stillstand or
readvance. The most notable of these resulted in moraine formation during the 1810s,
1850s, 1870s, 1890s and c. 1930.
The preservation of moraines relating to the former extent of
Lambatungnajökull has been greatly aided by the fact that the glacier tongue no
longer occupies Hoffellsdalur. This rather unusual setting may explain why the
geomorphic record of glacier fluctuations is longer and more comprehensive at
Lambatungnajökull than at most other glaciers in southeast Iceland.
12
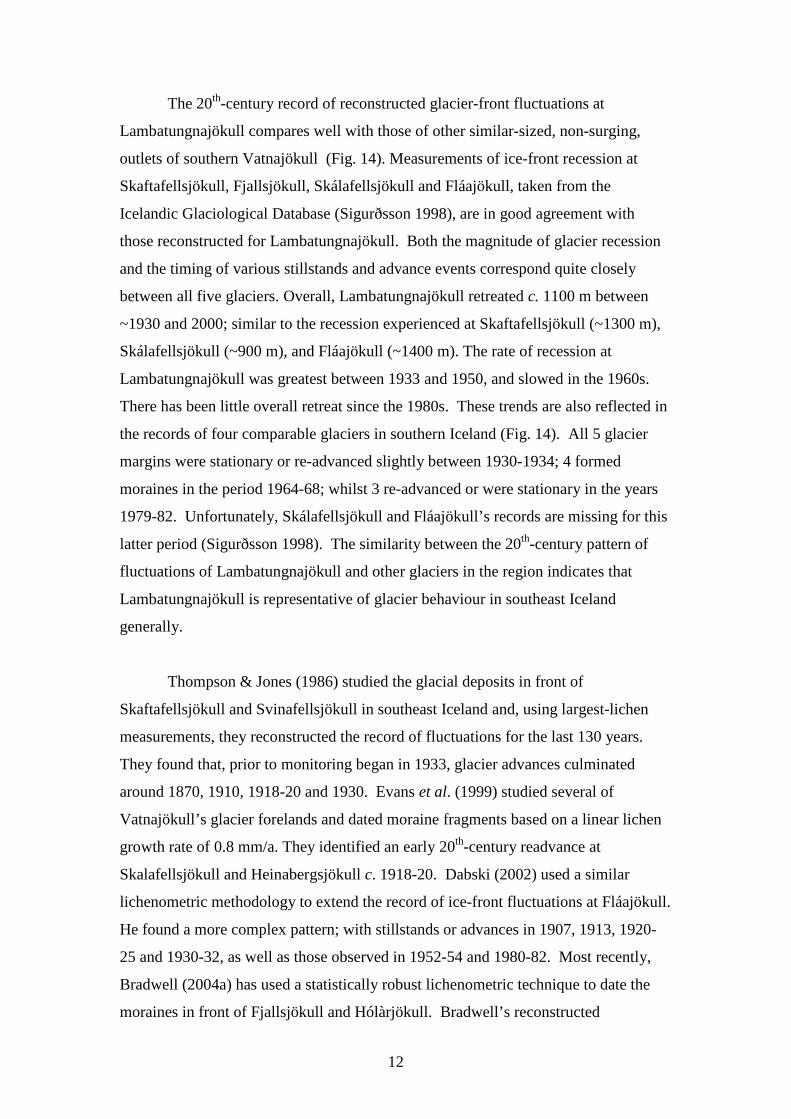
The 20th-century record of reconstructed glacier-front fluctuations at
Lambatungnajökull compares well with those of other similar-sized, non-surging,
outlets of southern Vatnajökull (Fig. 14). Measurements of ice-front recession at
Skaftafellsjökull, Fjallsjökull, Skálafellsjökull and Fláajökull, taken from the
Icelandic Glaciological Database (Sigurðsson 1998), are in good agreement with
those reconstructed for Lambatungnajökull. Both the magnitude of glacier recession
and the timing of various stillstands and advance events correspond quite closely
between all five glaciers. Overall, Lambatungnajökull retreated c. 1100 m between
~1930 and 2000; similar to the recession experienced at Skaftafellsjökull (~1300 m),
Skálafellsjökull (~900 m), and Fláajökull (~1400 m). The rate of recession at
Lambatungnajökull was greatest between 1933 and 1950, and slowed in the 1960s.
There has been little overall retreat since the 1980s. These trends are also reflected in
the records of four comparable glaciers in southern Iceland (Fig. 14). All 5 glacier
margins were stationary or re-advanced slightly between 1930-1934; 4 formed
moraines in the period 1964-68; whilst 3 re-advanced or were stationary in the years
1979-82. Unfortunately, Skálafellsjökull and Fláajökull’s records are missing for this
latter period (Sigurðsson 1998). The similarity between the 20th-century pattern of
fluctuations of Lambatungnajökull and other glaciers in the region indicates that
Lambatungnajökull is representative of glacier behaviour in southeast Iceland
generally.
Thompson & Jones (1986) studied the glacial deposits in front of
Skaftafellsjökull and Svinafellsjökull in southeast Iceland and, using largest-lichen
measurements, they reconstructed the record of fluctuations for the last 130 years.
They found that, prior to monitoring began in 1933, glacier advances culminated
around 1870, 1910, 1918-20 and 1930. Evans et al. (1999) studied several of
Vatnajökull’s glacier forelands and dated moraine fragments based on a linear lichen
growth rate of 0.8 mm/a. They identified an early 20th-century readvance at
Skalafellsjökull and Heinabergsjökull c. 1918-20. Dabski (2002) used a similar
lichenometric methodology to extend the record of ice-front fluctuations at Fláajökull.
He found a more complex pattern; with stillstands or advances in 1907, 1913, 1920-
25 and 1930-32, as well as those observed in 1952-54 and 1980-82. Most recently,
Bradwell (2004a) has used a statistically robust lichenometric technique to date the
moraines in front of Fjallsjökull and Hólàrjökull. Bradwell’s reconstructed

13
chronology confirmed the documentary evidence summarized by Thórarinsson (1943)
pertaining to fluctuations of these glaciers. However, Bradwell (2004a) also found
moraines relating to small advances immediately prior to 1904, 1907-10 and 1915-18.
A more extensive, earlier, advance during the 1780s was identified at Fjallsjökull.
It is also interesting to note that the record of ice-front fluctuations reported in
this study corresponds well with those reported from northern Iceland. Kugelmann
(1991) constructed a lichenometric-dating curve using calibration surfaces within his
study region. He dated moraines relating to small cirque and valley glaciers in the
Tröllaskagi mountains. On the basis of lichenometric dating Kugelmann (1991)
reconstructed glacier advances dating from c. AD 1810, 1850, the 1870s, 1890s and
1920s. Häberle (1991) dated moraines in the adjacent catchment within the
Tröllaskagi mountains. He found evidence for glacier advances at Barkardalsjökull c.
1750, and during the 1830s and 1860s. Caseldine (1991) reviewed all the available
evidence and drew similar conclusions, pointing to a Little Ice Age maximum in
northern Iceland in the early 19th century. Unfortunately, the oldest dates derived by
Kugelmann and Häberle, and quoted by Caseldine (1991), lie outside the calibrated
range of their lichen-dating curves and therefore remain open to question.
Further evidence for a climatic signal is found when the record of glacier
fluctuations at Lambatungnajökull is compared with mean climatic conditions over
the 20th century. There is a particularly close correspondence between summer air
temperature and the rate of ice-front recession of Lambatungnajökull during periods
of overall retreat. Between 1930 and 1950 this relationship is striking (Bradwell,
2004b). The implication is that differences in ice-front retreat of Lambatungnajökull
during the 20th century can be largely attributed to variations in mean summer air
temperature from year to year (Bradwell 2004b).
Advance events on a multi-annual timescale appear to be a more complex
response to a combination of climatic variables. The glacier is most likely to advance
as the result of a few years of below-average annual temperatures bringing a halt to
recession. Winter precipitation also plays a significant role in affecting terminus
fluctuations on a sub-decadal timescale. However, the signal is complicated by the
lagged response of the glacier system and therefore cannot be clearly isolated.
14
North Atlantic Oscillation
A large degree of North Atlantic inter-annual climatic variability can be explained by
fluctuations in sea-level pressure that occur between ~30 and 70°N – known as the
North Atlantic Oscillation (NAO) (Rogers, 1984). For example, in Bergen, Norway,
60% of the variations in wintertime precipitation can be accounted for by inter-annual
fluctuations of the NAO (Hurrell, 1995). Similarly there is a high correlation between
positive NAO phases and warmer, generally stormier, winters in the British Isles,
western Scandinavia and Iceland (Jones et al., 1997).
When the record of ice-front fluctuations from Lambatungnajökull is
compared with the wintertime NAO index since AD 1865 (Hurrell 1995), an
interesting pattern emerges (Fig. 12). Glacier advances generally coincide with
periods of persistent negative NAO (Dec-Mar) index. Four or more consecutive
winters with negative NAO indices have occurred only four times since 1864 – in
1870-1873, 1915-1918, 1962-1965 and 1968-1971. Periods of glacier advance, or
prolonged stillstand, at Lambatungnajökull occurred c. 1870, 1890, 1918-20, 1925-30
and 1965. Three of these advances correspond exactly with periods of four or more
negative NAO years. Whilst the advance in ~1890 corresponds with a period of
generally negative NAO index (7 years in 11) (Fig. 12). Within the last 140 years, the
1960s was the decade with the most pronounced negative NAO index (8 years in 10)
and was also the period when most of Iceland’s glaciers started to re-advance
(Johannesson & Sigurðsson 1998). This pattern suggests that climatically sensitive
glaciers in southeast Iceland are more likely to advance during periods of overall
negative NAO (Dec-Mar) index. In sharp contrast, the years 1903-1915 and 1920-
1954 included numerous, successive, positive NAO winters. These were also the
periods of most rapid glacier recession in southern Iceland (Johannesson &
Sigurðsson 1998), including Lambatungnajokull.
However strong, the relationship is not a perfect one. The advance of
Lambatungnajökull between 1925-30 is anomalous as it took place during a period of
predominantly positive NAO index. It is also difficult to explain why the ice-fronts of
many Vatnajökull outlet glaciers have showed a tendency to advance since the 1980s
when there have been 16 positive NAO winters in 20 years (Fig. 12). This

15
observation suggests that the relationship may not be a simple one. It is possible that
a glaciological threshold has been breached breaking down the linkage between
glacier behaviour in SE Iceland and the NAO. Nesje et al., (2000) found a strong link
between the mass balance of maritime glaciers in Norway and phases of the NAO
(Dec-Mar) index. Negative years result in a negative balance, whilst positive years –
when winter precipitation is high – result in an overall increase in glacier mass. New
data from Lambatungnajökull would suggest that the opposite relationship is true in
southeast Iceland. This may be related to the importance of seasonal temperature
variations and ablation season duration, over winter precipitation, in controlling
glacier mass balance and ultimately glacier length in southern Iceland (Ahlmann &
Thorarinsson 1937; Johannesson 1997; Mackintosh et al. 2002). More research is
needed in order to ascertain the validity of this glacio-climatic association.
Conclusions
• Lambatungnajökull has responded dynamically to Late Holocene climatic
change. Focusing on the last 400 years, the glacier grew in size between
AD 1600 and 1700, as recorded in medieval documents. It probably
continued to advance during much of the 18th century. The glacier reached
its greatest Little Ice Age extent in the late 18th century, probably between
AD 1780-1795. Since then Lambatungnajökull has undergone overall
retreat punctuated by numerous advances and stillstands. The largest of
these events formed moraines in the 1810s, 1850s, 1870s, 1890s and
c.1920, 1930 and 1965. Ice-front recession was greatest during the 1930s
and 1940s when retreat averaged 20 m per year. Difference rates of ice-
front retreat during the 20th century can be largely attributed to variations
in mean summer air temperature from year to year.
• Lambatungnajökull was considerably more extensive in the late 18th
century (AD ~1780-1800) than in the second half of the 19th century (AD
1850-1900). This sheds further light on the exact timing of the Little Ice
Age glacier maximum in SE Iceland. Mounting evidence now suggests
16
that the regional glacier maximum occurred between AD 1750-1800,
rather than 100 years later.
• Broadly speaking, the pattern of glacier fluctuations at Lambatungnajökull
over the last 200 years reflects the climatic changes that have occurred in
southeast Iceland and the wider region. Much of the climatic variation
experienced in Iceland over the last two centuries can be explained by
secular changes in the North Atlantic Oscillation. On a decadal scale, new
data from Lambatungnajökull suggests that there is a link between periods
of successive negative winter NAO index and advances of the ice margin.
A shift to more zonal atmospheric circulation, and a weaker Icelandic
Low, may have been responsible for the climatic cooling and positive mass
balance that caused the glacier advances of the 19th and early 20th
centuries.
Acknowledgements
This work was funded by the Department of Geography, University of Edinburgh and
the Royal Geographical Society (Dudley Stamp Memorial Trust). Thanks go to
Jeremy Everest, Keiran Allen and Sara Strachan for their support in the field. Without
Sara’s help on the 27th July 1998 this work might not have been completed.
References: Ahlmann, H.W. & Thórarinsson, S. 1937: Vatnajökull. Scientific results of the Swedish-Icelandic investigations. Geografiska Annaler 19, 146-231. Björnsson, H. 1979: Glaciers in Iceland. Jökull 29, 74-80.
Bradwell, T. 2001: A new lichenometric dating curve for southeast Iceland. Geografiska Annaler 83A, 91-101. Bradwell, T. 2004a: Lichenometric dating in southeast Iceland: the size-frequency approach. Geografiska Annaler 86A, 31-41. Bradwell, T. 2004b: Annual moraines and summer temperatures at Lambatungnajökull, Iceland. Arctic, Antarctic and Alpine Research 36, 502-508.
17
Bull, W.B. & Brandon, M.T. 1998: Lichen dating of earthquake-generated rockfall events, Southern Alps, New Zealand. Geological Society of America Bulletin 110, 60-84. Caseldine, C.J. 1991: Lichenometric dating, lichen population studies and Holocene glacial history in Tröllaskagi, Northern Iceland. In Maizels, J.K. & Caseldine, C.J. (eds.): Environmental Change in Iceland: Past and Present, 219-233. Kluwer, Dordrecht. Casely, A.F. & Dugmore, A.J. 2004: Climate change and ‘anomalous’ glacier fluctuations: the southwest outlets of Myrdalsjökull, Iceland. Boreas 33, 108-122. Cernohorský, Z. 1977: Rhizocarpon Ram. em. Th. Fr. subgen. Rhizocarpon. In Poelt, J. & Vezda, A. (eds.): Bestimmungsschlüssel Europäischer Flechten, Ergänzungsheft 1, 217-231. Vaduz, Cramer. Dabski, M. 2002: Dating of the Flàajökull moraine ridges SE Iceland; comparison of the glaciological, cartographic and lichenometrical data. Jokull 51, 17-24. Dugmore, A.J. & Buckland, P. 1991: Tephrochronology and late Holocene soil erosion in south Iceland. In Maizels, J.K. & Caseldine, C.J. (eds.): Environmental Change in Iceland: Past and Present, 147-159. Kluwer, Dordrecht. Erikstad, L. & Søllid, J.L. 1986: Neoglaciation in South Norway using lichenometric methods. Norsk Geografisk Tidsskrift 40, 85-103. Evans, D.J.A. & Twigg, D.R. 2002: The active temperate glacial landsystem: a model based on Breiðamerkurjökull and Fjallsjökull, Iceland. Quaternary Science Reviews 21, 2143-2177. Evans, D.J.A., Archer, S. & Wilson, D.J.H. 1999: A comparison of the lichenometric and Schmidt hammer dating techniques based on data from the proglacial areas of some Icelandic glaciers. Quaternary Science Reviews 18, 13-41. Eythorsson, J. 1935: On the variation of glaciers in Iceland. Geografiska Annaler 1-2, 121-137. Gordon, J.E. & Sharp, M. 1983: Lichenometry in dating recent glacial landforms and deposits, southeast Iceland. Boreas 12, 191-200. Grönvold, K. & Johannesson, H. 1984: Eruption in Grimsvötn 1983: course of events and chemical studies of the tephra. Jökull 34, 1-11. Gudmundsson, H. J. 1997: A review of the Holocene environmental history of Iceland. Quaternary Science Reviews 16, 81-92. Gudmundsson, H.J. 1998: Holocene Glacier Fluctuations and Tephrochronology of the Öræfi district, Iceland. Ph.D. dissertation, University of Edinburgh.

18
Häberle, T. 1991: Holocene glacial history of the Hörgárdalur area, Tröllaskagi, northern Iceland. In Maizels, J.K. & Caseldine, C. (eds.): Environmental Change in Iceland: Past and Present,193-202. Kluwer, Dordrecht. Hurrell, J.W. 1995: Decadal trends in the North Atlantic Oscillation regional temperatures and precipitation. Science 269, 676-679. Innes, J.L. 1982: Lichenometric use of an aggregated Rhizocarpon 'species'. Boreas 11, 53-57. Innes, J.L. 1983: Size-frequency distributions as a lichenometric technique: an assessment. Arctic and Alpine Research 15, 285-294. Innes, J.L. 1984: The optimal sample size in lichenometric studies. Arctic and Alpine Research 16: 233-244. Innes, J.L. 1985: Lichenometry. Progress in Physical Geography 9, 187-254. Ives, J. 1956: Öræfi, Southeast Iceland: An essay in regional geomorphology. Ph.D. dissertation, McGill University. Jaksch, K. 1970: Beobachtungen in den Gletschervorfeldern des Sólheima und Siðujökull im Sommer 1970. Jökull 20, 45-49. Jaksch, K. 1975: Das Gletschervorfeld des Sólheimajökull. Jökull 20, 45-49. Johannesson, T. 1997: The response of two Icelandic glaciers to climatic warming computed with degree-day mass balance model coupled to a dynamic glacier model. Journal of Glaciology 43, 321-327. Johannesson, T. & Sigurðsson, O. 1998: Interpretation of glacier variations in Iceland, 1930-1995. Jokull 45, 27-35. Jones, P.D., Jonsson, T. & Wheeler, D. 1997: Extension to the North Atlantic Oscillation using early instrumental pressure observations from Gibraltar and southwest Iceland. International Journal of Climatology 15, 1433-50. Kirkbride, M.J. & Dugmore, A.J. 2001: Can lichenometry be used to date the 'Little Ice Age' glacial maximum in Iceland? Climatic Change 48 (1), 151-167. Kugelmann, O. 1991: Dating recent glacier advances in the Svarfaðardalur-Skiðadalur area of northern Iceland by means of a new lichen curve. In Maizels, J.K. & Caseldine, C. (eds.): Environmental Change in Iceland: Past and Present, 203-217. Kluwer, Dordrecht. Larsen, G. 2000: Holocene Volcanism in Iceland and Tephrochronology as a Tool in Volcanology. Iceland 2000: Modern Processes and Past Environments. Abstract Volume, p120. University of Keele.

19
Lowell, T.V., Schoenenberger, K., Deddens, J.A., Denton, G.H., Smith, C., Black, J. & Hendy, C.H. 2005: Rhizocarpon calibration curve for the Aoraki/Mount Cook area of New Zealand. Journal of Quaternary Science 20, 313-325. Mackintosh, A., Dugmore, A.J. & Hubbard, A.L. 2002: Holocene climatic changes in Iceland: evidence from modelling glacier length fluctuations at Sólheimajökull Quaternary International 91: 39-52.. McKinzey, K.M., Orwin, J.O. & Bradwell, T. 2004: Re-dating the moraines at Skálafellsjökull and Heinabergsjökull using different lichenometric methods: implications for the timing of the Icelandic Little Ice Age maximum. Geografiska Annaler 86A, 319-335. Magnússon, Á. 1710. Chorographica Islandica, Universitets-biblioteket, Copenhagen. Nesje, A., Lie, Ø. & Dahl, S.O. 2000: Is the North Atlantic Oscillation reflected in Scandinavian glacier mass balance records? Journal of Quaternary Science 15, 587-601. Palsson, S. 1795: Försog til en Physisk Geographisk og Historisk Beskrivelse over de islanke Is-biaerge, 1792-1794. Naturhistorie Selskabet, Kobnhavn. Poelt, J. 1988: Rhizocarpon Ram. em. Th. Fr. Subgen. Rhizocarpon in Europe. Arctic and Alpine Research, 20, 292-298. Rogers, J.C. 1984: The association between the NAO and the SO in the Northern Hemisphere. Monthly Weather Review 112, 1999-2015. Runemark, H. 1956: Studies in Rhizocarpon, I. Taxonomy of the yellow species in Europe. Opera Botanica 2, 1-152. Sharp, M. 1984: Annual moraine ridges at Skálafellsjökull, south-east Iceland. Journal of Glaciology 30, 82-93. Sharp, M. & Dugmore, A.J. 1985: Holocene glacier fluctuations in eastern Iceland. Zeitschrift für Gletscherkunde und Glazialgeologie 21, 341-349. Sigurðsson, O. 1998: Glacier variations in Iceland 1930-1995. Jökull 45, 3-26. Smith, K.T. 2004: Holocene jökulhlaups, glacier fluctuations and palaeoenvironment, Mýrdalsjökull, South Iceland. Ph.D dissertation, University of Edinburgh. Snorrason, S. 1984: Mýrarjöklar og vatnsdalur. Unpublished Cand. Real dissertation, University of Oslo. Sturm, M., Hall, D., Benson, C., & Field, O. 1991: Non-climatic control of glacier fluctuations in the Wrangell and Chugach Mountains, Alaska, USA. Journal of Glaciology, 37: 348-356.

20
Thompson, A. 1988: Historical development of the proglacial landforms of Svinafellsjökull and Skaftafellsjökull, southeast Iceland. Jökull 38, 17-31. Thompson, A. & Jones, A. 1986: Rates and causes of proglacial river terrace formation in southeast Iceland: an application of lichenometric dating techniques. Boreas 15, 231-246. Thórarinsson, S. 1943: Vatnajökull – Scientific results of the Swedish-Icelandic investigations 1936-1937-1938. Chapter IX: Oscillations of the Icelandic glaciers in the last 250 years. Geografiska Annaler 25, 1-54. Thoroddsen, Th. 1913-1915: Ferdabók, I-IV. Kaupmannahöfn.

21
Captions for figures: Figure 1. Map of southeast Iceland showing the present-day distribution of glaciers and volcanoes. Little Ice Age moraines are also shown, most of which are believed to date from AD 1850-1890. Key to ice caps: A – Tungnafellsjökull; B – Öræfajökull; C – Jökultindur; D - Hofsjökull í Lóni; E – Þrándarjökull; F – Snæfell. Key to outlet glaciers: 1 – Skeiðarárjökull; 2 – Skaftafellsjökull; 3 – Svínafellsjökull; 4 –Virkisjökull; 5 – Hólárjökull; 6 – Kvíárjökull; 7 – Hrútárjökull; 8 – Fjallsjökull; 9 – Breiðamerkurjökull; 10 – Skálafellsjökull; 11 – Heinabergsjökull; 12 – Fláajökull; 13 – Hoffellsjökull; 14 – Lambatungnajökull; 15 – Öxarfellsjökull; 16 –Eyjabakkajökull. Figure 2. Area / altitude distribution of Lambatungnajokull in 1982. Contours are at 100 m vertical intervals. Equilibrium-line altitude (calculated using AAR = 0.6) shown as a dashed line. Figure 3. Topographic map of the study area in AD 1998. [modified from US AMS map, surveyed in 1945]. Contours are at 100 m vertical intervals. The former extent of Lambatungnajökull in ~1890 and 1936, taken from Thórarinsson (1943: p.6), is also shown. Figure 4. The former extent of Lambatungnajökull: photographic evidence. Vertical aerial photographs taken in 1945, 1967 and 1982 reproduced at the same scale. North is to the right. Note the retreat of the southern margin (known as ‘Hoffellsdalsjökull’) into the main valley, Skyndidalur, between 1945 and 1967. (Photographs reproduced with kind permission of the National Land Survey of Iceland.) Figure 5. The size of Lambatungnajökull since c. AD 1600 based on all the evidence prior to this research. Glacier size is expressed relative to its extent in AD 1936. The size of Lambatungnajökull in the 17th, 18th and 19th centuries is uncertain (dashed line). White points are based on documentary sources (Thórarinsson 1943). Black points are based on direct observations (Thorodssen, 1913-15; Thórarinsson, 1943; Sigurðsson, 1998) and, since 1945, aerial photographs. Figure 6. Moraines relating to the former extent of Lambatungnajökull and the glacier on Grasgiljatindur. Contours are at 100 m vertical intervals. The glaciers are shown in their present-day positions (1998). Figure 7. Largest-lichen vs surface age in southeast Iceland (single largest Rhizocarpon section Rhizocarpon lichen in a fixed area), from Bradwell (2001).

22
Figure 8. Gradient of lichen size-frequency (log10) distribution vs surface age in southeast Iceland, from Bradwell (2004a). (Rhizocarpon section Rhizocarpon lichens.) Figure 9. Lichen size-frequency distributions on moraines in Hoffellsdalur, Skyndidalur and Fossdalur. Figure 10. Surface exposure ages (AD) of moraines in the study area derived using two different lichenometric techniques. Dates derived using the largest lichen are in italic script; those derived using the gradient of the lichen size-frequency (log10) distribution are in roman script. Figure 11. Tephrostratigraphy recorded in soil profiles between moraines in Skyndidalur and Hoffellsdalur. Moraines are numbered S4, H4, etc. Tephra layers: G – Grimsvötn; Ö – Öræfajökull, ?A – possibly Askja. Estimated start of soil accumulation given below each profile. Note the contrast in soil depth between the moraines formed in the last ~200 years and further down valley. Figure 12. Palaeo-geographical reconstructions of Lambatungnajökull at various times over the last 250 years. Figure 13. Fluctuations of the terminus of Lambatungnajökull during for the past 400 years. Distances are expressed in kilometres from the 1945 terminus position in Skyndidalur. The position of the glacier margin prior to c. 1780 is uncertain and has been inferred from selected documentary evidence, cited by Thórarinsson (1943). Figure 14. Terminus fluctuations of Lambatungnajökull compared with those of similar-sized valley glaciers in southeast Iceland, since AD 1930 (other data taken from Sigurðsson, 1998). The data are plotted relative to the terminus position in 1930, keeping with the convention of the Icelandic Glaciological Society. Figure 15. Comparison of the North Atlantic Oscillation index with glacier fluctuations at Lambatungnajökull. The upper diagram shows the behaviour of Lambatungnajökull over the last 140 years (deduced in this study). Grey boxes represent the periods when the ice-front was advancing or stationary for a number of years. The lower graph shows the index of the NAO (Dec-Mar) from 1864 - 2000, as used by Hurrell (1995). The index is based on the difference in normalised sea-level pressure between Lisbon, Portugal and Stykkishólmur, Iceland. Sea-level pressure data have been normalised relative to the period 1864-1983. The data have been smoothed (heavy line) using a weighted, seven-point low-pass filter. Note how five of the six advances of Lambatungnajökull since ~1865 coincide with periods of negative NAO index (both shaded).
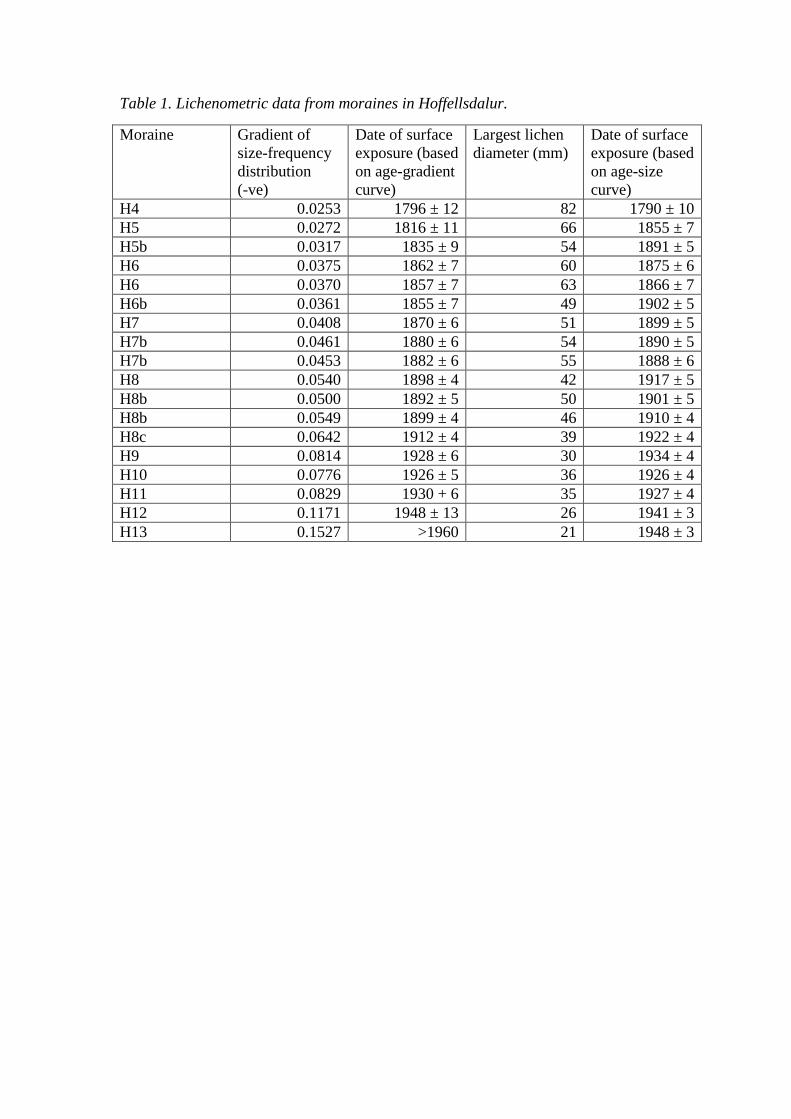
Table 1. Lichenometric data from moraines in Hoffellsdalur. Moraine Gradient of
size-frequency distribution (-ve)
Date of surface exposure (based on age-gradient curve)
Largest lichen diameter (mm)
Date of surface exposure (based on age-size curve)
H4 0.0253 1796 ± 12 82 1790 ± 10 H5 0.0272 1816 ± 11 66 1855 ± 7 H5b 0.0317 1835 ± 9 54 1891 ± 5 H6 0.0375 1862 ± 7 60 1875 ± 6 H6 0.0370 1857 ± 7 63 1866 ± 7 H6b 0.0361 1855 ± 7 49 1902 ± 5 H7 0.0408 1870 ± 6 51 1899 ± 5 H7b 0.0461 1880 ± 6 54 1890 ± 5 H7b 0.0453 1882 ± 6 55 1888 ± 6 H8 0.0540 1898 ± 4 42 1917 ± 5 H8b 0.0500 1892 ± 5 50 1901 ± 5 H8b 0.0549 1899 ± 4 46 1910 ± 4 H8c 0.0642 1912 ± 4 39 1922 ± 4 H9 0.0814 1928 ± 6 30 1934 ± 4 H10 0.0776 1926 ± 5 36 1926 ± 4 H11 0.0829 1930 + 6 35 1927 ± 4 H12 0.1171 1948 ± 13 26 1941 ± 3 H13 0.1527 >1960 21 1948 ± 3

Table 2. Lichenometric data from moraines in Skyndidalur.
Moraine Gradient of size-frequency distribution (-ve)
Date of surface exposure (based on age-gradient curve)
Largest lichen diameter (mm)
Date of surface exposure (based on age-size curve)
S4 0.0315 1835 ± 10 72 1832 ± 8 S4* 0.0263 1805 ± 12 68 1848 ± 7 S4b 0.0286 1817 ± 11 74 1825 ± 9 S5 0.0373 1858 ± 7 60 1875 ± 6 S5b 0.0358 1853 ± 7 65 1858 ± 7 S5e 0.0370 1857 ± 7 60 1875 ± 6 SS 0.0363 1854 ± 7 53 1893 ± 5 SN 0.0362 1854 ± 7 62 1869 ± 6 S6 0.0398 1866 ± 6 56 1885 ± 6 S6b* 0.0453 1880 ± 6 50 1901 ± 5 S6b** 0.0407 1870 ± 6 56 1885 ± 6 S6bun 0.0700 1919 ± 5 38 1923 ± 4 S7 0.0549 1899 ± 4 45 1912 ± 4 S8 0.0730 1923 ± 5 38 1924 ± 4 S8** 0.0654 1915 ± 5 39 1922 ± 4 S9 0.0833 1931 ± 6 32 1931 ± 3 S9c 0.0793 1927 ± 6 32 1931 ± 3 S9d 0.0834 1931 ± 6 33 1930 ± 3 S9e 0.0858 1932 ± 6 32 1931 ± 3 S9f 0.0999 1940 ± 10 30 1934 ± 3 S10 0.2832 >1960 10 1965 ± 2 * – lichens sampled from crest of moraine ** – lichens sampled from ice-distal flank of moraine un – the ice-proximal flank of moraine S6b is oversteepened and unstable, subsequently the lichenometric data do not accurately represent the timing of surface exposure.

Table 3. Lichenometric data from moraines in Fossdalur. Moraine Gradient of
size-frequency distribution (-ve)
Date of surface exposure (based on age-gradient curve)
Largest lichen diameter (mm)
Date of surface exposure (based on age-size curve)
Moraines relating to Lambatungnajökull
L2 0.0509 1892 ± 5 44 1914 ± 4 L3 0.0862 1932 ± 6 36 1926 ± 4 Moraines relating to glacier on Grasgiljatindur G1 0.0383 1864 ± 7 59 1878 ± 6 G3 0.0528 1896 ± 5 43 1915 ± 4 G4 0.0788 1927 ± 6 33 1930 ± 3 G5 0.1261 1951 ± 16 24 1943 ± 3


0
20
40
60
80
100
120
1700 1750 1800 1850 1900 1950 2000
larg
est l
iche
n di
amet
er (m
m)
date of surface exposure (AD)

y = 7.307x-0.90 R2 = 0.989
0
50
100
150
200
250
300
350
400
0 0.02 0.04 0.06 0.08 0.1 0.12 0.14
surfa
ce a
ge (y
r)
gradient (-ve)

hor+A1
y = -0.0509x + 2.0957 R2 = 0.965
n = 210
-1
0
1
2
0 20 40 60 80 100 120 140
log 1
0 f
requ
ency
(%
)
size (mm)
L2
y = -0.0862x + 2.695 R2 = 0.931
n = 188
-1
0
1
2
0 20 40 60 80 100 120 140
log 1
0 fr
eque
ncy
(%)
size (mm)
L3
y = -0.0383x + 1.795 R2 = 0.959
n = 290
-1
0
1
2
0 20 40 60 80 100 120 140
log 1
0 fr
eque
ncy
(%)
size (mm)
G1
y = -0.0528x + 2.1386 R2 = 0.950
n = 255
-1
0
1
2
0 20 40 60 80 100 120 140
log 1
0 fr
eque
ncy
(%)
size (mm)
G3

y = -0.0253x + 1.515 R2 = 0.917
n = 237
-1
0
1
2
0 20 40 60 80 100 120 140
log 1
0 f
requ
ency
(%
)
size (mm)
H4
y = -0.0317x + 1.6939 R2 = 0.934
n = 266
-1
0
1
2
0 20 40 60 80 100 120 140
log 1
0 fr
eque
ncy
(%)
size (mm)
H5b
y = -0.037x + 1.8101 R2 = 0.930
n = 244
-1
0
1
2
0 20 40 60 80 100 120 140
log 1
0 fr
eque
ncy
(%)
size (mm)
H6
y = -0.0361x + 1.8163 R2 = 0.962
n = 250
-1
0
1
2
0 20 40 60 80 100 120 140
log 1
0 fr
eque
ncy
(%)
size (mm)
H6b
y = -0.0408x + 1.899 R2 = 0.938
n = 211
-1
0
1
2
0 20 40 60 80 100 120 140
log 1
0 f
requ
ency
(%
)
size (mm)
H7
y = -0.054x + 2.1652 R2 = 0.900
n = 209
-1
0
1
2
0 20 40 60 80 100 120 140
log 1
0 fr
eque
ncy
(%)
size (mm)
H8
y = -0.0549x + 2.3103 R2 = 0.950
n = 277
-1
0
1
2
0 20 40 60 80 100 120 140
log 1
0 f
requ
ency
(%)
size (mm)
S7
y = -0.073x + 2.477 R2 = 0.973
n = 211
-1
0
1
2
0 20 40 60 80 100 120 140
log 1
0 f
requ
ency
(%)
size (mm)
S8
y = -0.0793x + 2.6227 R2 = 0.979
n = 248
-1
0
1
2
0 20 40 60 80 100 120 140
log 1
0 fr
eque
ncy
(%)
size (mm)
S9c
y = -0.0834x + 2.6204 R2 = 0.962
n = 220
-1
0
1
2
0 20 40 60 80 100 120 140
log 1
0 fr
eque
ncy
(%)
size (mm)
S9d


-1600
-1400
-1200
-1000
-800
-600
-400
-200
0
200
400
1920 1930 1940 1950 1960 1970 1980 1990 2000
ice-
front
dis
tanc
e fro
m o
rigin
(m)
date (AD)
Skaftafellsjökull Fjallsjökull Skálafellsjökull Fláajökull Lambatungnajökull