Embed Size (px)
Citation preview

n. 519 December 2013
ISSN: 0870-8541
The Level of CEO Compensation for the Short andLong-Term - A View on High-Tech Firms
Paula Faria1
Francisco Vitorino Martins1
Elísio Brandão1
1 FEP-UP, School of Economics and Management, University of Porto

Paula Faria [email protected]
School of Economics and Management, University of Porto
Francisco Vitorino Martins [email protected]
School of Economics and Management, University of Porto
Elísio Brandão [email protected]
School of Economics and Management, University of Porto
The level of CEO compensation for the short and long-term - a view on high-tech firms
Abstract This study examines the relationship between corporate performance and the Chief Executive Officer compensation in high-technology firms in the S&P 1500. The total CEO compensation and short and long-term compensations were tested regarding corporate performance. A panel data SUR model is estimated and describes the total compensation and cash compensation as a proportion of total pay for the period between 2000 and 2010 in high-technologies firms. The findings indicate that there is a strong and positive relation between CEO compensation and firm performance. This econometric study provides a better understanding on the relationship between CEO compensation and performance in high-technologies firms.
Keywords: corporate finance, Executive compensation, accounting
JEL classification: G30, M52, M41

2
1. Introduction
Chief Executive Officer compensation became common in the late 1970s and early 1980s and
is often discussed in the literature ever since. Following the financial crises over the world,
numerous stories have appeared in the recent financial press pointing out how many executives
define our contracts remuneration. These news and striking reports have raised concerns on
compensation. Nevertheless, in fact no consensus view has emerged, and there is still much to
learn about the determinants of CEO compensation in firms and particularly in high-technology
firms.
In high-technology firms it is possible to find innovation, R&D investments and some assets
with essential competitive advantage and there are, at the same time, some risks. Different R&D
spending in the firms is indicative of a large variance in the firms’ performance. High-tech
investment is particularly important because the returns on high-tech investment are skewed and
highly uncertain, in part because R&D projects have a low probability to succeed financially.
Another reason is the existing asymmetry in information shared between firms and potential
investors. This happens because it is difficult to increase high-tech investments and often insiders
will have much better information than outsiders about the prospects of the firm's investments.
The high-tech investments often have limited value R&D investment, which is predominantly
salary payments (Carpenter & Petersen, 2002). For these reasons, and because this subject is
pertinent, it is interesting to examine these issues and contribute to the enrichment of research in
this area, improving the understanding on CEO compensation.
Moreover, as pointed out by Makri, Lane and Gomez-Mejia to engage in innovative projects
leading to innovations, the incentive schemes play a pivotal role in inducing senior organizational
managers. Furthermore, to secure the stream of innovations a firm needs to enhance its economic
performance with a proper pay scheme to encourage executives (Makri et al., 2006). Appropriate
incentives can be the tools in many cases, however, by basing compensation on changes in
shareholder wealth. According to Graham (2012), managers often have better information than
shareholders and boards in terms of identifying investment opportunities and assessing the
profitability of potential projects. Furthermore, the fact that managers are expected to make

3
higher investment decisions explains why shareholders relinquish decision rights over their assets
by purchasing common stock (Graham et al., 2012).
This study explores the performance determinants of CEO pays for long-term and short-term
periods and points out the influence and behavior of high-tech firms. This work also attempts to
examine the systematic difference in CEO pays and the performance expectations of high-tech
firms and other firms. Furthermore, this paper examines how high-tech firms behave facing the
cash based compensations and total CEO pays related to various performance measurements. The
performance measurements pointed in this works are usually the accounting ratios of corporate
finance, such as assets and the assets growth, sales, operating income before depreciation, the net
income before extraordinary items and discontinued operations, earning per share and common
equity. This paper contributes to the under-studied empirical literature on executive compensation
for high-tech firms.
The study by Gomez-Mejia et al. (2000) was taken into consideration in this paper, especially
how they conclude that high-technology industry executives may be more rewarded for
innovation activity than for financial firm performance. The executive incentives induce higher
risk and cannot bear the financial risk associated as a consequence of those actions (Gomez-Mejia
et al., 2000).
In 1990, Jensen and Murphy wrote that it is possible that CEO bonuses are strongly tied to an
unexamined and/or unobservable measurement of performance. When they refer to the swings in
CEO pay from year to year, they explain that the large swings are consistent with the existence of
an overlooked and yet important performance measurement, and that that increase suggests that
CEO pay is essentially unrelated to all relevant performance measurements (Murphy, 1999,
Jensen & Murphy, 1990, Jensen & Murphy, 1990b).
The purpose of this study is to investigate the relation between the CEO pay and the
performance against high-technologies firms with the balance cash compensation and total
compensation. The combination of salary, incentives and bonuses is often referred to as cash
compensation for executives. The CEO behavior is different when we think in short-term and
long-term periods. The main goal of this paper is to provide a broader perspective on the

4
relationship between CEO pay and firm performance and on how high-technology can improve
that performance.
This work is organized as follows: Section 2 contains a revision of the main theories in the
literature, as well as an analysis on executive compensation in order to address agency problems.
Furthermore, this section provides an analysis which examines the appropriate measurements for
corporate financial performance in high-technology firms. Section 3, explains the research
hypotheses and section 4 presents the methodology, sample and data collection for the regression
estimation, as well as the results of the econometric model to assess the influence that firm
performance has on executive compensation. Lastly, the main conclusions are discussed, as well
as some limitations and new perspectives for future research.
2. Executive compensations to address agency problems
The general acceptance of the agency theory and the parallel research on executive
compensation began in the early 1980s. It was the evolution of the modern corporation with
ownership separation and control that undermined the agency theory. Early studies in this area
focused on documenting the relation between CEO pay and firm performance. The discussion of
executive compensation must proceed with the fundamental agency problem afflicting
management decision-making as background. According to Jensen and Murphy (1990), there are
two approaches to agency problems. The authors state that there is an optimal contracting
approach, which is when boards use design compensation schemes to maximize shareholder
value with efficient incentives (Jensen & Murphy, 1990). To connect the agency problem and the
executive compensation, the authors use the managerial power approach, when this connection is
seen as an integral part of the agency problems. It is important to remember that the principal-
agent problems treat the difficulties that arise under conditions where information is incomplete
and asymmetric whenever a principal hires an agent (Murphy, 1999, Eisenhardt, 1989; Bebchuk
& Fried, 2003). Furthermore, the agency theory aims at solving two problems that can occur in
agency relationships. The first is the desires or goals of the principal and agent conflict and it is
difficult or expensive for the principal to verify what the agent is actually doing. The problem is
that the principal is unable to check if the agent has behaved correctly. Secondly, it is the

5
problem of risk sharing facing the different attitudes toward risk, because the principal and the
agent have different actions according to different risk preferences (Eisenhardt, 1989).
Hall and Lienbman (1998) argue that the solution to the agency problem is aligning the
incentives of executives with the interests of shareholders by granting (or selling) stock and stock
options to the CEOs. The CEOs have the correct incentives on every margin, including effort,
perquisites and project choice, and support that the optimal contract is a one-to-one
correspondence between firm value and CEO pay (Hall & Liebman, 1998). It is reasonable for
small firms but it is not appropriate for large firms because optimal contracts represent a trade-off
between incentives and risk-sharing (Eisenhardt, 1989). In their work Hall and Lienbman (1998)
conclude that the relationship between pay and performance is much larger than has previously
been recognized, and that this includes both gains and losses in CEO wealth. The salary and
bonus vary so little because corporate board members are often reluctant to reduce CEO pay,
even in response to poor performance and that may attract unwanted media attention. Using
salary and bonuses to reward and penalize CEOs may only be possible to create high-powered
incentives that align CEO pay with shareholder objectives (Hall & Liebman, 1998). A large part
of the executive pay literature argues that compensation and managerial interests should be
aligned with shareholder interests in order to solve agency problems (see, for example, the
surveys by (Murphy, 1999) and by (Core et al., 2003a)).
Some authors see the weakness of shareholder rights more generally and warn shareholders
and their advisers to focus on the corporate governance provisions that really matter for the
firm’s value (Bebchuk et al., 2009, Cremers & Nair, 2005). Others assume CEOs to be more
powerful when they serve as chair of the board, when they are the only member of the board, and
when they have the status of a founder (Adams et al., 2005).
Managers in high-technology firms have different goals than others sectors managers, such as
managing intangible assets, continuous improvement, and software and product development. As
a result, they must continuously innovate and sustain growth in an increasingly competitive and
global market (Shim et al., 2009).

6
2.1 Appropriate measurements of corporate financial performance in high-technology firms
This chapter provides an analysis on the different forms of measuring the firm’s performance
and how these engage to the level of CEO pay. The behavior of high-tech firms and its
contribution to CEO compensation for the short and long-term are also analyzed. Shim (2009)
argues that it is possible to confirm that the success of high-tech firms depends more on
managing intangible assets. Some of these assets are technology innovation, continuous
improvement, software development and knowledge-based management. High-tech firms must
continuously innovate to survive and to sustain their growth (Shim et al., 2009).
Equity-based compensation is widely documented in the research examining pay versus
performance (Jensen & Meckling, 1976). Murphy (2003) and Jensen (2004) state that the
increase in stock options pay is the result of the boards’ inability to evaluate the true cost of this
form of compensation. The use of equity-based compensation is encouraged by all stakeholders,
such as investors, regulators and academics. The controversy over CEO compensation reflects a
perception that CEOs effectively set their own pay levels. In most companies, the last decisions
over executive pay are made by members outside the board of directors who are keenly aware of
the conflicts of interest between managers and shareholders over the level of pay. However, the
CEOs and other top managers exert at least some influence on the level and on the structure of
their pay (Murphy, 1999).
In recent years, the use of restricted stocks in compensation executives has increased and has
been widely criticized when these executives received dividend equivalents on restricted stocks
before the vesting period. Agency cost benefits of dividend equivalent rights argue that this
practice helps executives focus on the business, and rewards them for managing the business to
produce cash. Therefore, this is encouraged because it is a way of distributing dividends by
shareholders (Akpotaire, 2011).
Restricted stock awards are profitable for executives because the income tax consequences can
be more favorable to employees than stock options. The special case of the USA and the
consequences of a restricted stock mean that in some cases the award can be structured to allow
for the deferral of all tax until the time of the stock sale, and for all appreciation to be taxed at

7
capital gain rates, even if the stock is appreciated prior to vesting. In contrast, stock options can
result in ordinary income to the recipient the stock has appreciated prior to vesting, with only the
post-exercise appreciation deferred to the time of sale at capital gains rates. Furthermore, the
preferred stock usually carries no voting rights but may carry a dividend and may have priority
over common stock in the payment of dividends and upon liquidation. The preferred share
investor is entitled to a preset rate of dividend that must be paid out of earnings before any
dividends are distributed to common shareholders. These dividends receive favorable tax
treatment relatively to other forms of income.
Earnings per share (EPS) are a popular performance metric used in executive compensation
contracts (Murphy 1999, 2000). As it is commonly known, this ratio is influenced and directly
punished by the increase in restricted stocks and dividend equivalents. Compensation contracts
that tie managerial rewards to EPS create explicit incentives for executives to manage the EPS.
Young and Jing (2011) argue that there is a net benefit to shareholders in executive compensation
contracts when they use stock repurchases by EPS targets (Young & Jing, 2011). Additionally, if
stock options are a sub-optimal incentive contract, Sesil et al. (2006) expect that, in terms of firm
performance, there will be a decrease in earnings or an increase in earnings with a reduction in
the rate of return on assets (Sesil et al., 2006).
The use of options at the executive level associated with an increase in performance is not
clear in the literature. Some argue that it is associated with a higher profit and output (Core et al.,
2003a), while others state the opposite (Hall & Murphy, 2003). The use of stock options reduces
the agency cost and incentive to maximize value creation for shareholders, and encourages risk
taking, then accounting is shown by measuring corporate finance (Sesil et al., 2006). They argue
that adopting stock options has an impact on firm financial performance to increase operating
income (OI) and investments in assets. However, there will be a significant decrease in return on
assets (ROA). Others who have done previous research on stock options have focused on pay-
for-performance elasticity (Hall & Murphy, 2003), while others have focused more on the
determinants of share-based adoption (Core et al., 2003a). The adoption of stock options is
associated to higher growth in income, but to significantly lower return on assets (ROA), which
is evidence that options promote sub-optimal over investment.

8
The company’s measurements are consistent with vision, mission and strategies for long-term
performance and the financial criteria to monitor CEO compensation (Epstein & Roy, 2005).
Usually in the USA, the compensation programs combine incentives for short and long-term
periods with a set of performance measurements.
In summary, it was found that firms are subjected to the agency problem in which the CEO
may not work in favor of the shareholders to maximize their wealth by improving firm
performance. Furthermore, the decisions related to CEO compensation are based on the firms’
accounting and finance performance. Therefore, it is theorized that CEO compensation according
to firm performance using variables such as assets, return on assets, sales growth, operating
income before depression and earning per share suited the high-technology firms, as presented
above.
3. Research hypotheses
Some possibilities have been identified to find some relations with pay compensation and to
understand how it is possible to improve firm performance and in turn the shareholder wealth. As
previously discussed, existing theories provide predictions on the outlined considerations related
to firm performance, allowing for two different selection hypotheses.
The first research question will be: The CEO compensation for the long-term is determinant
and positively correlated with firm performance. High-technology companies support and
enhance this evidence. Rejecting the null hypothesis would mean that the relative weight in
terms of total compensation of each compensation component (such as salary, bonus, stock
options and other compensations) are different goals for executives, as opposed to performance
for the short-term. It is possible that high value firms have CEOs interested in long-term
performance and in obtaining personal benefits in terms of total compensation. It might be argued
that powerful incentive models are especially valuable for high value firms with high
opportunities for growth that need to be decisively and vigorously pursued. It might also be that
high value firms are especially likely to attract star CEOs and pay gold parachutes. The second
question will be: The CEO compensation for the short-term is determinant and positively
correlated with firm performance. With less intensity and yet more persistent than long-term

9
compensation, bonuses and salary are determinant and in the same effect related to accounting
performance.
4. Methodology, sample and data collection
The chosen database was the ExecuComp, which was used to find the variables and to create a
sample of firms between 2000 and 2010. The ExecuComp database provides yearly data on
salary, bonus, stock option and restricted stock grants, as well as managerial stock and option
holdings for top executives in firms within the Standard & Poor’s Index (S&P 1500). To test this
hypothesis, the following specification is run on the balanced panel of high-technology firms.
High-Technology firms are the firms that operate in an industry with a four-digit SIC code of
3570, 3571, 3572, 3576, 3577, 3661, 3674, 4812, 4813, 5045, 5961, 7370, 7371, 7372, or 7373,
using the Fama and French classification of 48 industry groups, instead of four-digit Standard
Industrial Classification (SIC) codes (Fama & French, 1997). According to Lucian A. Bebchuk,
Martijn Cremers and Urs Peyer (2011), in order to test the variables and to assess the
abovementioned research hypotheses there are independent variables that will possibly be used
by the regression model to perform the estimation. The total compensation is analyzed depending
on some firm performance metrics.
At an empirical level, this analysis focuses on a sample of 1500 high-tech companies in the
Standard & Poor's (stock market index based on the common stock prices) index (S&P1500), for
the period between 2000 and 2010, which constitutes a sample of 15265 observations. The
ExecuComp database collects information on seven independent variables – Total assets
(ASSETS) and percentage change of assets (ASSETSCHG), total annual net sales (SALES),
operating income before depreciation (OIBD), net income before extraordinary items (NIBEX),
earning per share (EPSEX), return on assets (ROA) – and independent total compensation
(TOTAL_COMP) and cash compensation (CASH) variables are listed by each year and
company. Several measurements were used in this study, such as control variables. These include
assets, increase in sales, the net Income and the earning per share, as a proxy of firm size, firm
performance and shareholder wealth, the common predictors of executive pay. The two primary
measurements of CEO pay were used. The short-term compensation consisted of annual salary

10
and bonus, which represents the total cash compensation received during a specific year. Annual
salary and bonus for 2000 and 2010 (in thousands of dollars) were taken from the ExecuComp
data set. The long-term compensation represents the equity-based compensation of a CEO, as
reported by Frydman, C (2008). As she reported in the case study of General Electric, salary and
bonus are defined as the level of salaries and current bonuses, both awarded and paid out during
the year. Long-term bonus measures the amount paid out during the year according to long-term
bonuses awarded in prior years. Total compensation is the sum of salary, bonus, long-term bonus
and the Black–Scholes value of stock options granted (Frydman, 2009).
The table below identifies the variables that were used, including their definitions,
measurement units and the expected signs, as reported by the theory. Table1 – Executive compensation dependent and independent variables
Name Expected variation Definition Units
Ln (TOTAL_COMP) (+) Ln (the sum of the compensations of top executives includes: Salary, Bonus, Non-Equity Incentive Plan Compensation, Grant-Date Fair Value of Option Awards, Grant-Date Fair Value of Stock Awards, Deferred Compensation Earnings Reported as Compensation, and Other Compensations).
Thousands
Ln(CASH) (+) Ln (SALARY + Bonus) The dollar value of the base salary plus bonus earned by the named executive officer during the fiscal year.
Thousands
Ln (ASSETS) (+) Ln (the Total Assets as reported by the company). Millions ASSETCHG (+) The year to year percentage change in Total Assets. Percentage ROA (+) The Net Income Before Extraordinary Items and
Discontinued Operations divided by Total Assets. This quotient is then multiplied by 100.
Percentage
Ln(COMMEQ) (+) The sum of Common Stock, Capital Surplus, Retained Earnings, and Treasury Stock adjustments.
Millions
EPSEX (-) Earnings per Share (Primary) Excluding Extraordinary Items and Discontinued Operations.
(OIBD/ASSETS)*100 (+) Ln (the Operating Income Before Depreciation as reported by the company/Assets).This quotient is then multiplied by 100.
Percentage
Ln(NIBEX) (+) Ln (the Net Income Before Extraordinary Items and Discontinued Operations).
Millions
Ln(SALES) (+) Ln (The Net Annual Sales as reported by the company). Millions SIC Standard Industrial Classification Code. SPCODE (+) and (-
) Current S&P Index membership "SP" = S&P 500 "MD" = S&P Midcap Index "SM" = S&P Small cap Index "EX" = not on a major S&P Index
11
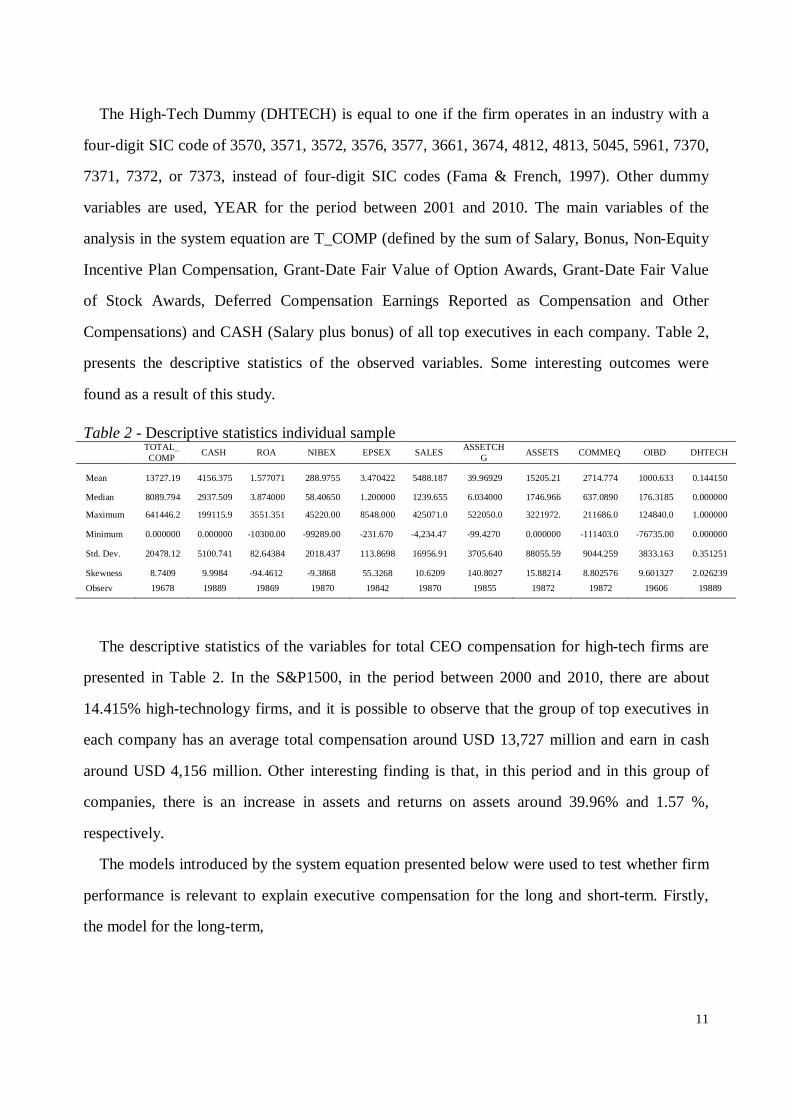
The High-Tech Dummy (DHTECH) is equal to one if the firm operates in an industry with a
four-digit SIC code of 3570, 3571, 3572, 3576, 3577, 3661, 3674, 4812, 4813, 5045, 5961, 7370,
7371, 7372, or 7373, instead of four-digit SIC codes (Fama & French, 1997). Other dummy
variables are used, YEAR for the period between 2001 and 2010. The main variables of the
analysis in the system equation are T_COMP (defined by the sum of Salary, Bonus, Non-Equity
Incentive Plan Compensation, Grant-Date Fair Value of Option Awards, Grant-Date Fair Value
of Stock Awards, Deferred Compensation Earnings Reported as Compensation and Other
Compensations) and CASH (Salary plus bonus) of all top executives in each company. Table 2,
presents the descriptive statistics of the observed variables. Some interesting outcomes were
found as a result of this study.
Table 2 - Descriptive statistics individual sample
TOTAL_COMP CASH ROA NIBEX EPSEX SALES ASSETCH
G ASSETS COMMEQ OIBD DHTECH
Mean 13727.19 4156.375 1.577071 288.9755 3.470422 5488.187 39.96929 15205.21 2714.774 1000.633 0.144150
Median 8089.794 2937.509 3.874000 58.40650 1.200000 1239.655 6.034000 1746.966 637.0890 176.3185 0.000000
Maximum 641446.2 199115.9 3551.351 45220.00 8548.000 425071.0 522050.0 3221972. 211686.0 124840.0 1.000000
Minimum 0.000000 0.000000 -10300.00 -99289.00 -231.670 -4,234.47 -99.4270 0.000000 -111403.0 -76735.00 0.000000
Std. Dev. 20478.12 5100.741 82.64384 2018.437 113.8698 16956.91 3705.640 88055.59 9044.259 3833.163 0.351251
Skewness 8.7409 9.9984 -94.4612 -9.3868 55.3268 10.6209 140.8027 15.88214 8.802576 9.601327 2.026239 Observ 19678 19889 19869 19870 19842 19870 19855 19872 19872 19606 19889
The descriptive statistics of the variables for total CEO compensation for high-tech firms are
presented in Table 2. In the S&P1500, in the period between 2000 and 2010, there are about
14.415% high-technology firms, and it is possible to observe that the group of top executives in
each company has an average total compensation around USD 13,727 million and earn in cash
around USD 4,156 million. Other interesting finding is that, in this period and in this group of
companies, there is an increase in assets and returns on assets around 39.96% and 1.57 %,
respectively.
The models introduced by the system equation presented below were used to test whether firm
performance is relevant to explain executive compensation for the long and short-term. Firstly,
the model for the long-term,

12
Ln (T_COMP)ij = b11+ b12*ln(ASSETS) ij + b13*ASSETCHG ij + b14*ROAij+b15*ln(OIBD/ASSETS*100)ij+
b16*ln(SALES) ij +b17*ln(NIBEX)ij + +b18*ERPSEX ij +b19*SPCODE ij + b10*DHTECH ij+
b31*ln(COMMEQ)ij+∑ ∂j ∗ Yearj + uij
(1)
and for the short-term
Ln (CASH)ij = b21+ b22*log(ASSETS) ij + b23*ASSETCHG ij + b24*ROA ij + b25*ln(OIBD/ASSETS*100)ij +
b26*ln(SALES) ij +b27*ln(NIBEX)ij + b29*SPCODE ij + b20*DHTECH ij+ b32*ln(COMMEQ)ij+∑ ∂j ∗ Yearj
+ vij
(2)
Where, i and j represent the year and the company, respectively. The coefficients b11 and b21
are constants denoting the base level from which the sum of the compensations of top executive
varies according to the changes in performance variables.
The panel data model is used because it is the most suitable way of studying a large set of
repeated observations and due to the fact that it assesses evolution over time. With panel data it is
possible to simultaneously explore several variations over time and between different individuals.
The use of such models has increased immensely and, in fact, combining time and cross-sectional
data brings many advantages: it is possible to use a larger number of observations and the degree
of freedom in estimates increases, thus making statistical inferences more credible. At the same
time, the risk of multicollinearity is reduced since the data in companies present different
structures. Moreover, this model provides access to further information and the efficiency and
stability of the estimators increase, while enabling the introduction of dynamic adjustments
(Greene William, 2002 and Gujarati, 2000).

13
Table 3 Results of the total compensation and cash compensation estimations using the SUR method (regressions with SIC code dummy (DHTECH) for high-technology companies – econometric models)
Ln (TOTAL_COMP) Coefficient Prob. Ln (CASH) Coefficient Prob. constant 6,022018 0.0000 constant 5.941700 0.0000
Ln(ASSETS) 0.072140 0.0000 Ln(ASSETS) 0.123158 0.0000
ASSETCHG 0.001383 0.0000 ASSETCHG 0.000403 0.0000
ROA 0.000859 0.1045 ROA 0.000798 0.0385
OIBD/ASSETS*100 0.007541 0.0000 OIBD/ASSETS*100 0.003945 0.0000
Ln(SALES) 0.143398 0.0000 Ln(SALES) 0.135561 0.0000
Ln(NIBEX) 0.111439 0.0000 Ln(NIBEX) 0.053986 0.0000
EPSEX -0.000400 0.0000 -
SPCODE=SP 0.057757 0.0001 SPCODE=SP -0.046676 0.0000
SPCODE=SM -0.167486 0.0000 SPCODE=SM -0.016045 0.1047
DHTECH 0.313173 0.0000 DHTECH 0.011091 0.3353
Ln (COMMEQ) 0.112421 0.0000 -
2001 0.010864 0.6572 2001 -0.028642 0.1061
2002 -0.045589 0.0611 2002 0.051824 0.0033
2003 -0.051240 0.0290 2003 0.107735 0.0000
2004 0.021421 0.3570 2004 0.152258 0.0000
2005 0.018350 0.4379 2005 0.134210 0.0000
2006 -0.007390 0.7480 2006 -0.242996 0.0000
2007 0.045311 0.0495 2007 -0.306410 0.0000
2008 0.051967 0.0328 2008 -0.301458 0.0000
2009 0.044238 0.0698 2009 -0.283819 0.0000
2010 0.151203 0.0000 2010 -0.304708 0.0000
R-squared 0.565742 R-squared 0.547052
Adjusted R-squared 0.565137 Adjusted R-squared 0.546487
S.E. of regression 0.624388 S.E. of regression 0.455708
Durbin-Watson stat 0.950250 Durbin-Watson stat 0.682381
Operations, growth sales, as reported by this sample, are positive and significantly related to
total executive The system equation presented was estimated using the Seemingly Unrelated
Regression (SUR) method. The SUR is a generalization of a linear regression model that consists
of several regression equations, each having its own dependent variable and potentially different
sets of exogenous explanatory variables. The main motivations for using the SUR are: improving
estimation efficiency by combining information on different equations; and imposing and testing
restrictions that involve parameters in different equations. The model can be estimated to each
equation considering the interdependence of distribution (SUR). The SUR model can be further
generalized into the multiple regressions, where the regressor on the right-hand side can also

14
function as endogenous variables. The multiple-equation model is a system of equations where
the assumptions made for the single-equation model apply to each equation. The regression
coefficient, year, does not vary over time because the estimation was conducted using dummy
variables for year, and assuming that the company’s heterogeneity is captured in the constant
part. (Greene, William, 2002).
The first hypothesis for the positive influence of CEO compensation on firm performance is
presented in appendix Table 3.As it is possible to observe the regressions are globally significant,
with a 5% significance level. The following table presents the results of the estimation for the
studied data.
The statistics are computed based on a panel data set of 1500 firm-year observations, a total of
about 15625 companies that represent 14.415% of high-technology firms between 2000 and
2010, and represent around 31.31% in long-term compensation. Other financial performance
measurements such as total assets, operating income before depreciation, net income before
Extraordinary Items and Discontinued and cash compensations. It is important to highlight that
around 56.57% (R2 = 0.5657) and 54.7% (R2 = 0.547) of the variance in degree of CEO
compensation for each equation, respectively, can be explained by the group of variables (see
Table 3). These indicate that variables addressed here play a significant role in explaining
executive compensation for short and long-term periods as stated by Chi-Square test (p-value=0).
In the table 3, the coefficient signs are similar in both specifications. However, the magnitudes
of the coefficients are sensitive to the specification. As expected, earnings per share are negative
and significantly related to total compensation for the long-term. This indicates that there are no
explicit contractual arrangements linking compensations and earnings per share. The
performance ratio of firms measured by return has a negative influence on CEO Compensation
(Young & Jing, 2011, Core et al., 2003b).
A positive and statistically significant relationship was found between sales, asset growth and
return on assets and for adding the same level of total CEO compensation and cash compensation
(Gabaix & Landier, 2008) also empirically test the relation between the level of pay and firm
size. Log (assets), a variable proxy for firm size is positively related to pay with a coefficient
total compensation and cash compensation in the regression. When the adjustment is performed

15
for the long-term compensation, it is possible to understand that when firm sizes are compared
using the denominated current S&P index membership, S&P500 firms have an increase around
5.7% and for the S&P small caps 600 there is a decrease around 16.7%, comparatively to the
S&P Midcaps 400 firms. In terms of cash compensation, the S&P 500 firms are 4.7% below
midcaps, and the S&P small caps 600 firms are 1.6% below, comparatively to the same group of
S&P Midcaps 400 firms. Another finding is that the influences on CEO pay for the short-term
between the year 2006 and 2008does not have the same meaning in long-term compensations.
There is an increase around 5% for each year between 2007 and 2010, as opposed to the year
2000.Furthermore, there is a decrease of about 30% in short-term incentives for the same period
comparatively to the year 2000, which was possibly influenced by the beginning of the financial
crisis, and it is not reflected in the long-term incentives. As Henry et al. (2011) suggest, CEO
compensation increases the probability of effective internal controls after the Sarbanes–Oxley
Act of 2002 (Henry et al., 2011). Moreover, as expected, the increase in financial performance
measurements such as operating income before depreciation/assets and net income have a double
impact on the increase in long-term compensation that is more positive than the increase in short-
term compensations.
5. Conclusion and future research
This paper will contribute to a better understanding on the relationship between compensation
and performance in high-technology firms, something which is often discussed in the literature.
The main purpose of this study was to examine whether the total compensation paid to CEOs in
high-technology firms in the S&P 1500 is related in corporate finance. This work aims at
contributing to explain the influence that performance has on CEO compensation for short and
long-term periods in these group of companies. It was found that there is a strong and positive
relation between CEO compensation and firm performance.
In conclusion, according to the results that were obtained there is empirical evidence to state
that high-technology firms in the S&P1500, during the period between 2000 and 2010, have
contributed to increases in total CEO compensation for short and long-term periods, together with
accruals of financial performance measurements. Results suggest that high-tech firms tend to use
16
more sophisticated performance measurements to determine CEO compensation. The method use
here has potential implications in finance and accounting, for instance, where it is preferable to
separately capture the specific effects of firm and performance.
However, this work is not without limitations. This study focuses only on high-technology
firms in the S&P 1500 in the period between 2000 and 2010. The definition of high-technology
used in this study can be extended as performed by Shim et al. (2009), and other important item
measurements should be included, such as value of R&D expenditures, number of patents by firm
and citation of patents (Gomez-Mejia et al., 2000, Shim et al., 2009). The level of R&D
expenditures and new product introductions are viewed as proxies for innovation, risk-taking and
long-term decision-making, which are crucial to characterize high-technology firms.
Furthermore, innovation constitutes an indispensable component of corporate strategies. For
these reasons, the results of this study may not be generalized by other sectors due the specificity
of the high-tech firms.
In the future, it will be important to analyze other developments, such as the effect of
managerial attributes for the short and long-term in executive compensation (Graham et al.,
2012). Furthermore, it will also be important to desegregate the data sample for the period
between 2000 and 2010 in order to broaden the period of analysis and to investigate the effect of
the USA financial crisis, which started in 2007, and to understand the effectiveness of internal
control structures under Sarbanes–Oxley Act of 2002 (SOX, Section 404) before and after
implementation.
6. References
Adams, R. B., Almeida, H., & Ferreira, D. (2005). Powerful CEOs and Their Impact on
Corporate Performance. Review of Financial Studies, 18(4), 1403-1432.
Akpotaire, B. U. (2011). Agency Cost Problems in Executive Compensation: An Evaluation of
Dividend Equivalent Rights on Restricted Stocks. Social Science Research Network.
Bebchuk, L. A., & Fried, J. M. (2003). Executive Compensation as an Agency Problem. National
Bureau of Economic Research Working Paper Series, No. 9813

17
Bebchuk, L. A. & Jesse, M. F. "Executive Compensation As An Agency Problem," Journal of
Economic Perspectives, 2003, v17 (3, Summer), 71-92.
Bebchuk, L., Cohen, A., & Ferrell, A. (2009). What Matters in Corporate Governance? Review
of Financial Studies, 22(2), 783-827.
Carpenter, Robert E., & Petersen, Bruce C. (2002). Capital market imperfections, high-tech, and
new equity financing. The Economic Journal, 112(477), F54-F72.
Core, J. E., Guay, W. R., & Larcker, D. F. (2003). Executive Equity Compensation and
Incentives: A Survey. Economic Policy Review, Vol. 9, No. 1, April 2003.
Core, J. E., Guay, W. R., & Verrecchia, R. E. (2003a). Price versus Non‐Price Performance
Measures in Optimal CEO Compensation Contracts. The Accounting Review, 78(4), 957-981
Cremers, K. J. M., & Nair, V. B. (2005). Governance Mechanisms and Equity Prices. The
Journal of Finance, 60(6), 2859-2894.
Eisenhardt, K. M. (1989). Agency Theory: An Assessment and Review. The Academy of
Management Review, 14(1), 57-74.
Epstein, M. J., & Roy, M. (2005). Evaluating and monitoring CEO performance: evidence from
US compensation committee reports. Corporate Governance, 5(4), 75 - 87.
Fama, E. F., & French, K. R. (1997). Industry costs of equity. Journal of Financial Economics,
43(2), 153-193.
Frydman, C. (2009). Learning from the Past: Trends in Executive Compensation over the 20th
Century. CESifo Economic Studies, 55(3-4), 458-481.
Gabaix, X., & Landier, A. (2008). Why has CEO Pay Increased So Much? The Quarterly Journal
of Economics, 123(1), 49-100.
Gomez-Mejia, L. R, Gideon, D. M., & Balkin, D. B. (2000). Is CEO Pay in High-Technology
Firms Related to Innovation? The Academy of Management Journal, 43(6), 1118-1129.
Graham, J. R., Li, S., & Qiu, J.. (2012). Managerial Attributes and Executive Compensation.
Review of Financial Studies, 25(1), 144-186.
Hall, B. J., & Murphy, K. J. (2003). The Trouble with Stock Options. Journal of Economic
Perspectives, 17(3), 49-70.

18
Hall, B. J., & Liebman, J. B. (1998). Are CEOS Really Paid Like Bureaucrats?. Quarterly Journal
of Economics, 113(3), 653-691.
Henry, T. F., Shon, J. J., & Weiss, R. E. (2011). Does executive compensation incentivize
managers to create effective internal control systems? Research in Accounting Regulation,
23(1), 46-59.
Jensen, M., & Meckling, W. (1976). Theory of the firm: managerial behaviour, agency costs, and
ownership structure. Journal of Financial Economics (3), 308-360.
Jensen, M. C., & Murphy, K. J. (1990). Performance Pay and Top-Management Incentives.
Journal of Political Economy, 98(2), 225-264.
Jensen, M. C., & Murphy, K. J. (1990b). CEO Incentives: Itʼs Not How Much You Pay, But
How. Harvard Business Review 3, 138-153.
Makri, M., Lane, P. J., & Gomez-Mejia, L. R. (2006). CEO incentives, innovation, and
performance in technology-intensive firms: a reconciliation of outcome and behavior-based
incentive schemes. Strategic Management Journal, 27(11), 1057-1080.
Murphy, K. J. (1999). Chapter 38, Executive compensation. In C. A. Orley & C. David (Eds.),
Handbook of Labor Economics (Volume 3, Part 2, pp. 2485-2563):
Sesil, J., Lin, Y., & , Steven M. (2006). Stock Option Adoption and Irrational Exuberance: The
Impact On Profitability. working papers series
Shim, D, Lee, J., & Joo K. (2009). CEO Compensation and US High-tech and Low-tech Firms’
Corporate Performance. Contemporary Management Research, Vol. 5, 93-106.
Young, S, & Jing, Y. (2011). Stock Repurchases and Executive Compensation Contract Design:
The Role of Earnings per Share Performance Conditions. Accounting Review, 86(2), 703-733.

Editorial Board ([email protected])Download available at: http://wps.fep.up.pt/wplist.php
also in http://ideas.repec.org/PaperSeries.html
20