Embed Size (px)
Citation preview

The leading European entertainment network

● Q3 2011 RESULTS
○ Business Review
○ Strategy update
Agenda
1
RTL Group
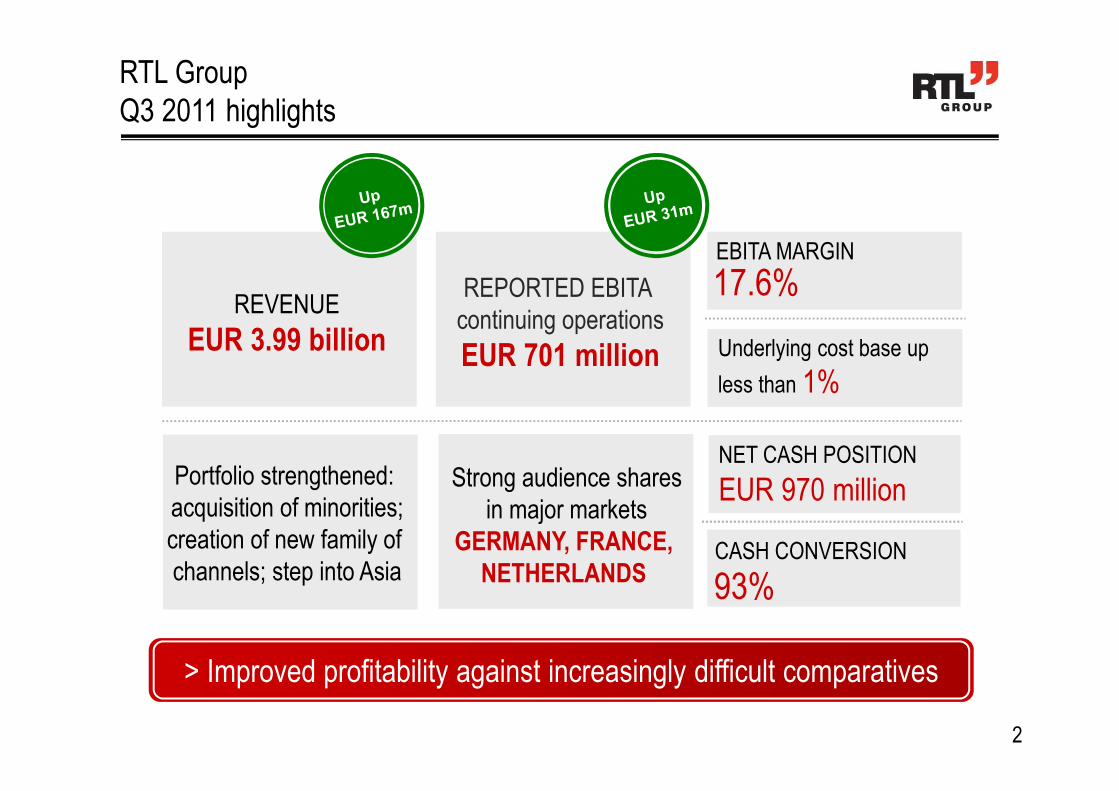
Q3 2011 highlights
Strong audience shares
in major markets
GERMANY, FRANCE,
NETHERLANDS
REVENUE
EUR 3.99 billion
REPORTED EBITA
continuing operations
EUR 701 million
Portfolio strengthened:
acquisition of minorities;
creation of new family of
channels; step into AsiaCASH CONVERSION
EBITA MARGIN
NET CASH POSITION
EUR 970 million
17.6%
93%
> Improved profitability against increasingly difficult comparatives
2
Underlying cost base up
less than 1%
○ Q3 2011 results
● BUSINESS REVIEW
○ Strategy update
Agenda
3
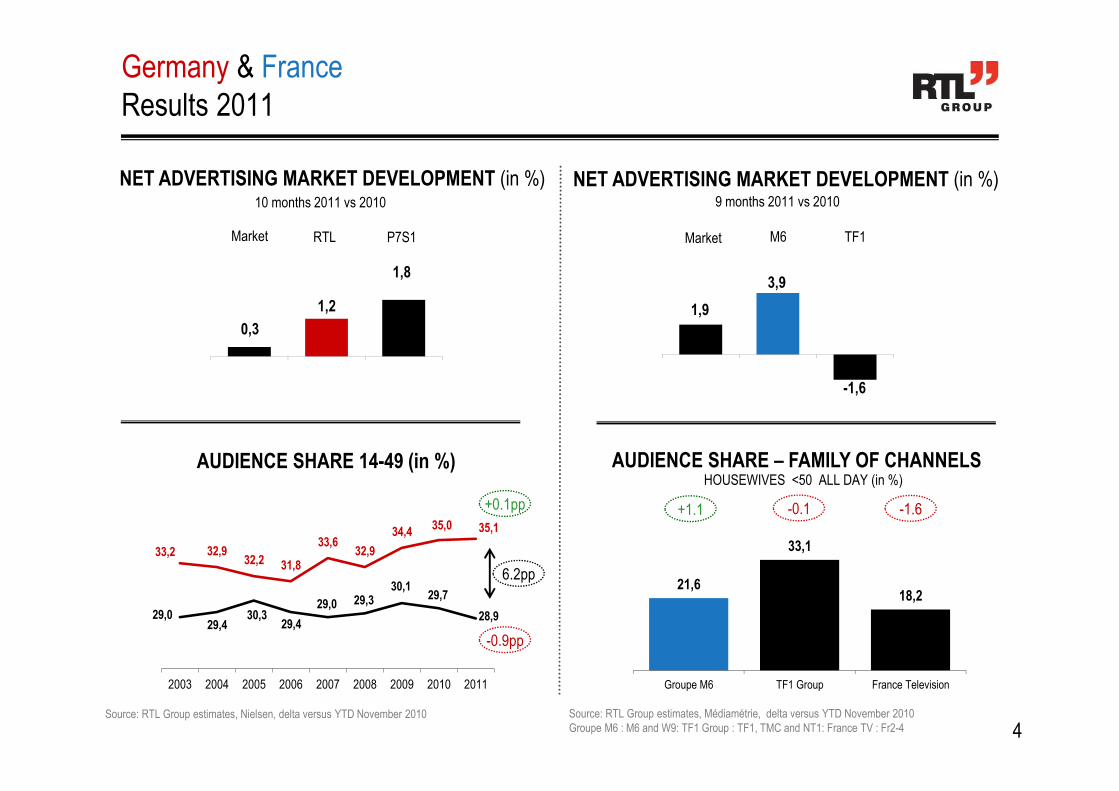
NET ADVERTISING MARKET DEVELOPMENT (in %)
Source: RTL Group estimates, Médiamétrie, delta versus YTD November 2010
Groupe M6 : M6 and W9: TF1 Group : TF1, TMC and NT1: France TV : Fr2-4
Germany & France
Results 2011
1,9
3,9
-1,6
M6 TF1Market
4
AUDIENCE SHARE 14-49 (in %)
NET ADVERTISING MARKET DEVELOPMENT (in %)10 months 2011 vs 2010
0,3
1,2
1,8
RTL P7S1Market
33,2 32,932,2 31,8
33,632,9
34,435,0 35,1
29,029,4
30,329,4
29,0 29,330,1
29,7
28,9
2003 2004 2005 2006 2007 2008 2009 2010 2011
21,6
33,1
18,2
Groupe M6 TF1 Group France Television
AUDIENCE SHARE – FAMILY OF CHANNELS HOUSEWIVES <50 ALL DAY (in %)
Source: RTL Group estimates, Nielsen, delta versus YTD November 2010
+1.1 -0.1 -1.6
9 months 2011 vs 2010
+0.1pp
-0.9pp
6.2pp
FremantleMedia
Half year Results 2011
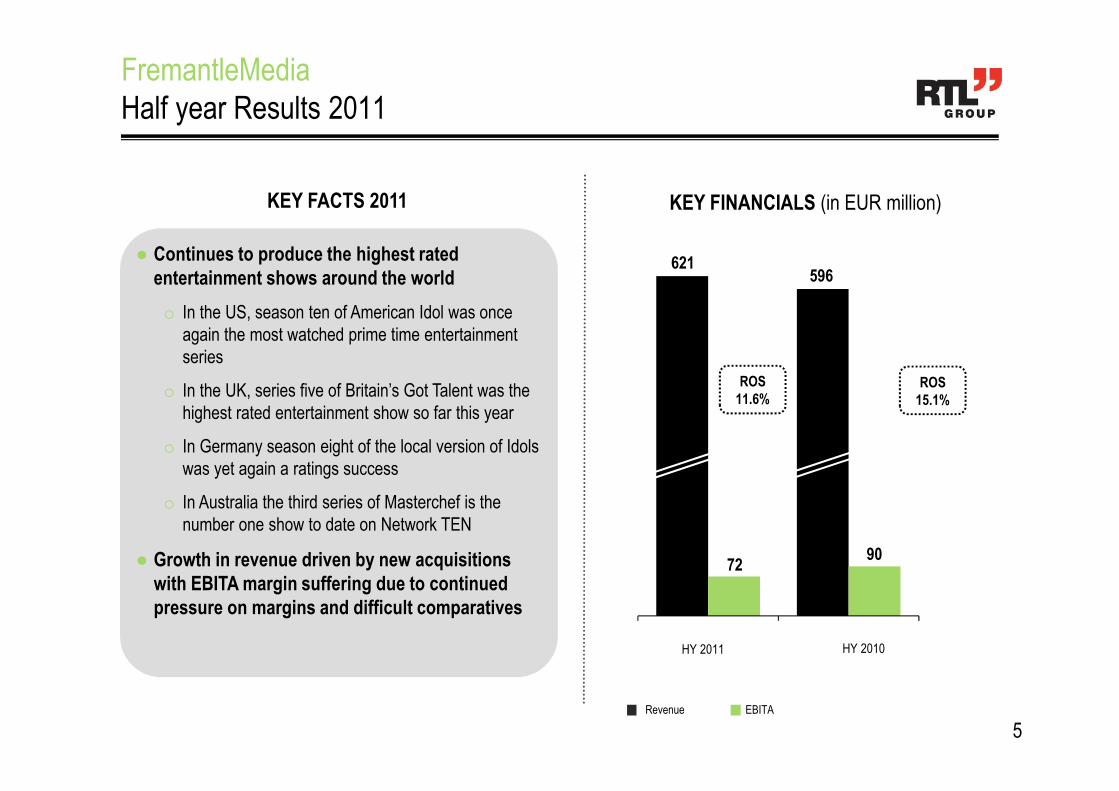
KEY FACTS 2011 KEY FINANCIALS (in EUR million)
596621
HY 2011 HY 2010
9072
● Continues to produce the highest rated
entertainment shows around the world
o In the US, season ten of American Idol was once
again the most watched prime time entertainment
series
o In the UK, series five of Britain’s Got Talent was the
highest rated entertainment show so far this year
o In Germany season eight of the local version of Idols
was yet again a ratings success
o In Australia the third series of Masterchef is the
number one show to date on Network TEN
● Growth in revenue driven by new acquisitions
with EBITA margin suffering due to continued
pressure on margins and difficult comparatives
Revenue EBITA
ROS
15.1%
ROS
11.6%
5

FremantleMedia is known for…
6
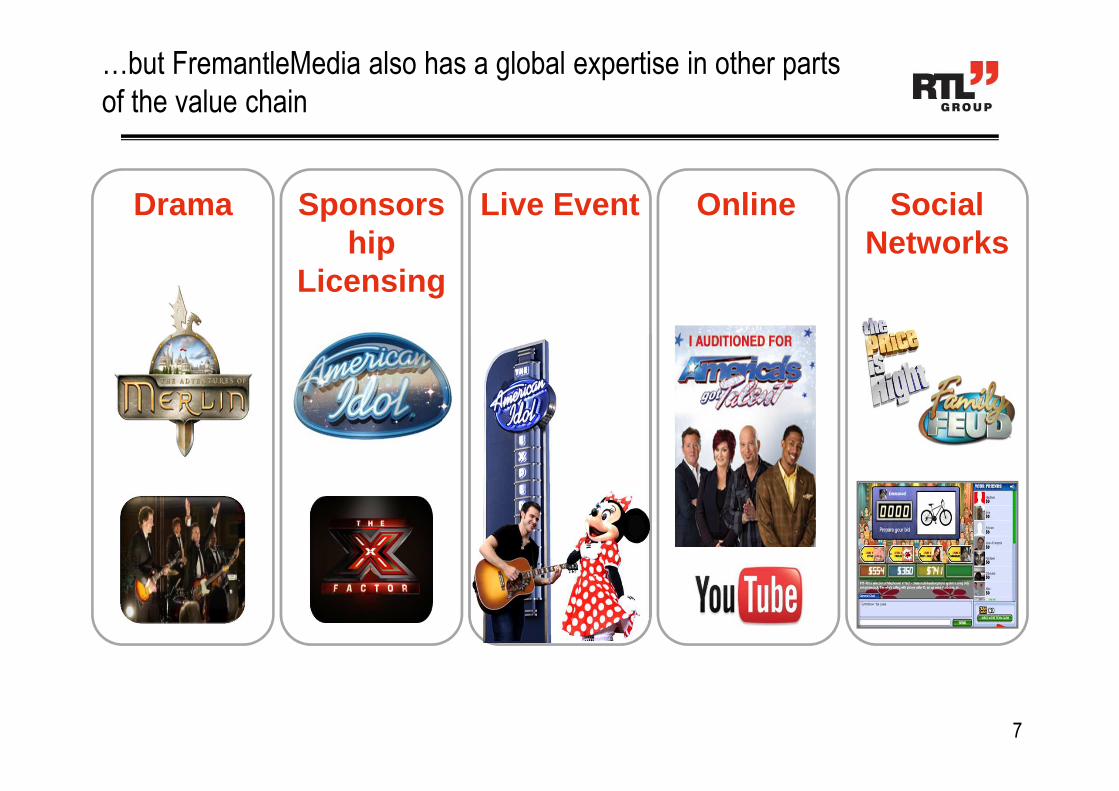
…but FremantleMedia also has a global expertise in other parts
of the value chain
Drama Live Event Online Social Networks
Sponsorship
Licensing
7

Distribution
Home Video Licensing
FremantleMedia’s evolution
iiiideadeadeadea
TV Production
Distribution
Digital
TBARetail
Live Events
BrandedEnt.
Gaming
Kids
HomeVideo
Licensing
TV Production and
Rights Company
21st Century
Entertainment
Company
8
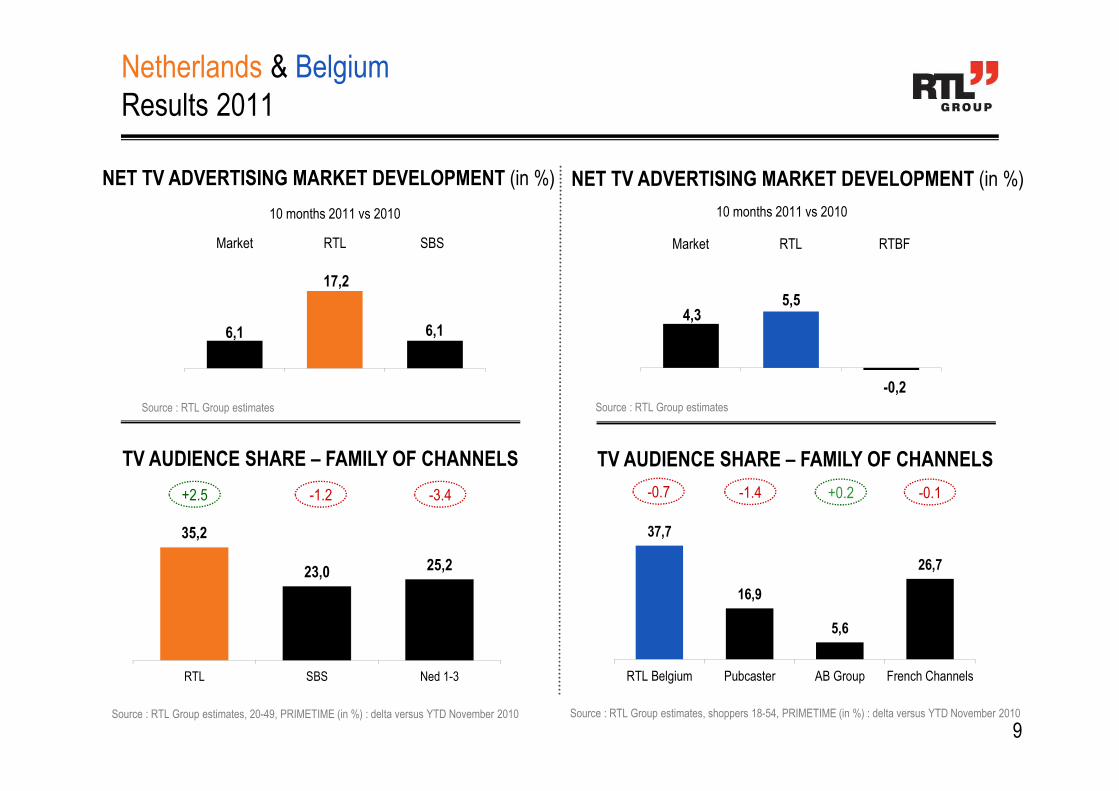
NET TV ADVERTISING MARKET DEVELOPMENT (in %)
Source : RTL Group estimates
Netherlands & Belgium
Results 2011
373 318
10 months 2011 vs 2010
6,1
17,2
6,1
Market RTL SBS
9
NET TV ADVERTISING MARKET DEVELOPMENT (in %)
10 months 2011 vs 2010
Market RTL RTBF
158
20
TV AUDIENCE SHARE – FAMILY OF CHANNELS
35,2
23,0 25,2
RTL SBS Ned 1-3
+2.5 -3.4-1.2
Source : RTL Group estimates, 20-49, PRIMETIME (in %) : delta versus YTD November 2010
TV AUDIENCE SHARE – FAMILY OF CHANNELS
37,7
16,9
5,6
26,7
RTL Belgium Pubcaster AB Group French Channels
Source : RTL Group estimates, shoppers 18-54, PRIMETIME (in %) : delta versus YTD November 2010
-0.7 -1.4 +0.2 -0.1
4,35,5
-0,2
Source : RTL Group estimates

○ Q3 2011 results
○ Business Review
● STRATEGY UPDATE
Agenda
10
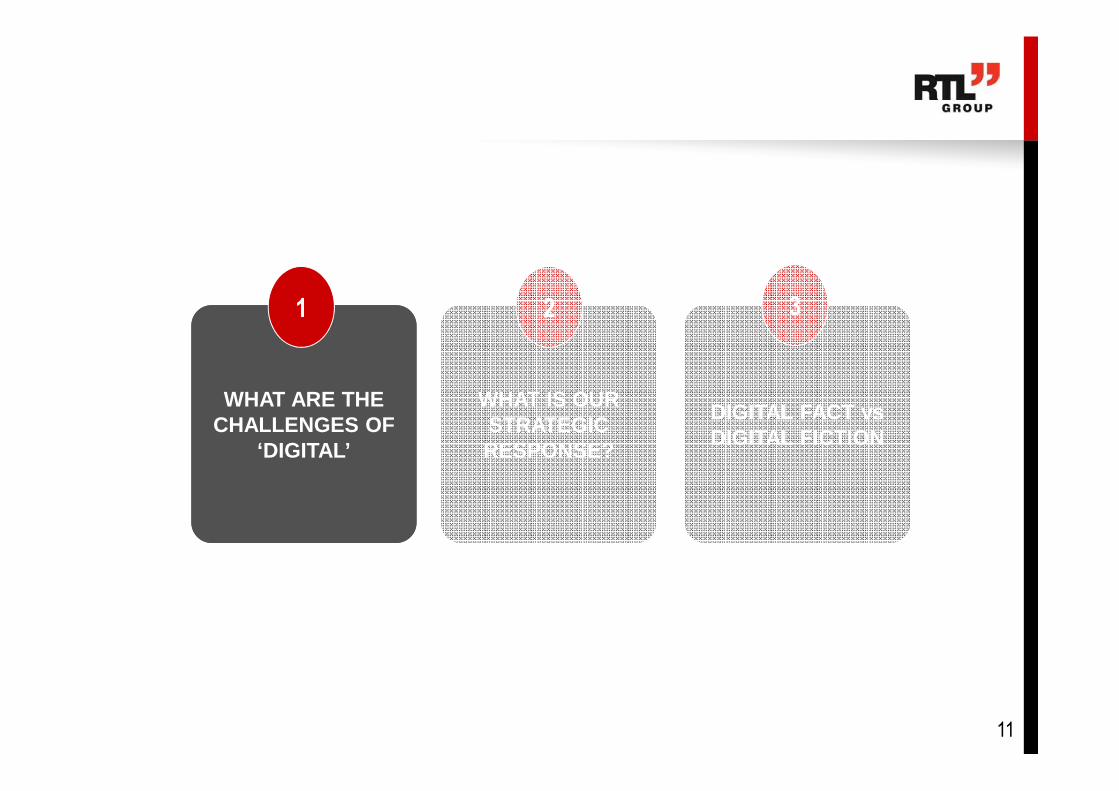
WHAT ARE THECHALLENGES OF
‘DIGITAL’
1
WHAT IS OUR STRATEGIC RESPONSE?
DIGITAL FACT vs DIGITAL FICTION
2 3
11
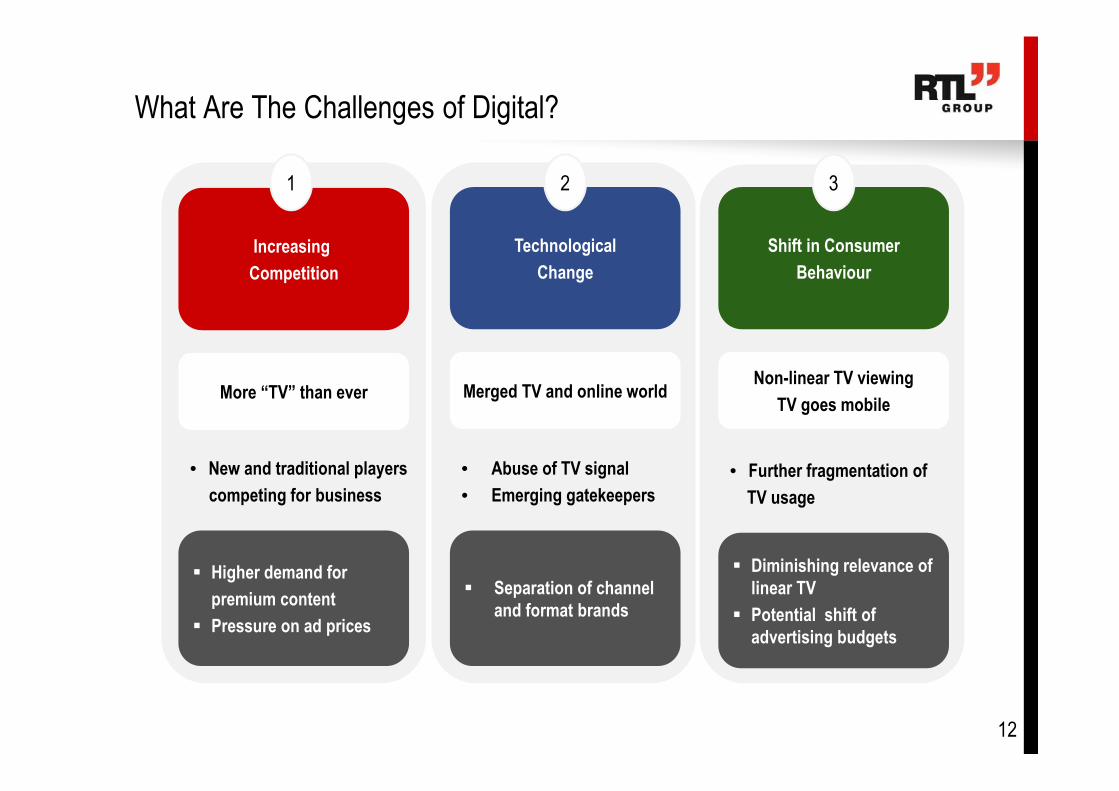
What Are The Challenges of Digital?
Increasing
Competition
1
More “TV” than ever
Technological
Change
2
Merged TV and online world
Shift in Consumer
Behaviour
3
Non-linear TV viewing
TV goes mobile
• New and traditional players
competing for business
� Higher demand for
premium content
� Pressure on ad prices
• Abuse of TV signal
• Emerging gatekeepers
� Separation of channel
and format brands
• Further fragmentation of
TV usage
� Diminishing relevance of
linear TV
� Potential shift of
advertising budgets
12
WHAT ARE THECHALLENGES OF
‘DIGITAL’
1
WHAT IS OUR STRATEGIC RESPONSE?
DIGITAL FACT vs DIGITAL FICTION
2 3
13

SALES
What Is Our Strategic Response?
Figures based on 2010A
DIVERSIFI-
CATION
CONTENT
ONLINE
& MOBILE
COST
CONTROL
2ND
REVENUE
STREAM
PRO-
GRAM
TV & More
NON-
LINEAR
OFFERS
Invest and Experiment
Over 928 million video views in 1st HY
14

What Is Our Strategic Response?
Invest and Experiment
Apps already
Launched
Total App
Downloads
SALES
DIVERSIFI-
CATION
CONTENT
COST
CONTROL
2ND
REVENUE
STREAM
PRO-
GRAM
NON-
LINEAR
OFFERSONLINE
& MOBILE
TV & More
15

What Is Our Strategic Response?
Goal: Top 10 player
Total Page impressions 1st HY 2011
SALES
DIVERSIFI-
CATION
CONTENT
COST
CONTROL
2ND
REVENUE
STREAM
PRO-
GRAM
NON-
LINEAR
OFFERSONLINE
& MOBILE
TV & More
16
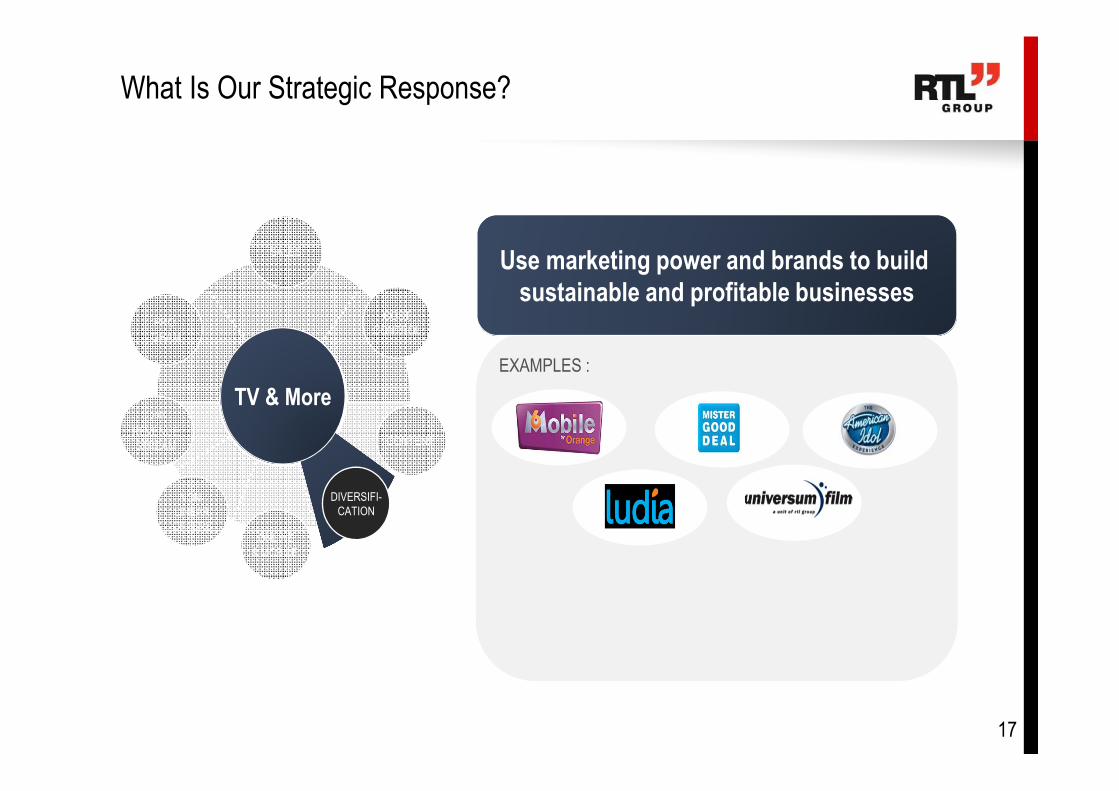
What Is Our Strategic Response?
Use marketing power and brands to build
sustainable and profitable businesses
EXAMPLES :
SALES
CONTENT
COST
CONTROL
2ND
REVENUE
STREAM
PRO-
GRAM
NON-
LINEAR
OFFERSONLINE
& MOBILE
DIVERSIFI-
CATION
TV & More
17
WHAT ARE THECHALLENGES OF
‘DIGITAL’
1
WHAT IS OUR STRATEGIC RESPONSE?
DIGITAL FACT vs DIGITAL FICTION
2 3
18
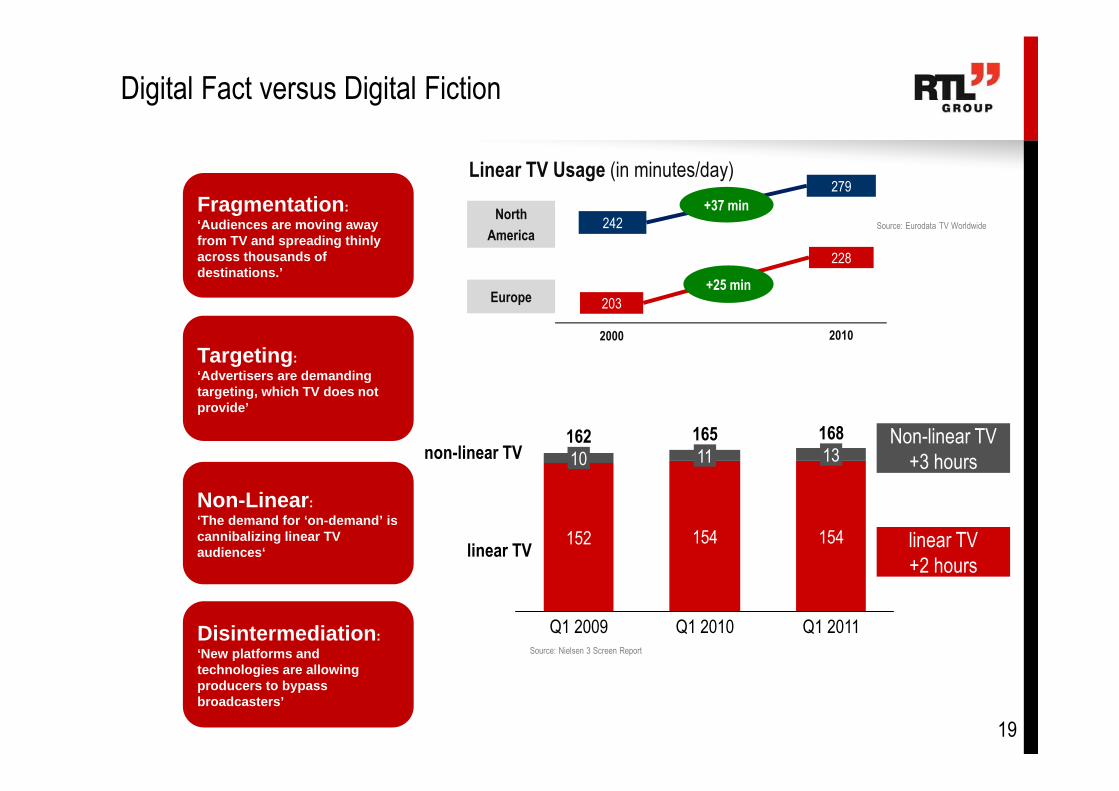
Digital Fact versus Digital Fiction
Fragmentation : ‘Audiences are moving away from TV and spreading thinly across thousands of destinations.’
Targeting : ‘Advertisers are demanding targeting, which TV does not provide’
Disintermediation : ‘New platforms and technologies are allowing producers to bypass broadcasters’
Non-Linear : ‘The demand for ‘on-demand’ is cannibalizing linear TV audiences‘
2000 2010
228
279
North
America
Europe
242
203
+37 min
+25 min
Linear TV Usage (in minutes/day)
Source: Eurodata TV Worldwide
Source: Nielsen 3 Screen Report
168
154
13165
154
11162
152
10Non-linear TV
+3 hours
linear TV
+2 hours
non-linear TV
linear TV
Q1 2011Q1 2010Q1 2009
19
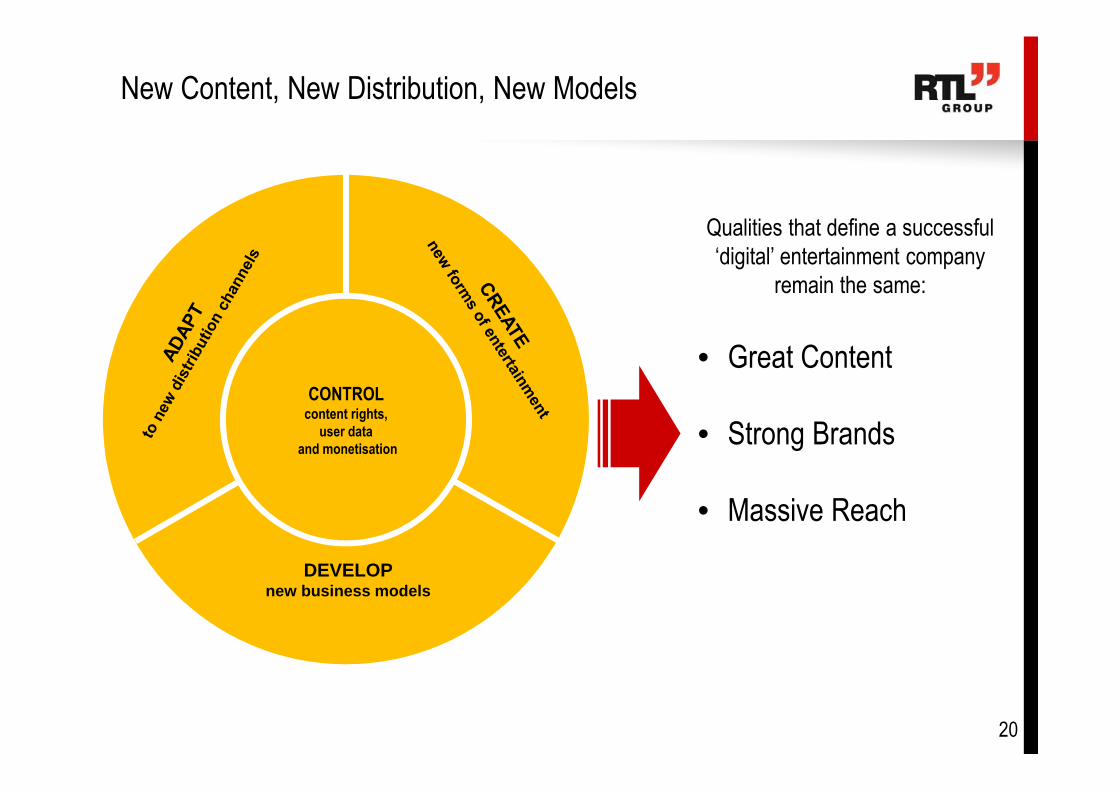
New Content, New Distribution, New Models
CONTROL content rights,
user data
and monetisation
DEVELOPnew business models
Qualities that define a successful
‘digital’ entertainment company
remain the same:
• Great Content
• Strong Brands
• Massive Reach
20
The leading European entertainment network