Embed Size (px)
Citation preview

THE LARGEST CONGREGATION
OF FAITH IN THE WORLD - NASHIK
KUMBH MELA 2015 BEGINS
2015: Issue 484, Week: 20th - 23rd JulyA Weekly Update from SMC
(For private circulation only)
WISE M NEY
HAPPY MAHA KUMBH MELA
Bra
nd
sm
c 3
08


Contents
Equity 4-7
Derivatives 8-9
Commodity 10-13
Currency 14
IPO 15
FD Monitor 16
Insurance 17
Mutual Fund 18
SMC RESEARCH TEAM
REGISTERED OFFICES:
11 / 6B, Shanti Chamber, Pusa Road, New Delhi 110005.
Tel: 91-11-30111000, Fax: 91-11-25754365
MUMBAI OFFICE:
Dheeraj Sagar, 1st Floor, Opp. Goregaon sports Club, Link Road
Malad (West), Mumbai 400064
Tel: 91-22-67341600, Fax: 91-22-28805606
KOLKATA OFFICE:
18,Rabindra Sarani, Poddar Court, Gate No-4,5th Floor, Kolkata-700001
Tel : 91-33-39847000 Fax No : 91-33-39847004
AHMEDABAD OFFICE :
10/A, 4th Floor, Kalapurnam Building, Near Municipal Market,
C G Road, Ahmedabad-380009, Gujarat
Tel : 91-79-26424801 - 05, 40049801 - 03
CHENNAI OFFICE:
Salzburg Square, Flat No.1, III rd Floor, Door No.107, Harrington Road,
Chetpet, Chennai - 600031.
Tel: 044-39109100, Fax -044- 39109111
SECUNDERABAD OFFICE:
206, 3rd Floor, above CMR Exclusive, Bhuvana Towers, S.D.Road,
Secunderabad - 500003
Tel: 91-40-30780298/99, 39109536
DUBAI OFFICE:
312, Belshalat Building, Al Karama, Dubai, P.O. Box 117210, U.A.E.
Tel: 97143963120, Mobile : 971502612483
Fax : 9714 3963122
Email ID : [email protected]
Printed and Published on behalf of
Mr. Saurabh Jain @ Publication Address
11/6B, Shanti Chamber, Pusa Road, New Delhi-110005
Website: www.smcindiaonline.com
Investor Grievance : [email protected]
Printed at: S&S MARKETING
102, Mahavirji Complex LSC-3, Rishabh Vihar, New Delhi - 110092 (India)
Ph.: +91-11- 43035012, 43035014, Email: [email protected]
n the week gone by, markets across the globe staged a relief rally after European
Union leaders clinched a deal with Greece to keep the near-bankrupt country in Ithe euro zone. Now with the anxiety over Greece and China ebbing,
expectations of Fed interest rate cut have been back on the table. Recently, Fed
Chair Janet Yellen has said that the US economy is reviving after a harsh winter and
Fed could start raising interest rates before the end of the year if improvements
stay on track. Meanwhile, in the recent European Central Bank (ECB) meeting,
Mario Draghi, left interest rates unchanged on Thursday. On the Japan front, the
Bank of Japan (BoJ) has slashed its forecasts for inflation and economic growth, but
kept the scope of its monetary easing unchanged as widely expected in its today's
monetary policy meeting.
Domestic markets too rallied as the Greece concern eased and also emulating gains
in global markets. The rally was backed by optimism that India, which imports
almost a third of its crude requirements, would benefit from weak oil prices on the
back of Iran nuclear deal. Monsoon related concerns are beginning to resurface
again in the markets as cumulative rainfall during this year's monsoon season is now
6% below the Long Period Average (LPA) until 16 July 2015 from 3% reported in prior
week. July month being crucial for sowing of Kharif crops accounts for nearly one
third of the four month monsoon season saw rains 32% below the long-period
average. There are expectations of revival in monsoon in the second half of the July
month but the deficit would remain and investors would keep a close vigil on the
weather office next forecast on July 31. Investors will now focus on corporate
earnings, progress of the monsoon and the forthcoming parliamentary session for
further market cues.
On the commodity market front, the fall in the Chinese stock market also ruined the
sentiments of the bulls even in the commodity markets. The CRB got hammered
below the strong support of 220 levels ignoring the positive development of Greece.
In coming days, bullion counter may remain on weaker note on the back of the
expectation that US Fed would hike interest rate and this would increase dollar
index. Gold can move in the range of 25500-26500 while silver can move in the
range of 32500-36500. Crude oil can move in the range of 3000-3500 in MCX.
Recently, Brent and WTI spread widened from $3 to above $6 as Brent rose at faster
pace than WTI. CPI of Australia, retail sales of Canada, new home sales are few data
and events, which can give movements to the commodities prices.
From The Desk Of Editor
(Saurabh Jain)
SMC Global Securities Limited is proposing, subject to receipt of requisite approvals, market conditions and other considerations, a further public offering of its equity shares and has filed the Draft Red Herring Prospectus with the Securities and Exchange Board of India (“SEBI”) and the Stock Exchanges. The Draft Red Herring Prospectus is available on the website of SEBI at www.sebi.gov.in and on the websites of the Book Running Lead Manager i.e., ICICI Securities Limited at www.icicisecurities.com and the Co- Book Running Lead Manager i.e., Elara Capital (India) Private Limited at www.elaracapital.com . Investors should note that investment in equity shares involves a high degree of risk and for details relating to the same, please see the section titled “Risk Factors” of the aforementioned offer document.
SMC Global Securities Ltd. (hereinafter referred to as “SMC”) is a registered Member of National Stock Exchange of India Limited, Bombay Stock Exchange Limited and its associate is member of MCX stock Exchange Limited. It is also registered as a Depository Participant with CDSL and NSDL. Its associates merchant banker and Portfolio Manager are registered with SEBI and NBFC registered with RBI. It also has registration with AMFI as a Mutual Fund Distributor.
SMC is in the process of making an application with SEBI for registering as a Research Entity in terms of SEBI (Research Analyst) Regulations, 2014. SMC or its associates has not been debarred/ suspended by SEBI or any other regulatory authority for accessing /dealing in securities Market.
SMC or its associates including its relatives/analyst do not hold any financial interest/beneficial ownership of more than 1% in the company covered by Analyst. SMC or its associates and relatives does not have any material conflict of interest. SMC or its associates/analyst has not received any compensation from the company covered by Analyst during the past twelve months. The subject company has not been a client of SMC during the past twelve months. SMC or its associates has not received any compensation or other benefits from the company covered by analyst or third party in connection with the research report. The Analyst has not served as an officer, director or employee of company covered by Analyst and SMC has not been engaged in market making activity of the company covered by Analyst.
The views expressed are based solely on information available publicly available/internal data/ other reliable sources believed to be true.
SMC does not represent/ provide any warranty express or implied to the accuracy, contents or views expressed herein and investors are advised to independently evaluate the market conditions/risks involved before making any investment decision.

NEWS
DOMESTIC NEWS
Economy
• India's wholesale price index fell 2.40 percent year-over-year in June, exceeding economists' expectations for a 2.3 percent decrease. In May, prices had fallen 2.36 percent. Build up inflation rate in the financial year so far was 1.42 percent compared to a build up rate of 1.50 percent in the corresponding period of the previous year.
• India's consumer price index rose 5.40 percent annually after a 5.01 percent climb in May. Economists had forecast a 5.1 percent increase. Food price inflation accelerated to 5.48 percent from 4.80 percent in the previous month.
• Indian Union Cabinet approved a power transmission project worth `8,548.68 covering seven states including Andhra Pradesh, Gujarat and Maharashtra.
Capital Goods
• Thermax has acquired 33% stake in alternative energy solutions firm First Energy. The agreement envisages stage-wise acquisition of First Energy by Thermax over the next four to six years.
• Siemens has bagged a Rs 123-crore order from Power Grid Company of Bangladesh at two sites located in Dhaka.
• Titagarh Wagons announced its foray into the metro coach and high-speed train manufacturing with the acquisition of the business of Firema Trasporti S.p.A based in Italy. The transaction entails transfer of technology, all tangible and intangible assets and some liabilities relating to ongoing orders.
• Va Tech Wabag has won orders worth over `1,000 crore during April-June (Q1) quarter.
Infrastructure
• Adani Ports and Special Economic Zone (APSEZ) on Wednesday said it has received Kerala government's nod for developing the `4,089-crore Vizhinjam International Deepwater Seaport project.
Media
• Zee Entertainment Enterprises Limited (ZELL) is all set to acquire Odia general entertainment channel Sarthak TV which is owned by Sarthak Entertainment. The acquisition will be from current shareholders of Sarthak Entertainment Private Limited, subject to requisite regulatory approvals, as an all-cash deal at a consideration of maximum of ̀ 115 Crores.
Information Technology
• Mindtree announced the acquisition of UK-headquartered Bluefin Solutions for 42.3 million pounds (`414.54 crore) and US-based Relational Solutions for $10 million to strengthen its presence in digital and analytics segement.
INTERNATIONAL NEWS
• US initial jobless claims fell to 281,000, a decrease of 15,000 from the previous week's revised level of 296,000. Economists had expected jobless claims to drop to 285,000 from the 297,000 originally reported for the previous week.
• US industrial production increased by 0.3 percent in June after edging down by 0.2 percent in May. Economists had expected production to rise by 0.2 percent.The bigger than expected increase was partly due to a rebound in mining output, which jumped 1.0 percent in June after tumbling by 2.1 percent in May.
• US producer price index rose by 0.4 percent in June following a 0.5 percent increase in May. Economists had expected prices to climb by 0.3 percent. The bigger than expected increase partly reflected another jump in energy prices, which shot up by 2.4 percent in June after soaring by 5.9 percent in May.
• The European Central Bank left its key interest rates unchanged at a record low as its chief Mario Draghi is set to tackle difficult questions on Greece. The Governing Council, led by ECB President Draghi, held the refinancing rate at a record low 0.05 percent, following its meeting in Frankfurt. The decision was in line with economists' expectations.
• China's second quarter economic growth exceeded expectations, helped by stimulus, suggesting that the government remains on track to achieve its target this year. Gross domestic product grew 7 percent year-over-year in the second quarter, the same rate of growth as seen in the first quarter. The rate was faster than the 6.8 percent rise forecast by economists.
• The Bank of Japan decided to keep its record monetary stimulus unchanged despite downgrading both inflation and economic growth outlook. The Policy Board of the BoJ governed by Haruhiko Kuroda decided by an 8-1 majority vote to maintain its target of raising the monetary base at an annual pace of about JPY 80 trillion. Takahide Kiuchi was the sole dissenter.
EX-DATE COMPANY PURPOSE
20-Jul-15 Tata Consultancy Services Interim Dividend - Rs 5.50/- Per Share
20-Jul-15 Wipro AGM/ Dividend - Rs 7/- Per Share
22-Jul-15 ACC Interim Dividend
23-Jul-15 Exide Industries AGM/Dividend Re 0.70 Per Share
23-Jul-15 Tata Steel AGM / Dividend - Rs. 8/- Per Share
23-Jul-15 Tech Mahindra AGM/ Dividend - Rs 6/- Per Share
23-Jul-15 IDFC Final Dividend - Rs 2.60 Per Share
Meeting Date Company Purpose
20-Jul-15 UltraTech Cement Results
20-Jul-15 LIC Housing Finance Results
21-Jul-15 Asian Paints Results
21-Jul-15 Infosys Results
21-Jul-15 Idea Cellular Results
21-Jul-15 HDFC Bank Results
21-Jul-15 Hindustan Unilever Results
21-Jul-15 Cairn India Results
23-Jul-15 Wipro Results
23-Jul-15 Lupin Results
23-Jul-15 United Spirits Results
23-Jul-15 Indian Bank Results
23-Jul-15 GAIL (India) Board meeting Rescheduled
23-Jul-15 Biocon Results
23-Jul-15 Bajaj Auto Results
24-Jul-15 TVS Motor Company Results
24-Jul-15 Reliance Industries Results
24-Jul-15 GAIL (India) Results
24-Jul-15 Crompton Greaves Results
24-Jul-15 Axis Bank Results
25-Jul-15 Havells India Results
FORTHCOMING EVENTS
NOTES:1) These levels should not be confused with the daily trend sheet, which is sent every morning by e-mail in the name
of "Morning Mantra ".2) Sometimes you will find the stop loss to be too far but if we change the stop loss once, we will find more strength
coming into the stock. At the moment, the stop loss will be far as we are seeing the graphs on weekly basis and taking a long-term view and not a short-term view.
TREND SHEET
Stocks *Closing Trend Date Rate SUPPORT RESISTANCE Closing
Price Trend Trend
Changed Changed
SENSEX 28463 UP 17.07.15 28463 27200 26500
S&P NIFTY 8610 UP 17.07.15 8610 8200 8020
CNX IT 11263 DOWN 24.04.15 11132 11800 12000
CNX BANK 19106 UP 03.07.15 18730 18200 17800
ACC* 1486 DOWN 20.03.15 1570 - 1510
BHARTIAIRTEL 426 UP 13.03.15 400 415 405
BHEL 287 UP 03.07.15 259 270 260
CIPLA 685 UP 17.07.15 685 640 625
DLF 114 DOWN 24.04.15 131 125 135
HINDALCO 107 DOWN 12.12.14 154 120 125
ICICI BANK** 317 DOWN 06.02.15 329 - 320
INFOSYS*** 1002 DOWN 24.04.15 1995 - 1020
ITC**** 322 DOWN 04.03.15 344 - 325
L&T 1872 UP 19.06.15 1716 1770 1730
MARUTI 4193 UP 19.09.13 1480 3900 3800
NTPC 136 DOWN 08.05.15 142 140 145
ONGC 293 DOWN 17.10.14 397 320 330
RELIANCE 1022 UP 17.04.15 927 960 940
TATASTEEL 284 DOWN 29.05.15 328 310 320
S/l
4
®
Closing as on 17-07-2015*ACC has breached the Resistance of 1480**ICICIBANK has breached the Resistance of 310***INFY has breached the Resistance of 1000****ITC has breached the Resistance of 320

BSE SENSEX GAINERS & LOSERS TOP (% Change) NSE NIFTY GAINERS TOP & LOSERS (% Change)
SECTORAL INDICES (% Change)
SMC Trend
SMC Trend
FMCGHealthcare
FTSE 100CAC 40
Auto BankRealty
Cap GoodsCons Durable
Oil & GasPower
NasdaqDow jonesS&P 500
NikkeiStrait times
Hang SengShanghai
ITMetal
Down SidewaysUp
GLOBAL INDICES (% Change)
INDIAN INDICES (% Change)
5
®
SMC Trend
Nifty BSE Midcap S&P CNX 500BSE SmallcapSensex Nifty Junior
6.21 6.06
5.42 5.284.77
-1.70 -1.58
-0.75-0.18
0.00
-3.00
-2.00
-1.00
0.00
1.00
2.00
3.00
4.00
5.00
6.00
7.00
Maruti Suzuki
H D F C Infosys Axis Bank Cipla Tata Motors Vedanta O N G C Larsen & Toubro
6.636.38 6.29 6.20
5.95
-1.74 -1.65
-0.78 -0.76 -0.66
-3.00
-2.00
-1.00
0.00
1.00
2.00
3.00
4.00
5.00
6.00
7.00
8.00
Asian Paints B P C L Tata Power Co.
Maruti Suzuki H D F C Vedanta Tata Motors O N G C Punjab Natl.Bank
NMDC
-338.41
642.90
552.18
305.22
511.38
196.50
-16.90
-400.00
-200.00
0.00
200.00
400.00
600.00
800.00
Friday Monday Tuesday Wednesday Thursday
FII / FPI Activity MF Activity
2.96
2.84
3.02
2.91
2.66
2.90
2.40
2.50
2.60
2.70
2.80
2.90
3.00
3.10
Nifty Sensex BSE Midcap BSE Smallcap
Nifty Junior S&P CNX 500
2.332.44
1.06
2.17
2.76
4.014.17
1.89
3.13
2.88
0.79
0.00
0.50
1.00
1.50
2.00
2.50
3.00
3.50
4.00
4.50
Auto Index Bankex Cap Goods Index
Cons Durable Index
FMCG Index Healthcare Index
IT Index Metal Index Oil & Gas Index
Power Index Realty Index
-1.41
3.31
2.032.30
4.15
2.24
1.05
1.84
4.45
-2.00
-1.00
0.00
1.00
2.00
3.00
4.00
5.00
Nasdaq Comp. Dow Jones S&P 500 Nikkei Strait Times Hang Seng Shanghai Comp.
FTSE 100 CAC 40
INSTITUTIONAL ACTIVITY (Equity) (` Crore)

Beat the street - Fundamental Analysis
Above calls are recommended with a time horizon of 8 to 10 months. Source: Company Website Reuters Capitaline
6
®
Investment Rationale affordable housing segment. MIB has build reach to 30 countries to develop re-insurance business. •The company exhibited healthy performance on The company opposes to emerge as top 20 global the back of strong collection performance in insurance broker by 2020.Q4FY2015. The collection efficiencies improved
above 100% in Q4FY2015, compared with around •The company has added above 200 branches in 92-93% in the previous two quarters. FY15 raising the branch count to 1108 offices at
end March 2015, while building access to about 2 •The number of Non Performing Assets (NPA) lakh. As per the company, India has total 4 lakh customers has remained stable at 66 thousands at commercially viable villages out of 6 lakh villages. end March 2015 same as at a year ago level. Thus, the company has scope to add 1000
•GNPA dipped to 5.9% of total asset at end March branches to build access to 4 lakh villages. 2015 from 7.1% a quarter ago. NNPA ratio also fell to
•Valuation2.4% from 3.4% a year ago. NPA coverage ratio The company expects the key growth driver, going improved to 61% at end March 2015 from 54.3% at forward, will be increased in penetration levels of cars,
end December 2014 and 59% from end March 2014. utility vehicles, increase in dealership and access to finance etc. Moreover the company will continue to •Assets Under Management (AUM) of the company grow aggressively in terms of branches and dealer increased 8% to Rs 36878 crore at end March 2015, network, thus, it is expected that the stock may see a showing moderation in the pace of growth 11% a price target of `343 in 8 To 10 months time frame on quarter ago and 22% a year ago. MMFSL currently target P/BV of 2.9x and FY16 (E) BVPS of ̀ 118.23.has a network of 1108 offices, spread across 25
states and 5 union territories at end March 2015.
•Mahindra Insurance Brokers (MIBL) is a subsidiary of the company has registered revenue at `35.6 crore as against ̀ 32.5 crore, registering a growth of 10% over the same period previous year. Mahindra Rural Housing Finance (MRHFL) ) also a subsidiary of company, registered Revenue at `101.6 crore as against `65.9 crore, a growth of 54% over the same period previous year.
•Both subsidiaries of the company are showing healthy performance. MRHL would focus on strengthening the network, while sees opportunities from the tier IV towns with
Face Value (`) 2.00
52 Week High/Low 344.90/231.80
M.Cap (`Cr.) 15910.78
EPS (`) 15.25
P/E Ratio (times) 18.34
P/B Ratio (times) 2.68
Stock Exchange BSE
` in cr
% OF SHARE HOLDING
P/B Chart
MAHINDRA & MAHINDRA FINANCIAL SERVICES LIMITED CMP: 279.75 Upside: 23%Target Price: 343
VALUE PARAMETERS
Actual Estimate
FY Mar-14 FY Mar-15 FY Mar-16
Revenue 2,994.30 3,375.10 3,785.30
EBIT 1,980.50 2,249.00 2,171.70
Pre-tax Profit 1,461.50 1,399.90 1,655.60
Net Income 954.40 912.90 1,082.40
EPS 16.78 16.05 19.54
BVPS 93.94 104.48 118.23
ROE 19.30 16.30 17.20
38.25
5.210.67
52.01
3.86 Foreign
Institutions
Non Promoter Corporate Holding
Promoters
Public & Others
ADITYA BIRLA NUVO LIMITED CMP: 1944.85 Upside: 20%Target Price: 2332
Investment Rationale common information technology backbone.•Aditya Birla Nuvo Limited (ABNL) is an India-based •Recently the company 's board has approved a
diversified conglomerate. It operates in 40 proposal to participate in solar power project and for countries with more than 120,000 employees further development of this, it would participate in worldwide and derives more than 50% of its auction of such projects in Telangana.revenues from its overseas operations. It is into •Its consolidated net profit rose 88.3% to `331.63 services and manufacturing sectors where it crore on almost unchanged growth in total income to commands a leadership position. `7205.36 crore in Q4 March 2015 over Q4 March 2014.
•Its service sector businesses include Financial ValuationServices (Life insurance, NBFC, Broking, Online The Company is planning to make investment in money management, General insurance etc.), promising sectors, building leadership in businesses Fashion and Lifestyle (Branded apparels and and develop a platform to drive synergy of resources. textiles) and telecom (Idea Cellular) and Most of the businesses are contributing to the manufacturing sector business include Agri, Rayon profitable growth of the Company and are and Insulator businesses. competitively well positioned. Going forward, the
•Recently, the company has entered into definitive joint thrust is on capturing growth opportunities across the venture agreements with MMI Holdings, a leading South businesses to achieve the next higher level of growth. African Insurance based financial services group, to Thus, it is expected that the stock will see a price target enter into the Health Insurance and Wellness business of `2332 in 8 to 10 months time frame on one year in India. As per the agreements, ABNL will hold 51% average P/E of 17.69x and FY16 (E) earnings of 131.84.share in the joint venture company named Aditya Birla Health Insurance Co. (ABHICL), subject to the regulatory approvals.
•ABNL has applied to RBI for Payments Bank license, where ABNL will be the promoter, holding 51% of equity capital and Idea Cellular will hold balance 49% which may be increased to 60%, if permitted with regulatory approval.
•The Company is planning to restructure its Fashion and Retail business segment to create India's fashion retail company. With the demerger of its subsidiary Madura Fashion and Retail into pantaloon fashion and retail, company will expand market share, improve supply chain and share
`
Face Value (`) 10.00
52 Week High/Low 2005.95/1358.00
M.Cap (`Cr.) 25310.73
EPS (`) 109.42
P/E Ratio (times) 17.77
P/B Ratio (times) 1.97
Dividend Yield (%) 0.36
Stock Exchange BSE
VALUE PARAMETERS
% OF SHARE HOLDING
P/E Chart
` in cr
Actual Estimate FY Mar-14 FY Mar-15 FY Mar-16
Revenue 25,621.50 26,115.00 30,293.90EBITDA 4,598.20 5,390.30 6,455.40EBIT 2,989.40 3,687.50 4,528.50Pre-tax Profit 1,766.90 2,337.90 2,775.70Net Income 1,137.50 1,428.80 1,821.90EPS 90.69 109.64 131.84BVPS 860.00 989.05 1,097.72ROE 11.10 11.90 13.30
18.86
11.18
2.94
57.21
9.82
Foreign
Institutions
Non Promoter Corporate Holding
Promoters
Public & Others

Charts by Spider Software India Ltd
7
EQUITY
Above calls are recommended with a time horizon of 1-2 months
Disclaimer : research. The analysis contained in the analyst research is based on numerous assumptions. Different assumptions could result in materially different results.The analyst, not any of its affiliated companies, not any of their members, directors, employees or agents accepts any liability for any loss or damage arising out of the use of all or any part of the analysis research.
The analyst and its affiliates companies make no representation or warranty in relation to the accuracy, completeness or reliability of the information contained in its
SOURCE: CAPITAL LINE
®
The stock closed at ̀ 535.65 on 17thJuly 2015. It made a 52-week low at ̀ 138.90
on 25th July 2014 and a 52-week high at ̀ 554.90 on 28th May 2015. The 200 days
Exponential Moving Average (EMA) of the stock on the daily chart is currently at
`412.28.
As we can see on the charts, there is sharp upside momentum since 2014. After
trading into consolidation zone for sometime it again moved sharply last week
and is very close to its 52 week high which shows its potential. One can buy in the
range of 530-535 levels for the target of 575-585 levels with SL of 510 levels.
BOMBAY BURMAH TRADING CORPORATION LIMITED
The stock closed at ̀ 317.45 on 17th July 2015. It made a 52-week low at ̀ 280.35
on 08th June 2015 and a 52-week high of ̀ 393.40 on 28th January 2015. The 200
days Exponential Moving Average (EMA) of the stock on the daily chart is
currently at ̀ 314.05.
After a marginal fall from 380 levels, it rebounded sharply from 280 levels and
sustained thereafter. Moreover, it has formed Inverted head and shoulder on
daily charts which is a major boost for this particular scrip and will help to reach
our desired targets. One can buy above 320 levels for the target of 350-355
levels with SL of 305 levels.
ICICI BANK LIMITED

DERIVATIVES
CHANGE IN NIFTY OPTION OI (IN QTY)
WEEKLY VIEW OF THE MARKET
NIFTY OPTION OI CONCENTRATION (IN QTY)
CHANGE IN BANKNIFTY OPTION OI (IN QTY)BANKNIFTY OPTION OI CONCENTRATION (IN QTY)
®
BRITANNIA (JUL FUTURE)
Buy: Above `2881
Target: `2921
Stop loss: `2861
IBREALEST
Buy JUL 52.5. PUT 1.30
Lot size: 4000
BEP: 51.20
Max. Profit: Unlimited
Max. Loss: 5200.00 (1.30*4000)
OPTIONSTRATEGY
FUTURE
ITC
Buy JUL325. CALL 3.20
Sell JUL330. CALL 1.65
Lot size: 1000
BEP:326.55
Max. Profit: 3450.00 (3.45*1000)
Max. Loss: 1550.00 (1.55*1000)
AJANTPHARM
Buy JUL1700. CALL 29.00
Sell JUL1750. CALL 15.00
Lot size: 250
BEP: 1714.00
Max. Profit: 9000.00 (36.00*250)
Max. Loss: 3500.00 (14.00*250)
DERIVATIVE STRATEGIES
NMDC (JUL FUTURE)
Sell: Below `112.5
Target: `107.5
Stop loss: `115
JUSTDIAL (JUL FUTURE)
Sell: Below `1089
Target: `1059
Stop loss: `1104
BEARISH STRATEGYBULLISH STRATEGY
Markets remained strong with continuous FII buying and easing of Greece problem. Indian market performed relatively better than other global peers as positive
local factors added values. Private Banks, Pharma, Energy sectors performed, whereas Metal, Reality and PSU bank remained laggards. This week Nifty gained
more than 3% and broke major resistance level of 8500. Hereafter the range of 8500-8700 will remain crucial in the near term, and the move is expected to
remain positive as indicated by option open interest concentration. Any closing below 8500 level will change the short term momentum; on the other side the
index may face stiff resistance at 8700-8750 levels. The options open interest concentration continued to be at the 8700-strike call with the highest open interest
of above 47 lakh shares. Among the put options, the 8500-strike taking the total open interest to 65 lakh shares, with the highest open interest among put
options. The implied volatility (IV) of call options closed at 14.15%, while the average IV of put options closed at 14.21. VIX Index dipped to 14.78 from 15.77. The
PCR OI for the week closed up at 1.54 from 1.21, which indicates aggressive put writing. In last 6 trading session, nifty gained more than 350 points, which clearly
indicates that market is little over brought, hence some profit booking cannot be ruled out, but every dip should be used for creating new longs.
In lakhs
In 10000 In 10000
Call Put
1.5
4
1.7
0
7.4
5
7.4
6
13
.18
29
.30
32
.26
40
.40
39
.69
36
.63
28
.89
27
.99
53
.97
49
.62
47
.01
49
.18
54
.04
52
.17
23
.56
8.2
2
3.5
0
1.4
3
0.00
10.00
20.00
30.00
40.00
50.00
60.00
7800 7900 8000 8200 8300 8400 8500 8600 8700 8800 8900
Call Put
-0.2
1
0.1
1
-0.0
2
-0.7
4
-6.7
2
-22
.40 -1
4.1
1
1.6
0
4.1
1
2.4
4
10
.70
-4.8
0
-0.8
0
1.5
8
0.3
6
1.2
5
23
.48
36
.09
17
.18
4.0
6
-0.2
2
-0.0
9
-30.00
-20.00
-10.00
0.00
10.00
20.00
30.00
40.00
7800 7900 8000 8200 8300 8400 8500 8600 8700 8800 8900
Call Put
0.8
9 4.7
6
3.3
5 9.4
2
1.6
7
22
.55
2.4
0
46
.10
6.5
2
37
.79
37
.67
9.7
9
21
.35
34
.70
61
.73
6.9
6
47
.37
6.0
9
33
.50
3.5
3
3.3
0
3.5
6
0.00
10.00
20.00
30.00
40.00
50.00
60.00
70.00
16500 17000 17500 18000 18200 18500 18700 19000 19200 19500 20000
Call Put
0.0
1
-0.2
1
-0.1
4
-1.2
6
-0.3
6
-3.9
1 -0.7
2
-2.2
5
1.9
8
-4.4
0
2.1
4
-2.6
8
-8.1
1 -4.4
5
10
.33
1.4
6
25
.51
3.9
5
23
.40
3.3
1
0.8
9
-0.3
5
-10.00
-5.00
0.00
5.00
10.00
15.00
20.00
25.00
30.00
16500 17000 17500 18000 18200 18500 18700 19000 19200 19500 20000
8
In lakhs

9
DERIVATIVES
®
FII’s ACTIVITY IN DERIVATIVE SEGMENT
SENTIMENT INDICATOR (NIFTY)
16-Jul 15-Jul 14-Jul 13-Jul 10-Jul
Discount/Premium 18.60 18.25 11.80 22.30 25.00
PCR(OI) 1.54 1.44 1.28 1.25 1.21
PCR(VOL) 1.37 1.15 0.86 0.96 0.90
A/D RATIO(Nifty 50) 2.13 4.44 0.72 11.50 1.63
A/D RATIO(All FO Stock)* 3.24 1.33 0.73 9.47 1.64
Implied Volatality 14.21 14.34 14.84 15.03 15.77
VIX 14.78 15.57 16.01 16.27 16.27
HISTORY. VOL 16.65 16.50 16.46 16.95 16.59
*All Future Stock
SENTIMENT INDICATOR (BANKNIFTY)
16-Jul 15-Jul 14-Jul 13-Jul 10-Jul
Discount/Premium 62.40 64.20 57.85 80.80 81.55
PCR(OI) 1.32 1.09 1.06 1.10 1.04
PCR(VOL) 0.97 0.90 0.97 0.88 0.84
A/D RATIO(BANKNIFTY) 5.00 1.00 0.20 All up All up
#A/D RATIO 9.50 0.50 0.24 All up All up
Implied Volatality 17.53 19.39 18.94 29.06 28.68
HISTORY. VOL 21.86 20.73 21.36 21.75 22.00
FII’S ACTIVITY IN NIFTY FUTURE
**The highest call open interest acts as resistance and highest put open interest acts as support.# Price rise with rise in open interest suggests long buildup | Price fall with rise in open interest suggests short buildup # Price fall with fall in open interest suggests long unwinding | Price rise with fall in open interest suggests short covering
# All BANKING Future Stock
Top 10 short build up
In Cr. In Cr.
Top 10 long build up
LTP % Price Change Open interest %OI Chng
MINDTREE 1228 2.06% 611250 72.55%
PIDILITIND 562.75 2.67% 679000 39.00%
BAJFINANCE 5269.1 4.26% 138625 30.93%
CEATLTD 732.45 5.74% 2692000 24.69%
AMBUJACEM 253.5 4.88% 7625000 24.08%
ACC 1488.9 1.52% 1363250 21.52%
ZEEL 382.3 5.36% 10175000 19.20%
BIOCON 485.75 3.66% 4406500 19.11%
IOC 443.85 5.15% 10361000 18.91%
HINDUNILVR 937.05 3.54% 3953500 18.50%
LTP % Price Change Open interest %OI Chng
JUSTDIAL 1117.05 -5.90% 984500 22.45%
ADANIENT 89.2 -0.78% 8852000 17.26%
SRTRANSFIN 887.1 -5.33% 2565250 16.07%
SRF 1306.8 -0.23% 874750 11.22%
IFCI 26.75 -0.56% 48136000 9.28%
SOUTHBANK 24.15 -1.43% 16911000 8.74%
IBREALEST 54.95 -0.90% 26824000 7.42%
INDIACEM 88.4 -7.24% 26324000 7.30%
SUNTV 270.95 -2.04% 4682000 7.07%
TITAN 348 -1.44% 7407000 4.74%
36
1
- 85
4
95
7
- 27
1
- 12
47
7 15
88
9 10
88
15
11
-1500
-1000
-500
0
500
1000
1500
2000
03-Jul 06-Jul 07-Jul 08-Jul 09-Jul 10-Jul 13-Jul 14-Jul 15-Jul 16-Jul
20
23
- 10
62
18
73
- 55
- 10
53
- 10
- 11
79
14
12
22
68 27
48
-1500
-1000
-500
0
500
1000
1500
2000
2500
3000
03-Jul 06-Jul 07-Jul 08-Jul 09-Jul 10-Jul 13-Jul 14-Jul 15-Jul 16-Jul

Turmeric futures (August) is expected to trade sideways in the range of 7200-7620 levels. The sowing of the yellow spice has increased as compared to the previous season owing to good spell of rains in the month of June over major cultivating areas. However, looking at the current scenario concerns are being raised as the downpour has shown thumbs down in this month. On the demand side, the upcountry orders are expected to rise & consumption may increase from local masala companies before the onset of festival season. Coriander futures (August) will possibly take support above 11500 levels. The special Margin of 10% on the long side on all the running contracts and yet to be launched contracts in Coriander will be withdrawn with effect from July 21, 2015. Cardamom futures (August) may hover in the range of 795-835 levels with upside getting capped. The spot prices at the auctions are on a declining trend due to slack demand amid good arrivals. The supply was more than double from that of same period last year & on the contrary, the demand from north Indian markets has been poor because of unfavorable consuming season. Chilli futures (August) is expected to consolidate in the range of 9300-9800 levels. This season there has been good demand for chilli seeds across prominent chilli growing states like AP, Maharashtra, MP and Gujarat. The farmers are getting interested to grow more of this crop due to better returns enjoyed last year. The market participants are cautious & watching the monsoon because if Andhra gets good rainfall in the coming weeks, the chilli prices may witness a correction.
SPICES
Bullion counter may remain on weaker note as fear of US fed interest rate hike
concerns and rising dollar index is likely to keep prices under pressure. On the
domestic bourses, movement of local currency rupee can impact the prices
which can move in the range of 62.8–63.8 in near term. Greenback can touch
98.5 levels, which can keep prices under pressure. Gold can move in the range
of 25500-26500 while silver can move in the range of 32500-36500. Recently
gold silver ratio rose sharply higher above 75 levels as silver melted at faster
pace than gold. Gold fell to a four-month low recently after the U.S. Federal
Reserve's reiteration that interest rates were likely to rise this year pushed the
dollar index to a six-week high. Federal Reserve Chair Janet Yellen confirmed
recently that the Fed will likely raise interest rates later this year if the U.S.
economy expands as expected. Gold is sensitive to rising interest rates, as
they both increase the opportunity cost of holding non-yielding bullion and
help the dollar. Premiums for physical gold on the Shanghai Gold Exchange
picked up slightly to $2-$4 an ounce over the spot price, although slowing
economy could cap demand from China, the world's top gold consumer. While
the Greek parliament approved austerity measures demanded by its
creditors, Germany's finance minister questioned whether Athens would ever
get a third bailout. While gold remains out of favour among investors, the
potential return of Chinese buyers seeking an alternative to equities and real
estate can give support to the prices.
BULLIONS
10
In base metal counter, volatile movement may continue amid China slowdown concerns and fear of rising interest rates in US. Base metals got support as Greek lawmakers passed a tough bailout programme and the Chinese stock market stabilised, but a stronger dollar and uncertainty over global growth capped gains. Copper may move in the range of 330-385. Worldwide demand for copper metal (produced from refined copper and recycled scrap) is projected to advance 4.7 percent per year to 37.2 million metric tons in 2019. Nickel may move in the range of 690-770 in MCX. Many mining companies have approached MMG about buying the mothballed Avebury nickel mine, near Zeehan, in the wake of its purchase deal with Australian Nickel Mines Limited falling over. Recently nickel prices having hit six-year lows as LME stocks increased at a breakneck pace since 2012, but its stocks has shown the first sign of a drawdown recently which gave support to Nickel. Aluminum may move in the range of 104-110 in MCX. Zinc can move in the range of 126-136 and lead can move in the range of 113-122 in MCX. Zinc used to galvanize steel in autos is set for the longest run of gains since June 2014 amid tighter global supplies and as growth in China beat forecasts in the second quarter. European car sales expanded 15 percent in June from a year earlier, the fastest pace since December 2009, as monetary stimulus helped economic revival in euro-zone countries. Demand for refined zinc totaled 1.22 million tons in May, exceeding production of 1.18 million tons, according to International Lead and Zinc Study Group data.
®
BASE METALS
Crude oil may continue to move on weaker path as rising greenback and fear of increased supply after Iran nuclear deal can keep the prices under pressure. Crude oil can move in the range of 3000-3500 in MCX. Recently Brent and WTI spread widened from $3 to above $6 as Brent rose at faster pace than WTI. Brent rose after a power outage closed the UK's largest oilfield and following data showing a fall in crude inventories and strong demand from refineries in the United States. Increase in inventories have pressurized the price lower as it showed total U.S. inventories of crude oil and petroleum products at a record high, even as refineries processed more crude than ever before into gasoline and other fuels. The data spurred worries that fuel demand isn't sufficient to eat away at the global glut of oil, despite strong gasoline demand during the busy summer-driving season. Natural gas prices to remain on volatile path as weather conditions in US to give further direction to the prices. Overall it can move in the range of 155-195 in MCX. Natural-gas futures fell as weekly inventory report showing that supplies rose more than expected last week. U.S. natural-gas inventories grew by 99 billion cubic feet in the week ended July 10. Moderate weather and robust production in the first half of the summer have kept the market well-supplied, but above-normal temperatures in the next two weeks are expected to increase demand for gas-powered electricity to run air conditioners.
ENERGY COMPLEXSoybean futures (August) may trade sideways & consolidate in the range of 3400-3610 levels. This season the sowing pace of oilseeds has been the most, of which soybean has taken a lead as the area under cultivation is higher by 10% as compared to the previous year owing to favorable & timely rains over major producing regions. This year, the monsoon has been favorable in major producing states of Madhya Pradesh & Rajasthan; however, it is slightly less in Maharashtra. In days to come, if monsoon turns to be normal for the rest of the days during this month, then it is expected that the there would be record production of soybean this year. U.S soybean futures (November) will possibly continue to face resistance near 1050 levels. The counter is getting pressurized by investment fund selling tied to outlooks for drier weather in the United States and reduced export demand. In the current scenario, some investors also were selling soybeans and buying corn on the international markets. The short covering in CPO futures (July) is likely to face resistance near 440 levels. Refined soy oil futures (August) is likely to remain trapped in the bearish region within 570-585 levels. The gains in the edible oil counters may remain capped owing to higher supply situation in the domestic markets. As stated by the Solvent Extractors' Association of India, India's monthly requirement is about 16.0 lakh tons against which currently holding stock over 21.80 lakh tons equal to 41 days requirements. The Malaysian palm oil futures (October) is attracting bearish cues & remain below 2220 levels, pressurized by poor demand and expectations of increased output over the next two months. The oil palm trees are expected to enter peak seasonal production soon, yielding higher supplies of the tropical oil.
OIL AND OILSEEDS
OTHER COMMODITIES
Sugar futures (October) may face resistance near 2250 levels & remain trapped in the bearish zone owing to ample inventories. The activities at the spot markets are need-based due to sufficient stocks available at market level. The stockists are staying away from bulk inventory buying. Currently, Vashi market carries about 105-110 truck loads stocks. The downfall in mentha oil futures (July) might get capped as the counter will possibly take support near 950 levels. It is estimated that the overall production is still 70% lower from the previous year of 50,000 tonnes. Kapas futures (Apr) is expected to maintain its consolidation in the range of 905-935 levels. The market participants are cautious & closely watching the sowing progress along with the movement of monsoon. In the state of Gujarat, sowing has been completed on more than 85% of the total area, but the lower rains have raised concerns of the crop scenario. There are talks that if there are scarcity of rains is seen in days to come, then farmers may opt for re-sowing or shift to other crops. As reported by the Indian Meteorological Department, rains have been 48% lesser as compared to last year as on 13th July. Wheat futures (August) may find support above 1505 levels & remain as the procurement has picked up pace after the government relaxed quality norms for purchase of the grain. The government's wheat procurement in the 2015-16 marketing season has surpassed last year's level of 28 million tonnes with maximum contribution by Punjab, Madhya Pradesh and Haryana. It is reported that as on July 13th, a total of 28.08 million tonnes have been procured in various growing states.

11
TECHNICAL RECOMMENDATIONS
COMMODITY
ALUMINIUM MCX (JULY) contract closed at `106.90 on 16th July '15. The contract made its high of
`112.70 on 12th June'15 and a low of ̀ 102.70 on 8th July '15.The 18-day Exponential Moving Average of
the commodity is currently at ̀ 107.28
On the daily chart, the commodity has Relative Strength Index (14-day) value of 57.68.One can buy in
the range ̀ 105.80-105.00 with the stop loss of ̀ 103.50 for a target of ̀ 110.00.
NICKEL MCX (JULY) contract closed at 736.10 on 16th July '15. The contract made its high of 881 on
10th June'15 and a low of `666.80 on 8th July'15. The 18-day Exponential Moving Average of the
commodity is currently at ̀ 751.53
On the daily chart, the commodity has Relative Strength Index (14-day) value of 40.24. One can buy in
the range ̀ 715.00-705.00 with the stop loss of ̀ 690.00 for a target of ̀ 760.00.
` `
MENTHA OIL MCX (JULY) contract closed at 969.50 on 16th July '15. The contract made its high of
`1166 on 19th June'15 and a low of `934.70 on 27th May'15. The 18-day Exponential Moving Average of
the commodity is currently at ̀ 1018.50
On the daily chart, the commodity has Relative Strength Index (14-day) value of 37. One can buy in the
range Rs 960-950 with the stop loss of ̀ 925 for a target of ̀ 1015.
`
®
ALUMINIUM MCX (JULY)
NICKEL MCX (JULY)
MENTHA OIL MCX (JULY)
NOTES : 1) These levels should not be confused with the daily trend sheet, which is sent every morning by e-mail in the name of Daily report- commodities (Morning Mantra).
2) Sometimes you will find the stop loss to be too far but if we change the stop loss once, we will find more strength coming into the commodity. At the moment, the stop loss will be far as we are seeing the graphs on weekly basis and taking a long-term view and not a short-term view.
EXCHANGE COMMODITY CONTRACT CLOSING DATE TREND TREND RATE TREND SUPPORT RESISTANCE CLOSING
PRICE CHANGED CHANGED STOP/LOSS
NCDEX SOYABEAN AUG 3542.00 11.06.15 Down 3719.00 - 3600.00 3650.00
NCDEX JEERA AUG 16030.00 11.06.15 Down 16935.00 - 17000.00 17500.00
NCDEX CHANA AUG 4618.00 16.07.15 SIDEWAYS
NCDEX RM SEEDS AUG 4270.00 16.04.15 UP 3659.00 4000.00 - 3900.00
MCX MENTHA OIL JUL 969.50 12.03.15 UP 821.20 960.00 - 950.00
MCX CARDAMOM AUG 805.80 09.04.15 SIDEWAYS
MCX SILVER SEP 34504.00 16.07.15 Down 34504.00 - 37000.00 38000.00
MCX GOLD AUG 25771.00 16.07.15 Down 25771.00 - 26800.00 27000.00
MCX COPPER AUG 356.30 04.06.15 Down 381.35 - 370.00 375.00
MCX LEAD JUL 116.00 21.05.15 Down 125.20 - 120.00 122.00
MCX ZINC JUL 131.30 04.06.15 Down 137.15 - 135.00 137.00
MCX NICKEL JUL 736.10 21.05.15 Down 827.90 - 780.00 800.00
MCX ALUMINUM JUL 106.90 04.06.15 Down 110.70 - 110.00 112.00
MCX CRUDE OIL AUG 3297.00 16.07.15 Down 3297.00 - 3550.00 3650.00
MCX NATURAL GAS AUG 182.60 14.05.15 SIDEWAYS
TREND SHEET
Closing as on 16.07.15

COMMODITY
NEWS DIGEST
The spillover effect of brutal sell off in Chinese market was felt in the commodities prices resulting into CRB to hit below the strong support of 220, ignoring the development of Greece. The decline in the commodities futures market also indicates that the prices of the commodities are depended on the growth in the Chinese economy as China is the world's largest commodity consumer. In a positive development, Greece's parliament approved the austerity plan demanded by its lenders. In another historic event, Iranian nuclear agreement took place with the US and five other world powers and this deal has roiled the crude prices on the expectation that Iranian oil output would increase further. However, the supply of Oil from Iran would take time to flow and it would not have any market impact before next year, but given that the global petroleum market has an oversupply of about 2.5 million barrels per day. Crude traded weak whereas natural gas saw some upside. Gold hovered near its lowest level since March after Federal Reserve Chair Janet Yellen reiterated that a U.S. interest rate increase is likely this year. Silver was also in bearish Zone. Base metals performed mix as Beijing managed to halt panic selling in the Chinese equities. Furthermore, Chinese data released on Wednesday surprised on the upside, showing the economy expanded 7% year-on-year in the second quarter. Q2 GDP was a bit better than expected, the data for June were also noticeably better. Industrial output, which measures production at factories, workshops and mines, also rose 6.8% year-on-year in June.
In agri commodities, amid profit-booking at prevailing levels and fall in demand, mentha oil prices traded in negative territory. Farmers are slowly releasing their stock with higher prices. With sluggish demand from overseas buyers for oil, castor seed continued to trade weak. Good sowing conditions in Gujarat, Rajasthan and A.P have impacted inner tone negatively. Strength came up in chilli futures on improved export. Export demand increased for Teja variety from Bangladesh, Pakistan and Sri Lanka. Steady to weak sentiment witnessed in jeera futures on lower buying in spot market. Lower export buying reported due to non-availability of exportable variety of cardamom in the spot market. It kept the cardamom futures prices in bear territory. Edible oil and oil seeds counter moved up in total. Higher crush figures reported by NOPA and below average crop condition report by USDA coupled with wet weather in US has pushed up soybean complex prices internationally. Imports of palm oil by India in June 2015 rose by 23% to 1.02 million tonnes from 883,679 tons.
WEEKLY COMMENTARY
WEEKLY STOCK POSITIONS IN WAREHOUSE (NCDEX)
COMMODITY UNIT 16.07.15 DIFFERENCEQTY. QTY.
BARLEY MT 14070 13706 -364
CASTOR SEED MT 113754 115920 2166
CHANA MT 137682 133595 -4087
CORIANDER MT 35917 37701 1784
COTTON (29MM) BALES 0 0 0
GUARGUM MT 9004 9734 730
GUARSEED MT 16348 9571 -6777
JEERA MT 19941 18889 -1052
MAIZE MT 16770 16752 -18
RAPE MUSTARD SEED MT 64389 65542 1153
SUGAR MT 10040 13577 3537
TURMERIC MT 14413 14622 209
WHEAT MT 50278 49466 -812
08.07.15 COMMODITY UNIT 15.07.15 DIFFERENCE
QTY. QTY.
CARDAMOM MT 10.50 15.80 5.30
COTTON BALES 66400.00 50400.00 -16000.00
GOLD KGS 28.00 24.00 -4.00
GOLD MINI KGS 87.00 76.30 -10.70
GOLD GUINEA KGS 19.53 19.53 0.00
MENTHA OIL KGS 3893654.95 4202513.75 308858.80
SILVER (30 KG Bar) KGS 13753.79 9058.94 -4694.85
08.07.15
•China's economy expanded 7% in the second quarter.
•Rio Tinto posted a sharp rise in second quarter iron ore output from a year ago.
•ECB increased emergency funding for Greek banks, ending a freeze of almost three weeks.
•ICE Benchmark Administration will scrap a market convention dating back to 1919 that adds a "seller's premium" to its gold benchmark price for settlement purposes from January 2016.
•The Ministry of Agriculture launched 3 web portals viz. Soil Health Card portal, Fertiliser Quality Control System portal and Participatory Guarantee System portal.
•Special Margin of 10% (in Cash) on the Long side on all the running contracts and yet to be launched contracts in Coriander will be withdrawn with effect from July 21, 2015.
•The overall import of vegetable oils during Nov.'14 to June'15 is reported at 8,849,821 tons compared to 7,082,220 tons i.e. up by 25%. - Solvent Extractors' Association of India
•Government is set to procure 5,000 metric tonnes of arhar from Malawi in its effort to moderate the prices in the market.
•The government's wheat procurement in the 2015-16 marketing season as on July 13, has been a total of 28.08 million tonnes.
WEEKLY STOCK POSITIONS IN WAREHOUSE (MCX)
12
®
NCDEX TOP GAINERS & LOSERS (% Change) MCX TOP GAINERS & LOSERS (% Change)
1.991.80
1.621.44
1.17
-6.84 -6.83
-3.42
-2.72-2.37
-8.00
-7.00
-6.00
-5.00
-4.00
-3.00
-2.00
-1.00
0.00
1.00
2.00
3.00
CHANA BAJRA R M SEEDS CORIANDER SOYABEAN GOLD 100 NEW STEELLONG
SILVERHEDGE
CRUDE OIL BARLEY
3.85
3.27
2.94
2.252.07
-4.53
-3.12
-2.48-2.34
-0.67
-5.00
-4.00
-3.00
-2.00
-1.00
0.00
1.00
2.00
3.00
4.00
5.00
GOLD PETAL (DEL)
NICKEL MINI ZINC MINI NATURAL GAS LEAD MINI MENTHA OIL SILVER CRUDE OIL MINI GOLD GLOBAL COPPER
COMMODITY
COMMODITY EXCHANGE CONTRACT 16.07.15 CHANGE%
ALUMINIUM LME 3 MONTHS 1696.50 1716.00 1.15
COPPER LME 3 MONTHS 5590.00 5560.00 -0.54
LEAD LME 3 MONTHS 1792.00 1838.00 2.57
NICKEL LME 3 MONTHS 11260.00 11630.00 3.29
ZINC LME 3 MONTHS 2011.00 2072.00 3.03
GOLD COMEX AUG 1157.90 1143.90 -1.21
SILVER COMEX SEP 15.48 14.98 -3.21
LIGHT CRUDE OIL NYMEX AUG 52.74 50.91 -3.47
NATURAL GAS NYMEX AUG 2.77 2.85 3.03
10.07.15
PRICES OF METALS IN LME/ COMEX/ NYMEX (in US $)
WEEKLY STOCK POSITIONS IN LME (IN TONNES)
COMMODITY STOCK POSITION STOCK POSITION DIFFERENCE
09.07.15 16.07.15
ALUMINIUM 3552625 3526875 -25750
COPPER 328250 337525 9275
NICKEL 456744 453480 -3264
LEAD 169900 220625 50725
ZINC 461275 456350 -4925
INTERNATIONAL COMMODITY PRICES
COMMODITY EXCHANGE CONTRACT UNIT 10.07.15 16.07.15 CHANGE(%)
Soya CBOT NOV Cent per Bushel 1024.00 1011.00 -1.27
Maize CBOT DEC Cent per Bushel 434.75 441.00 1.44
CPO BMD OCT MYR per MT 2194.00 2191.00 -0.14
Sugar LIFFE OCT 10 cents per MT 372.80 361.50 -3.03
13
®
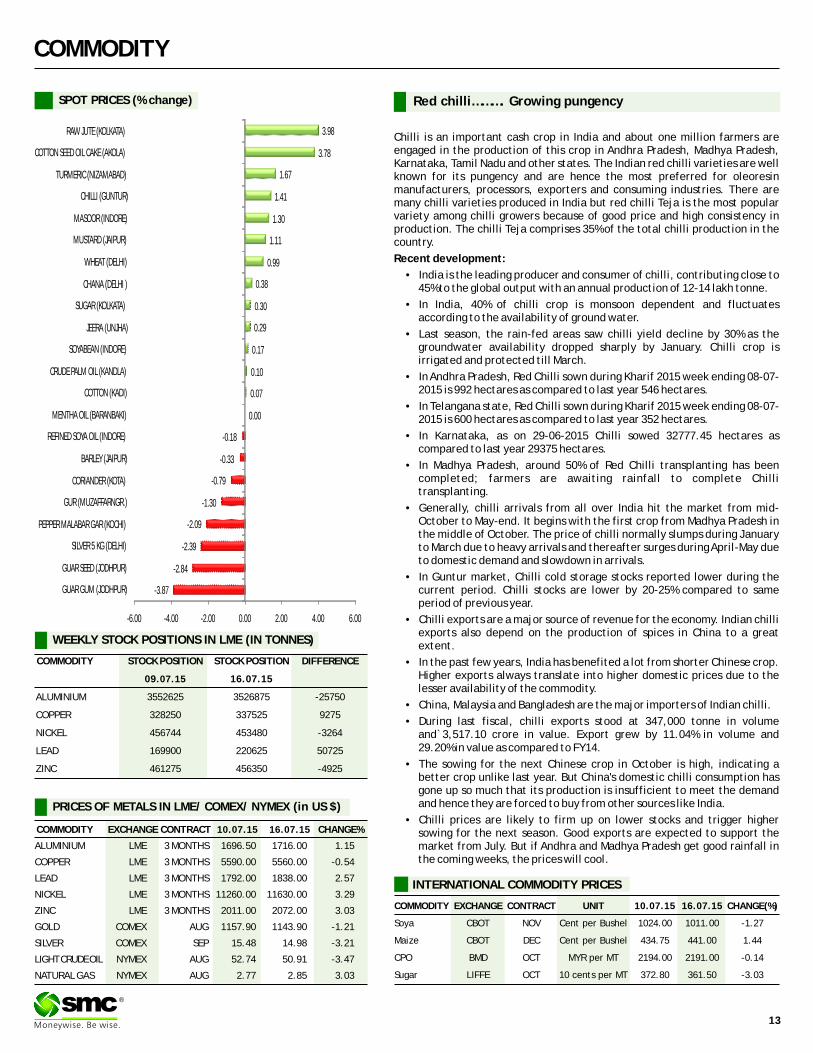
SPOT PRICES (% change) Red chilli………. Growing pungency
Chilli is an important cash crop in India and about one million farmers are engaged in the production of this crop in Andhra Pradesh, Madhya Pradesh, Karnataka, Tamil Nadu and other states. The Indian red chilli varieties are well known for its pungency and are hence the most preferred for oleoresin manufacturers, processors, exporters and consuming industries. There are many chilli varieties produced in India but red chilli Teja is the most popular variety among chilli growers because of good price and high consistency in production. The chilli Teja comprises 35% of the total chilli production in the country.
Recent development:
• India is the leading producer and consumer of chilli, contributing close to 45% to the global output with an annual production of 12-14 lakh tonne.
• In India, 40% of chilli crop is monsoon dependent and fluctuates according to the availability of ground water.
• Last season, the rain-fed areas saw chilli yield decline by 30% as the groundwater availability dropped sharply by January. Chilli crop is irrigated and protected till March.
• In Andhra Pradesh, Red Chilli sown during Kharif 2015 week ending 08-07-2015 is 992 hectares as compared to last year 546 hectares.
• In Telangana state, Red Chilli sown during Kharif 2015 week ending 08-07-2015 is 600 hectares as compared to last year 352 hectares.
• In Karnataka, as on 29-06-2015 Chilli sowed 32777.45 hectares as compared to last year 29375 hectares.
• In Madhya Pradesh, around 50% of Red Chilli transplanting has been completed; farmers are awaiting rainfall to complete Chilli transplanting.
• Generally, chilli arrivals from all over India hit the market from mid- October to May-end. It begins with the first crop from Madhya Pradesh in the middle of October. The price of chilli normally slumps during January to March due to heavy arrivals and thereafter surges during April-May due to domestic demand and slowdown in arrivals.
• In Guntur market, Chilli cold storage stocks reported lower during the current period. Chilli stocks are lower by 20-25% compared to same period of previous year.
• Chilli exports are a major source of revenue for the economy. Indian chilli exports also depend on the production of spices in China to a great extent.
• In the past few years, India has benefited a lot from shorter Chinese crop. Higher exports always translate into higher domestic prices due to the lesser availability of the commodity.
• China, Malaysia and Bangladesh are the major importers of Indian chilli.
• During last fiscal, chilli exports stood at 347,000 tonne in volume and`3,517.10 crore in value. Export grew by 11.04% in volume and 29.20% in value as compared to FY14.
• The sowing for the next Chinese crop in October is high, indicating a better crop unlike last year. But China's domestic chilli consumption has gone up so much that its production is insufficient to meet the demand and hence they are forced to buy from other sources like India.
• Chilli prices are likely to firm up on lower stocks and trigger higher sowing for the next season. Good exports are expected to support the market from July. But if Andhra and Madhya Pradesh get good rainfall in the coming weeks, the prices will cool.
-3.87
-2.84
-2.39
-2.09
-1.30
-0.79
-0.33
-0.18
0.00
0.07
0.10
0.17
0.29
0.30
0.38
0.99
1.11
1.30
1.41
1.67
3.78
3.98
-6.00 -4.00 -2.00 0.00 2.00 4.00 6.00
GUAR GUM (JODHPUR)
GUAR SEED (JODHPUR)
SILVER 5 KG (DELHI)
PEPPER MALABAR GAR (KOCHI)
GUR (MUZAFFARNGR.)
CORIANDER (KOTA)
BARLEY (JAIPUR)
REFINED SOYA OIL (INDORE)
MENTHA OIL (BARANBAKI)
COTTON (KADI)
CRUDE PALM OIL (KANDLA)
SOYABEAN (INDORE)
JEERA (UNJHA)
SUGAR (KOLKATA)
CHANA (DELHI )
WHEAT (DELHI)
MUSTARD (JAIPUR)
MASOOR (INDORE)
CHILLI (GUNTUR)
TURMERIC (NIZAMABAD)
COTTON SEED OIL CAKE (AKOLA)
RAW JUTE (KOLKATA)

CURRENCY
Currency Table
Currency Pair Open High Low Close
USD/INR 63.55 63.76 63.51 63.64
EUR/INR 70..43 71.28 69.16 69.31
GBP/INR 97.82 99.60 97.79 99.34
JPY/INR 52.16 52.29 51.29 51.33
(Source: Reliable Software, Open: Monday 9.00 AM IST, Close: Thursday (5.00 PM IST)
News Flows of last week
15th July China's economy grew an annual 7 percent in the second quarter15th July U.S. factory production failed to advance for a second straight
month in June15th July U.S. producer prices increased more than expected in June16th July Factory activity in the U.S. mid-Atlantic region expanded in July
at a slower pace than expected16th July The number of Americans filing new applications for
unemployment benefits fell more than expected last week16th July Dollar at seven-week high as Fed rate hike hopes grow16th July Europe moves to restore funding to Greece after bailout vote
EUR/INR (JULY) contract closed at 69.31 16thJuly'15. The contract made its high
of `71.28 on 13th July'15 and a low of `69.16 on 14th July'15 (Weekly Basis). The
14-day Exponential Moving Average of the EUR/INR is currently at ̀ 70.53.
On the daily chart, EUR/INR has Relative Strength Index (14-day) value of 35.73.
One can sell around 69.75 for a target of 68.75 with the stop loss of 70.30.
JPY/INR (JULY) contract closed at 51.33 on 16thJuly'15. The contract made its high
of 52.29 on 13th July'15 and a low of ̀ 51.29 on 16thJuly'15 (Weekly Basis). The 14-
day Exponential Moving Average of the JPY/INR is currently at ̀ 51.81.
On the daily chart, JPY/INR has Relative Strength Index (14-day) value of 39.72.
One can sell around 51.50 for a target of 50.50 with the stop loss of 52.10.
Market Stance
Indian rupee remained sideline during last week trading sessions on the back of mixed fundamentals. On one hand strong local equity markets supported the local currency as against dollar while on the other hand, sharp upside in greenback in overseas market kept the gains for rupee underneath. The dollar index rallied to a seven-week peak, with an easing in jobless claims reinforcing market expectations of a 2015 US interest rate hike. Moreover, the euro, which had inched up briefly after Greek legislators signed off on tough bailout terms, was beaten down against the dollar as doubts grew about whether the deal with creditors will work. Currency investors, who are less worried about Greece exiting the euro zone and about China's stock market, are now increasingly focused on economic fundamentals and interest rate outlooks. In other currencies, Sterling strengthened against Euro and witnessed its strongest level in 7-1/2-years, as traders bet the Bank of England will raise interest rates early next year while monetary policy remains ultra-loose in the euro zone.
EUR/INR
USD/INR (JULY) contract closed at ̀ 63.64 on 16th July'15. The contract made its
high of `63.76 on 14thJuly'15 and a low of `63.51 on 13thJuly'15 (Weekly Basis).
The 14-day Exponential Moving Average of the USD/INR is currently at ̀ 63.69.
On the daily chart, the USD/INR has Relative Strength Index (14-day) value of
45.31. One can sell below 63.50 for the target of 62.90 with the stop loss of 63.85.
GBP/INR (JULY) contract closed at 99.34 on 16th July'15. The contract made its
high of 99.60 on 15th July'15 and a low of `97.79 on 13th July'15 (Weekly Basis).
The 14-day Exponential Moving Average of the GBP/INR is currently at ̀ 99.17.
On the daily chart, GBP/INR has Relative Strength Index (14-day) value of 51.26.
One can sell below 98.50 for a target of 97.50 with the stop loss of 99.10.
`
USD/INRTechnical Recommendation
GBP/INR JPY/INR
Economic gauge for the next week
Date Currency Event PREVIOUS
22nd July GBP Bank of England Minutes
22nd July GBP BOE MPC Vote Hike 0
22nd July GBP BOE MPC Vote Unchanged 9
22nd July GBP Inflation Report Hearings
22nd July USD Housing Price Index (MoM) 0.3
22nd July USD Markit Services PMI 54.8
22nd July USD Markit PMI Composite 54.6
24th July EUR Markit Services PMI 54.4
24th July EUR Markit Manufacturing PMI 52.5
24th July EUR Markit PMI Composite 54.2
24th July USD Markit Manufacturing PMI 53.6
24th July USD New Home Sales (MoM) 0.546
24th July USD New Home Sales Change (MoM) 2.2
14
®

IPO
IPO NEWSIPO NEWS
Biocon sets price band for Syngene IPO at Rs 240-250/sh
Pharmaceutical firm Biocon has fixed a price band for an initial public offering of its subsidiary Syngene International at ̀ 240-250 per share. The public issue is going
to open for subscription on July 27 and will close on July 29. The research arm of biotechnology major Biocon has received the approval from capital markets regulator SEBI for IPO in June after filing draft red herring prospectus (DRHP) through its lead merchant banker Axis Capital in April. As per the prospectus, the company intends to sell 2.2 crore equity shares, including reservation of up to 20 lakh shares for Biocon shareholders, through an offer for sale. Of the total shares on offer, 50 percent portion of this IPO has been reserved for qualified institutional buyers, 15 percent for high net worth individuals and the rest for retail investors. In January, Biocon sold its 10 percent stake in Syngene for Rs 380 crore to IVF Trustee Company. Syngene offers integrated drug discovery and development services with capabilities in medicinal chemistry, biology, in vivo pharmacology and toxicology. It has a research team of 2,300 scientists.
Sebi seeks clarification on Coffee Day Enterprises' IPO
Markets regulator Sebi has sought clarification on the proposed `1,150-crore initial public offer (IPO) of Coffee Day Enterprises, which runs the country's biggest
coffee chain Cafe Coffee Day. Without disclosing details of clarifications sought, Sebi has said "clarifications (are) awaited from lead manager" for the proposed public issue. As per the latest weekly update of processing status of draft offer documents filed with the Securities and Exchange Board of India (Sebi), regulator has said clarifications were awaited on the proposed IPO of Coffee Day Enterprises as on July 10, 2015. The next update would be available on July 20. Sebi said that it might issue observations on Coffee Day Enterprises' IPO document within 30 days from the date of receipt of satisfactory reply from the lead merchant bankers to the clarification or additional information sought. The regulator had received the draft offer documents on June 26, this year through its lead manager Axis Capital
Viom Networks pushes back IPO plans to April 2016 as market turn sluggish
Telecom tower operator Viom Networks has decided to push back its initial public offering, or IPO, to March-April next year instead of December because market conditions are not as buoyant as they were two months ago, a company director said. Viom's board will meet in late August to take a final call on the IPO depending on prevailing market conditions. Viom was earlier mulling an IPO by December 2015 to fund growth plans, particularly after its talks to sell controlling stake to American Tower Corp (ATC) have failed over valuations. The company was looking to raise a shade over Rs 1,000 crore to fund tower site expansion amid surging carrier demand for data sites and open an exit route for stakeholders keen to cash out. Tata Teleservices holds 54% in Viom while Kolkata-based Srei own 18.5%. The balance shares are held by a clutch of private equity firms such as Macquarie SBI Infrastructure, GIC Investments, IDFC Private Equity and Funderburk Mauritius (Oman Investment Fund. With more than 42,000 towers, Viom posted profit before tax of about ̀ 250 crore on revenues of more than ̀ 5,000 crore for the year ended March. It plans to add more
than 2,000 towers this fiscal year.
Freshdesk plans for IPO, readies for mobile era
Customer support software maker Freshdesk, which is backed by funds such as Google Capital and Tiger Global, said it may soon launch an IPO, an announcement that signals the coming of age of enterprise startups in India. Founded in 2010, the Chennai-based company provides customer help-desk software for large and small companies alike.
Infibeam To Raise $71 Million In India's First E-Commerce IPo filing
Infibeam, the Ahmedabad-based eCommerce portal recently filed for an IPO earlier this week to raise about $71 million. The filing revealed several other factors too, including Infibeam's incurred losses to the tune of ̀ 25.95 crore for the financial year ended March 31, 2014, up from ̀ 24.9 crore in the fiscal 2013 and ̀ 10.8 crore in
the fiscal 2012. The company is looking to raise about $70 Million (?450 crore) through IPO. It had filed draft papers with the Securities & Exchange Board of India (SEBI) and Draft Red Herring Prospectus which offers shares of Rs 10 each for cash. It has proposed to list its shares on the NSE and BSE. With this, Infibeam has become the first Indian e-commerce company to launch an IPO, a recognizable feat in itself. Under this public offering, at least 75 per cent of shares would be allotted on a proportionate basis to Qualified Institutional Investors, while up to 60 per cent of this portion can be given to Anchor Investors on a discretionary basis. Founded in 2007 by Vishal Mehta, Infibeam started as an online automobile retailer but then ventured out into selling products across categories such as mobiles, accessories, books, camera, watches, etc. It has more than 1300 employees in its offices around Ahmedabad, Mumbai, Delhi and Bangalore.
After L&T Infotech, L&T Technology Services in IPO queue
L&T Technology Services, the industrial product solutions arm of Larsen & Toubro is next in the IPO line in the L&T group after its services firm L&T Infotech.
IPO TRACKER
Manpasand Bever. Beverages 1697.83 400.00 9-Jul-15 320.00 291.00 328.15 2.55
PNC Infratech Infrastructure 2139.02 488.44 26-May-15 378.00 381.00 416.90 10.29
UFO Moviez Entertainment 1595.94 600.00 14-May-15 625.00 600.00 616.25 -1.40
MEP Infrast. Infrastructure Dev. 1004.68 324.00 6-May-15 63.00 63.00 61.80 -1.90
VRL Logistics Logistics 3259.22 473.88 30-Apr-15 205.00 288.00 357.20 74.24
Inox Wind Capital Goods 9964.13 450.76 9-Apr-15 325.00 400.00 449.00 38.15
Ortel Comm. Indian Media & Ent. 564.80 217.20 19-Mar-15 200.00 181.00 186.00 -7.00
Monte Carlo Fashions Textile & Apparel Ind. 1184.40 350.43 19-Dec-14 645.00 585.00 545.00 -15.50
Shemaroo Ent. Entertainment 714.62 120.00 1-Oct-14 170.00 180.00 262.90 54.65
Sharda Cropchem Agro Chemical 3161.78 351.86 23-Sep-14 156.00 254.10 350.45 124.65
Snowman Logistic Miscellaneous 1705.69 197.40 12-Sep-14 47.00 78.75 102.10 117.23
Wonderla Holidays Entertainment 1509.70 181.25 9-May-14 125.00 164.75 267.20 113.76
Just Dial service provider 7848.66 950.11 5-Jun-13 530.00 590.00 1113.40 110.08
Company Sector M.Cap(In `Cr.) Issue Size(in `Cr.) List Date Issue Price List Price Last Price %Gain/Loss(from Issue price)
*
*Closing prices as on 16-07-2015®
15

16
®

INSURANCE
®
HDFC Life YoungStar Udaan is a traditional participating insurance plan. This
plan is ideal for parents who wish to make provision for:
• Academic expenses that occur prior to college education
• Specific goals like college fees or marriage expenses etc
• All miscellaneous and extracurricular expenses that occur during
college/school
Key Benefits
• Three Maturity benefit options to choose from based on which your
survival/maturity benefits payable are decided
1. Aspiration (Endowment benefit) lumpsum payout at maturity
2. Academia (Moneyback benefit) payouts during last 5 policy years
with first guaranteed payout higher than subsequent guaranteed
payouts
3. Career (Moneyback benefit) payouts during last 5 policy years with
last guaranteed payout higher than previous guaranteed payouts
• Two Death Benefit options to choose from based on which death
benefit payable are decided
Classic: Policy Terminates after payment of death benefit
Classic Waiver: Policy continues after payment of death benefit + Future
Premiums waived
Guaranteed Additions
Guaranteed Additions shall accrue for the first 5 policy year, if your
premium payment term is 10 years or above, provided the policy is in force.
The accrued Guaranteed Additions are payable at maturity. Guaranteed
Additions accrue at the end of policy year. Over and above declared
bonuses.
Policy Term Guaranteed Additions (% of Sum Assured on Maturity)
19 years 3% p.a. for first 5 policy years, nil thereafter
20 years 5% p.a. for first 5 policy years, nil thereafter
How does the plan work?
Choose from the 3 maturity benefits at inception based on the financial
goals of your child
Aspir ation
Policy conti nues af ter the payment of death benefi t + future premium waived
Premium Paymen t Term of 7,10 of poli cy term minus 5 years
100% of SA + GA + Bonuses
Policy Matur ity
2 Death Benefi t Options to choose from:
Policy terminates af ter the payment of death benefi t
•Classi c •Classi c waiver:
Academ iaPremium Paymen t Term of 7,10 of poli cy term minus 5 years
100% of SA + GA + Bonuses
Policy Matur ity
CareerPremium Paymen t Term of 7,10 of poli cy term minus 5 years
100% of SA + GA + Bonuses
Policy Matur ity
Policy conti nues af ter the payment of death benefi t + future premium waived
2 Death Benefi t Options to choose from:
Policy terminates af ter the payment of death benefi t•Classi c
•Classi c waiver:
Policy conti nues af ter the payment of death benefi t + future premium waived
2 Death Benefi t Options to choose from:
Policy terminates af ter the payment of death benefi t•Classi c
•Classi c waiver:
Policy Sarts
Policy Sarts
Policy Sarts
HDFC LIFE YOUNGSTAR UDAAN – CHILD PLAN
Disclaimer: Insurance is the subject matter of solicitation.
17

18
MUTUAL FUND Performance Charts
Returns (%) Risk Market Cap (%)
Scheme Name NAV Launch QAAUM 3M 6M 1Y 3Y Since Std.Dev Beta Jenson LARGE MID SMALL DEBT &
(`) Date (` Cr.) Launch CAP CAP CAP OTHER
SBI Small & Midcap Fund - Growth 32.58 09-Sep-2009 354.08 4.15 11.44 61.15 44.18 22.36 2.49 0.80 0.67 4.94 49.04 32.69 13.33
DSP BlackRock Micro Cap Fund - Reg - G 42.06 14-Jun-2007 1972.31 0.15 11.27 52.44 39.74 19.42 2.65 0.83 0.71 N.A 76.97 14.04 8.99
SBI Magnum Midcap Fund - Growth 61.68 29-Mar-2005 972.47 3.87 12.75 46.01 41.35 19.31 2.23 0.76 0.62 14.08 67.07 8.26 10.59
Kotak Emerging Equity Scheme - Reg - G 26.96 30-Mar-2007 673.47 1.19 6.56 44.87 33.53 12.69 2.32 0.90 0.53 21.88 59.64 11.12 7.36
Mirae Asset Emerging Bluechip Fund - G 31.30 09-Jul-2010 729.38 3.48 8.54 43.43 39.31 25.51 2.29 0.84 0.58 33.05 61.84 2.20 2.91
Sundaram SMILE Fund - Reg - Growth 72.17 15-Feb-2005 1038.27 -1.98 3.93 42.81 34.75 20.89 3.17 1.15 0.61 1.88 71.82 24.18 2.12
Tata Mid Cap Growth Fund - Plan A - G 106.62 01-Jul-1994 459.49 0.45 9.43 42.62 35.88 11.90 2.54 0.93 0.52 21.87 64.35 8.22 5.56
EQUITY (Diversified)
INCOME FUND
Note: Indicative corpus are including Growth & Dividend option. The above mentioned data is on the basis of 16/07/2015Beta, Sharpe and Standard Deviation are calculated on the basis of period: 1 year, frequency: Weekly Friday, RF: 7%
ULTRA SHORT TERM
SHORT TERM FUND
Due to their inherent long term nature, the following 3 categories have been sorted on the basis of 1 year returns
Due to their inherent short term nature, Short term funds and Ultra short term funds have been sorted on the basis of 6month and 3month returns respectively
Returns (%) RiskAverage Yield till
Scheme Name NAV Launch QAAUM Since Std. SharpeMaturity (Days) Maturity
1W 2W 1M 6M 1Y 3Y(`) Date (`Cr.) Launch Dev.
Pramerica Dynamic Bond Fund - Growth 1,329.25 12-Jan-2012 271.17 (9.55) 8.48 10.69 3.72 13.40 8.19 8.45 25.77 0.04 3,412.75 7.91
ICICI Prudential LTP - Prem - Growth 16.61 13-Jan-2010 633.96 (20.61) 4.31 16.66 1.57 12.54 11.75 9.65 25.16 0.24 6,591.89 8.15
ICICI Prudential Income Oppo. Fund - G 19.63 18-Aug-2008 2,549.69 6.09 7.22 11.57 4.44 12.27 9.60 10.25 34.52 0.05 2,412.64 8.53
IDFC D B F - Reg - Growth (Re-Launched) 16.87 03-Dec-2008 5,945.57 (18.67) 2.04 15.55 1.34 12.20 9.38 8.22 40.65 0.03 6,007.89 8.13
Sundaram Fle. Fund - Fle. Income - Reg - G 19.59 30-Dec-2004 359.41 5.70 7.79 11.22 3.99 12.06 7.50 6.58 38.11 0.04 2,690.05 8.64
ICICI Pru. Dynamic Bond Fund - Prem Plus - G 15.97 14-Jan-2010 987.48 1.24 7.33 13.93 3.89 12.01 9.62 8.88 36.48 0.06 3,095.20 8.01
Franklin India Dynamic Accrual Fund - G 48.16 05-Mar-1997 1,098.63 11.39 12.87 13.13 8.72 11.93 9.06 8.93 33.57 0.05 1,262.90 11.78
Annualised
Returns (%) Risk Average Yield tillScheme Name NAV Launch QAAUM Since Std. Sharpe Maturity (Days) Maturity
1W 2W 1M 6M 1Y 3Y(`) Date (`Cr.) Launch Dev.
Taurus Short Term Income Fund - Reg - G 2514.61 23-Aug-2001 271.83 8.80 8.80 8.73 9.01 9.40 9.86 6.86 1.14 2.07 47.45 N.A
IDFC Banking Debt Fund - Reg - Growth 12.27 07-Mar-2013 1273.77 8.42 8.61 8.68 8.98 9.02 N.A 9.08 7.05 0.23 247.00 8.00
Sundaram Flexible Fund - ST - Reg - G 22.57 30-Dec-2004 1516.34 8.12 8.54 8.70 8.80 8.96 9.02 8.02 6.83 0.23 251.85 7.94
Reliance Medium Term Fund - Growth 29.64 14-Sep-2000 2940.94 8.94 9.17 9.06 8.78 9.19 8.97 7.59 7.14 0.22 398.00 8.69
HDFC Short Term Plan - Growth 27.75 28-Feb-2002 2528.27 10.81 11.72 11.23 8.76 10.71 9.34 7.92 11.59 0.18 803.00 10.10
Birla Sun Life Medium Term Plan - Reg - G 17.44 25-Mar-2009 4045.47 6.46 10.34 12.34 8.71 10.89 10.78 9.21 12.11 0.23 N.A 10.39
HDFC Short Term Opportunities Fund - G 15.61 25-Jun-2010 4299.98 8.33 10.24 10.00 8.39 9.97 9.40 9.20 10.68 0.19 631.45 8.47
Annualised
Returns (%) Risk Average Yield tillScheme Name NAV Launch QAAUM Since Std. Sharpe Maturity (Days) Maturity
1W 2W 1M 3M 1Y 3Y(`) Date (`Cr.) Launch Dev.
IDFC M. M. - Tre. Plan - Plan C - G (Re-Launched) 16.90 06-Oct-2008 1526.33 25.42 17.22 12.60 9.86 8.90 8.85 8.05 3.51 0.44 210.00 8.35
DWS Low Duration Fund - Growth 14.96 06-Nov-2006 38.19 10.06 10.11 10.38 9.37 9.25 8.86 4.74 8.93 0.17 438.00 9.82
Kotak Low Duration Fund - Ret - Growth 1763.11 06-Mar-2008 322.29 10.63 10.04 9.81 9.16 10.23 8.62 8.00 9.46 0.13 259.15 8.95
Franklin India Low Duration Fund - G 15.78 26-Jul-2010 3387.74 9.93 10.62 10.53 9.15 10.02 9.80 9.60 4.32 0.57 372.30 10.21
Principal Debt Opp. Fund - Cor. Bond Plan - G 2206.07 14-Sep-2004 199.90 8.47 8.51 8.80 9.11 9.81 8.73 7.57 9.53 0.15 51.00 9.09
Taurus Ultra ST Bond Fund - Reg - G 1726.22 01-Dec-2008 149.81 8.48 8.37 8.69 9.07 9.50 9.73 8.59 2.91 0.80 43.80 N.A
Birla Sun Life Savings Fund - Ret - DAP 158.09 23-Jun-2009 9460.85 10.14 9.94 9.10 9.04 9.42 9.15 7.84 4.05 0.51 N.A 8.47
Annualised
®
BALANCED
Returns (%) Risk Market Cap (%)
Scheme Name NAV Launch QAAUM 3M 6M 1Y 3Y Since Std.Dev Jenson LARGE MID SMALL DEBT &
(`) Date (` Cr.) Launch CAP CAP CAP OTHER
Franklin India Balanced Fund - Growth 93.00 10-Dec-1999 458.14 1.35 5.25 30.04 23.81 15.36 1.55 0.24 55.91 10.27 N.A 33.82
Tata Balanced Fund - Plan A - Growth 173.84 08-Oct-1995 3267.77 0.09 6.96 29.21 25.80 17.35 1.72 0.28 46.31 25.83 0.91 26.95
DSP BlackRock Balanced Fund - Growth 112.34 27-May-1999 661.95 1.97 4.82 27.35 20.39 16.16 1.78 0.21 38.87 26.17 2.65 32.31
L&T India Prudence Fund - Growth 19.75 07-Feb-2011 420.47 0.26 5.02 25.74 25.22 16.57 1.52 0.30 43.17 21.87 2.92 32.04
Canara Robeco Balance - Growth 115.89 01-Feb-1993 327.47 0.36 3.97 24.83 21.67 11.70 1.87 0.23 33.15 33.92 5.49 27.44
SBI Magnum Balanced Fund - Growth 97.24 09-Oct-1995 1836.76 -0.16 4.54 24.58 26.04 16.99 1.55 0.28 30.47 25.84 7.17 36.52
Birla Sun Life 95 - Growth 574.45 10-Feb-1995 1456.18 0.58 2.48 23.33 23.39 21.92 1.70 0.24 47.45 23.82 N.A 28.74

Mr. S C Aggarwal (CMD, SMC Group) along with Mrs. Maneka Sanjay Gandhi (Hon'ble Minister for Women & Child Development, GOI) during conference on "Women at Workplace" organized by Assocham on 8th July, 2015 at Hotel Royal Plaza, New Delhi.
Blood Donation Camp organized at SMC Corporate office, New Delhi in association with Lions Club Shakti

Investment in securities & commodities market are subject to market risk • All insurance products sold through SMC Insurance Brokers Pvt. Ltd. • Investment Banking Services provided by SMC Capitals Ltd. • Equity PMS and Wealth management services provided by SMC Investments & Advisors Ltd. • IPOs and Mutual Funds distribution service is provided by SMC Global Securities Ltd. • Financing Services provided by Moneywise Financial Services Pvt Ltd. • Insurance is the subject matter of solicitation • Commodity broking services provided by SMC Comtrade Ltd. • Real Estate Advisory services are offered through SMC Real Estate Advisors Pvt. Ltd. • Award sources: Best Financial Services Provider given to SMC Comtrade Ltd.• Property Consultant of the year (residential) given to SMC Real Estate Advisors Pvt. Ltd. •ABP News Real estate award 2015• Zee Business Market Analyst Awards 2014 • Assocham - Excellence Awards 2015 • BSE-D&B Equity Broking Awards 2014,2013 & 2012 • Assocham SME Excellence Awards 2014 • Bloomberg-UTV Financial Leadership Awards 2012.
NSE INB/INF/INE 230771431, BSE INB/INF/INE 011343937, MSEI INB/INF 260771432 INE 260771431, USEL INE 271343936, CDSL IN-DP-CDSL-583-2010, NSDL IN-DP-NSDL-333-2010 (SMC Global Securities Ltd.) NCDEX: NCDEX/TCM/CORP/0131, MCX: MCX/TCM/CORP/0385, MCX MEMBER ID: 8200, NMCE: NMCE/TCM/CORP/0215, ICEX: ICEX/TCM/CORP/009, ACE: ACEL/CM/CORP/0267, UCX: 210001 (SMC Comtrade Ltd.), PMS INP000003435 (SMC Investments and Advisors Ltd.), IRDAI Regi: No: DB 272/04 License No. 289 (SMC Insurance Brokers Pvt. Ltd.) , Merchant Banker INM000011427 (SMC Capitals Ltd.), Client must read Risk Disclosure Document (RDD) & Do's and Don'ts before investing is included in the content of the Advertisement.