Embed Size (px)
Citation preview

THE LANDSCAPE OF
Giving Circles/Collective Giving Groups in the U.S.
2016
Written and Researched by the Collective Giving Research Group:
Jessica BearmanPrincipal, Bearman Consulting
Julia Carboni, Ph.D.Assistant Professor, Maxwell School of Citizenship and Public Affairs, Syracuse University
Angela Eikenberry, Ph.D.David C. Scott Diamond Alumni Professor of Public Affairs, School of Public Administration, University of Nebraska at Omaha
Jason Franklin, Ph.D. W.K. Kellogg Chair in Community Philanthropy, Dorothy A. Johnson Center for Philanthropy, Grand Valley State University
AcknowledgmentsThis research was completed with funding from the Bill & Melinda Gates Foundation, via the Women’s Philanthropy Institute at the Indiana University Lilly Family School of Philanthropy, and from the Charles Stewart Mott Foundation. The findings and conclusions contained within are those of the authors and do not necessarily reflect official positions or policies of the Bill & Melinda Gates Foundation or the Charles Stewart Mott Foundation.
Special thanks to our fantastic advisory group and research assistants: Sarah Deming, Kolby Cole, and Kathryn Clarkin.
For questions, media inquiries or other comments, please email the research team at [email protected].
© Giving Circles Research Group, November 2017

TABLE OF CONTENTS
EXECUTIVE SUMMARY 4
Number, Age, and Location of GCs 5
Composition of GCs 5
Giving by GCs 6
Beneficiaries of GCs 7
Structure and Operations of GCs 7
INTRODUCTION 9
METHODOLOGY 11
FINDINGS 12
Number of GCs 12
Member Composition 14
Number of People 14
Types of People 14
Amounts Given and Raised 21
Overall Giving by GCs 21
Amounts Given per Member 21
Other Ways GCs Support Beneficiaries 22
Issue Areas and Populations Supported 24
Structure and Operations 26
Membership Structure 26
Where and How Often GCs Meet 26
Time Commitment 26
How Funding Decisions Are Made 27
Membership in Networks of GCs 27
Legal Status and Staffing 28
Activities 29
DISCUSSION AND CONCLUSION 32
REFERENCES 34
APPENDIX A: LANDSCAPE SURVEY QUESTIONS 35
APPENDIX B: GIVING CIRCLES BY STATE 44

4 The Landscape of Giving Circles/Collective Giving Groups in the U.S., 2016
Giving circles and other forms of collective giving (hereafter referred to as GCs) have grown significantly in visibility and popularity over the past 15 years. Often started by donors, they are widely understood to be highly flexible, democratic, do-it-yourself vehicles for giving. Previous research has illuminated the positive impact that participation has on the giving and civic engagement of donors. Until recently, however, our understanding of the scope and scale of GCs was 10 years out of date!
This research presents an updated understanding of the current landscape of GCs and similar models of collective giving or giving collaboratives in the United States. This research comprises the first of a three-part inquiry, which also looks at research underway related to the impact of participation in GCs on donor giving and civic engagement, and a study of the relationships between GCs and their hosting organizations.
This initial inquiry examined current models or structures and activities or compositions of GCs in the U.S., addressing the following questions:
1. How many GCs exist in the U.S., when were they founded, and where are they located?
2. What is the composition of GCs in the U.S.? How many and what types of people participate?
3. How much has been given by GCs in the U.S.?
4. What areas, issues, or populations are supported by GCs in the U.S.?
5. What structures or models exist in the U.S.?
6. To what extent do community foundations or other institutions host GCs in the U.S.?
EXECUTIVE SUMMARY

5Collective Giving Research Group
1. How many GCs exist in the U.S., when were they founded, and where are they located?
2. What is the composition of GCs in the U.S.? How many and what types of people participate?
3. How much has been given by GCs in the U.S.?
4. What areas, issues, or populations are supported by GCs in the U.S.?
5. What structures or models exist in the U.S.?
6. To what extent do community foundations or other institutions host GCs in the U.S.?
To address these questions, we gathered data in two steps: First, we created a database of GCs based on secondary data from previous studies and a web-based search to document existing GCs. Then, we surveyed GCs using the database contacts. The survey included questions about operations, structure, and composition of GCs. A total of 358 GCs responded to the survey, giving us a response rate of 33 percent of active
GCs in our database. A summary of our key findings is below.
Number, Age, and Location of GCsWe found a significant expansion of the number of GCs. Our research identified 1,087 independently run and currently active GCs, along with 525 GC chapters that are part of different GC networks and programs. The number of GCs has more than tripled since the last landscape study, conducted in 2007 by Jessica Bearman for the Forum of Regional Associations of Grantmakers (now the United Philanthropy Forum). About half of the GCs were formed since 2010. GCs are found in all 50 states and the District of Columbia. We also identified 13 nationwide GCs and nine that are organized online.
Composition of GCs
We estimate that GCs have engaged at least 150,000 people since their inception. The average number of members is 116, the median number is 50, and the most common number of members is 100. Our findings suggest that GCs are engaging more people overall, and more people on average per group, than was found in previous studies.
Compared to previous research, the number of identity-based groups is also growing. At the same time, while there is diversity across groups, there is not a great deal of diversity within groups. We found that about 60 percent of GCs are formed around a particular identity. Consistent with past research by Bearman and by Rutnik and Bearman, women’s GCs remain the most common type (48.5 percent of our database) and women continue to be the majority of participants in GCs. However, there has been growth in the number of men-only GCs and ones organized by LGBTQ groups. We found 45 men-only groups and 24 LGBTQ groups.
The number of GCs has more than tripled since the last landscape study.

6 The Landscape of Giving Circles/Collective Giving Groups in the U.S., 2016
We also identified a larger number of Jewish (106), Asian/Pacific Islander (53), African American (40), and Latino/a (19) groups. The survey indicated that in 83.7 percent of GCs, more than half of the members are white; about 65 percent of groups reported at least one African American/Black or Latino/Hispanic member and about 55 percent had at least one Asian/Pacific Islander member.
Several GCs were associated with specific age groups, such as young professionals (64 groups), youth (15), and teens (7). Our findings suggest that there are a growing number of younger members in GCs; however, the majority remain in the 45-to-64 age range.
Giving by GCsIn 2016, survey respondents (approximately 33 percent of the GCs identified) raised $30.1 million and gave $27.7 million. Our database shows GCs have given at least $375.25 million since inception (data are available for only 37 percent of groups). If we extrapolate to all of the groups in our database, based on the average, GCs have given as much as $1.29 billion since inception. Ten years ago, Bearman estimated that 145 GCs had granted nearly $65 million.
The minimum dollar amounts required from members to vote on funding recipients (per event or year) ranges dramatically, from $4 to $2 million. The average donation amount is $1,312; the most frequent donation level is $400. Compared to earlier studies, our findings suggest that the average and most frequent amount given by members per group may be decreasing. In the survey, nearly three-quarters of GCs had one level of giving, while 14 percent had multiple fixed giving levels.
We also found GCs to be highly engaged with funding recipients beyond financial support. In 52 percent of groups, GC members participate in organized volunteer activities; 48 percent reported that members provide additional money outside of the group; 45 percent reported board-level involvement in grantee organizations; 38 percent provide fundraising support such as introducing the organization to other donors; and 31 percent provide technical support.
About 50 percent of GCs indicated that they received outside funding from a variety of sources, including individual donors who are not members of the group; foundations or corporations; and GC host or parent organizations.
Giving circles have given as much as $1.29 billion since inception.

7Collective Giving Research Group
Beneficiaries of GCsConsistent with findings from earlier studies, our survey found GCs give primarily in the areas of human services (55 percent of respondents), women and girls (53 percent), and education (52 percent). The issue areas least likely to receive support were international affairs (7 percent) and religious-related causes (11 percent).
In the landscape survey, we found that 84 percent of GCs made at least some grants in their local area. Another 9 percent made grants within the state, and 8 percent made multi-state grants. Some GCs also made national (6 percent) and international grants (11 percent). Four GCs made tribal grants. These findings are similar to earlier data. Less than a quarter of survey respondents reported that their GCs retained funds to build an endowment.
Structure/Operations of GCsThree-quarters of GCs reported having constant memberships, while relatively few groups have memberships that either are intermittent (7 percent) or a mixture of constant and intermittent (17 percent). Two-thirds of groups reported that they meet only in person; one-quarter reported using a mix of in-person and online meetings. A small number met only online or not at all. For GCs that do meet, two-thirds reported meeting at least quarterly.
Among GCs reporting membership-length requirements, 68 percent required a one-year commitment. In about 50 percent of the surveyed groups, members vote on who should receive funding; in about 20 percent of groups, members decide by consensus; and in a little more than 10 percent of groups, decisions are made by a committee or by nomination. Several GCs have other procedures for deciding on funding recipients, most of which involve some sort of committee structure. Earlier research by Bearman found that about 40 percent of GCs selected funding recipients by consensus and 30 percent cast votes, suggesting that there may be a shift toward voting and away from consensus in decision-making.
In our database, 45 percent of groups are in a GC network or alliance that helps to initiate GCs and support their efforts. Very few networks or alliances of GCs existed when previous research was conducted; they have proliferated in the past 10 years, with 25 networks of various sizes and structures operating around the country.

8 The Landscape of Giving Circles/Collective Giving Groups in the U.S., 2016
In addition, about the same percent (42 percent) of GCs are hosted or have a relationship with a hosting organization. Most of the GCs reporting that they had a fiscal sponsor or institutional host are hosted by a community foundation. Bearman found in previous research that most GCs (68 percent of 160 groups surveyed) had a host organization that provided at least a basic level of service and that half of hosts were community foundations. In addition, according to our survey, about half of GCs have paid staff.
Finally, beyond giving money, we found – similar to earlier studies – that GCs provide ample activities and learning opportunities for members. In particular, a large number of GCs provide social activities (64 percent) and networking opportunities (52 percent) with other GC members, as well as discussions about funding recipients or issues (58 percent) and site visits (41 percent). Only a few groups conduct policy advocacy/lobbying, leadership training, or discussion of readings.

9Collective Giving Research Group
The purpose of this research is to better understand the current landscape of giving circles (GCs) and similar models of collaborative giving in the United States. GCs and collaboratives entail groups of individuals who collectively donate money and sometimes unpaid time to support organizations or projects of mutual interest. Importantly, members have a say in how funding is given and which organizations or projects are supported. GCs also provide a structure through which members may conduct collective research on potential funding beneficiaries and learn about grantmaking and community issues. They typically include a meaningful degree of social interaction and learning (Eikenberry and Bearman, 2009). For this reason, GCs have been described as “do-it-yourself” philanthropic vehicles, through which members pool donations and decide together where these are to be granted. Because individual donation requirements vary depending on the GC – many of which are quite modest – they provide avenues for people without substantial means to participate in significant giving. As a result, GCs are often described as a way of democratizing philanthropy.
By every indication, GCs are growing in popularity in the U.S. and around the world. Since the United Philanthropy Forum (previously the Forum of Regional Associations of Grantmakers) began to track GCs in the U.S. in 2004 (Rutnik and Bearman, 2005), the number identified had more than doubled to more than 500 groups by 2008 (Eikenberry and Bearman, 2009). Dean-Olmsted, Bunin Benor, and Gerstein (2014) estimated that one in eight American donors had participated in a GC. We know that considerable growth is taking place, but it has been nearly a decade since the last systematic scan of GC activity in the U.S. (Bearman, 2007b). Newer research has studied particular GC networks (Brousseau and Ramos, 2014) or is in progress, but does not examine the field as a whole. Additionally, recent research examines the impact of participating in GCs in the U.S., but does not examine the landscape of various models of GCs (Dean-Olmsted et al., 2014) or the variety of new models to emerge in the U.S. in recent years.
Given these areas of opportunity for further understanding, this landscape study describes the scope and scale of GCs and examines the current models or structures and activities or compositions of GCs in the U.S.
INTRODUCTION
Giving circles are often described as a way of democratizing philanthropy.
10 The Landscape of Giving Circles/Collective Giving Groups in the U.S., 2016
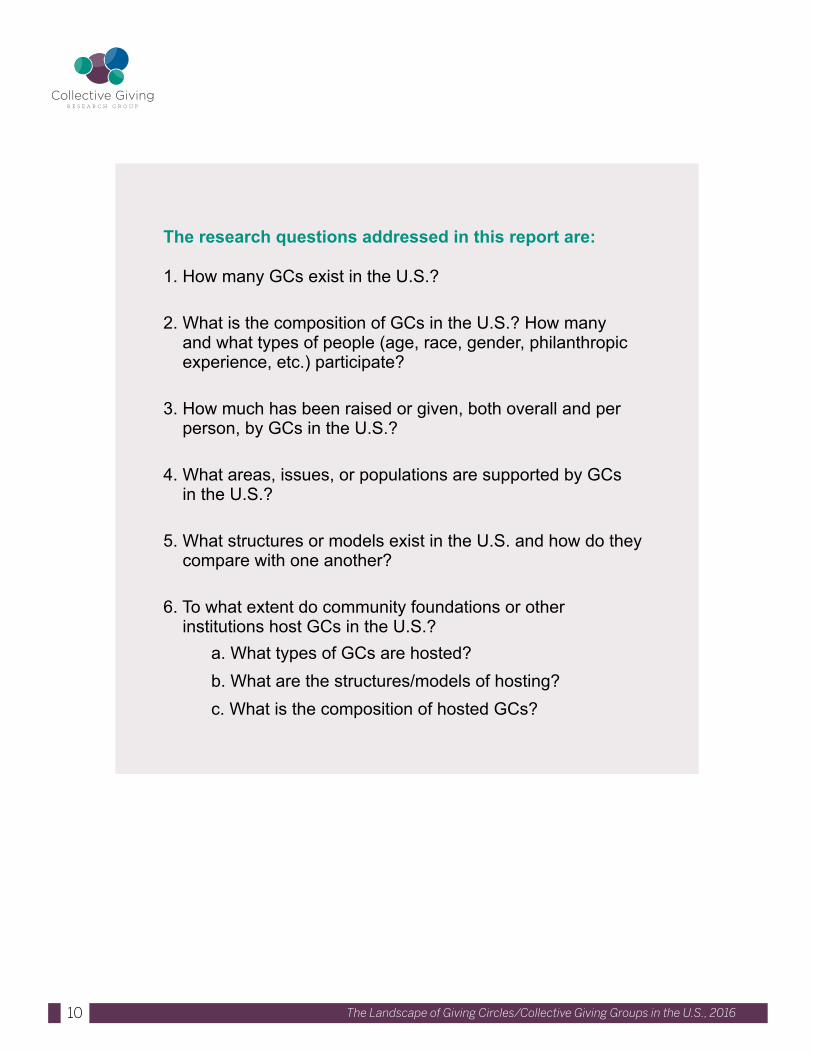
The research questions addressed in this report are:
1. How many GCs exist in the U.S.?
2. What is the composition of GCs in the U.S.? How many and what types of people (age, race, gender, philanthropic experience, etc.) participate?
3. How much has been raised or given, both overall and per person, by GCs in the U.S.?
4. What areas, issues, or populations are supported by GCs in the U.S.?
5. What structures or models exist in the U.S. and how do they compare with one another?
6. To what extent do community foundations or other institutions host GCs in the U.S.? a. What types of GCs are hosted? b. What are the structures/models of hosting? c. What is the composition of hosted GCs?

11Collective Giving Research Group
To inform our research and ensure its effectiveness, we formed an advisory group composed of individuals with expertise in GCs and/or conducting research – particularly research related to giving and collective giving.
We gathered data to address research questions in two steps. First, we created a database of GCs based on secondary data from previous studies and a new, web-based search to document existing GCs and the various forms taken. We also noted which GCs from previous data had closed, or GCs for which we could find no new information.1 We searched for GCs within networks, community foundations, and other host organizations. We found additional GCs through a snowball sampling method and through extensive outreach and online searching with keywords. This resulted in an up-to-date database of GCs and their hosts, and provided the descriptive data and contact information necessary to conduct surveys.
Second, we conducted a landscape survey of GCs (see questions in Appendix A) to gather key information about GCs, including who participates, how much money has been raised or given, issue areas or populations supported, models, and GC activities and structure. The survey was administered online using Qualtrics survey software hosted by Syracuse University. Prior to the survey launch, we conducted internal piloting of the survey and then asked our advisory group to test the survey and provide feedback. After several rounds of piloting and feedback, we sent a link to the survey to key contacts in the GC database described above. We also asked our advisory group and other GC network and host contacts to share the survey link with GCs with which they were affiliated. The survey was open from November 10 to December 9, 2016. We sent reminder emails at two points during the survey.
The database ultimately included 1,087 active GCs, plus 525 GC chapters associated with five of these active GCs. An additional 22 GCs were verified as no longer in operation, and another 204 were presumed defunct because no new information could be found for them since the last landscape study in 2007. The total number of GCs listed in the current database is 1,313, plus 525 chapters. In addition, 358 GCs responded to the survey, giving us a response rate of 33 percent of active GCs in our database; there is, however, missing data for some respondents for some questions.
METHODOLOGY
1 We verified that 22 GCs in the original database had closed. This sample is too small for statistical analysis, but we do have some information on closed GCs. There does not seem to be any systematic variation in these data. Reasons given for closing varied. Funded issue areas and populations, governance structures, and geographic locations also varied among closed GCs.

12 The Landscape of Giving Circles/Collective Giving Groups in the U.S., 2016
In this section, we present findings from the updated GC database and landscape survey conducted in 2016. We also include for comparison findings from previous U.S.-focused GC studies.
Number of GCsIt has been more than 10 years since the first landscape study of GCs was undertaken in the U.S. by what then was the Forum of Regional Association of Grantmakers (Rutnik and Bearman, 2005). The original study, done in 2004, included a database of 220 GCs. In 2006, Bearman (2007b) duplicated the forum’s original study and identified a total of 400 groups in the U.S.
Our updated database identifies more than three times the number of GCs as appear in the 2007 study. As noted above, our database ultimately included 1,087 active GCs, plus 525 chapters associated with five of these active GCs. An additional 22 GCs were verified as no longer in operation and another 204 were presumed defunct because no new information could be found for them since the last landscape study. Thus, the total number of GCs listed in the database is 1,313 (plus 525 chapters).
The oldest GC in our database is the Ma Tov (How Wonderful) Tzedakah Collective, which was started in 1982 and appears to be inactive. Most GCs are much younger, with about half formed since the last comprehensive study in 2007.
Of the 759 GCs for which we could identify a start date,
• 44, or 5.8 percent, launched prior to 2000;
• 365, or 48.1 percent, launched between 2000-2009; and
• 350, or 46.1 percent, launched between 2010-2017.
FINDINGS

13Collective Giving Research Group
Per Year Cumulative
70
60
50
40
30
20
10
0
800
700
600
500
400
300
200
100
0
1982 1988 1991 1993 1995 1997 1999 2001 2003 2005 2007 2009 2011 2013 2015
Num
ber
of G
Cs
Sta
rted
Cum
ulat
ive
Num
ber
of G
Cs
Among survey respondents we found a similar pace of creation, with GC founding years ranging from 1987 to 2016 and most groups founded in 2007 or later (n=278).
GCs in the database were found in all 50 states and the District of Columbia. The largest number were found in California (170), followed by Michigan (65) and New York (65). We also found 13 nationwide groups and nine virtual groups (see state-by-state count in Appendix B).
Figure 1:
Year GCs Started, Database
Figure 2:
Geographic Distribution of GCs, Database
1-9
10-29
30-49
50+
# of GCs by State

14 The Landscape of Giving Circles/Collective Giving Groups in the U.S., 2016
In the initial study of the GC landscape (Rutnik and Bearman, 2005), the Forum of Regional Association of Grantmakers’ database included groups from only 44 states and the District of Columbia.
Member CompositionNumber of PeopleThe number of people engaged in GCs is also increasing. A search for data online and elsewhere revealed that the 403 GCs (out of 1,313, or 30.7 percent of groups) for which we found information have attracted at least 46,783 members since inception. The number of members in GCs in our database ranged from three to 8,000 (for one group with more than 425 chapters). The average number of members is 116, the median (amount located in the middle of the range of amounts) is 50, and the mode (most frequent amount) is 100. If we extrapolate to all of the groups in our current database, based on the median to average number, we estimate conservatively that GCs have engaged 65,650 to 152,308 people.
Landscape survey respondents (n=350) reported 40,852 members, with an average of 117 members per GC and a median of 50 members per GC. About two-thirds of GCs reported having fewer than 100 members (n=234), while the remaining GCs have 100 or more members (n=116). 2
The original landscape study, conducted in 2004, found that among a survey sample of 61 groups, GCs collectively included more than 5,300 members/donors. In 2006, Bearman (2007b) duplicated the forum’s original study and found, among a sample of 145 groups, more than 11,700 members/donors, with an average of 73 members per group.
Our findings suggest that GCs are engaging more people overall and also engaging more people on average per group.
Types of PeopleGCs attract many types of people, including those who may not typically engage in institutional philanthropy. Out of 1,313 groups in the current database, 785 (60 percent) were identity-based groups (identity areas not being mutually exclusive). Figure 3 provides a visual representation and count of identities associated with GCs.
Giving circles are engaging more people overall and also engaging more people on average per group.
2 We asked how GCs counted members: as individuals, as couples, or as households. Most (n=314; 89 percent) count individuals as members; only a handful of GCs count couples (n=3) or households (n=25) as single members.

15Collective Giving Research Group
Consistent with past research (Bearman, 2007b; Rutnik and Bearman, 2005), women’s GCs are the most common, with 637 (48.5 percent of database) identified. We also identified significant numbers of Jewish groups (106), Asian/Pacific Islander groups (53), and African-American groups (40), which are largely but not exclusively a result of proactive efforts to launch GCs in these communities by Amplifier, Asian Americans/Pacific Islanders in Philanthropy (AAPIP), and the Community Investment Network (CIN), respectively. A smaller number of GCs were associated with younger age groups, with 64 young professional GCs (4.9 percent), 15 youth GCs (1.1 percent), and seven teenager GCs (0.5 percent).
We asked landscape survey respondents whether there was a shared identity that brought the group together. The large majority of GCs reported being formed around a shared identity (n=295; 84 percent).3
706 GCs
GENDER IDENTITY &
ORIENTATION
117 GCs
RACE/ETHNIC
IDENTITY
118 GCs
RELIGIOUSIDENTITY
Women’s GCs (640)
Men’s GCs (42)
LGBTQ GCs (24)
Asian/Paci�c Islander (52)
African American (38)
Latino (16)
Arab American (3)
Native American (1)
Multiracial (1)
Jewish (88)
Christian (7)
Muslim (2)
Figure 3:
GCs Shared Identities, Database
3 Percentages provided are for people who completed the question. Some respondents did not answer all questions.

16 The Landscape of Giving Circles/Collective Giving Groups in the U.S., 2016
Women’s GCs were the most dominant type of shared identity group in the sample of survey respondents (n=193; 54 percent), followed by Jewish GCs (n=55; 15 percent). There were several race/ethnicity-based groups and/or groups formed around age (e.g., young professional). The “other” category included groups that were age-based (e.g., 50 and over) and income-based (e.g., progressive, high net worth), alumni of specific organizations, or members of specific communities. Intersectionality was rare and approximately 70 percent of groups selected one primary identity (n=250). Jewish women’s GCs accounted for the highest incidence of intersectionality, accounting for about 4 percent of respondents (n=12).
We asked about the member composition of GCs. Specifically, we asked what proportion of members identified with specific groups related to gender, race/ethnicity, age, and religious affiliation.4 We report results below.
Gender and Gender Identity — Gender-related categories in the landscape survey were women, men, transgender women, transgender men, genderqueer/gender nonconforming, and an opportunity to specify. We found that women dominated as members of GCs, with about 70 percent of all groups (n=250) reporting that women made up more than half of their membership. (See Figure 4.)
Men were present in about 66 percent of GCs, but were only dominant in about 7.5 percent of groups (n=27). (See Figure 5.)
Very few GCs reported having transgender women (n=9) or transgender men (n=11), and most reported not having transgender women or transgender men or not knowing whether members were transgender women or transgender men. Similarly, a small number of GCs reported having genderqueer/gender non-conforming members (n=28).
Women dominated as members of giving circles, with about 70 percent of all groups reporting that women made up more than half of their membership.
4 Response choices were “all,” “most,” “more than half,” “half,” “less than half,” “few,” “none,” and “don’t know.”

17Collective Giving Research Group
Figure 4:
Women as Members of GCs, Landscape Survey
56%
8%
12%
18%
4%
1% 1%1%
All (183 circles)
Most (28)
More than half (39)
Half (58)
Less than half (12)
Few (2)
None (2)
Don’t know (2)
Figure 5:
Men as Members of GCs, Landscape Survey
All (12 circles)
Most (4)
More than half (11)
Half (60)
Less than half (39)
Few (23)
None (75)
Don’t know (2)
27%
10%17%
33%
1%
5%
2%
5%
4 Response choices were “all,” “most,” “more than half,” “half,” “less than half,” “few,” “none,” and “don’t know.”

18 The Landscape of Giving Circles/Collective Giving Groups in the U.S., 2016
In previous landscape studies (Bearman, 2007b; Rutnik and Bearman, 2005), more than half of the groups in the samples were women-only. Specifically in the 2006 study, 61 percent of all GCs were overwhelmingly female in composition, but co-ed GCs made up 47 percent of the total. Men were represented in equal or greater numbers in 22 groups, or 15 percent of the sample. Only two GCs were made up entirely of men. Ho (2008) found, in a study of Asian American GCs, that 84 percent of participants were female. In comparison, we were able to find 45 GCs made up entirely or predominantly of men.
Most GC participants are female, a finding that affirms 2014 research from Dean-Olmsted et al., which was based on survey data from the National Study of American Religious Giving and the National Study of American Jewish Giving. Dean-Olmstead et al. found that predominantly white GCs and Jewish GCs have the most pronounced gender differences (where 66 percent and 42 percent of their members, respectively, are female). In comparison, gender differences are not as pronounced for GCs made up of African American, Hispanic/Latino, and Asian/Pacific Islander participants.
There was no discussion in previous GC landscape studies of transgender women, transgender men, genderqueer/ gender nonconforming, or other gender-identity groups. In 2009, Rockefeller Philanthropy Advisors identified only one LGBTQ GC in its assessment of diversity funds.
Our current study findings suggest that while women continue to be the majority of participants in GCs, there has been growth in the number of men and LGBTQ people participating in groups.
Race/Ethnicity — Race/ethnicity categories of members provided in our landscape survey were White, Black or African American, Latino/a or Hispanic, American Indian or Alaska Native, Native Hawaiian or other Pacific Islander, multiple races/ethnicities, and the option to specify a different identity. The survey indicated that most GCs (83.7 percent) had more than half of members who are white (n=300), indicating that only a small proportion of GCs had dominant nonwhite membership. No other racial/ethnic group had such a dominant presence in GCs. Most GCs, however, had some racial/ethnic diversity, including those dominated by white members. About 39 percent of groups (n=140)
While women continue to be the majority of participants in GCs, there has been growth in the number of men and LGBTQ people participating in groups.

19Collective Giving Research Group
reported at least one African American/Black or Latino/Hispanic member and about 30 percent of groups (n=109) had at least one Asian/Pacific Islander member. Very few GCs reported having American Indian/Alaska Native members (n=26) or Native Hawaiian/Pacific Islander members (n=23). These racial/ethnic identities were typically less than half of the membership. About 11.5 percent of groups (n=41) reported having a racial/ethnic minority group compose more than half of their membership. Text responses for GCs that chose “different identity” were exclusively Jewish.
In the Rutnik and Bearman’s (2005) study, 70 percent of the survey respondents described their group’s membership as predominantly white, 12 percent as racially/ethnically mixed, and 5 percent as African American. There was only one entirely Asian American group in the survey sample. Ten percent of respondents declined to include the racial/ethnic origin of members. In Bearman (2007b), GCs in the sample reported that an average of 8 percent of donors were African American. Nine GCs in the sample were composed entirely or almost entirely of African American donors. The sample also contained six groups composed entirely or almost entirely of Asian Americans. On average, GCs reported that 3 percent of their donors were Asian American; Latino/a donors made up 2 percent. Only two groups in the sample were made up entirely or almost entirely of Latinos/as. In 2009, a diversity fund report by Rockefeller Philanthropy Advisors also identified 42 race/ethnic-based GCs in the U.S., including 18 African American, nine Asian/Pacific Islander and Arab, and five Hispanic/Latino groups.
Cultural/Religious-Based Groups — Cultural/religious-based categories of members provided in the landscape survey were no religious affiliation, Christian, Jewish, Muslim, Hindu, and Buddhist. Of note, about 29 percent of groups (n=104) said that more than half of their members identify as Christian, while about 16 percent (n=58) said that more than half of members are Jewish. Seven groups identified their members as all Christian and 43 identified their members as all Jewish. No groups indicated that more than half of their members are Muslim, Hindu, or Buddhist. Only a few groups identified as having members identifying as Muslim (n=18), Hindu (n=17), or Buddhist (n=19). By far, the most common answer to questions about the religious identity of members across all possible responses was “don’t know” for each category.
In the original Rutnik and Bearman (2005) study, there was only one all-Jewish group in the survey sample. Bearman (2007b) did not address cultural/religious identity in her study and Dean-Olmsted et al. (2014), while comparing Jewish to non-Jewish participants across variables (noted in other areas of this report), did not directly address makeup per group.

20 The Landscape of Giving Circles/Collective Giving Groups in the U.S., 2016
Our data suggest that groups based on cultural/religious identity are growing in number and as a proportion of the overall GC population.
Age Ranges – Age-range categories of members in the landscape survey were under 18 years, 18-24 years, 25-35 years, 36-44 years, 45-64 years, and 65 years and older. Overall, the survey indicated that GC membership increased with each age range up to the 45-to-64 years category.
In Bearman’s (2007b) study, GCs reported that a majority of their members (59 percent) were between 40 and 65 years old. In addition, 28 percent were between 25 and 40, only 2 percent were between 18 and 25, and less than 1 percent were under 18. GCs reported that 11 percent of donors were age 65 and older. Two GCs in the sample were made up entirely of teenage donors, and 26 were composed entirely or overwhelmingly of donors under 40. Ho (2008) found that Asian American participants surveyed consisted primarily of young professionals in their 20s and 30s. Dean-Olmsted et al. (2014) found GC participants skew younger, especially among nonwhite and Jewish participants.
Our findings and other research suggest that there are a growing number of younger GC members; however, the majority of members remain in the 45-to-64 age range.
Additional findings: • Only a few groups had any members under age 18 (n=26; 7.3 percent).
• A larger number had at least some members ages 18 to 24 (n=90; 25 percent), but in most of these GCs this age range accounted for only a few members.
• Two-thirds of GCs had members in the 25-to-35 age range (n=224; 63 percent), but for most groups this accounted for less than half of membership.
• Three-quarters of GCs had members in the 36-to-44 age range (n=254; 71 percent), but this typically accounted for less than half of membership.
• More than three-quarters of GCs reported members in the 45-to-64 age range (n=271; 76 percent), with 123 groups reporting more than half of their membership in this age range.
• More than half of GCs reported having members who were 65 or older (n=202; 56 percent); however, in most groups this age range accounted for less than half of members (n=150).
21Collective Giving Research Group
Amounts Given and RaisedOverall Giving by GCsGiving by GCs continues to increase. Results from our updated database show GCs have given at least $375.25 million since inception (data from 483 of 1,317, or 37 percent, of groups). Amounts given per group since inception range dramatically – from $563 to $16 million. The average for all groups for which we have data (out of 483) is $776,910; the median is $130,000; and the mode is $100,000. If we extrapolate to all of the groups in our current database, based on the average, GCs have given as much as $1.29 billion since inception.
The landscape survey respondents reported raising $30,070,398 and giving $27,746,917 in 2016 alone. Since their inception, groups in the survey said they raised $232,644,428 and gave $203,152,987.
Rutnik and Bearman’s (2005) study found that 61 GCs had collectively given $23 million in grants. Two years later, Bearman (2007b) found that 145 GCs had granted nearly $65 million. In 2009, a report by Rockefeller Philanthropy Advisors found that 43 racial/ethnic and LGBTQ identity-based GCs raised $2.2 million. Eikenberry (2008) also found in a study that GC beneficiaries received at least $28.4 million between 1996 and 2005 (grant amounts available for 52 percent of funding recipients identified). The average grant size was $28,781 and ranged from $90 to $715,000.5
Amounts Given per MemberOf the 751 GCs with data available in our database, the minimum dollar amounts required from members to vote on funding recipients (per event or year) ranges from $4 to $100,000. The average amount is $1,312, median $400, and mode $400.
Among landscape survey respondents, 85 percent of GCs required a minimum dollar amount to participate in decision making. That dollar amount varied from $5 to $2 million, with an average requirement of $8,238 and a median amount of $400, indicating that half of the groups require financial commitments of $400 or less.
5 According to its website, the Women’s Collective Giving Grantmaking Network’s 49 member organizations alone have given more than $80 million during the past 20 years. The AAPIP’s network of 37 GCs allocated approximately $1.7 million to community organizations; total giving per group ranged from $25,000 in 2004 to $417,513 in 2013 (Brousseau and Ramos, 2014). Since the launch of its National GC Campaign in 2011, the average total giving for the 37 GCs in the network was $26,602 and the median was $13,213. The 16 GCs in the Community Investment Network (2017) have awarded $250,000 in grants since 2004, with members giving considerably more individually. In 2012, CIN members estimated that they provided 13,000 to 16,000 hours of volunteer time, equivalent to in-kind contributions of $1.3 million to $1.6 million.

22 The Landscape of Giving Circles/Collective Giving Groups in the U.S., 2016
In comparison, Bearman’s (2007b) survey found that the average donation per member per year was $2,809, and the most common donation level was $1,000. Our findings suggest that the average (at least per database results) and most frequent amount given by members per group may be decreasing.
In addition, the survey found that nearly three-quarters of GCs had one level of giving (n=257; 71 percent), while others had multiple fixed levels of giving (n=52; 14 percent). Having multiple fixed giving levels typically was geared toward including populations, like young people, who may have fewer resources. A small number of GCs had varying donation amounts or asked members to give according to their means (n=37; 10 percent). Similarly, Bearman’s (2007b) survey found that 64 percent of respondents indicated that they have one giving level that all donors must meet or exceed, and 15 percent had a tiered model with multiple levels. Another 7 percent had no set donation levels and instead allowed donors to decide how much they are willing to give. An additional 8 percent asked for donations at events throughout the year, where donors gave varying amounts.
Other Ways GCs Support BeneficiariesIn the survey, we asked in what ways GCs supported beneficiaries other than through giving money. Categories included providing technical assistance such as public relations, marketing, technology, financial, legal, or accounting support; providing fundraising support, including introductions to other donors; participating on the board or other governing or advisory body; giving additional money directly beyond funding through the GCs; or volunteering in other ways. We found GCs to be highly engaged with funding recipients beyond financial support. In 52 percent of groups, GC members participate in organized volunteer activities; 48 percent provide additional money beyond the group; 45 percent report board-level involvement in grantee organizations; 38 percent provide fundraising support such as introducing the organization to other donors; and 31 percent provide technical support. (See Figure 6.)
In 52 percent of groups, giving circle members participate in organized volunteer activities.

23Collective Giving Research Group
Rutnik and Bearman (2005) also found that GC members offered a range of additional support to beneficiary organizations, with 51 percent of respondents indicating that GC members participated in organized volunteer activities, while an additional 45 percent reported board-level involvement in grantee organizations and 43 percent provided fundraising support such as introducing the organization to other donors.
Finally, we asked in the landscape survey whether GCs received funds from sources other than members. About half of the groups (n=181) received outside funding – from individual donors who are not members of the group (n=116), foundations or corporations (n=108), GC host or parent organizations (n=41), and other sources (n=29), including local businesses, matching gifts, in-kind donations, and memorial donations. Rutnik and Bearman (2005) also found that 52 percent of GCs surveyed indicated that they had received additional funds or matching grants from other sources: community and private foundations, corporate matching gift programs, and other donors.
Figure 6:
GCs Giving Beyond Grants, Landscape Survey
112
137
161173
64
187200
180
160
140
120
100
80
60
40
20
0
Technicalsupport
FundraisingBoardAdditionalmoney
None
Num
ber
of G
Cs
Volunteer
Type of additional support

24 The Landscape of Giving Circles/Collective Giving Groups in the U.S., 2016
Issue Areas and Populations SupportedIn the landscape survey, respondents reported giving 2,915 grants in 2016. We asked which areas GCs supported. The choices were arts, culture, and humanities; education; environment and animals; health; human services; international affairs; public affairs/society benefit; religion related; youth serving; women and girls; specific race/ethnic groups; LGBTQ; and other. Responses were not mutually exclusive.
Consistent with previous studies, we found human services (55 percent), women and girls (53 percent), and education (52 percent) were the areas most likely to be supported. International affairs (7 percent) and religion-related causes (11 percent) were least likely to receive support from respondents. Other causes included those in specific geographic areas, men and boys, criminal justice reform, and innovation. (See Figure 7.)
The most dominant convening identity in our survey was women (n=193 groups). These groups overwhelmingly supported causes for women and girls (n=138) and tended to support human services (n=117), education (n=108), health (n=102), and youth-serving causes (n=89). They were less likely than other groups to support arts, culture, and humanities (n=65).
123
187
89
145
196
24
6441
160191
59 4983
250
200
150
100
50
0
Arts, c
ulture
, and hum
anities
Education
Environm
ent/anim
als
Health
Human serv
ices
Inte
rnatio
nal aairs
Public aairs
/society
bene�t
Religion re
lated
Youth serv
ing
Women and girl
s
Speci�c race/e
thnic gro
ups
LGBTQOth
er
Num
ber
of G
Cs
Issue Area/Population
Figure 7:
Number of GCs Funding Particular Issue Areas or Populations, Landscape Survey

25Collective Giving Research Group
Rutnik and Bearman’s (2005) survey found GCs supported a variety of issues, with the top being youth development (34 percent), women and girls (27 percent), human services (25 percent), and mental health/crisis intervention (20 percent). Bearman’s (2007b) follow-up study found that almost half (49 percent) of the GCs in the study listed women and girls as a funding priority area. Education (43 percent), youth development (33 percent), health and nutrition (30 percent), community improvement (26 percent), and arts and culture (25 percent) were also top funding priority areas. The lowest listed priority areas were international affairs and religion/spiritual development (1 percent each).
Eikenberry (2008) found in a study of GC beneficiaries that 40 percent of the total number of gifts given by GCs went to human service organizations. Education and arts and culture organizations received the next largest proportional number of gifts. In terms of dollars, however, education organizations received more than 55 percent of the total amount given by GCs, while only 26 percent went to human service organizations. The lowest number of gifts and amount of money went to international and religious organizations.
Dean-Olmsted et al. (2014) found that American Jewish GC participants make charitable contributions to non-Jewish organizations at approximately the same rate as other American Jewish donors (96 percent versus 93 percent), yet are more likely to give to Jewish organizations (91 percent versus 76 percent). Jewish GC participants are also much more likely than other Jewish donors to give to organizations working in international aid or neighborhood/community causes, yet they are no more likely than other donors to give for health care or to combined-purpose organizations, such as the United Way.
In their study of AAPIP-member GCs, Brousseau and Ramos (2014) found, based on an analysis of 235 organizations that received gifts between 2011 and 2013, that programs and organizations focusing on arts and culture (26 percent) and health (19 percent) received the largest portion of gifts during this period. In terms of populations served, the AAPIP identified populations that overlap with current organization-wide priorities: Arab, Middle Eastern, Muslim, and South Asian (AMEMSA) communities; LGBTQ communities; “Dreamers” and immigrants; and boys and men. Organizations serving “Dreamers” and immigrants comprised 19 percent of organizations, those serving AMEMSA communities accounted for 12 percent of organizations, and programs serving LGBTQ communities accounted for 11 percent of organizations.
Regarding where GCs fund, Bearman (2007b) found that 113 GCs (78 percent of the sample) made at least some of their grants within the parameters of their own city, town, rural area, or county.

26 The Landscape of Giving Circles/Collective Giving Groups in the U.S., 2016
Another 9 percent funded within their state, and 4 percent indicated that they funded within a multi-state region. Only 6 percent made grants nationally. Seventeen GCs (12 percent of survey respondents) indicated that they made grants internationally. GCs that funded internationally tended to do so exclusively.
In the landscape survey, we found that 302 GCs (84 percent of total respondents) made at least some grants in their local area. Another 32 GCs (9 percent) made grants within the state and 29 GCs (8 percent) made multi-state grants. Some GCs also made national (22, or 6 percent) and international (41, or 11 percent) grants. Four GCs made tribal grants.
Finally, less than a quarter (n=86) of landscape survey respondents reported their GCs as retaining funds to build a philanthropic fund or endowment.
Structure and OperationsData on structure and operations are drawn primarily from the landscape survey.
Membership StructureWe asked in the landscape survey how GCs structure membership: whether it is intermittent with fluctuating participation, constant for a fixed term, or a mixture of the two. Three-quarters of GCs (n=264) reported having constant membership, while relatively few groups had intermittent (n=26) or mixed membership (n=61).
Where and How Often GCs MeetWe asked where GCs meet and how often they meet. Two-thirds of groups reported meeting only in person (n=236 or 66 percent) and one-quarter reported using a mixture of in-person and online meetings (n=97). A small number met only online (n=6) or did not meet at all (n=5). For GCs that meet, two-thirds report meeting at least quarterly or more often (n=235). A similar question was not asked in previous studies.
Time CommitmentWe asked about the time commitments GCs require of their members. For GCs reporting membership-length requirements (n=306; 85 percent), most required a one-year commitment (n=209; 68 percent). A relatively smaller number had no length requirement (n=53; 15 percent), and the remaining groups had varied membership-length requirements, including multi-year as well as shorter participation requirements. A similar question was not asked in previous studies.

27Collective Giving Research Group
How Funding Decisions Are MadeWe asked how GCs choose funding recipients. In about half of the surveyed groups, members vote on who should receive funding (n=189); in about one-fifth of groups, members decide by consensus (n=68). In a little more than 10 percent of groups, decisions are made by a committee or nomination (n=42). A number of GCs have other procedures for deciding (n=43); most of these involve some sort of committee structure.
Bearman (2007b) found that about two-fifths of the GCs she surveyed (38 percent) decided by consensus. In 34 percent each member cast a vote and the majority ruled. Often, a grantmaking committee first narrowed the field of applicants to a manageable number. A small percentage of the circles responded that they delegated the final decision making to a subset of members. In 4 percent of the GCs surveyed, members voted with their dollars, a system in which each member decided how much of his or her money would go to each organization under consideration.
Membership in Networks of GCsNetworks of GCs that help to initiate GCs and support GC efforts seem to have proliferated in the past 10 years, since earlier landscape studies. In our database, 589 (out of 1,317 groups, or 45 percent) are in a GC network or alliance.
GC NETWORKS
• 100 Who Care Alliance• Ampilfier• Asian Americans/Pacific Islanders in Philanthropy (AAPIP)• Awesome Foundation• Beyond Me• Bread for the Journey• Change Gangs• Circles.org/Foundation for Sustainable Development• Community Investment Network• Dining for Women• Giving Circle Network• Giving Circles Fund
• Giving Project Learning Community• Impact 100• Jewish Teen Philanthropy Network• Jewish Women’s Funding Network• Latino Giving Circle Network• Native Giving Circle Network• Social Venture Partners• The Funding Network• Women’s Collective Giving Grantmakers Network• Women’s Foundation of CA Giving Circle Network• Womenade• Youth Philanthropy Connect

28 The Landscape of Giving Circles/Collective Giving Groups in the U.S., 2016
We asked in the survey whether GCs participated in GC networks or alliances and found that a little more than half of respondents participated in a network of some sort (n=182). Another 160 GCs reported that they were not part of any network or alliance. (See Figure 8.)
Comparatively, Bearman (2007b) found that some GCs did have connections to other GCs (17 percent) or to the philanthropic networks in their communities, such as regional associations of grantmakers (24 percent), which provided them with additional learning opportunities.
Legal Status and StaffingIn our updated database, 561 GCs (out of 1,317 groups, or 42.5 percent) appear to be hosted or have a relationship with a hosting organization.
5549
22
11 105 5 3 1 1 1
24
Other
75
50
25
0
Awesome Foundatio
n
Latino G
iving Circ
le Netw
ork
Social Ventu
re Partn
ers
Asian Am
ericans/Paci�c Is
landers in
Phila
nthro
py
Dining for W
omen
Women’s C
ollectiv
e Giving G
rantm
akers N
etwork
Bread fo
r the Journ
ey
Comm
unity In
vestment N
etwork
Impact 1
00
Num
ber
of G
Cs
Network/Alliance
Figure 8:
GC Membership in Networks or Alliances, Landscape Survey

29Collective Giving Research Group
In the landscape survey, about half of the respondents reported being hosted by a fiscal sponsor or institutional host (n=176), about one-quarter operated independently with no legal tax status (n=81), about 16 percent were chapters of parent organizations (n=58), and 8 percent were independent 501(c)(3) nonprofits (n=29). Finally, a handful served as a parent organization with its own chapters (n=3).
Most GCs in the survey with a fiscal sponsor or institutional host reported being hosted by a community foundation (n=97). Others were hosted by education/youth-serving organizations (n=20), women’s funds or foundations (n=15), or other nonprofits (n=9). Remaining hosts included financial services companies, grantmaking public charities, and religious institutions.
Bearman (2007a) found that most GCs (68 percent of 160 groups surveyed) had a host organization that provided at least a basic level of service. Community foundations represented slightly more than half (52 percent) of hosts. Other hosts included public foundations, associations of grantmakers, nonprofit organizations, hospitals, universities, and schools.
Finally, according to the landscape survey, about half of GCs had paid staff (n=183) who worked an average of 55 hours per month for the GCs. Staff hours range from 0.5 to 720 hours a month and a median of 15 hours per month, indicating that most GC staff positions are part time. Most GCs reported staff working between nine and 75 hours per month (values outside of this range are outliers). GCs with fiscal hosts were more likely than any other type of GC to have paid staff support – 72 percent of GCs with a fiscal host also had paid staff support. Of GCs with paid staff, 126 reported being hosted by other organizations, such as community foundations. A similar question was not asked in previous studies.
ActivitiesWe asked in the landscape survey about activities and learning opportunities provided to members through the GCs. Choices were:
• speakers or training on philanthropy, • speakers or training on specific community issues, • leadership training, • site visits to nonprofit organizations, • meetings with nonprofit or community leaders, • discussions about funding recipients or community issues, • discussion about personal or group values, • discussion of readings, • networking opportunities, • social activities or celebrations, • policy advocacy and/or lobbying, • none of the above, and • other.

30 The Landscape of Giving Circles/Collective Giving Groups in the U.S., 2016
We found GCs provide ample additional activities and learning opportunities for members. In particular, a large number of GCs offer social activities (n=229; 64 percent) and networking opportunities (n=187; 52 percent) with other GC members as well as discussions about funding recipients or current issues (n=210; 58 percent), and site visits (n=174; 41 percent). Only a few groups (n=31) engaged in policy advocacy/lobbying, leadership training, or discussion of readings. (See Figure 9.)
Rutnik and Bearman (2005) found that close to 70 percent of groups reported that they provided members with learning opportunities, ranging from structured to informal. Bearman (2007b) also found that 65 percent of the GCs offered workshops and speakers about community issues; 56 percent provided speakers or workshops about philanthropy and giving. About a quarter of GCs (27 percent) offered members workshops on practical topics such as how to evaluate proposals or read financial statements. Learning also takes place informally. More than half (58 percent) of GCs in the sample used group discussion, often casual, as a primary tool for member learning.
138156
40
174 164
210
116
41
187
229
31 1928
250
200
150
100
50
0
Speakers
or tra
ining on philanth
ropy
Speakers or t
raining on speci�c
comm
unity is
sues
Leadership tr
aining
Site visits
to nonpro
�t org
anizations
Meetin
gs with
nonpro�t o
r
comm
unity le
aders
Discussions about funding
recipients
or com
munity
issues
Discussion about pers
onal or g
roup values
Discussion of readings re
lated to
the gro
up identit
y and expression
Network
ing opportuniti
es
Social activ
ities or c
elebratio
ns
Policy advocacy and/o
r lobbying
NoneOth
er
Num
ber
of G
Cs
Activity/Learning Opportunity
Figure 9:
Activities and Learning Opportunities for GC Members, Landscape Survey

31Collective Giving Research Group
Exactly half (50 percent) of GCs indicated that members made visits to better understand the organizations they consider for funding, and 35 percent held meetings with nonprofit staff to learn more about the organizations. Several smaller GCs asked members to research an organization under consideration and provide fellow GC members with a short summary. Finally, some GCs used more intimate learning opportunities, such as mentoring or book groups, to give their work both social and educational components.
Brousseau and Ramos (2014) note that many AAPIP-affiliated GCs have important social mixing and networking components. Some provide education to their members about local Asian American/Pacific Islander communities and the groups and communities applying for funding. Others provide substantial technical assistance to grantee organizations.

32 The Landscape of Giving Circles/Collective Giving Groups in the U.S., 2016
From small groups of friends meeting over drinks to large organizations with their own nonprofit status and staff, GCs and collective giving groups are changing the face of community philanthropy across the United States. This landscape research updates our understanding of the current scope and scale of GCs and similar models of collective giving or giving collaboratives in the United States.
We found a significant expansion of the number and distribution of GCs since the last landscape study, conducted in 2007. Our research identified more than 1,000 independently run and currently active GCs, along with 525 GC chapters that are part of GC networks and programs.
Membership in GCs has grown substantially. Our findings suggest that GCs are not only engaging more people overall, but are also engaging more people on average per group now than in previous studies. We estimate that GCs have engaged at least 150,000 people since their inception. The most common number of members for a GC is 100. Compared to previous research, the number of identity-based groups is also growing, with more groups organized around race/ethnic, gender, age, or religious/cultural identities (e.g., women- or men-only, LGBTQ, Latino/a, young professional, Jewish). GCs are increasingly a significant philanthropic force in communities. We estimate that GCs have given as much as $1.29 billion since inception, more than double the estimated amount given in the last landscape study. In 2016 alone, survey respondents said their GCs raised $30.1 million and gave $27.7 million. Compared to earlier studies, our findings suggest that the average ($1,312) and most frequent amount ($400) given by members per group may be decreasing, reflecting the fact that GCs continue to engage donors over a wide range of income and asset levels, from everyday givers to wealthy philanthropists. Consistent with findings from earlier studies, our survey found that GCs give primarily in the areas of human services, women and girls, and education, and are least likely to give to international affairs and religious-related causes. The large majority of giving by GCs goes to local issues/areas in a given town, city, county or region. While a few GCs have moved their operations online and have far-flung memberships, the vast majority of GCs draw their members from the immediate region. In other words, GCs exercise philanthropy by and for communities.
DISCUSSION AND CONCLUSIONGiving circles exercise philanthropy by and for communities.

33Collective Giving Research Group
We did not find significant variation in the basic membership structures of GCs. Most GCs have constant memberships and ask for a one-year commitment, while relatively few have intermittent or a mixture of constant and intermittent membership. The majority of GC members meet in person. About half of GCs decide on funding through a voting process, while 20 percent determine funding decisions by consensus. Earlier research by Bearman found that about 40 percent of GCs decided by consensus and 30 percent cast votes, suggesting that there may be a shift in decision making toward voting and away from consensus, perhaps as GCs become larger. As with earlier studies, we found GCs provide ample activities and learning opportunities for members beyond giving money. Many GC members are highly engaged with funding recipients beyond financial support, including volunteering and offering technical assistance.
Finally, our research found that GCs are more tied into networks, more connected with institutional philanthropy, and increasingly professionalized in terms of staffing. We found that nearly all groups identified are in a GC network or alliance that helps to initiate GCs and support their efforts. Very few GC networks or alliances existed when previous research on GCs was conducted, but networks have proliferated in the past 10 years, with 25 networks of various sizes and structures operating around the country. In addition, nearly half of GCs are hosted or have a relationship with a hosting organization. Among these, most reported being hosted by a community foundation. In addition, according to our survey, about half of GCs have paid staff that support their work, usually on a part-time basis.
Thus, the driving forces behind GC creation may be shifting. While these groups are often initiated and driven by donors, community foundations and other philanthropic intermediaries across the U.S. are also promoting and adopting collective giving strategies. The aim is to engage a greater diversity of donors, including women and people of various ethnic and racial backgrounds and varying wealth levels, to build community and to grow philanthropy.
This landscape scan of GCs and collective giving is the first of a three-part inquiry, which also presents research related to the impact of participation in GCs on members’ giving and civic engagement and a study of the relationships between GCs and their hosting organizations. Studying GC variations will enable community foundations and other philanthropic intermediaries to better understand the degree to which these approaches to collective giving might impact donors, hosts, and beneficiaries in various ways. It will also offer insight for donors, hosts, and networks interested in starting or managing GCs.

34 The Landscape of Giving Circles/Collective Giving Groups in the U.S., 2016
Bearman, J. E. (2007a). Hosting a giving circle: The benefits and challenges of giving together. Washington, DC: Forum of Regional Associations of Grantmakers.
Bearman, J. E. (2007b). More giving together: The growth and impact of giving circles and shared giving. Washington, DC: Forum of Regional Associations of Grantmakers.
Brousseau, R., and Ramos, M. (2014, February). Asian Americans/Pacific Islanders in Philanthropy: The National Giving Circle Campaign Mid-Term Check-In. (unpublished)Community Investment Network. (2017). Our impact. Website. Available at: http://www.thecommunityinvestment.org/.
Dean-Olmsted, E., Bunin Benor, S., and Gerstein, J. (2014). Connected to give: Community circles. Los Angeles: Jumpstart.
Eikenberry, A. M. (2008). Giving circles and fundraising in the new philanthropy environment. Nonprofit Management and Leadership, 19(2), 141-52.
Eikenberry, A. M. (2009). Giving circles: Philanthropy, voluntary association, and democracy., Bloomington: Indiana University Press.
Eikenberry, A. M., and Bearman, J. (2009, May). The impact of giving together: Giving circles’ influence on members’ philanthropic and civic behaviors, knowledge, and attitudes. Baltimore, MD: Forum of Regional Associations of Grantmakers. Available online at https://www.academia.edu/12175637/The_Impact_of_Giving_Together_Full_Report
Ho, A. T. (2008, November). Asian American giving circles: Building bridges between philanthropy and our communities. Philadelphia: Association for Research on Nonprofit Organizations and Voluntary Action.
Rockefeller Philanthropy Advisors (2009, August). Diversity funds inventory. New York: Author.
Rutnik, T. A., and Bearman, J. (2005). Giving together: A national scan of giving circles and shared giving. Baltimore, MD: Forum of Regional Associations of Grantmakers.
REFERENCES

35Collective Giving Research Group
Thank you for your participation in this survey! The input you provide will contribute vital insight into the structure, composition and operations of GCs in the United States.
The survey’s four main sections ask about:
• general information about you and the giving circle,
• how the giving circle operates and is structured,
• the community or issue(s) the giving circle supports, and
• the current makeup of the giving circle membership.
The survey should be completed by one person who is knowledgeable about the giving circle. If you are answering the survey for more than one giving circle, please complete the survey in its entirety for one giving circle at a time. You may save the survey and come back later to finish it if needed. Your responses are confidential and will only be shared in summary form.
Each giving circle that completes the survey will be entered for a chance to win a donation to the charity of the giving circle’s choice. Two giving circles will be randomly selected for a donation of $250 per charity.
Thank you again for your participation!
Jessica Bearman, Bearman Consulting Julia Carboni, Syracuse University Angela Eikenberry, University of Nebraska at Omaha Jason Franklin, Grand Valley State University
APPENDIX A: LANDSCAPE SURVEY QUESTIONS

36 The Landscape of Giving Circles/Collective Giving Groups in the U.S., 2016
General Information
1. What is your role within this giving circle? (Please select all that apply.)Volunteer LEADER of giving circlePaid staff ADMINISTRATOR for giving circlePaid staff working for HOST of giving circleOther, please specify ____________________
2. What is the NAME of the giving circle?
3. In what YEAR was the giving circle started?
4. Where is the giving circle LOCATED?
5. If available, please provide the giving circle’s website URL:
6. Please provide your email address (This will only be used to contact you regarding this research and the random prize drawing):
Operations and Structure
7. How are members counted in this giving circle? Members are those who participate in the giving circle through giving money and/or time, regardless of amount or frequency. (Please select one.) As individuals As households As other, please specify: ____________________
8. About how many members currently participate in the giving circle?
9. Which best describes the giving circle membership structure? (Please select one.) Intermittent: participation fluctuates from event to event Constant: participation is for a fixed term (e.g. members renew annually) A mixture of intermittent and constant Other, please specify: ____________________
10. What length of membership commitment does the giving circle require? (Please select one.) None 1 year 2 years 3 years 4 years or more Other, please specify: ____________________

37Collective Giving Research Group
11. How does the general giving circle membership typically meet? (Please select one.) In-person only Online only A mixture of in-person and online Does not meet Other, please specify: ____________________
12. About how frequently does the general giving circle membership meet? (Please select one.) Monthly Quarterly Semi-annually Annually Does not meet Other, please specify: ____________________
13. Which best describes members’ financial contribution through the giving circle? (Please select one.) One giving level that every member must meet (or exceed) Multiple, set giving levels (tiered giving) Varying amounts once a year Varying amounts several times a year Other, please specify: ____________________
14. Is there a minimum dollar amount members must give in order to be allowed a vote or have a say in funding decision-making? Yes No
15. What minimum dollar amount must members give in order to be allowed a vote or have a say in funding decision-making?
16. About how many members participated in funding decision-making during the past year?
17. Which of the following BEST describes how funding recipients are chosen? (Please select one.) Consensus – all members agree upon which funding recipients and at what level Members vote on recipients and majority rules Decision is made entirely by a board or committee Members nominate or vote on a slate; board or committee selects recipients Members or committee nominate; members decide individually to fund or not Decision is made by the parent organization for which the circle is a chapter or affiliate Other, please specify: ____________________

38 The Landscape of Giving Circles/Collective Giving Groups in the U.S., 2016
18. Beyond funding through the giving circle, in what other ways do giving circle members give time, talent, or resources to funding recipients? (Please select all that apply.) Provide technical assistance, including public relations, marketing, technology, financial, legal, or accounting support Provide fundraising support, including introductions to other donors Participate on the board or other governing or advisory body Give additional money directly beyond funding through the giving circle Volunteer in other ways not mentioned above None of the above Other, please specify: ____________________
19. What activities or learning opportunities are provided to members through the giving circle? (Please select all that apply.) Speakers or training on philanthropy Speakers or training on specific community issues Leadership training Site visits to nonprofit organizations Meetings with nonprofit or community leaders Discussions about funding recipients or community issues Discussions about personal or group values Discussion of readings Networking opportunities Social activities or celebrations Policy advocacy and/or lobbying None of the above Other, please specify: ____________________
20. Which best describes how the giving circle operates? (Please select one.) It operates independently with no tax status It operates independently as its own 501(c)3 It has an institutional host or fiscal agent It is a chapter or sub-group of a parent organization It is a parent organization with chapters or sub-groups Other, please specify: ____________________
21. What type of organization serves as the institutional host or fiscal agent? (Please select one.) Community foundation Grantmaking public charity/public foundation Women’s fund or foundation United Way Education or youth-serving organization Other nonprofit organization Financial services company (e.g. bank) Other donor advised fund institution (e.g. Fidelity Charitable Gift Fund) Not sure/don’t know None Other, please specify: ____________________

39Collective Giving Research Group
22. If possible, please specify the name of the host or fiscal agent, and name and contact information for a representative from the host organization:
23. How many chapters or sub-groups does your giving circle have? In the United States: Outside of the United States:
24. Does the giving circle have any paid staff support (e.g., hourly administrative or program assistance or staff support through an institutional host, this could be full time dedicated staff or hours from a staff person who has other duties)? Yes No Not sure
25. Please specify the average number of hours paid staff provide support to the giving circle per MONTH:
26. Is your giving circle part of a network or alliance of giving circles? If yes, please select the giving circle network(s) for which the giving circle is a member. (Please select all that apply.) 100 Who Care Alliance Amplifier: The Jewish Giving Circle Movement Asian American/ Pacific Islanders in Philanthropy (AAPIP) Giving Circle Network Bread for the Journey Change Gangs Community Investment Network Dining for Women Impact 100 Latino Giving Circle Network Social Venture Partners Women’s Collective Giving Grantmakers Network Other, please specify: ____________________ None - the giving circle is not part of a network or alliance
27. Is your giving circle part of any philanthropic or nonprofit membership association(s) such as a regional association of grantmakers? Yes No Don’t know
28. Please list the name of the association(s):

40 The Landscape of Giving Circles/Collective Giving Groups in the U.S., 2016
29. Has the giving circle received additional funds or sponsorships from outside of the membership (from individuals, businesses, philanthropic organizations, etc.)? Yes No Not sure
30. What is the source of these additional funds from outside of the membership? (Please select all that apply.) Individual donors who are not members Foundations or corporations The giving circle host or parent organization Other, please specify: ____________________
31. Is the giving circle currently retaining funds to build a philanthropic fund or endowment? Yes No Not sure
Communities/Issues Supported
32. In which of the following areas does the giving circle primarily fund? (Please select all that apply.) Arts, culture, and humanities Education Environment and animals Health Human services International affairs Public affairs/society benefit Religion-related Youth serving Women and girls Specific race/ethnic group(s) LGBTQ Other, please specify: ____________________
33. What types of funding support does the giving circle provide? (Please select all that apply.) General, operating, or unrestricted support Program support Capital support (e.g. for buildings or construction projects) Capacity building support Endowment support Support for individuals (e.g. scholarships or fellowships) Other, please specify: ____________________

41Collective Giving Research Group
34. Where geographically does the giving circle primarily fund? (Please select all that apply.) Local State Regional or multi-state Tribal lands National International Other, please specify: ____________________
35. Please provide your best estimates for the amounts for the following: Total dollars RAISED in 2016 calendar year:
Total dollars GIVEN in 2016 calendar year:
Total NUMBER of grants, scholarships, or donations awarded in 2016 calendar year:
Total dollars RAISED since the giving circle’s founding:
Total dollars GIVEN since the giving circle’s founding:
Total NUMBER of grants, scholarships, or donations awarded since the giving circle’s founding:
36. About how often are grants, scholarships, or donations awarded by this giving circle? (Please select one.) Monthly Quarterly Semi-annually Annually On a rolling basis Other, please specify: ____________________
Membership: For the following demographic questions, please answer to the best of your ability. You can skip areas that you don’t know or are not applicable.
37. What is your best estimate for the GENDER identity makeup of current members of the giving circle?
All Most More than half
Half Less than half
Few None
Don’t know
Men
Women
Trans men
Trans women
Genderqueer/Gender non-conforming
Different identity (please specify)

42 The Landscape of Giving Circles/Collective Giving Groups in the U.S., 2016
38. What is your best estimate for the RACE/ETHNIC identity makeup of current members of the giving circle?
39. What is your best estimate for the AGE ranges of current members of the giving circle?
40. What is your best estimate for the RELIGIOUS affiliations of current members of the giving circle?
All Most More than half
Half Less than half
Few None
Don’t know
White
Black or African American
Latino/a or Hispanic
Asian
American Indian or Alaska Native
Native Hawaiian or Other Pacific Islander
Multiple races/ethnicities
Different identity (please specify)
All Most More than half
Half Less than half
Few None
Don’t know
Under 18 years
18-24 years
25-35 years
36-44 years
45-64 years
65 years and over
All Most More than half
Half Less than half
Few None
Don’t know
No religious affiliation
Christian
Jewish
Muslim
Hindu
Buddhist
Other, please specify

43Collective Giving Research Group
41. Many giving circles are formed around a particular gender, race/ethnic, religious, age, or other identity. Is there a particular SHARED IDENTITY that brings together the members of this giving circle? Yes No Don’t know
42. What is the shared identity that brings together the members of this giving circle? (Please select all that apply.) Women Men LGBTQ African American Asian American/Pacific Islander Latino/a American Indigenous/First Nation Jewish Christian Muslim Young Professional Youth Other, please specify: ____________________
43. Please provide information on any other unique demographic identities of the members of the giving circle:
44. Please share anything else that you would like us to know or we should have asked about your giving circle:
Thank you!

44 The Landscape of Giving Circles/Collective Giving Groups in the U.S., 2016
APPENDIX B:
GIVING CIRCLES BY STATEState Number of CirclesAlabama 8
Alaska 8
Arizona 11
Arkansas 25
California 170
Colorado 45
Connecticut 13
District of Columbia 17
Delaware 5
Florida 59
Georgia 17
Hawaii 5
Idaho 30
Illinois 5
Indiana 60
Iowa 54
Kansas 10
Kentucky 9
Louisiana 5
Maine 38
Maryland 35
Massachusetts 6
Michigan 65
Minnesota 15
Mississippi 14
Missouri 1
Montana 3
Nebraska 52
Nevada 2
New Hampshire 18
New Jersey 16
New Mexico 17

45Collective Giving Research Group
State Number of CirclesNew York 14
North Carolina 8
North Dakota 65
Ohio 43
Oklahoma 4
Oregon 18
Pennsylvania 43
Rhode Island 4
South Carolina 16
South Dakota 2
Tennessee 11
Texas 48
Utah 8
Vermont 39
Virginia 3
Washington 29
West Virginia 45
Wisconsin 7
Wyoming 1
National 13
Virtual 9

The Collective Giving Research Group (CGRG) is a research collaborative launched in 2015 to explore and understand the dynamics of giving
circles and other forms of collective giving today. Founding members of the CGRG, and co-authors of the above mentioned report, are Jessica
Bearman (Bearman Consulting); Julia Carboni, Ph.D. (Maxwell School of Citizenship and Public Affairs, Syracuse University); Angela Eikenberry,
Ph.D. (School of Public Administration, University of Nebraska at Omaha); and Jason Franklin, Ph.D. (Dorothy A. Johnson Center for Philanthropy,
Grand Valley State University).


If you have questions or comments about this report or
about the work of the Collective Giving Research Group,
please email [email protected]