Embed Size (px)
Citation preview

1
Department of Quantitative Social Science, Institute of Education
The labour market value of STEM qualifications and occupationsAn analysis for the Royal Academy of Engineering
Charley Greenwood, Matthew Harrison and Anna Vignoles8/7/2011

ContentsExecutive Summary ................................................................................................................... 3 Introduction ................................................................................................................................ 8 Related Literature ....................................................................................................................... 9 Data .......................................................................................................................................... 10 Methodology ............................................................................................................................ 13 Results ..................................................................................................................................... 15
Wage premia for STEM qualifications ................................................................................ 15 Wage premia for STE occupations ....................................................................................... 19 Wage premia for STEM qualifications used in STE occupations ........................................ 22
Conclusions .............................................................................................................................. 24 References ............................................................................................................................... 27 Appendix A – Qualifications with subject information available and coded as STEM ........... 39 Appendix B – Occupations coded as STEM ............................................................................ 41
2

Executive Summary
Science, Technology, Engineering and Mathematics (STEM) are subject areas that are
deemed crucial for a modern economy. Having a sufficient supply of skilled workers trained
in these subjects is seen as a pressing policy priority.
One indicator of whether employers really do value STEM skills above more general skills is
the wage premia that they pay for individuals with STEM qualifications.
This report investigates the labour market value of Science, Technology, Engineering and
Mathematics (STEM) qualifications, focusing specifically on vocational qualifications and
the value of STEM degrees. The report also investigates the relationship between STEM
qualifications held, the STEM occupation that the person may or may not be employed in and
their associate wages.
We ask:
1) What is the additional wage premium (or penalty) earned by individuals with STEM
qualifications, over and above any return earned for the qualification irrespective of
subject;
2) What is the additional wage premium (or penalty) earned by individuals working in
STE occupations, irrespective of qualifications held (note that in our data there are no
occupations classified as being specifically in mathematics and hence we consider
only science, technology and engineering (STE) occupations)?
3) What is the additional wage premium (or penalty) earned by individuals working in
STE occupations who also hold STEM qualifications?
This work builds on the FE and Skills STEM Data report published in October 2010 (Blue
Alumni, 2010) and uses the same classification system for Science, Technology, Engineering
and Mathematics qualifications. This previous project involved painstaking work analyzing
the Learning Aims Database, the Individual Learner Record and other Further Education
data. To identify qualifications as STEM or not, strict criteria were used namely:
3
• STEM qualifications have learning outcomes rooted in STEM and hence are of a
‘technical’ or ‘technology-application/use’ nature;
• STEM qualifications enable progression into further STEM study or a STEM
occupation;
• The majority of the assessment for a STEM qualification is in the area of STEM
itself;
Where a qualification might be allocated to a number of STEM categories (e.g. mathematics
and engineering), the dominant category was identified and multiple categories were
minimised.
The data used in this report to analyse differences in wages associated with STEM
qualifications and occupations are from the UK Labour Force Survey (LFS), March 2004 to
December 2010.
• Many qualifications have higher labour market value if they are in a STEM subject.
• There are additional positive wage premia from holding a range of qualifications at all
levels in a STEM subject (e.g. degrees, NVQ2, City and Guilds Foundation, NVQ3,
HNC/HND).
• In general there are no wage premia for qualifications held in science bar BTEC
National Certificates/Diplomas.
• NVQ5 and City and Guilds Part I/II attract a premium in technology.
• In mathematics, those with first degrees and diplomas in higher education do earn
significantly more than those who hold these qualifications in other subject areas.
• In engineering, a larger number of qualifications do attract an additional wage
premium if they are held in this subject area.
4

• Some qualifications in science, engineering or mathematics actually have a slightly
lower wage premia than the same qualification in another subject area.
We then considered the wages associated with STE occupations.
• 40% of individuals in higher managerial or professional jobs are in STE occupations.
• Just over one quarter of those in lower supervisory or clerical roles are in STE
occupations.
• Those working in STE occupations earn a great deal more than those who are not in
STE occupations (19%).
• Those in science occupations earn an additional wage premium of 10% whilst those
working in technology, engineering and different combinations of these subjects earn
much more than those in non STE occupations (14-34% more).
• The premium from working in a STE occupation is largely for those working at
intermediate and lower level occupations (i.e. not at professional or managerial level).
• In many instances, including degrees, STEM qualifications attract a further additional
premium if they are used in a STE occupation. Individuals earn a premium from
having a STEM qualification and then a further premium from working in a STE
occupation.
• At level 3 (intermediate) STEM qualifications tend to have greater value in STE
occupations.
• There is a particularly sizeable premium if a STEM qualification is used in a STE
occupation in the case of degrees, HNC/HND and City and Guilds Foundation/Part I.
We conclude that:
• Many but not all qualifications have additional value in the labour market if they are
in a STEM subject area though less so in science and more so in engineering;
5

• Most STE intermediate and lower level occupations attract additional wage premia
though less so for science and more so for technology and engineering;
• Some but not all STEM qualifications have considerable additional value in the
labour market if they are used in a STE occupation.
Methodological caveats
We are unable to allow for the cognitive or other types of ability of individuals and hence
where we see wage premia this may reflect the fact that more able people (who would earn
more anyway) tend to take STEM qualifications or indeed work in STE occupations. Our
analysis is therefore not necessarily causal.
Sample sizes often preclude us looking at the level of detail we would like to.
We only focus on the wage effects from having STEM qualifications: future work could
usefully look at whether such qualifications also have an impact on the likelihood of being in
employment and the type of employment gained.
Policy Implications
STEM qualifications are not all alike and across the different STEM areas we found very
different wage premia associated with different qualifications.
This means the advice given to young people needs to be far more nuanced than it currently
is.
It is not enough to urge young people to study STEM subjects: they also need to understand
that some STEM qualifications are more valuable than others.
6

Working in science, engineering or technology occupations (particularly at intermediate level
or below) often attracts a sizeable wage premia. Hence students need guidance that earnings
in many STE occupations are higher than in non STE occupations.
Some qualifications that attract a premium if they are held in a STEM subject also attract an
additional wage premium from being used in a STE occupation. For instance, degrees in
STEM are valued by the labour market anyway but particularly so in STE occupations.
Thus for some qualifications their maximum potential value is for use in STE occupations,
another message for those making career decisions.
7

Introduction
There is growing policy consensus that Science, Technology, Engineering and Mathematics
(STEM) are subject areas that are crucial for a modern economy (DIUS, 2009; CBI, 2011;
Leitch, 2006; UKCES, 2010). Having a sufficient supply of skilled workers trained in these
subjects is therefore seen as a pressing policy priority. Yet it is important to determine
whether employers really do value STEM skills above more general employability and other
skills. Evidence for this would be if employers are prepared to pay a wage premium to
individuals who hold qualifications in STEM subject areas or disciplines. This report
therefore investigates the labour market value of Science, Technology, Engineering and
Mathematics qualifications, focusing specifically on vocational qualifications and the value
of STEM degrees. It is increasingly recognized by policy-makers that many individuals who
acquire STEM qualifications do not work in STEM occupations (DIUS, 2009) and that in fact
employers demand STEM skills even for jobs that are not explicitly STEM jobs (CBI, 2011).
It is therefore an open question whether STEM qualifications would have less value if they
are not actually used in a STEM occupation. Hence we also investigate the relationship
between STEM qualifications held, STEM occupation and wages. Specifically, the research
questions addressed here are:
4) What is the additional wage premium (or penalty) earned by individuals with STEM
qualifications, over and above any return earned for the qualification irrespective of
subject;
5) What is the additional wage premium (or penalty) earned by individuals working in
STEM occupations, irrespective of qualifications held?
6) What is the additional wage premium (or penalty) earned by individuals working in
STEM occupations who also hold STEM qualifications?
This work builds on the FE and Skills STEM Data report published in October 2010 (Blue
Alumni, 2010) and uses the same classification system for Science, Technology, Engineering
and Mathematics qualifications.
8

Related Literature
There is a large literature which has consistently shown that most academic qualifications and
higher level vocational qualifications have substantial value in the UK labour market (e.g.
Dearden et al., 2002; Dickerson 2005). This would suggest that the skills embodied in these
qualifications are valued by employers. However, this same literature has also found that
many vocational qualifications, particularly at lower levels, have lower labour market value
in terms of wages, though many are associated with an increased probability of being in
employment (Dearden et al. 2004; McIntosh, 2004; Dickerson 2005; Jenkins, Greenwood and
Vignoles, 2007). For example, the wage return to NVQ2 qualifications has been found to be
largely nonexistent for males though positive for women (De Coulon and Vignoles, 2008)
and when acquired via an employer (Dearden et al, 2004; Jenkins et al. 2007).
The fact that a number of level 2 vocational qualifications do very little to boost wages is
obviously cause for concern, suggesting that employers may not value the skills embodied in
these qualifications. Further investigations by Jenkins et al. (2007) and others however,
confirmed that in fact the value of many qualifications, including NVQ2, varies substantially
by sector and the occupation of the individual (McIntosh, 2004, Dearden et al. 2004,
Dickenson and Vignoles, 2007; Jenkins et al. 2007). This is presumably because the value of
the qualification acquired varies according to the specific skills learned and how they are
used in the labour market. Taking NVQ2 qualifications as an exemplar, although on average
the wage gain from having these qualifications is virtually zero, this is not true in all sectors.
For example, the wage gain from having a NVQ2 is high in the construction and energy and
water sectors though the gain varies by gender. BTEC level 2 qualifications are particularly
valuable in finance and distribution, hotels and restaurant industries. City and Guilds
qualifications at level 2 have high value in manufacturing and the distribution/hotel sectors.
RSA level 2 qualifications have particularly high value in manufacturing and construction.
These findings suggest that indeed the value of vocational qualifications is likely to vary
across subject areas.
Here we investigate how the returns to qualifications vary by subject area, focusing
particularly on the wage return to STEM subjects. This is a generally under researched area
though it has been shown that literacy and particularly numeracy is highly valued in the UK
9
labour market (De Coulon et al. 2010; Bynner and Parsons 1997a, 1997b, 2005; Grinyer,
2005), as is A level mathematics (Dolton and Vignoles, 2002). There has also been work
suggesting that some STEM degree subjects have greater labour market value than arts and
humanities subjects (Sloane and O’Leary, 2004; Walker and Zhu, 2010). The results from
this literature are mixed however. Sloane and O’Leary (2004) found very high wage premia
for STEM degree subjects such as electrical engineering, mechanical engineering and
mathematics and computing. However, Walker and Zhu (2010) found higher wage premia for
economics, management and law but not for a number of science subjects, such as biology.
Whilst we will not be considering specific STEM subjects in such detail, our analysis
provides further guidance about the value of STEM at degree and sub degree levels of
qualification.
Data
The data used for this project are from the UK Labour Force Survey (LFS). These data are
ideal for our purpose since the LFS data set includes information on the qualifications held by
individuals, the subject area of their qualifications (though this is not available for all
qualifications as detailed below), their occupation (Standard Occupational Classification) and
of course their labour market wages.
The analytical sample consists of wave 1 data from 27 quarters of the UK Labour Force
Survey from the period March 2004 to December 2010 (excludes quarter 4 of 2005). This
provides records for 163,218 people (79,980 men aged 16-64, and 83,238 women aged
16-59). See Table 1 for descriptive statistics of the sample we use by year of LFS. The
sample includes those in employment and with a wage from responding households in a
representative sample of private residential addresses in England and Wales.
The dependent variable used in our model is the log of hourly wage, indexed to 2001 values.
The sample excludes the top and bottom 0.5% of wage-rates to mitigate coding error and the
effect of outliers.
The qualifications modeled are all UK qualifications recorded in the LFS, disaggregated into
National Qualification Framework levels. Individuals holding any specifically Scottish
academic or vocational qualifications aside from degrees (approximately 1%) were dropped
10

since the analysis can only focus on qualifications recorded in the Individual Learner Record
(Further Education) data for England as this is the data set used to determine whether a
qualification is in the STEM subject area or not (see paragraph below for further explanation
of this point). We have subject information for all degrees. We also have subject information
for all vocational qualifications at level 2 or above. This means we do not have subject
information on GCSE/ O levels and GCE A level. In the case of the former, almost everyone
who has 5 GCSEs/ O levels will have at least one STEM qualification and hence it would be
difficult to determine whether taking a STEM GCSE / O level has additional value in the
labour market. In the case of GCE / A level, the absence of subject information is more
problematic but the majority of those holding A levels also hold degrees for which we do
have subject information and hence this problem is less of an issue than it first appears. The
full list of qualifications for which we have subject area information is given in Table 2.1 The
proportion holding each qualification in a STEM subject varies substantially. For example,
30% of higher degrees are in the STEM area whilst only 8% of RSA Higher qualifications are
in STEM subjects, unsurprisingly.
Information on whether a qualification is in a STEM subject area or not is derived from a
previous project commissioned by the Department of Business Innovation and Skills and The
Royal Academy of Engineering to investigate the extent of the STEM offer in the Further
Education and Skills sector in England (Blue Alumni, 2010). This project involved
painstaking work analyzing the Learning Aims Database, the Individual Learner Record and
other Further Education data sets to determine whether each qualification achieved could be
classified as science, technology, engineering or mathematics. To identify qualifications as
STEM or not, strict criteria were used namely:
• STEM qualifications have learning outcomes rooted in STEM and hence are of a
‘technical’ or ‘technology-application/use’ nature;
• STEM qualifications enable progression into further STEM study or a STEM
occupation;
1 Appendix A also provides sample sizes for each qualification observed in the data, the number
holding those qualifications in STEM occupations (see below), the number holding each qualification
in a STEM subject and finally the number of individuals holding each qualification in a STEM subject
who are actually working in a STEM occupation.
11

• The majority of the assessment for a STEM qualification is in the area of STEM
itself;
• Where a qualification might be allocated to a number of STEM categories (e.g.
mathematics and engineering), the dominant category was identified and multiple
categories were minimised.
Qualifications were deemed to be ‘STEM-related’ when Science, Technology, Engineering or
Mathematics feature in many learning objectives (and / or the qualification provides a degree
of learning that will aid progression in STEM) but to a lesser extent than in qualifications
deemed to be STEM..
Full details of how qualifications were allocated to a STEM category or otherwise can be
found in Blue Alumni (2010) – see Tables 2.1 and 2.2 in that report. Around 2,453 of the
qualifications listed in the National Database of Accredited Qualifications and the Learning
Aim Database were identified as STEM or STEM related. In this report however, we focus
only on qualifications identified as STEM (rather than STEM related). This is a reasonable
simplification to make as only the ‘T’ in STEM has any significant number of STEM-related
qualifications, these being predominantly IT user qualifications and qualifications linked to
aspects of design and design technologies.
We also investigate the wage premium associated with being in a STEM occupation. More
specifically since no occupation was classified as being in the area of mathematics, we
investigated the wage differences between occupations classified as S, T or E. The list of
occupations identified as being in STE is given at Appendix B. This list was classified by a
panel drawn from across the STE subjects and disciplines and convened by The Royal
Academy of Engineering. Throughout the report, medicine and medical related occupations
and qualifications are considered to be distinct from STE. Hence we identify
medicine/medicine related occupations separately in our regressions as per the list of
occupations at Appendix C. The distribution of individuals in STE and non STE occupations
is given in Table 3. 40% of individuals in higher managerial or professional jobs are in STE
occupations, whilst just over one quarter of those in lower supervisory or clerical roles are in
STE occupations. It is interesting to note that, according to the classifications adopted here,
STE occupations hardly feature in other job categories (lower managerial and associate
12

professional, intermediate, routine semi routine) and (tautologically) amongst the
unemployed.
Table 4 shows the way in which STEM qualifications are used in the labour market.
Specifically it indicates the proportion of individuals holding each qualification in a STEM
subject who are actually working in a STE occupation2. For some qualifications a high
proportion of those who hold the qualification in a STEM subject also work in a STE
occupation. 48% of those with a higher degree in a STEM subject actually work in a STE
occupation (similar trends were found in Engineering UK, 2010). 35% of those with NVQ4
in a STEM subject work in a STE occupation. Only around one quarter of those with NVQ2
in STEM actually work in a STE occupation. In the main analysis we consider the value of
these qualifications when used generally and when used in STE occupations.
Methodology
The usual way in which to estimate the labour market value of particular qualifications is to
estimate some variant on equation (1) below (e.g. Dearden et al. 2002). This model of (log)
wages relates individuals’ current wages to the qualifications they hold, as well as their other
characteristics. W i indicates individuals’ gross hourly earnings, β 1 is a constant, Qi represents
a vector of qualification indicator variables which take a value of 1 to indicate whether an
individual holds that qualification, X i is a vector of variables indicating individuals’ personal
characteristics and εi is a normally distributed error term. Specifically in our models we
include the individual’s age and age-squared (as a proxy for their years of work experience),
their gender and a vector of indicator variables signifying the region they live in (to allow for
differences in local labour market conditions).
lnW i = β 1+β 2Q i + β 6X i +εi (1)
The equation above therefore indicates that an individual’s wages are determined by their
qualifications and their personal characteristics. If β 2 is positive and statistically significant
this implies that having that qualification has a positive association with wages. The
coefficients on these qualification indicator variables will indicate the approximate wage
premium associated with that particular qualification, as compared to the wages of
individuals who do not hold that qualification. Clearly individuals often hold multiple
2 The full table of descriptive statistics is at Appendix A.
13

qualifications and to deduce their total wage premium over someone with no qualifications at
all one would have to sum the coefficients on all the qualifications that they hold.
However, in our case we are specifically interested in knowing if qualifications classified as
S,T,E or M have additional economic value, over and above any wage premium for the
qualification held regardless of its subject area. To estimate this we include an additional
vector of qualification indicator variables Si which take a value of 1 to indicate if the
particular qualification held is in the STEM subject area. For example, if an individual has a
qualification such as NVQ3 in engineering, then we will measure the wage premium from
holding a NVQ3 (β 2) as well as the additional premium (if any) from holding a NVQ3 in a
STEM subject (in this case engineering). Hence β 3 will measure the additional premium for a
NVQ3 in a STEM subject.
lnW i = β 1+β 2Q i +β 3Si + β 6X i +εi (2)
We start by estimating whether any qualification held by the individual in the general area of
STEM has additional economic value. Hence we include one dummy variable per
qualification which takes a value of 1 if the qualification is in the subject areas of science,
technology, engineering or mathematics. We are also interested in the differences within the
STEM subject area. Our third specification is therefore one in which each qualification
variable has an associated set of four dummy variables indicating whether the qualification is
in science, technology, engineering or mathematics.
We should note that the major methodological problem in this area of work is that it is
difficult to separate out the impact of education on individuals’ wages from the impact of
individuals’ inherent ability. Thus if more able and productive individuals tend to acquire
more education, it is hard to determine whether their higher wages are really down to the
education itself. In our case, we might be concerned that individuals who choose STEM
subjects are more able and hence that some of the apparent wage premium associated with
holding a STEM qualification is actually attributable to the ability of the individuals who take
these subjects. Whilst we cannot deal with this problem directly (e.g. we cannot include
independent measures of individuals’ abilities as is done in some papers such as Dearden et
al. 2002) we are aware of this issue and return to it in the discussion. It means that the
evidence we present is associational rather than necessarily causal.
14

We also investigate the wage premia associated with working in a STE occupation (recall
there are no occupations classified as being in the area of mathematics). In this instance we
estimate equation (3) below where we control for the highest level of qualification a person
has Q i as above but instead of including information on the subject area of their qualification
we instead indicate whether they are working in a STE occupation, where Oi is a dummy
variable indicating whether the individual is in a STE occupation or not. 12% of the sample is
identified as working in a STE occupation.
lnW i = β1+β2Q i +β4Oi + β6X i +εi (3)
Lastly, we ask whether the wage premia associated with a STEM qualification is greater
when the individual is actually working in a STE occupation. For this specification we
estimate the model below:
lnW i = β1+β2Q i + β 3Si +β4Oi + β5 (Oi * Si) + β6X i +εi (4)
In this equation, the wage premium associated with a particular qualification is measured by
β2, the wage premium associated with holding a particular qualification in a STEM subject is
measured by β3, the wage premium associated with working in a STE occupation is measured
by β4 and finally the additional premium from holding a STEM qualification and working in a
STE occupation is measured by β5.
Results
Wage premia for STEM qualifications
Table 5 shows the results of a wage regression which estimates the wage premium associated
with holding a qualification in a STEM subject. The dependent variable is the log of wages
expressed in 2001 levels3 and the regression includes a number of explanatory variables, as
shown in Equation 2 above. Specifically, the regression includes age and age squared, to
allow for differences in earnings across age (i.e. experience). It also includes gender to allow
for known differences in wages by gender and region to allow for differences in earnings
3 We included year variables and interactions with year but these did not affect our results substantially.
15

across different labour markets. The equation includes all qualifications held by an
individual, enabling us to determine the mean value (in terms of wages) of holding a
particular qualification as compared to those who do not hold that qualification. We then
include additional variables (vector S above in equation 2) which indicate whether an
individual holds the particular qualification in question in a STEM subject. This enables us to
determine the additional wage premium from having a STEM subject. In this regression we
also include separate controls for medical qualifications since these are not classified here as
being in the STEM area and individuals with medical qualifications are often high paid, e.g.
Doctors. Hence considering this group separately is important.
When interpreting the results in Table 5 (and subsequent tables) there are a number of pieces
of key information.
The coefficient on each variable tells the reader about the magnitude of the relationship
between having that particular qualification in a STEM subject and the associated gain in
wages. We have provided a second “wage premium” column which tells the reader the gain
in wages associated with having that qualification.
The coefficients shown are calculated from survey data and we need to determine how
accurately they are likely to reflect “real life”, taking account of sample sizes etc. Even where
coefficients are very large and appear to be suggesting a large wage gain we must determine
whether a genuine statistically robust (statistically significant) relationship exists. We do this
by emboldening any coefficient that is statistically significant.
Where coefficients are emboldened this suggests that we can be more confident that the true
value of the coefficient is NOT zero – in other words we can be more confident that there is a
genuine relationship between having that qualification and earning higher wages.
Where a coefficient is statistically significant at the 10% level of significance, this means that
there is only a 10% chance that the true value of that coefficient is zero and that there is a
high chance that we are observing a genuine statistical relationship between holding that
qualification and having higher wages.
Table 5 therefore shows the additional value of holding a qualification in a STEM subject.
For example, holding a first degree in a STEM subject is associated with 4.47% higher
16

wages, as compared to those who hold a first degree in another subject area.4 In more than
half of cases considered the coefficient is statistically insignificant (these are shown as plain
text rather than bold text), meaning we cannot be sure that there is a genuine statistical
relationship between holding that qualification in a STEM subject and higher wages. We can
be sure that there is an additional positive wage premium from having a STEM subject only
for the following qualifications:
• First/foundation degree
• HNC or HND
• RSA Higher Diploma
• NVQ 3
• City and Guilds Foundation/Part 1
• NVQ 2
• City and Guilds Craft/Part 2.
In some instances, there appears to be a wage penalty from holding a STEM subject. For
instance, those with higher degrees in STEM earn marginally less (2%) than those with
higher degrees in non STEM subjects. The only other wage penalty is associated with RSA
Advanced Diploma or Certificate but in this instance only very few people have these
qualifications in STEM (see Appendix A) and this result is therefore not particularly
meaningful.
What one can conclude from Table 5 is that the additional wage premia from having a STEM
subject is significant and sizable for a range of vocational qualifications. In a few instances
however, one has to be careful to also look at the main effect from holding the qualification
which may in a few cases not be positive. Specifically, the main effect from holding an
NVQ2 is negative and significant, suggesting that those who hold NVQ2 as their highest
qualification earn around 8% less than those who do not have any qualifications. Therefore
the additional positive premium from holding an NVQ2 in STEM (5%) would imply that
those who have an NVQ2 in STEM earn a similar amount or even a few percent less than
those without this qualification. By contrast, those with an HNC or HND earn an additional
4 To calculate the total wage premium from holding a First degree in a STEM subject as compared to an individual without that qualification, one needs to sum the coefficient on the First degree variable from the first column Table 5 with the coefficient from the second column. In this instance, the premium from holding a First degree is 30% and we calculate an additional wage premium of 4.5% from holding a degree in a STEM subject. This implies a total wage premium of 34.5%.
17

premium from their STEM subject of around 8% which is on top of the overall value of
HNC/HND which is around 11%, providing a total wage premium of 19%.
Table 6 then shows the wage premia associated with holding qualifications in particular
subject areas, rather than STEM as a whole. For example, it shows the premium from holding
a higher degree in either of the following subject areas: science, technology, engineering or
mathematics. This enables us to determine whether employers value some parts of STEM
more highly than others for a given type of qualification. The regressions are structured as in
Table 5, i.e. they control for age, age squared, gender, region and highest qualification. They
include separate controls for medical qualifications.
Table 6 indicates that in science it is rare that individuals earn an additional premium for
holding a qualification in this subject area. We know this because many of the coefficients
are statistically insignificant (plain text rather than emboldened). Further, some coefficients
are both negative and statistically significant. This suggests that holding these qualifications
in science may be associated with lower wages than holding that qualification in a non
science subject. In fact those with a science NVQ5 or other higher education qualification
below degree level actually earn significantly less than individuals with these qualifications
in non STEM subject areas, as do those with sub degree higher education qualifications in
science subjects. The one exception to this pattern is that individuals who hold a BTEC
National Certificate/Diploma in science earn 8% more than those who hold this qualification
in a non STEM subject area (this result is statistically significant and hence is emboldened).
In technology, an additional premium is earned by those holding NVQ 5, City and Guilds
Part I or City and Guilds Part II (these coefficients are positive and bold). By and large
however, most other qualifications do not attract an additional wage premium if they are held
in a non STEM subject area. In the case of a first degree, higher education diploma or BTEC
National Certificate/Diploma, those with these qualifications in the technology field actually
earn less than those with these qualifications in a non STEM subject.
In engineering, a large number of qualifications do attract an additional wage premium if they
are held in this subject area (coefficients are positive and bold). Those with first degrees,
HNC or HND, NVQ3, City and Guilds Part I, NVQ2, City and Guilds Part II in engineering
earn a wage premium over those who have these qualifications in a non STEM subject area.
18

Only those with higher degrees in engineering earn significantly less than those who have
higher degrees in non STEM subjects (by 5%).
In mathematics, those with first degrees and diplomas in higher education do earn
significantly more than those who hold these qualifications in non STEM subject areas.
However, those with RSA Advanced Diploma or City and Guilds Part I earn significantly
less than those who hold these qualifications in non STEM subjects.
In summary, there is no consistent pattern across the different STEM subject areas and this,
combined with relatively small sample sizes in some instances, explains why in Table 5 we
only identified a limited number of qualifications as attracting a wage premium from being in
STEM. Many qualifications simply do not attract an additional wage premium from being in
any specific science, technology, engineering or mathematics domain. That said, some
qualifications in each subject area do attract quite considerable wage premia: these
qualifications are indeed significantly more valuable if they are in a particular STEM subject.
Further, we noted that in technology and engineering specifically, a relatively wide range of
qualifications do attract an additional wage premium due to being in that subject area.
Wage premia for STE occupations
Table 7 presents the results of wage regressions which estimate the wage premium associated
with working in a STE occupation as per equation 3 above (note that no mathematics
occupations are identified in the labour market per se hence we refer in this section to STE
rather than STEM). These regressions include the same controls as the qualification equations
i.e. age, age squared, gender and region. In these regressions we also include separate
controls for those working in medical occupations. As explained above, this is because for
this report both medical qualifications and medical occupations are considered to be outside
the main STE area. The classification of occupations used is shown in Appendices B and C.
The classification was undertaken by a panel drawn from across the STE subjects and
disciplines and convened by The Royal Academy of Engineering.
The first panel of Table 7 shows that on average, and after allowing for differences in
individuals’ characteristics (e.g. gender) and qualification level, those working in a STE
19

occupation earn approximately 19% more than those not working in STE occupations. Again
any coefficient that is statistically significant is signified in bold. In this particular table, all
the coefficients are statistically significant. This large premium from working in a STE
occupation does not however distinguish between different STE occupations (i.e. those in
science, technology etc.) and represents an average wage premium across all occupations that
could be categorised as science, technology or engineering. This wage premium is the also
the premium earned by those working at all levels of STE occupations, as compared to
individuals in non STE occupations. If those in STE occupations tend to be in higher level
occupations, this estimate may reflect the level of qualification as much as subject area, an
issue we return to below.
The second panel of Table 7 shows the wage premia associated with being in either a science,
technology or engineering occupation separately. This allows us to unpack the overall wage
premium associated with being in a STE occupation. According to this second specification,
those working in science occupations actually earn significantly less than those who do not
work in a non science occupation (by around 7%). This is consistent with some lower wage
premia associated with science qualifications discussed in the previous section. By contrast,
those working in technology occupations earn on average 26% more than those who do not
and those in engineering occupations earn 10% more. This specification does not however
take account of the fact that many occupations are related to more than one STE domain. For
example, some occupations may be classified as being both science and engineering. The
final specification in this table allows for these interaction effects.
The bottom panel of Table 7 shows the wage premia associated with being in either a science,
technology or engineering occupation or indeed an occupation that is some combination of
STE subjects, such as science and engineering. These categories are mutually exclusive.
Hence an individual in an occupation classed as a science occupation would appear in the
science category, whilst someone in an occupation classed as a science/engineering
occupation would appear only in the SE category. According to this third specification, once
we allow for these interaction effects, those working in a science-only occupation specifically
earn significantly more than those who do not work in a STE occupation (by around 10%).
Those working in technology-only occupations earn on average 33% more and those in
engineering-only occupations 15% more than individuals working in non-STE occupations.
Those working in occupations combining science and engineering actually earn less than
20

those working in non-STE occupations i.e. they earn a wage penalty of 7%. Those working in
occupations combining engineering and technology have premia of 14% and those combining
science, engineering and technology of 18% compared with those in non-STE occupations.
Hence when we allow for the possible combinations of STE subjects, it is only those in
occupations classified as both science and engineering-based that actually earn less than those
in non-STE occupations.
It is clear from these results that there are sizable wage premia associated with being in a STE
occupation. The sole exception is the group (n=651) that are in occupations classed as being
in both science and engineering. This category includes occupations such as research and
development managers and electrical / electronic technicians (Appendix B).
These average benefits from working in a STE occupation may however vary by level of
occupation and as discussed earlier we may be confounding level of occupation with subject
area. We therefore estimate separate models for those in professional occupations (NS-SEC
Group 1), managerial occupations (NS-SEC Group 2) and those in occupations below
managerial (all other NS-SEC Groups). In other words we determine the value of working in
a STE occupation for professional, managerial and other occupations separately. These
results are presented in Table 8. A very interesting pattern emerges. Those in professional or
indeed in managerial STE occupations earn less than those in non STE occupations at the
same level (the coefficients are negative and statistically significant). However, below
managerial level there is a very large benefit from working in a STE occupation: those in
STE occupations below managerial level earn 17% more than those not in STE occupations.
When we break this overall STE effect out to consider science, technology and engineering
separately (and combinations of these groups) we find these patterns still hold. Generally
those in STE occupations below managerial level earn more than those in non STEM
occupations at a similar level.
For those in professional jobs, only those in technology occupations or occupations
combining science, engineering and technology earn a wage premium over non STE
occupations at that level (of 2% and 5% respectively). For those in managerial groups
generally we see no significant wage premia from working in STE occupations and those in
engineering management actually earn significantly less than those in non-STE management
occupations.
21

For occupations below managerial level, those in science, technology or engineering (or
combinations of) earn more than those in other occupations - though in the case of
occupations combining science and engineering the coefficient is not statistically significant.
For example, those in science occupations earn 14% more than those in non STE
occupations; those in technology occupations earn 24% more and those in engineering earn
16% more than those in STE occupation at this level. Those in engineering/technology
occupations earn 30% more than those in non STE occupations and those in occupations
combining science, engineering and technology earn 22% more.
These findings perhaps reflect the fact that many senior professional and managerial level
jobs are not identified as being specifically STE occupations, though many people in these
jobs have STEM qualifications and may be working in STEM-related sectors. It does
however, raise the question as to whether those who want to remain in STEM to the highest
levels of occupation end up earning no more (and in some cases less) than their non STEM
colleagues. This would clearly provide limited incentive for career progression within STEM.
Wage premia for STEM qualifications used in STE occupations
In this last section, we consider the value of STEM qualifications when used in STE
occupations. Table 9 presents the results of wage regressions which estimate the wage
premium associated with a STEM qualification when used in a STE occupation as per
equation 4 above. These regressions include the same controls as the previous equations i.e.
age, age squared, gender and region. In these regressions we include a) a main effect from
having a particular qualification b) an additional effect from having a qualification in a
STEM subject and c) an additional effect from having a STEM-subject qualification in a STE
occupation5.
Ignoring the main effect of qualifications, Table 9 presents the specific premia from holding a
qualification in a STEM subject and any additional premia from having that STEM
qualification if it is used in a STE occupation. The first set of columns provides an estimate
of the wage premia from having a qualification in a STEM subject area. These are the premia
that would apply if someone has obtained the qualification in a STEM subject but does not 5 We do not include a separate main effect for STE occupation, since we know this varies considerably across the occupational-hierarchy thus confounding the qualification-specific interactions.
22

work in a STE occupation. The second set of columns then provides an estimate of the
additional wage premia from using the STEM-subject qualification in a STE occupation. The
total additional effect from having a STEM qualification and using it in a STE occupation is
therefore obtained by summing the first two effects as indicated in the final column.
Table 9 shows that a number of STEM qualifications attract sizable premia if they are used in
a STE occupation. For example, first degrees in STEM subjects attract a sizable additional
premia if they are used in a STEM occupation (13%). However, not all higher level
qualifications in STEM subjects attract an additional premium if they are used in a STE
occupation, consistent with the previous evidence that STE occupations at the professional
and managerial level do not always yield an additional premium. Thus those who progress to
higher degree level in a STEM subject and who actually use it in a STE occupation earn
significantly less than those who have a higher degree in a STEM subject and use it in a non
STE occupation (by 6%). Those with STEM-subject vocational degrees, NVQ 4 or NVQ5
qualifications who also work in STE occupations do not earn significantly more (or less) than
their peers in other occupations (the coefficients are statistically insignificant). However,
those who have a STEM-subject diploma do earn significantly more (3.4%) if they use it in a
STE occupation. Individuals with STEM HNC or HND qualifications earn significantly more
than those with other HNC or HNDs (4%) but they earn a lot more (11%) if they actually use
these qualifications in a STE occupation. A number of STEM qualifications at level 3 in
particular attract an additional wage premia if used in a STE occupation. The following
qualifications earn an additional wage premium if they are used in a STE occupation: RSA
Higher Diplomas (5%), NVQ3 (6%), BTEC National Certificate/Diploma (6%), ONC or
OND (<1%), City and Guilds Foundation (10%).
In summary, many but by no means all STEM-subject qualifications have additional value of
they are also used in a STE occupation. It is of note that STEM-subject first degrees do have
additional value if they are used in a STE occupation. Ideally one would like to know the
value of a qualification in a particular STEM subject (e.g. science) when it is used in a
particular STE occupation (e.g. science). However, sample sizes preclude us from identifying
these complex interaction effects at that level of detail. However, given the patterns observed
earlier in the wage premia associated with different STEM subject areas, one might expect a
similar pattern here with higher value for most technology and engineering subjects rather
than science though this is likely to vary by occupation level too.
23

Conclusions
In the analysis above we considered the following:
• the value of any qualifications held in STEM subjects,
• the additional wage premia earned by working in a STE occupation, and
• the total wage premia earned by those with STEM qualifications working STE
occupations.
The results indicated that on average many qualifications have higher labour market value if
they are in a STEM subject. Indeed there are additional positive wage premia from holding a
range of qualifications at all levels in a STEM subject (e.g. degrees, NVQ2, City and Guilds
Foundation, NVQ3, HNC/HND). When we looked in more detail however, at particular
STEM subject areas, we found a mixed pattern. In general there are no wage premia for
qualifications held in science bar BTEC National Certificates/Diplomas. More qualifications
attract an additional premium in technology, namely NVQ5 and City and Guilds Part I/II. In
mathematics, those with first degrees and diplomas in higher education do earn significantly
more than those who hold these qualifications in other subject areas. In engineering, a larger
number of qualifications do attract an additional wage premium if they are held in this subject
area. In many instances however, qualifications in science, engineering or mathematics
actually have a slightly lower wage premia than the same qualification in another subject
area.
In terms of occupations, those working in STE earn a great deal more than those who are not
in STE occupations (19%). Again however, the premium is less for science. Those in science
generally earn an additional wage premium of 10% whilst those working in technology,
engineering and different combinations of these subjects earn much more than those in non
STE occupations (14-34% more). When we investigated these results further, we found that
the premium from working in a STE occupation is largely for those working at intermediate
and lower level occupations (i.e. not at professional or managerial level). We argued that
these findings reflect the fact that many senior level jobs are not identified as being
specifically STEM though many people in those jobs do have STEM qualifications.
24

Lastly we considered the value of STEM qualifications in STE occupations. In many
instances, including degrees, STEM qualifications attract a further additional premium if they
are used in a STE occupation. In other words, individuals earn a premium from having a
STEM qualification and then a further premium from working in a STE occupation. This was
particularly true at level 3 (intermediate) qualifications. In some cases there is a particularly
sizeable premium if a STEM qualification is used in a STE occupation (e.g. degrees,
HNC/HND, City and Guilds Foundation/Part I).
We conclude that:
• Many but not all qualifications have additional value in the labour market if they are
in a STEM subject area though less so in science and more so in engineering;
• Most STE intermediate and lower level occupations attract additional wage premia
though less so for science and more so for technology and engineering;
• Some but not all STEM qualifications have considerable additional value in the
labour market if they are used in a STE occupation.
There are a number of policy implications of this work but first some caveats. We are unable
to allow for the cognitive or other types of ability of individuals and hence where we see
wage premia this may reflect the fact that more able people (who would earn more anyway)
tend to take STEM qualifications or indeed work in STE occupations. Our analysis is
therefore not necessarily causal. The second issue is that sample sizes often preclude us
looking at the level of detail we would like to. For instance, we do not find significant wage
premia by and large for those working in STE at managerial level but this may reflect the
relatively small numbers of people working in these occupations. We also focus our attention
only on the wage effects from having STEM qualifications: future work could usefully look
at whether such qualifications also have an impact on the likelihood of being in employment
and the type of employment gained.
Despite these issues, the work does reveal interesting, and in some instances surprising,
patterns. STEM qualifications are not all alike and across the different STEM areas we found
very different results. In particular, qualifications in science and indeed science occupations
often do not attract high wage premia, whereas those in engineering and technology often do.
It does vary by qualification level and type though. This means the advice given to young
25

people needs to be far more nuanced than it currently is. It is not enough to urge young
people to study STEM subjects: they also need to understand that some STEM qualifications
are more valuable than others. Our evidence also indicates that STE occupations (particularly
at intermediate level or below) often attract a sizeable wage premia. Hence students need
guidance that earnings in many STE occupations are higher than in non STE occupations.
However, again the picture is mixed across the different STE areas. As we found in the case
of qualifications, those working in science occupations earn a smaller (though still positive)
premium as compared to those working in technology or engineering for example. Most
interestingly some qualifications that attract a premium if they are held in a STEM subject
also attract an additional wage premium from being used in a STE occupation. For instance,
degrees in STEM are valued by the labour market anyway but particularly so in STE
occupations. Thus for some qualifications their maximum potential value is for use in STE
occupations, another message for those making career decisions.
26

References
Blue Alumni, (2010) Research Project: FE and Skills STEM Data, Department of Business
Innovation and Skills and The Royal Academy of Engineering report http://www.thedataservice.org.uk/statistics/other_statistics_and_research.
Bynner, J. and Parsons, S. (1997a.) It Doesn’t Get Any Better: The Impact of Poor Basic
Skills on the Lives of 37 year-olds. London: Basic Skills Agency.
Bynner, J. and Parsons, S. (1997b). Does Numeracy Matter? London: Basic Skills Agency.
Bynner, J. and Parsons, S. (2005) New Light on Literacy and Numeracy: Results of the
Literacy and Numeracy Assessment in the Age 34 Follow-up of the 1970 Cohort
Study (BCS70), NRDC main report.
CBI (2011) Building for growth: business priorities for education and skills: education and
skills survey 2011, http://educationandskills.cbi.org.uk/uploaded/20110509-building-
for-growth.pdf.
Dearden L, McIntosh S, Myck M and Vignoles A (2002), “The Returns to Academic and
Vocational Qualifications in Britain”, Bulletin of Economic Research, 54, pp.249-274.
Dearden, L; McGranahan, L; Sianesi, B. (2004). “An In-depth Analysis of the Returns to
National Vocational Qualifications Obtained at Level 2”, Centre for Economics of
Education Discussion Paper No. 46.
De Coulon, A., Marcenaro-Gutierrez, O. and Vignoles, A. (2010) “The value of basic skills
in the British labour market”, Oxford Economic Papers, vol. 10, pp.1093.
Dickerson A P (2005) A study on rates of return to investment in level 3 and higher
qualifications, DTI, December 2005.
Dickerson, A. and Vignoles, A. (2007) ‘The Distribution and Returns to Qualifications in the
Sector Skills Councils’, SSDA Research Report No.21 Wath-upon-Dearne: Sector
Skills Development Agency.
DIUS (2009) The Demand for Science, Technology, Engineering and Mathematics (STEM)
skills, January 2009.
Dolton, P. and Vignoles, A. (2002) ‘The Return to Post-Compulsory School Mathematics
Study’, Economica, Vol. 69, No. 273, pp.113-142.
27
Engineering UK (2010) Engineer UK 2009/10 Report.
Grinyer, J. (2005) Literacy, Numeracy and the labour market: Further analysis of the Skills
for Life survey, Department for Education and Skills report.
Jenkins, A., Greenwood, C. and Vignoles, A. (2007) ‘The Returns to Qualifications in
England: Updating the Evidence Base on Level 2 and Level 3 Vocational
Qualifications’, Department for Innovation, Universities and Skills and Centre for the
Economics of Education Discussion Paper CEEDP0089, London School of
Economics.
Leitch Review of Skills (2006) Skills in the UK: the long term challenge – Final Report,
December 2006.
McIntosh, S. (2004). “The Impact of Post-school Vocational Qualifications on the Labour
Outcomes of Low-achieving School Leavers in the UK”, Centre for Economics
Performance, London School of Economics.
McIntosh, S. and Vignoles, A. (2001) “Measuring and assessing the impact of basic skills on
labour market outcomes”, Oxford Economic Papers, Vol.53, No.3, pp.453-481.
Sloane P J and O’Leary N C (2004) “The return to a university education in Great Britain”,
IZA Discussion Paper No 1199, Bonn, Germany.
UKCES (2010) A Theoretical Review of Skill Shortages and Skill Needs: Evidence Report
20, May 2010.
Walker, Ian & Zhu, Yu, 2010. "Differences by Degree: Evidence of the Net Financial Rates
of Return to Undergraduate Study for England and Wales," IZA Discussion Papers
5254, Institute for the Study of Labor (IZA).
Walker, I. and Y. Zhu (2008) "The College Wage Premium and the Expansion of Higher
Education in the UK," Scandinavian Journal of Economics, Wiley Blackwell, vol.
110(4), pages 695-709, December.
28
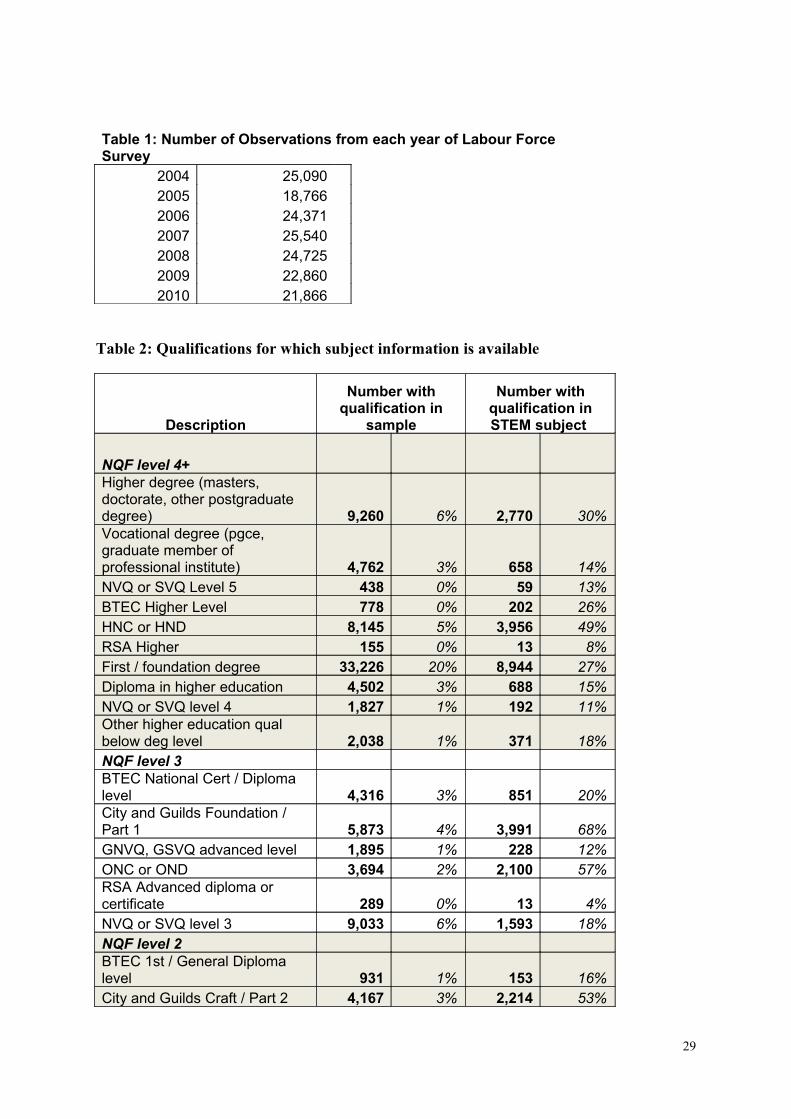
Table 1: Number of Observations from each year of Labour Force Survey
2004 25,0902005 18,7662006 24,3712007 25,5402008 24,7252009 22,8602010 21,866
Table 2: Qualifications for which subject information is available
Description
Number with qualification in
sample
Number with qualification in STEM subject
NQF level 4+Higher degree (masters, doctorate, other postgraduate degree) 9,260 6% 2,770 30%Vocational degree (pgce, graduate member of professional institute) 4,762 3% 658 14%NVQ or SVQ Level 5 438 0% 59 13%BTEC Higher Level 778 0% 202 26%HNC or HND 8,145 5% 3,956 49%RSA Higher 155 0% 13 8%First / foundation degree 33,226 20% 8,944 27%Diploma in higher education 4,502 3% 688 15%NVQ or SVQ level 4 1,827 1% 192 11%Other higher education qual below deg level 2,038 1% 371 18%NQF level 3BTEC National Cert / Diploma level 4,316 3% 851 20%City and Guilds Foundation / Part 1 5,873 4% 3,991 68%GNVQ, GSVQ advanced level 1,895 1% 228 12%ONC or OND 3,694 2% 2,100 57%RSA Advanced diploma or certificate 289 0% 13 4%NVQ or SVQ level 3 9,033 6% 1,593 18%NQF level 2BTEC 1st / General Diploma level 931 1% 153 16%City and Guilds Craft / Part 2 4,167 3% 2,214 53%
29

GNVQ, GSVQ intermediate level 1,445 1% 186 13%RSA Diploma 493 0% 34 7%NVQ or SVQ level 2 10,277 6% 1,473 14%
Table 3: NS - SEC class main occupation
Not STEM STEM Total
Higher managerial and professional 14,235 9,129 23,364
60.93 39.07 100Lower managerial and assoc professional 44,708 4,232 48,940
91.35 8.65 100Intermediate occupations 21,304 852 22,156
96.15 3.85 100Lower supervisory and clerical 13,272 4,893 18,165
73.06 26.94 100Semi-routine occupations 26,133 376 26,509
98.58 1.42 100Routine occupations 17,433 377 17,810
97.88 2.12 100Never worked, unemployed 6,060 214 6,274
96.59 3.41 100Total 143,145 20,073 163,218
87.70 12.30 100
30

Table 4: Proportion of those holding qualifications in STEM who are in STEM occupations
Description
Number with this
qualification in a STEM
subject
Number with STEM subject and
in STEM occupation
N N
NQF level 4+
Higher degree (masters, doctorate, other postgraduate degree) 2,770 1,327 48%
Vocational degree (pgce, graduate member of professional institute) 658 157 24%NVQ or SVQ Level 5 59 21 36%BTEC Higher Level 202 111 55%HNC or HND 3,956 2,014 51%RSA Higher 13 1 8%First / foundation degree 8,944 3,986 45%Diploma in higher education 688 138 20%NVQ or SVQ level 4 192 68 35%Other higher education qual below deg level 371 83 22%
NQF level 3BTEC National Cert / Diploma level 851 394 46%City and Guilds Foundation / Part 1 3,991 1,847 46%GNVQ, GSVQ advanced level 228 89 39%ONC or OND 2,100 1,085 52%RSA Advanced diploma or certificate 13 0 0%NVQ or SVQ level 3 1,593 671 42%NQF level 2BTEC 1st / General Diploma level 153 61 40%City and Guilds Craft / Part 2 2,214 856 39%GNVQ, GSVQ intermediate level 186 39 21%RSA Diploma 34 3 9%
31

NVQ or SVQ level 2 1,473 380 26%
32
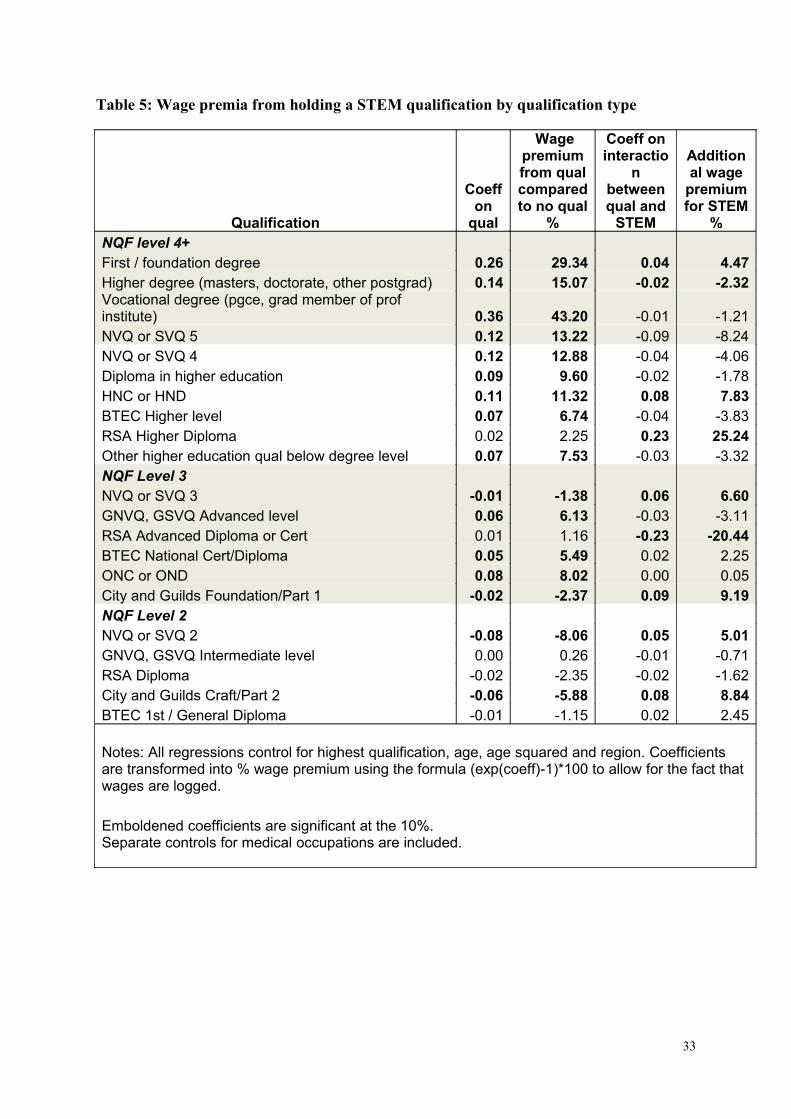
Table 5: Wage premia from holding a STEM qualification by qualification type
Qualification
Coeff on
qual
Wage premium from qual compared to no qual
%
Coeff on interactio
n between qual and
STEM
Additional wage
premium for STEM
%NQF level 4+First / foundation degree 0.26 29.34 0.04 4.47Higher degree (masters, doctorate, other postgrad) 0.14 15.07 -0.02 -2.32Vocational degree (pgce, grad member of prof institute) 0.36 43.20 -0.01 -1.21NVQ or SVQ 5 0.12 13.22 -0.09 -8.24NVQ or SVQ 4 0.12 12.88 -0.04 -4.06Diploma in higher education 0.09 9.60 -0.02 -1.78HNC or HND 0.11 11.32 0.08 7.83BTEC Higher level 0.07 6.74 -0.04 -3.83RSA Higher Diploma 0.02 2.25 0.23 25.24Other higher education qual below degree level 0.07 7.53 -0.03 -3.32NQF Level 3NVQ or SVQ 3 -0.01 -1.38 0.06 6.60GNVQ, GSVQ Advanced level 0.06 6.13 -0.03 -3.11RSA Advanced Diploma or Cert 0.01 1.16 -0.23 -20.44BTEC National Cert/Diploma 0.05 5.49 0.02 2.25ONC or OND 0.08 8.02 0.00 0.05City and Guilds Foundation/Part 1 -0.02 -2.37 0.09 9.19NQF Level 2NVQ or SVQ 2 -0.08 -8.06 0.05 5.01GNVQ, GSVQ Intermediate level 0.00 0.26 -0.01 -0.71RSA Diploma -0.02 -2.35 -0.02 -1.62City and Guilds Craft/Part 2 -0.06 -5.88 0.08 8.84BTEC 1st / General Diploma -0.01 -1.15 0.02 2.45 Notes: All regressions control for highest qualification, age, age squared and region. Coefficients are transformed into % wage premium using the formula (exp(coeff)-1)*100 to allow for the fact that wages are logged. Emboldened coefficients are significant at the 10%.Separate controls for medical occupations are included.
33

Table 6: Wage premia from holding particular qualifications in each STEM subject
Qualification
Coeff on
science
Wage premium from science qual %
Coeff on
tech
Wage premium from
tech qual %
Coeff on eng
Wage premium from
eng qual %
Coeff on
maths
Wage premium from maths qual %
NQF level 4+First / foundation degree -0.01 -0.82 -0.08 -7.55 0.07 7.27 0.09 9.06
Higher degree (masters, doctorate, other postgrad) 0.01 1.07 0.04 4.07 -0.05 -4.53 -0.03 -3.24
Vocational degree (pgce, grad member of prof institute) 0.00 0.21 0.01 1.35 -0.03 -3.32 0.00 -0.45NVQ or SVQ 5 -0.29 -25.22 0.39 48.10 -0.06 -6.24 -0.20 -17.81NVQ or SVQ 4 -0.06 -5.41 -0.01 -0.75 -0.01 -1.11 0.01 0.60Diploma in higher education 0.00 0.10 -0.12 -11.30 0.02 2.10 0.07 6.97HNC or HND -0.02 -1.64 -0.03 -2.75 0.11 11.69 0.04 3.71BTEC Higher level -0.02 -1.78 0.01 1.21 -0.03 -3.26 -0.05 -5.21RSA Higher Diploma 0.43 53.77 -0.28 -24.43 0.17 18.91 -0.03 -3.24
Other higher education qual below degree level -0.07 -6.56 0.04 3.74 -0.03 -2.86 0.03 2.85NQF level 3 NVQ or SVQ 3 -0.01 -1.25 0.00 0.28 0.10 10.21 -0.06 -5.51GNVQ, GSVQ Advanced level 0.00 -0.16 -0.04 -4.19 0.02 1.63 -0.07 -6.88RSA Advanced Diploma or Cert -0.19 -17.34 -0.02 -2.43 0.32 37.39 -0.27 -23.59BTEC National Cert/Diploma 0.08 8.32 -0.09 -8.61 0.03 3.06 0.05 5.60ONC or OND -0.02 -1.77 0.04 3.58 0.00 0.27 -0.03 -2.49City and Guilds Foundation/Part 1 -0.02 -1.65 0.07 6.88 0.10 10.27 -0.11 -10.24NQF level 2 NVQ or SVQ 2 0.01 0.92 -0.02 -1.81 0.06 6.24 0.01 0.57GNVQ, GSVQ Intermediate level -0.05 -4.50 -0.08 -8.06 0.06 5.91 0.01 0.72RSA Diploma -0.18 -16.65 -0.09 -8.72 0.17 19.02 0.03 3.54City and Guilds Craft/Part 2 -0.06 -5.88 0.12 12.31 0.10 10.23 -0.04 -4.40BTEC 1st / General Diploma 0.09 9.42 0.00 -0.12 0.00 0.16 0.01 0.83 Notes: All regressions control for highest qualification, age, age squared and region.
Coefficients are transformed into % wage premium using the formula (exp(coeff)-1)*100 to allow for the fact that wages are logged.
Emboldened coefficients are significant at the 10% level. Separate controls for medical occupations are included.

Table 7: Wage premia from working in a STEM occupation
Sample
size Coeff
Wage premium
%Specification 1 STEM 20,295 0.17 18.79 Specification 2 S 2,945 -0.080 -7.40 T 7,624 0.230 25.52 E 13,541 0.100 10.03 Specification 3 S 1,204 0.098 10.33 T 5,550 0.288 33.39 E 10,816 0.136 14.59 S and E 651 -0.073 -7.01 E and T 984 0.130 13.86 S, E and T 1,090 0.162 17.60 Notes: All regressions control for highest qualification, age, age squaredand region. Coefficients are transformed into % wage premium Using the formula (exp(coeff)-1)*100 to allow for the fact that wages are logged.All coefficients reported are significant at the 10% level. Separate controls for medical occupations are included.

Table 8: Wage premia from working in a STEM occupation by level of occupation
All occupations Professional ManagerialBelow
Managerial
Coeff
Wage premiu
m % Coeff
Wage premiu
m % Coeff
Wage premiu
m % Coeff
Wage premiu
m %Specification 1 STEM 0.17 18.53 -0.034 -3.33 -0.038 -3.73 0.158 17.12 Specification 2 S -0.080 -7.69 -0.098 -9.34 -0.145 -13.50 -0.054 -5.26 T 0.230 25.86 0.030 3.07 0.029 2.94 0.117 12.41 E 0.100 10.52 -0.047 -4.58 -0.012 -1.19 0.143 15.37 Specification 3 S 0.098 10.30 -0.163 -15.02 n/a 0.134 14.32 T 0.288 33.38 0.019 1.92 0.001 0.15 0.213 23.76 E 0.136 14.57 -0.060 -5.87 -0.01 -1.06 0.144 15.54 S and E -0.073 -7.04 n/a -0.22 -19.99 0.073 7.62 E and T 0.130 13.85 -0.130 -12.23 -0.010 -1.00 0.261 29.88
S, E and
T 0.162 17.59 0.052 5.31 0.010 1.00 0.195 21.52 Notes: All regressions control for highest qualification, age, age squared and region. Coefficients are transformed into % wage premium using the formula (exp(coeff)-1)*100 to allow for the fact that wages are logged. Bold coefficients significant at 10% level. Separate controls for medical occupations are included.
36

Note professional is NS-SEC Group 1, managerial NS-SEC Group 2 and below managerial is NS-SEC everything else
37

Table 9: Wage premia from having STEM qualification in a STEM occupation
Premia on STEM
qualification
Additional benefit from STEM
qualification used in STEM occupation
Approx total
premia
Qualification
Coeff on
qual Wage
premium Coeff
on qual Wage
premium NQF level 4+ First / foundation degree -0.01 -1.42 0.13 14.14 12.72Higher degree (masters, doctorate, other postgrad) 0.00 0.14 -0.06 -6.20 -6.06Vocational degree (pgce, grad member of prof institute) -0.03 -2.66 0.06 6.05 3.39NVQ or SVQ 5 -0.06 -6.22 -0.07 -6.42 -12.64NVQ or SVQ 4 -0.03 -3.00 -0.02 -2.31 -5.31Diploma in higher education -0.02 -2.30 0.03 3.37 1.07HNC or HND 0.04 3.73 0.07 7.40 11.13BTEC Higher level -0.09 -8.76 0.08 8.18 -0.59RSA Higher Diploma 0.22 24.94 0.05 5.01 29.95Other higher education qual below degree level -0.06 -5.92 0.13 13.52 7.60NQF level 3NVQ or SVQ 3 0.04 3.76 0.06 5.81 9.57GNVQ, GSVQ Advanced level -0.06 -5.44 0.05 5.48 0.04RSA Advanced Diploma or Cert -0.22 -19.84 Omitted BTEC National Cert/Diploma -0.01 -1.08 0.06 5.87 4.79ONC or OND -0.01 -0.78 0.01 0.64 -0.14City and Guilds Foundation/Part 1 0.04 4.58 0.10 9.98 14.55NQF level 2NVQ or SVQ 2 0.03 3.55 0.06 6.22 9.77GNVQ, GSVQ Intermediate level 0.00 0.21 -0.03 -2.77 -2.56RSA Diploma -0.02 -2.33 0.16 16.95 14.63City and Guilds Craft/Part 2 0.05 5.26 0.09 5.26BTEC 1st / General Diploma -0.03 -3.26 0.14 14.74 11.48 Notes: All regressions control for highest qualification, age, age squared and region. Coefficients are transformed into % wage premium Using the formula (exp(coeff)-1)*100 to allow for the fact that wages are logged. Bold coefficients significant at 10% level. Separate controls for medical occupations are included.

Appendix A – Qualifications with subject information available and coded as STEM
(A) Number with
qualification
(B) Number with qualification in
STEM occupation
Subject of qual availabl
eC) Number with STEM subject
D) Number with STEM subject and
in STEM occupation
N % (sample) N % (of A) N% (of
A) N % (of C)Higher degree (masters, doctorate, other postgraduate degree) 9,260 6% 1,949 21% Y 2,770 30% 1,327 48%Vocational degree (pgce, graduate member of professional institute) 4,762 3% 299 6% Y 658 14% 157 24%NVQ or SVQ Level 5 438 0% 60 14% Y 59 13% 21 36%BTEC Higher Level 778 0% 177 23% Y 202 26% 111 55%HNC or HND 8,145 5% 2,778 34% Y 3,956 49% 2,014 51%Nursing or other medical qual n.e.c. 5,059 3% 66 1% RSA Higher 155 0% 3 2% Y 13 8% 1 8%Teaching qual, excl PGCE (all levels except foundation) 3,671 2% 77 2% First / foundation degree 33,226 20% 6,029 18% Y 8,944 27% 3,986 45%Diploma in higher education 4,502 3% 392 9% Y 688 15% 138 20%NVQ or SVQ level 4 1,827 1% 194 11% Y 192 11% 68 35%Other higher education qual below deg level 2,038 1% 171 8% Y 371 18% 83 22%Apprenticeship 13,376 8% 4,926 37% Modern Apprenticeship ( any type except foundation level) 731 0% 327 45% BTEC National Cert / Diploma level 4,316 3% 695 16% Y 851 20% 394 46%City and Guilds Foundation / Part 1 5,873 4% 2,199 37% Y 3,991 68% 1,847 46%GNVQ, GSVQ advanced level 1,895 1% 220 12% Y 228 12% 89 39%ONC or OND 3,694 2% 1,417 38% Y 2,100 57% 1,085 52%

RSA Advanced diploma or certificate 289 0% 11 4% Y 13 4% 0 0%Access to HE qual 440 0% 24 5% A-level, voc A-level, equiv 39,398 24% 5,628 14% A/S-level, voc A/S-level, equiv 758 0% 34 4% NVQ or SVQ level 3 9,033 6% 1,098 12% Y 1,593 18% 671 42%BTEC 1st / General Diploma level 931 1% 124 13% Y 153 16% 61 40%City and Guilds Craft / Part 2 4,167 3% 1,070 26% Y 2,214 53% 856 39%GNVQ, GSVQ intermediate level 1,445 1% 123 9% Y 186 13% 39 21%RSA Diploma 493 0% 13 3% Y 34 7% 3 9%A-level, voc A-level, equiv (just one ) 7,296 4% 898 12% A/S-level, voc A/S-level, equiv (just 2-3) 2,543 2% 262 10% CSE grade 1 6,657 4% 896 13% GCSE, vocat GCSE 5 or above 35,841 22% 4,439 12% NVQ or SVQ level 2 10,277 6% 708 7% Y 1,473 14% 380 26%O-level or equivalent 5 or above 37,612 23% 5,441 14% Modern Apprenticeship Foundation level 1,554 1% 567 36% Basic Skills qual 1,192 1% 78 7% BTEC 1st / General Certificate level 1,820 1% 340 19% City and Guilds Advanced craft / Part 3 8,294 5% 1,782 21% GNVQ, GSVQ Foundation level 1,284 1% 144 11% Key Skills qual 979 1% 113 12% Other prof, voc, foreign quals 54,590 33% 6,903 13% RSA Other 8,210 5% 259 3% Youth Training Certificate 611 0% 84 14% CSE grade 2-5 15,860 10% 2,011 13% GCSE, vocat GCSE <5 20,147 12% 2,221 11% NVQ or SVQ level 1 5,131 3% 532 10% O-level or equivalent <5 15,516 10% 2,209 14% Entry Level qual 197 0% 24 12%
40

Appendix B – Occupations coded as STEM
OCCUPATIONSSTEM CODING
SOC2000 CODE soc2km S T ECODE Description N
2111 Chemists 200 12112 Biological scientists and biochemists 578 12113 Physicists, geologists and meteorologists 117 12212 Psychologists 146 12216 Veterinarians 76 12321 Scientific researchers 87 1
1136Information and communication technology managers 1882 1
2131 IT strategy and planning professionals 696 12132 Software professionals 1838 13131 IT operations technicians 718 13132 IT user support technicians 416 11121 Production, works and maintenance managers 2222 12121 Civil engineers 386 12122 Mechanical engineers 408 12123 Electrical engineers 288 12124 Electronics engineers 217 12125 Chemical engineers 47 12127 Production and process engineers 226 12128 Planning and quality control engineers 191 12129 Engineering professionals n.e.c. 453 1
41
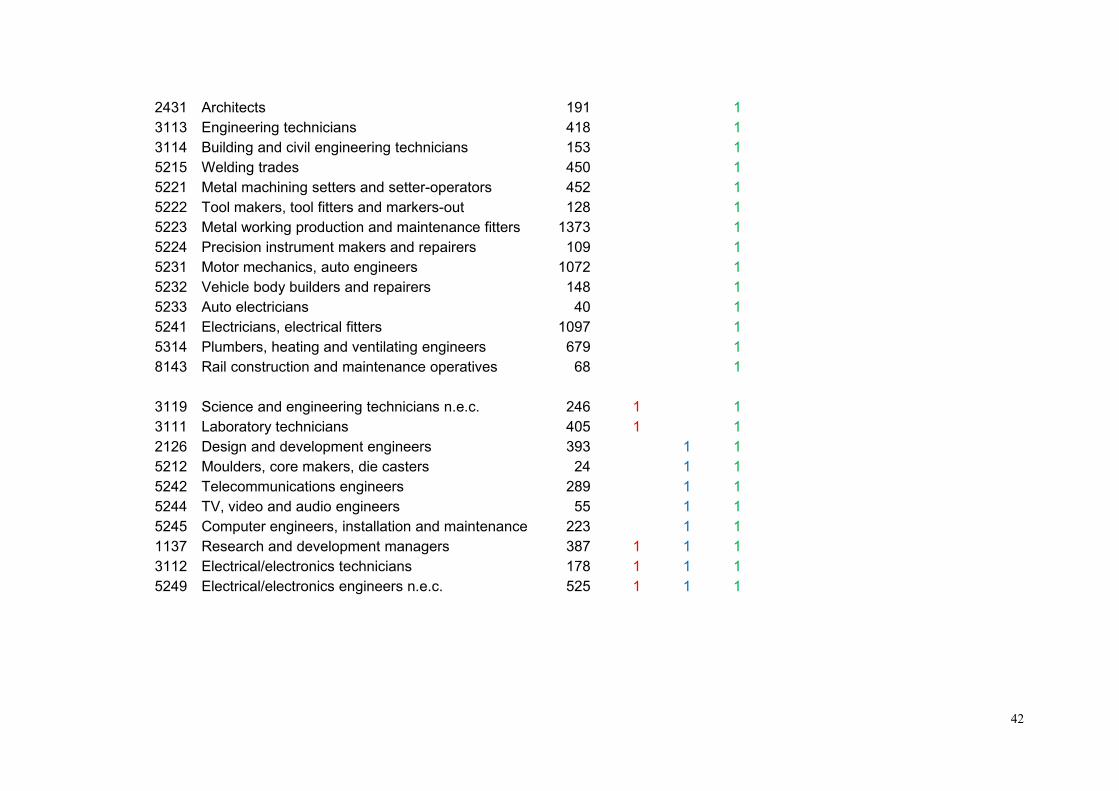
2431 Architects 191 13113 Engineering technicians 418 13114 Building and civil engineering technicians 153 15215 Welding trades 450 15221 Metal machining setters and setter-operators 452 15222 Tool makers, tool fitters and markers-out 128 15223 Metal working production and maintenance fitters 1373 15224 Precision instrument makers and repairers 109 15231 Motor mechanics, auto engineers 1072 15232 Vehicle body builders and repairers 148 15233 Auto electricians 40 15241 Electricians, electrical fitters 1097 15314 Plumbers, heating and ventilating engineers 679 18143 Rail construction and maintenance operatives 68 1
3119 Science and engineering technicians n.e.c. 246 1 13111 Laboratory technicians 405 1 12126 Design and development engineers 393 1 15212 Moulders, core makers, die casters 24 1 15242 Telecommunications engineers 289 1 15244 TV, video and audio engineers 55 1 15245 Computer engineers, installation and maintenance 223 1 11137 Research and development managers 387 1 1 13112 Electrical/electronics technicians 178 1 1 15249 Electrical/electronics engineers n.e.c. 525 1 1 1
42

Appendix C – Occupations coded as medical
For the equations investigating the wage premium associated with different occupations, medical occupations are coded separately as followsmedical dummy 1221 Health Professionals221
1 Medical practitioners221
2 Psychologists221
3 Pharmacists/pharmacologists221
4 Ophthalmic opticians221
5 Dental practitionersmedical dummy 2321 Health Associate Professionals321
1 Nurses321
2 Midwives321
3 Paramedics321
4 Medical radiographers321
5 Chiropodists321
6 Dispensing opticians321
7 Pharmaceutical dispensers
43

3218 Medical and dental technicians
322 Therapists322
1 Physiotherapists322
2 Occupational therapists322
3 Speech and language therapists322
9 Therapists n.e.c.
44