Embed Size (px)
Citation preview
data
Data Descriptor
The LAB-Net Soil Moisture Network: Application toThermal Remote Sensing and Surface Energy Balance
Cristian Mattar 1,*, Andrés Santamaría-Artigas 1,2, Claudio Durán-Alarcón 1,Luis Olivera-Guerra 1, Rodrigo Fuster 3 and Dager Borvarán 1
1 Laboratory for Analysis of the Biosphere (LAB), University of Chile, Santiago 8820808, Chile;[email protected] (A.S.-A.); [email protected] (C.D.-A.); [email protected] (L.O.-G.);[email protected] (D.B.)
2 Department of Geographical Sciences, University of Maryland, College Park, MD 20742, USA3 Laboratory of Territorial Analysis (LAT), University of Chile, Santiago 8820808, Chile; [email protected]* Correspondence: [email protected]; Tel.: +56-92-2978-5863
Academic Editor: Juan Carlos Jiménez-MuñozReceived: 23 February 2016; Accepted: 19 May 2016; Published: 7 June 2016
Abstract: A set of Essential Climate Variables (ECV) have been defined to be monitored by currentand new remote sensing missions. The ECV retrieved at global scale need to be validated in order toprovide reliable products to be used in remote sensing applications. For this, test sites are requiredto use in calibration and validation of the remote sensing approaches in order to improve the ECVretrievals at global scale. The southern hemisphere presents scarce test sites for calibration andvalidation field campaigns that focus on soil moisture and land surface temperature retrievals.In Chile, remote sensing applications related to soil moisture estimates have increased duringthe last decades because of the drought and water use conflicts that generate a strong interest onimproved water demand estimates. This work describes the Laboratory for Analysis of the Biosphere(LAB)—NETwork, called herein after ‘LAB-net’, which was designed to be the first network in Chilefor remote sensing applications. The test sites were placed in four sites with different cover types:vineyards and olive orchards located in the semi-arid region of Atacama, an irrigated raspberry cropin the Mediterranean climate zone of Chimbarongo, and a rainfed pasture in the south of Chile. Overeach site, well implemented meteorological and radiative flux instrumentation was installed andcontinuously recorded the following parameters: soil moisture and temperature at two ground levels(10 and 20 cm), air temperature and relative humidity, net radiation, global radiation, radiometrictemperature (8–14 µm), rainfall and soil heat flux. The LAB-net data base post-processing procedureis also described here. As an application, surface remote sensing products such as soil moisturedata derived from the Soil Moisture Ocean Salinity (SMOS) and Land Surface Temperature (LST)extracted from the MODIS-MOD11A1 and GOES LST from Copernicus products were compared toin situ data in Oromo LAB-net site. Moreover, land surface energy flux estimation is also shown as anapplication of LAB-net data base. These applications revealed a good performance between in situand remote sensing data. LAB-net data base also contributes to provide suitable information for landsurface energy budget and therefore water resources management at cultivars scale. The data basedgenerated by LAB-net is freely available for any research or scientific purpose related to current andfuture remote sensing applications.
Data Set: http://www.biosfera.uchile.cl/lab-net.html
Data Set License: The LAB-net data set is made available under a CC-BY-NC license
Keywords: soil moisture; surface temperature; network; meteorological station; remote sensing;LAB-net
Data 2016, 1, 6; doi:10.3390/data1010006 www.mdpi.com/journal/data
Data 2016, 1, 6 2 of 14
1. Introduction
Soil moisture (SM) is one of the most essential climate variables, as it affects the hydrological andmeteorological response of land’s surface, playing a main role in land–atmosphere interactions dueto its control on evapotranspiration [1]. Global scale maps of SM are crucial for the initialization ofNumerical Weather Prediction (NWP) models, climate change studies, surface-atmosphere interactions,and agricultural applications.
In order to provide SM maps at global scale, several dedicated remote sensing missions havebeen designed and launched during the last decades such as the Advanced Microwave ScanningRadiometer—EOS (AMSR-E), the Advanced Scatterometer (ASCAT), the Soil Moisture Ocean Salinity(SMOS), and the Soil Moisture Active Passive (SMAP) recently launched to provide new sources of soilmoisture maps [2–6]. These missions use different remote sensing techniques in order to provide soilmoisture products at a global scale in different temporal and spatial resolutions. Previous works havecompared the information delivered by these missions in order to generate a comprehensive satelliteintercomparison study to analyze their discrepancies and possible sources of error in addition to newblended soil moisture products at global scale [7–14].
In order to obtain ground-truth for the comparison of soil moisture products, regularly collectedin situ measurements are a valuable source of information. Indeed, it has long been recognizedthat reliable, robust, and automated techniques for the measurement of soil moisture content can beextremely useful, if not essential, in hydrologic, environmental, and agricultural applications [15].Nevertheless, to produce reliable large-scale SM measurements derived from in situ measurements,local or regional network needs to be created. This network should be able to maintain the availabilityof well-calibrated soil moisture measurements, provide a good representativeness of the instrumentedzone, and to represent a wide range of landscapes or biomes provided by local sites distributedthroughout the world [16–18].
There have been significant efforts to create a global network of in situ soil moisture measurementsfor the comparison with global SM products derived from remote sensing. For instance, theInternational Soil Moisture Network (ISMN) has provided daily values of soil moisture in differentregion of the world [17,19]. Nevertheless, ISMN still counts with a small number of stations in thesouthern hemisphere. Some of the most important soil moisture calibration and validation networkscreated in the southern hemisphere have been developed over Australia. These networks are describedin several works based on experimental and calibration/validation field campaigns such as theOzNet networks [20], the National Airborne Field Experiment (NAFE) carried out during 2005 and2006 [21,22], and the Australian Airborne Cal/Val Experiments for SMOS (AACES) [23]. Theseexperiments combined in situ, airborne, and remote sensing data in order to compare and validatesoil moisture retrievals generating a unique wide and comprehensive experiment in the terms of soilmoisture monitoring campaigns.
Other efforts to provide soil moisture measurements in the southern hemisphere were carriedout over Africa and South America in the so-called COsmic-ray Soil Moisture Observing System(COSMOS) [24]. In South America, COSMOS network contains three stations, all of them locatedin Brazil. Despite the fact that several meteorological stations may be currently measuring thesoil moisture in different countries of South America, these stations are not well-known, anddata are usually restricted to the owners, generating a lack of information. Thus, aiming for theenhancement of the soil moisture network in South America, the objective of this work is to presentand describe “LAB-net”, the first Chilean soil moisture network which might be used to evaluatesoil moisture products derived from remote sensing data over different land cover types. Thismanuscript is structured as follows: Section 2 shows the main description of LAB-net, the study sites,and instrumentation. Section 3 describes the instrument calibration methods, and data processing.Section 4 presents the applications of LAB-net data base to soil moisture and land surface temperaturecomparison to remote sensing products and land surface energy budget estimation. Finally, Section 5shows the discussion and conclusions of this work.

Data 2016, 1, 6 3 of 14
2. LAB-Net Description
LAB-net was made possible by the contribution of two Chilean national research projects. Onefocused on soil moisture estimations at regional scale (Fondecyt-Iniciación), and the second one onirrigation efficiency in semi-arid regions (Fondef-IDeA). The main objective of these projects is toquantify the availability of water resources in a given basin by analyzing the consumption of waterfor crops, industry, mining, and population. Three catchments were selected to install the monitoringstations: “Copiapó”, “Tinguiririca”, and “Bueno”, which are located in the northern, center, andsouthern region of Chile, respectively. Four stations were installed over the catchments (two in“Copiapó”, one in “Tinguiririca” and one in “Bueno”) in order to represent different soil and landcover types. Implementation of the sites began October 2013 and the four stations were ready formonitoring in July 2014. Figure 1 shows the location of the LAB-net sites.
Data 2016, 1, 6 3 of 14
3
4 presents the applications of LAB-net data base to soil moisture and land surface temperature comparison to remote sensing products and land surface energy budget estimation. Finally, Section 5 shows the discussion and conclusions of this work.
2. LAB-Net Description
LAB-net was made possible by the contribution of two Chilean national research projects. One focused on soil moisture estimations at regional scale (Fondecyt-Iniciación), and the second one on irrigation efficiency in semi-arid regions (Fondef-IDeA). The main objective of these projects is to quantify the availability of water resources in a given basin by analyzing the consumption of water for crops, industry, mining, and population. Three catchments were selected to install the monitoring stations: “Copiapó”, “Tinguiririca”, and “Bueno”, which are located in the northern, center, and southern region of Chile, respectively. Four stations were installed over the catchments (two in “Copiapó”, one in “Tinguiririca” and one in “Bueno”) in order to represent different soil and land cover types. Implementation of the sites began October 2013 and the four stations were ready for monitoring in July 2014. Figure 1 shows the location of the LAB-net sites.
Figure 1. LAB-net sites over four different land cover types. The circles indicate the location along Chile (yellow boundary) in red for Olives and Vineyards, green for Raspbery and blue for Pasture, respectivelly.
2.1. Ground Instrumentation
The LAB-net sites are configured to provide meteorological variables and radiative fluxes measurements for energy balance estimation. Measurements are made every minute, and the average value of 5 minutes is recorded. A maintenance plan is performed in each test site to preserve the optimal conditions and avoid any disturbance on the site being measured by the stations, which are only affected by crop management and harvest activities. The soil characteristics of each site are shown in Table 1, the high clay % and electrical conductivity observed in the Copiapó sites (not shown in Chimbarongo and Oromo) deserved more analysis because of their influence in the soil moisture measurements. The LAB-net sites are detailed in the following sections.
Figure 1. LAB-net sites over four different land cover types. The circles indicate the locationalong Chile (yellow boundary) in red for Olives and Vineyards, green for Raspbery and blue forPasture, respectivelly.
2.1. Ground Instrumentation
The LAB-net sites are configured to provide meteorological variables and radiative fluxesmeasurements for energy balance estimation. Measurements are made every minute, and the averagevalue of 5 min is recorded. A maintenance plan is performed in each test site to preserve the optimalconditions and avoid any disturbance on the site being measured by the stations, which are onlyaffected by crop management and harvest activities. The soil characteristics of each site are shownin Table 1, the high clay % and electrical conductivity observed in the Copiapó sites (not shown inChimbarongo and Oromo) deserved more analysis because of their influence in the soil moisturemeasurements. The LAB-net sites are detailed in the following sections.

Data 2016, 1, 6 4 of 14
Table 1. Soil characterization at laboratory for LAB-net test sites.
Parameters Units Copiapó Olives Copiapó Vineyards Chimbarongo Oromo
Sand (2–0.05 mm) % 9.30 40.20 51.80 74.10Silt (0.05–0.002 mm) % 49.40 40.60 35.30 20.30
Clay (<0.002 mm) % 41.30 19.20 12.90 5.60
Ca2+
mmol+/L
34.53 52.70 5.30 1.19Mg2+ 42.27 106.21 0.99 0.34Na+ 106.61 6.62 1.32 0.67K+ 3.53 6.85 0.72 0.20
SO4´2
mmol´/L287.38 287.38 0.03 0.07
Cl´ ND ND 0.94 0.51HCO´3 0.01 6.40 0.5 1.3
pH unitless 7.92 7.9 6.49 7.98
ElectricalConductivity (E.C.) dS/m 12.74 21.575 0.25 0.88
Sodium AbsorptionRatio (SAR) unitless 17.20 1.10 0.77 0.93
Percentage ofInterchangeableSodium (ESP) %
25.20 1.62 1.13 1.34
Water Saturation 68.72 7.9 92.53 21.01
ND = Not Detected.
2.2. Copiapó
Copiapó is located in the “Atacama” region. It has a desert climate type, with an annual rainfall of12 mm, a mean annual solar irradiance of 250 W¨m´2, and a maximum, mean, and minimum annualair temperature, in average, of 23.9 ˝C, 15.2 ˝C, and 9.3 ˝C, respectively. The Copiapó valley can bedivided in three main areas: the lower area, characterized by flat areas where olive and vineyardsaccount for 76% of the agriculture zone; the middle area, where mining activities and vineyards arelocated; and the high mountain area of the valley, which is mainly used for mining activities, pastures,and tourism. In the last years, the Copiapó river has suffered from a strong water demand, whichaffected the groundwater storage [25]. This situation generates a sensible scenario concerning thefuture water scarcity and local efforts need to be focused into the development of new technologies thattarget water use efficiency. In Copiapó, two LAB-net stations were installed. One station was installedover olive orchards (27˝19113.46” S; 70˝32122.56” W), and other over a vineyard (27˝17141.69” S;70˝2717.49” W) site. The soils in both sites are of the Aridisol order with moderate depth (20–100 cm)and show high salinity content. The soil was classified as “sodic salinity” type by the Chilean IrrigationCommission (CNR) for olives and vineyards. Irrigation is achieved using drip systems and pumpsto extract groundwater. The irrigation period for olives starts on August until the harvest in April.In the case of vineyards, the irrigation period starts on October until the last days of April. The restof the year, olives and vineyards are not irrigated and the soil moisture is only affected by rainfall.Each of the LAB-net stations in this sites are configured to store 5 min averages of the followingvariables: Soil moisture at 0.1 m (CS616, Campbell Scientific, Logan, UT, USA); soil temperature at0.1 m (Campbell Scientific 109 for olives and 107 for vineyard); soil heat flux at 0.08 m (HFP01SCHuskeflux, Delft, The Netherlands); surface radiometric temperature (SI-111, Apogee, Santa Monica,CA, USA); air temperature and relative humidity at 2 m (HMP60, Vaisala, Vantaa, Finland); solarradiation (LICOR LI-200X for olives and Apogee SP-110 for vineyard) (LICOR, Lincoln, NE, USA); netradiation (NR-Lite2, Kipp&Zonen, Delft, The Netherlands); precipitation (TE525MM, Texas Electronics,Dallas, TX, USA); and wind speed and direction (R.M. Young 3002, Traverse City, MI, USA).

Data 2016, 1, 6 5 of 14
2.3. Chimbarongo
Chimbarongo is located on the “O’Higgins” region, 160 km north from the capital city of Santiago.It has a Mediterranean with dry season climate type, with an annual rainfall of 701 mm, a meansolar irradiance close to 206 W¨m´2, and a maximum, mean, and minimum annual temperature, inaverage, of 20.8 ˝C, 6.6 ˝C, and 13.1 ˝C, respectively. This area is mainly used for to agriculture, andthe most predominant crops are maize, tobacco, raspberry, beans, fruit orchards (plums and apples),and vineyards. The high agriculture heterogeneity makes it interesting as a test site, and severalstudies have been conducted in relation to the evaluation of actual evapotranspiration estimationmethods [26,27], evapotranspiration partitioning [28] or validation of Sentinel satellite derived landvegetation products [29], among others. In Chimbarongo, a LAB-net station was installed over araspberry crop site (34˝43139.67” S; 70˝58146.16” W). The soils in this site belong to the inceptisolorder, they have a predominantly fine sandy loam texture (sand = 55.0%; silt = 30.0%; clay = 10.6%),a soil depth of ~85 cm, and have been classified as part of the “Limanque” soil series [30], whichcommonly shows a high content of organic matter, gravels, and clasts. The LAB-net station in thissite is configured to store 5 min averages of the following variables: soil moisture at 0.07 m and 0.2 m(Campbell Scientific CS650 and CS616); soil temperature at 0.07 m and 0.2 m (Campbell Scientific CS650and 109); soil heat flux at 0.08 m (Huskeflux HFP01SC); surface radiometric temperature (ApogeeSI-111); air temperature and relative humidity at 2 m (Vaisala HMP60); solar radiation (LICOR LI-200x);net radiation (Kipp&Zonen NR-Lite2); precipitation (Texas Electronics TE525MM); and wind speedand direction (R.M. Young 3002).
2.4. Oromo
Oromo is located in “Los Lagos” region, 16 km north-western from the Llanquihue Lake in theBueno river Basin. This region presents an oceanic rainy climate with an annual rainfall of 1331 mm,the mean annual solar radiation is approximately 148 W¨m´2 and the maximum, mean, and minimumannual air temperatures are, in average,16.6 ˝C, 11.0 ˝C, and 5.4 ˝C respectively. The main land covertype of this region is pastures, potatoes, alfalfa, and evergreen forest. The land cover of this regionis characterized by its “greenness” and wet soils during the whole year. The dry season is shortand during summer time (December and January). During the whole year, water resources can befound in abundance. In Oromo, a LAB-net station installed over a pasture grass field (40˝53106.07” S;73˝06131.41” W). The soils of Oromo belong to the Andisol order, they have a loam texture (sand = 49.2;silt = 31.9; clay = 19.0), with a soil depth of 120 cm, and have been classified as part of the “CorteAlto” soil series [30], which is characterized by its volcanic ash origins, low slopes, an effective depthbetween 20–190 cm, being very well drained, and commonly used for pastures and annual crops(e.g., maize, potatoes). The LAB-net station in this site is configured to store 5 min averages of thefollowing variables: Soil moisture at 0.07 m and 0.2 m (Campbell Scientific CS650 and CS616); soiltemperature at 0.07 m (Campbell Scientific CS650); soil heat flux at 0.08 m (Huskeflux HFP01SC);surface radiometric temperature (Apogee SI-111); air temperature and relative humidity at 2 m (HC2S3,Rotronic, Bassersdorf, Switzerland); incoming and outgoing short-wave and long-wave radiation(Kipp&Zonen CNR4); precipitation (Texas Electronics TE525MM); and wind speed and direction (R.M.Young 3002).
3. Calibration and Post-Processing
3.1. Time Domain Reflectometers Calibration
Despite the wide range of soil types where Time Domain Reflectometry (TDR) can operate, thesoil texture and high salinity content of Copiapó valley deserved an appropriate calibration based on

Data 2016, 1, 6 6 of 14
laboratory and in situ measurements. The main equation which relates the dielectric constant (K) withweave round trip time (t) is:
K “ˆ
tc2L
˙2(1)
where L is the length of the wire and c is the light speed in the vacuum (~3 ˆ 108 m¨ seg´1). The TDRswere recalibrated by obtaining new coefficients of time period (sigma) based on the length (L) of theTDR. This method was previously published by [31] using only in-laboratory conditions. Here, acombined field and laboratory experiment was developed to obtain a confident and reliable calibrationequation. To obtain the calibration equation for the Copiapó test fields (e.g., vineyards and olives),the period was related to the soil moisture content obtained for the in situ soil moisture derived byCampbell Scientific Hydrosense II probe, the ML3 ThetraProbe, and soil moisture retrieval made in thelaboratory using gravimetric methods. To estimate the gravimetric soil moisture content in laboratoryconditions, a copper cylinder of known dimensions was introduced into the first soil layer (i.e., close tothe TDR installation) to extract a soil sample. This procedure was repeated four times in several pointsaround the TDR installation. After then, the soil samples were dried in an oven for 48 h to estimate therate between wet and dried samples. The bulk density was also derived since the dimensions of thecopper cylinder are known. Based on all these data, the derived calibration equation was obtainedfollowing the manufacturer technical report (Campbell Scientific, CS616 and CS625 Water ContentReflectometers, revision 2/14). The derived calibration equation was based on the period which wasused to estimate the corrected soil moisture content as shown in Equation (2).
SM “
Nÿ
i“0
aiKi (2)
where SM is the volumetric soil moisture (m3¨m´3) and ai is the coefficient which can be recalibratedfor each soil type. The relationship between time period and soil moisture was represented by threedifferent equations: linear, quadratic, and exponential. The model suggested by the manufacturer waslinear or quadratic depending of the number of points obtained for the calibration. Nevertheless, theexponential equation has also been used by other studies in TDR soil moisture calibration [32]. Table 2shows the different soil moisture content derived by in situ and laboratory conditions.
Table 2. Soil moisture content derived from Hydrosense II (0.12 m wire length), ML3 (0.07 m wirelength), Laboratory (Gravimetric), and TDR at several wire lengths.
Measurement Technique SM Olives (m3¨ m´3) SM Vineyards (m3¨ m´3)
Hydrosense II 36.8 36.5ML3 35.5 35.0
Gravimetry 38.1 33.6TDR wire length
0.05 m 5.7 5.80.10 m 11.5 11.60.15 m 17.2 17.40.20 m 24.1 24.40.25 m 28.7 29.1
0.30 m (Full length) 34.4 34.9
The different models (linear, quadratic, and exponential) were applied in order to obtain thecalibrated coefficient for both sites. Although the quadratic model showed a better fit to in situmeasurements for both of the crops, this model did not obtain a good fit for the whole range of periods,overestimating the extreme values. The linear model obtained good results for vineyards, but for olivesthe model did not represent well the temporal variability of the soil moisture content. The exponentialmodel, although showing a good fit to the in situ measurements for both of the crops, in vineyards it

Data 2016, 1, 6 7 of 14
presented overestimated soil moisture values, and also presented some bias for low values. In oliveorchards the exponential model presented the best fit for the temporal variability of the retrievedvalues. TDR recalibrated coefficients that showed the best fit are presented in the following Equationsfor olives (3) and vineyards (4), respectively:
SMolive “ 0.5995exp0.0982t (3)
SMvineyard “ 2.0143t´ 37.565 (4)
Figure 2 shows the comparison between the temporal series of soil moisture content obtained bythe CS616 TDRs using the coefficients from the manufacturer (Campbell Scientific, CS616 and CS625Water Content Reflectometers, revision 2/14), and using the coefficient recalibrated by Equations (3)and (4) for the olives and vineyards respectively. It seems that irrigation influences were detected,additionally dry/wet season denoted by the irrigation is also presented.
Data 2016, 1, 6 7 of 14
7
Figure 2 shows the comparison between the temporal series of soil moisture content obtained by the CS616 TDRs using the coefficients from the manufacturer (Campbell Scientific, CS616 and CS625 Water Content Reflectometers, revision 2/14), and using the coefficient recalibrated by Equations (3) and (4) for the olives and vineyards respectively. It seems that irrigation influences were detected, additionally dry/wet season denoted by the irrigation is also presented.
Figure 2. Soil Moisture obtained with default coefficients (CS616_default) and calibrated coefficients (CS616_calibrated) according to the Equations (3) and (4) to olives (top) and vineyards (bottom), respectively.
3.2. In Situ Land Surface Temperature
The thermal radiometer mounted on each station is aimed towards a well-defined footprint using the method proposed by the manufacturer. To estimate the Land Surface Temperature (LST) for each station, additional information needs to be used in order to characterize the downwelling irradiance. For instance, the LST is estimated in the Oromo site using a four-band net to estimate the up and downwelling thermal infrared irradiance. LST was estimated using the Equation (5).
( )1 εB(LST)
ε
Lrad Ldown− −= (5)
where Lrad is the land leaving radiance (W·m−2·µm−1·sr−1) measured by the thermal radiometer, ε is the land surface emissivity, Ldown is the longwave downwelling irradiance (W·m−2·µm−1·sr−1), and B(LST) is Planck’s law for a given surface temperature (W·m−2·µm−1·sr−1). The Equation (5) was applied in the thermal infrared spectral range (TIR) of 8.0 and 14.0 µm which is the same interval for the spectral response function of the thermal radiometer. The land surface emissivity of the target is computed by the convolution between the “green grass” spectra from the Aster Spectral Library [33] and the relative spectral response of the thermal infrared radiometer using the RSR calculator software [34]. However, due to the decrease in vegetation greenness during summer, increasing of the soil proportion, and decreasing of the emissivity values. Other emissivity values computed in previous works related to remote sensing experiences were used [35–38]. To estimate the downwelling atmospheric irradiance, the Ldown is measured in the 3.0–120.0 µm by the four-band net radiometer, although it is necessary to adapt it to the 8.0–14.0 µm thermal window to match with the thermal radiometer. To this end, the algorithm proposed by the [39] was used, in addition to the air temperature and relative humidity provided by the station. Finally, the LST is therefore estimated by using the inverse of the Planck’s law.
3.2. Status Check and Data Availability
The status check is one of the most important processes related to automatized environmental monitoring because, in this step, the quality control is carried out. Based on the wide range of LAB-net database applications, an automatized protocol to provide reliable data needs to be
Figure 2. Soil Moisture obtained with default coefficients (CS616_default) and calibratedcoefficients (CS616_calibrated) according to the Equations (3) and (4) to olives (top) and vineyards(bottom), respectively.
3.2. In Situ Land Surface Temperature
The thermal radiometer mounted on each station is aimed towards a well-defined footprint usingthe method proposed by the manufacturer. To estimate the Land Surface Temperature (LST) for eachstation, additional information needs to be used in order to characterize the downwelling irradiance.For instance, the LST is estimated in the Oromo site using a four-band net to estimate the up anddownwelling thermal infrared irradiance. LST was estimated using the Equation (5).
BpLSTq “Lrad´ p1´ εq Ldown
ε(5)
where Lrad is the land leaving radiance (W¨m´2¨µm´1¨ sr´1) measured by the thermal radiometer, εis the land surface emissivity, Ldown is the longwave downwelling irradiance (W¨m´2¨µm´1¨ sr´1),and B(LST) is Planck’s law for a given surface temperature (W¨m´2¨µm´1¨ sr´1). The Equation (5)was applied in the thermal infrared spectral range (TIR) of 8.0 and 14.0 µm which is the same intervalfor the spectral response function of the thermal radiometer. The land surface emissivity of thetarget is computed by the convolution between the “green grass” spectra from the Aster SpectralLibrary [33] and the relative spectral response of the thermal infrared radiometer using the RSRcalculator software [34]. However, due to the decrease in vegetation greenness during summer,increasing of the soil proportion, and decreasing of the emissivity values. Other emissivity valuescomputed in previous works related to remote sensing experiences were used [35–38]. To estimate the

Data 2016, 1, 6 8 of 14
downwelling atmospheric irradiance, the Ldown is measured in the 3.0–120.0 µm by the four-band netradiometer, although it is necessary to adapt it to the 8.0–14.0 µm thermal window to match with thethermal radiometer. To this end, the algorithm proposed by the [39] was used, in addition to the airtemperature and relative humidity provided by the station. Finally, the LST is therefore estimated byusing the inverse of the Planck’s law.
3.3. Status Check and Data Availability
The status check is one of the most important processes related to automatized environmentalmonitoring because, in this step, the quality control is carried out. Based on the wide range of LAB-netdatabase applications, an automatized protocol to provide reliable data needs to be operational and topresent quality checks. The quality checks consist on the filtering of anomalous values or values thatexceed the range where the instrumentation is able to provide accurate information. The records areoperationally compared with the physical range of each sensor mounted in the stations and any wrongor anomalous data is deleted in order to be consistent with the time series generated for each parameter.The out-of-range values are further analyzed in order to check the status of the instrumentation and togenerate a report about possible source of error. This procedure can allow provision of reliable timeseries which can be used in a number of studies, such as the calibration of remote sensing retrievalalgorithms, validation of land surface products derived from remote sensing imagery, the evaluationof in situ data for soil-atmosphere-vegetation transfer (SVAT) modelling, or surface energy balanceretrievals. In order to fulfill the data requirements, the LAB-net data base are automatically processedthorough several steps to generate different formats, temporal aggregation schemes, and other userdefined options. Figure 3 shows the flowchart of LAB-net data base.
Data 2016, 1, 6 8 of 14
8
operational and to present quality checks. The quality checks consist on the filtering of anomalous values or values that exceed the range where the instrumentation is able to provide accurate information. The records are operationally compared with the physical range of each sensor mounted in the stations and any wrong or anomalous data is deleted in order to be consistent with the time series generated for each parameter. The out-of-range values are further analyzed in order to check the status of the instrumentation and to generate a report about possible source of error. This procedure can allow provision of reliable time series which can be used in a number of studies, such as the calibration of remote sensing retrieval algorithms, validation of land surface products derived from remote sensing imagery, the evaluation of in situ data for soil-atmosphere-vegetation transfer (SVAT) modelling, or surface energy balance retrievals. In order to fulfill the data requirements, the LAB-net data base are automatically processed thorough several steps to generate different formats, temporal aggregation schemes, and other user defined options. Figure 3 shows the flowchart of LAB-net data base.
LAB-net data is automatically obtained on a daily basis from the stations by using a GPRS communication system. After the data transfer, transitory files are generated to and filtered to remove anomalous and non-physical values. Then, an operational algorithm generates a list of files that summarizes the values, including hourly, daily mean, and monthly mean values for all of the measured variables of each station. In parallel, the data are converted to a predefined format (e.g., ISMN) in order to be easily used in further experiments and applications.
Figure 3. Flowchart of the LAB-net operational data assimilation.
4. Applications of the LAB-Net Data Base
Several applications have been performed using data from the LAB-net sites. In this work, some of the applications for Copiapó and Oromo sites are presented. For Chimbarongo site, the applications can be seen in [28,29].
4.1. Surface Energy Balance in Copiapó
One of the applications of LAB-net sites is the surface energy balance which can be estimated from the combined meteorological and radiative flux instrumentation. As an example, Figure 4 presents the ground flux (G), net radiation (Rn), and reference evapotranspiration (ET0) derive from [40] using LAB-net data from the sites located in Copiapó valley. Additionally, the relation
Figure 3. Flowchart of the LAB-net operational data assimilation.
LAB-net data is automatically obtained on a daily basis from the stations by using a GPRScommunication system. After the data transfer, transitory files are generated to and filtered to removeanomalous and non-physical values. Then, an operational algorithm generates a list of files thatsummarizes the values, including hourly, daily mean, and monthly mean values for all of the measuredvariables of each station. In parallel, the data are converted to a predefined format (e.g., ISMN) inorder to be easily used in further experiments and applications.
Data 2016, 1, 6 9 of 14
4. Applications of the LAB-Net Data Base
Several applications have been performed using data from the LAB-net sites. In this work, someof the applications for Copiapó and Oromo sites are presented. For Chimbarongo site, the applicationscan be seen in [28,29].
4.1. Surface Energy Balance in Copiapó
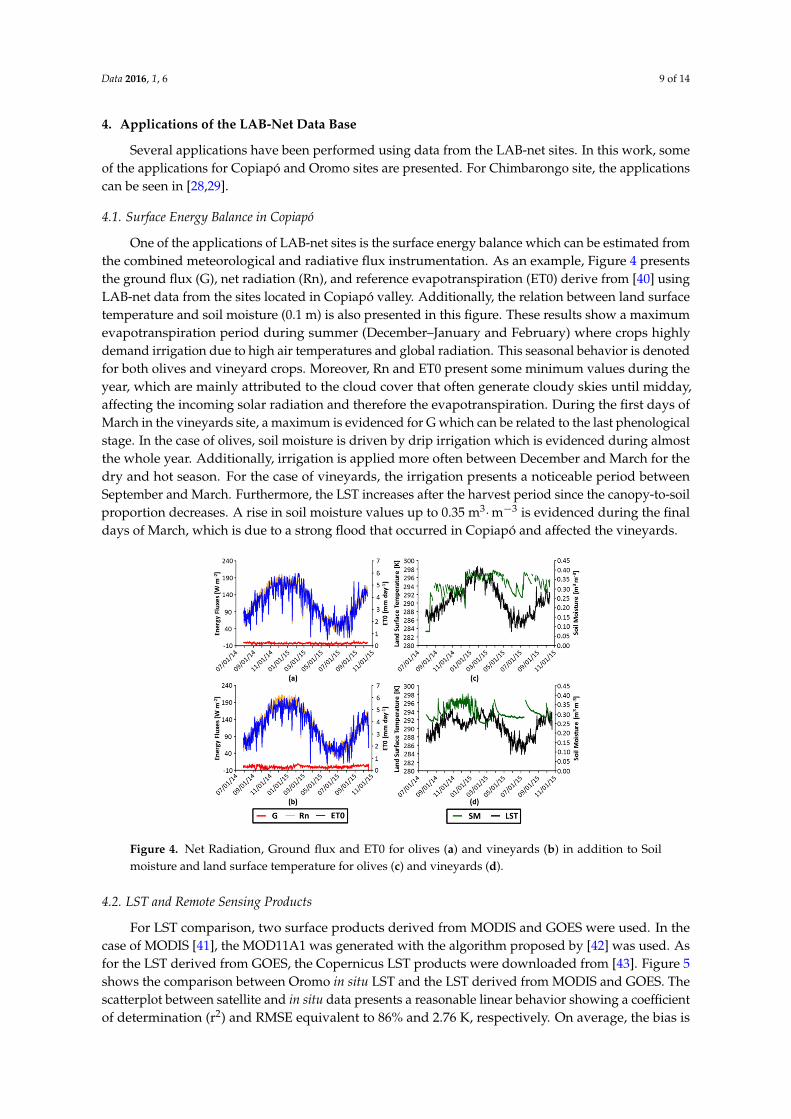
One of the applications of LAB-net sites is the surface energy balance which can be estimated fromthe combined meteorological and radiative flux instrumentation. As an example, Figure 4 presentsthe ground flux (G), net radiation (Rn), and reference evapotranspiration (ET0) derive from [40] usingLAB-net data from the sites located in Copiapó valley. Additionally, the relation between land surfacetemperature and soil moisture (0.1 m) is also presented in this figure. These results show a maximumevapotranspiration period during summer (December–January and February) where crops highlydemand irrigation due to high air temperatures and global radiation. This seasonal behavior is denotedfor both olives and vineyard crops. Moreover, Rn and ET0 present some minimum values during theyear, which are mainly attributed to the cloud cover that often generate cloudy skies until midday,affecting the incoming solar radiation and therefore the evapotranspiration. During the first days ofMarch in the vineyards site, a maximum is evidenced for G which can be related to the last phenologicalstage. In the case of olives, soil moisture is driven by drip irrigation which is evidenced during almostthe whole year. Additionally, irrigation is applied more often between December and March for thedry and hot season. For the case of vineyards, the irrigation presents a noticeable period betweenSeptember and March. Furthermore, the LST increases after the harvest period since the canopy-to-soilproportion decreases. A rise in soil moisture values up to 0.35 m3¨m´3 is evidenced during the finaldays of March, which is due to a strong flood that occurred in Copiapó and affected the vineyards.
Data 2016, 1, 6 9 of 14
9
between land surface temperature and soil moisture (0.1 m) is also presented in this figure. These results show a maximum evapotranspiration period during summer (December–January and February) where crops highly demand irrigation due to high air temperatures and global radiation. This seasonal behavior is denoted for both olives and vineyard crops. Moreover, Rn and ET0 present some minimum values during the year, which are mainly attributed to the cloud cover that often generate cloudy skies until midday, affecting the incoming solar radiation and therefore the evapotranspiration. During the first days of March in the vineyards site, a maximum is evidenced for G which can be related to the last phenological stage. In the case of olives, soil moisture is driven by drip irrigation which is evidenced during almost the whole year. Additionally, irrigation is applied more often between December and March for the dry and hot season. For the case of vineyards, the irrigation presents a noticeable period between September and March. Furthermore, the LST increases after the harvest period since the canopy-to-soil proportion decreases. A rise in soil moisture values up to 0.35 m3·m−3 is evidenced during the final days of March, which is due to a strong flood that occurred in Copiapó and affected the vineyards.
Figure 4. Net Radiation, Ground flux and ET0 for olives (a) and vineyards (b) in addition to Soil moisture and land surface temperature for olives (c) and vineyards (d).
4.2. LST and Remote Sensing Products
For LST comparison, two surface products derived from MODIS and GOES were used. In the case of MODIS [41], the MOD11A1 was generated with the algorithm proposed by [42] was used. As for the LST derived from GOES, the Copernicus LST products were downloaded from [43]. Figure 5 shows the comparison between Oromo in situ LST and the LST derived from MODIS and GOES. The scatterplot between satellite and in situ data presents a reasonable linear behavior showing a coefficient of determination (r2) and RMSE equivalent to 86% and 2.76 K, respectively. On average, the bias is close to 1 K and the standard deviation is slightly higher than 2.4 K. The possible impact of surface emissivity might affect the obtained RMSE, since it can change according to the rainfall intensity during summer. For instance, the Austral summer of 2015 was dry and hot, generating a dramatic change in the vegetation cover which can impact the surface emissivity values and therefore the LST retrievals. However, during wet season in 2015 such as winter (June, July and August), the RMSE decrease to 1.8 K because of the surface emissivity values are close to 0.98, which is used to estimate LST. Furthermore, the size of the LST pixel present differences which affect the comparison due to the number of data and also the possible land cover variation located inside the pixel used for the comparison to in situ measurements.
Figure 4. Net Radiation, Ground flux and ET0 for olives (a) and vineyards (b) in addition to Soilmoisture and land surface temperature for olives (c) and vineyards (d).
4.2. LST and Remote Sensing Products
For LST comparison, two surface products derived from MODIS and GOES were used. In thecase of MODIS [41], the MOD11A1 was generated with the algorithm proposed by [42] was used. Asfor the LST derived from GOES, the Copernicus LST products were downloaded from [43]. Figure 5shows the comparison between Oromo in situ LST and the LST derived from MODIS and GOES. Thescatterplot between satellite and in situ data presents a reasonable linear behavior showing a coefficientof determination (r2) and RMSE equivalent to 86% and 2.76 K, respectively. On average, the bias is

Data 2016, 1, 6 10 of 14
close to 1 K and the standard deviation is slightly higher than 2.4 K. The possible impact of surfaceemissivity might affect the obtained RMSE, since it can change according to the rainfall intensityduring summer. For instance, the Austral summer of 2015 was dry and hot, generating a dramaticchange in the vegetation cover which can impact the surface emissivity values and therefore the LSTretrievals. However, during wet season in 2015 such as winter (June, July and August), the RMSEdecrease to 1.8 K because of the surface emissivity values are close to 0.98, which is used to estimateLST. Furthermore, the size of the LST pixel present differences which affect the comparison due tothe number of data and also the possible land cover variation located inside the pixel used for thecomparison to in situ measurements.Data 2016, 1, 6 10 of 14
10
Figure 5. Linear relationship between surface temperature of Oromo site and the surface temperature derived from MODIS (squares) and GOES (circles). R2, Bias, sigma, RMSE, and N is also shown for each comparison.
4.3. Soil Moisture from LAB-Net and SMOS L2 Product
The SMOS Level-3 (CLF31) soil moisture daily products are described in [4] and downloaded from [44]. This product was previously used in Chile in order to calibrate and evaluate an optical-passive microwave approach to retrieve soil moisture [45]. For this work, the daily global soil moisture data was processed in order the extract the corresponding values in the EASE grid (25 × 25 km) for the coordinates matched to the Oromo site. Figure 6 shows the time series of in situ volumetric water content (m3/m3) at 10 and 20 cm, rainfall (mm) and the SMOS soil moisture (SMOS SM) (m3/m3) for Oromo site. The SMOS data was obtained for the nearest EASE pixel to the LAB-net stations. It seems that the soil moisture retrieved by SMOS agrees with the in situ data and rainfall events, despite some maximum values which seem to be an outlier (VWC higher than 80%). Regarding this maximum of SM values in the Oromo site, it could be attributed in part to ponding zones widely present in the southern part of Chile where agricultural soils have a slow drainage. Some details of the Oromo soil characterization which reflects this effect are described in [46]. Nevertheless, some outliers are also noticed in the winter period. For the rest of the seasons, the SMOS SM values follow the soil moisture measured at in situ level. Additionally, the SMOS SM also evidence the rainfall occurred in the summer season. The variability of SMOS SM is quite similar to the variability of the in situ for the period October to December where low amounts of rainfall are evidenced. The discrepancies between the retrieved SMOS SM (0–4 cm) and the first TDR (installed at 10 cm depth) can be attributed to the soil depth where TDR is installed and the spatial resolution of SMOS. Despite this feature, it is important to remark that both data sets show the dry and wet periods and in situ observations agree well with SMOS SM retrievals, although further statistical validation needs to be performed in order to estimate errors and the impact of orbits (ascending and descending) in the retrieved soil moisture values.
Figure 5. Linear relationship between surface temperature of Oromo site and the surface temperaturederived from MODIS (squares) and GOES (circles). R2, Bias, sigma, RMSE, and N is also shown foreach comparison.
4.3. Soil Moisture from LAB-Net and SMOS L2 Product
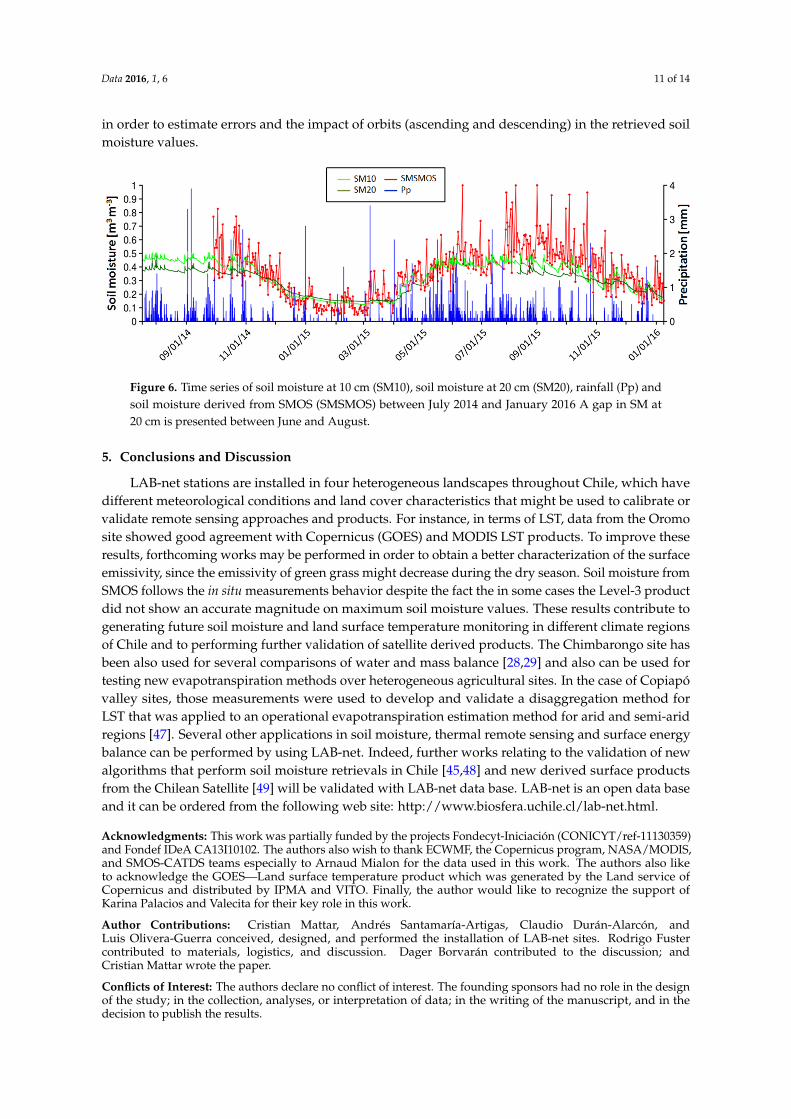
The SMOS Level-3 (CLF31) soil moisture daily products are described in [4] and downloadedfrom [44]. This product was previously used in Chile in order to calibrate and evaluate anoptical-passive microwave approach to retrieve soil moisture [45]. For this work, the daily globalsoil moisture data was processed in order the extract the corresponding values in the EASE grid(25 ˆ 25 km) for the coordinates matched to the Oromo site. Figure 6 shows the time series of in situvolumetric water content (m3/m3) at 10 and 20 cm, rainfall (mm) and the SMOS soil moisture (SMOSSM) (m3/m3) for Oromo site. The SMOS data was obtained for the nearest EASE pixel to the LAB-netstations. It seems that the soil moisture retrieved by SMOS agrees with the in situ data and rainfallevents, despite some maximum values which seem to be an outlier (VWC higher than 80%). Regardingthis maximum of SM values in the Oromo site, it could be attributed in part to ponding zones widelypresent in the southern part of Chile where agricultural soils have a slow drainage. Some details of theOromo soil characterization which reflects this effect are described in [46]. Nevertheless, some outliersare also noticed in the winter period. For the rest of the seasons, the SMOS SM values follow the soilmoisture measured at in situ level. Additionally, the SMOS SM also evidence the rainfall occurredin the summer season. The variability of SMOS SM is quite similar to the variability of the in situfor the period October to December where low amounts of rainfall are evidenced. The discrepanciesbetween the retrieved SMOS SM (0–4 cm) and the first TDR (installed at 10 cm depth) can be attributedto the soil depth where TDR is installed and the spatial resolution of SMOS. Despite this feature, itis important to remark that both data sets show the dry and wet periods and in situ observationsagree well with SMOS SM retrievals, although further statistical validation needs to be performed
Data 2016, 1, 6 11 of 14
in order to estimate errors and the impact of orbits (ascending and descending) in the retrieved soilmoisture values.Data 2016, 1, 6 11 of 14
11
Figure 6. Time series of soil moisture at 10 cm (SM10), soil moisture at 20 cm (SM20), rainfall (Pp) and soil moisture derived from SMOS (SMSMOS) between July 2014 and January 2016 A gap in SM at 20 cm is presented between June and August.
5. Conclusions and Discussion
LAB-net stations are installed in four heterogeneous landscapes throughout Chile, which have different meteorological conditions and land cover characteristics that might be used to calibrate or validate remote sensing approaches and products. For instance, in terms of LST, data from the Oromo site showed good agreement with Copernicus (GOES) and MODIS LST products. To improve these results, forthcoming works may be performed in order to obtain a better characterization of the surface emissivity, since the emissivity of green grass might decrease during the dry season. Soil moisture from SMOS follows the in situ measurements behavior despite the fact the in some cases the Level-3 product did not show an accurate magnitude on maximum soil moisture values. These results contribute to generating future soil moisture and land surface temperature monitoring in different climate regions of Chile and to performing further validation of satellite derived products. The Chimbarongo site has been also used for several comparisons of water and mass balance [28,29] and also can be used for testing new evapotranspiration methods over heterogeneous agricultural sites. In the case of Copiapó valley sites, those measurements were used to develop and validate a disaggregation method for LST that was applied to an operational evapotranspiration estimation method for arid and semi-arid regions [47]. Several other applications in soil moisture, thermal remote sensing and surface energy balance can be performed by using LAB-net. Indeed, further works relating to the validation of new algorithms that perform soil moisture retrievals in Chile [48,45] and new derived surface products from the Chilean Satellite [49] will be validated with LAB-net data base. LAB-net is an open data base and it can be ordered from the following web site: http://www.biosfera.uchile.cl/lab-net.html.
Acknowledgments: This work was partially funded by the projects Fondecyt-Iniciación (CONICYT/ref-11130359) and Fondef IDeA CA13I10102. The authors also wish to thank ECWMF, the Copernicus program, NASA/MODIS, and SMOS-CATDS teams especially to Dr. Arnaud Mialon for the data used in this work. The authors also like to acknowledge the GOES—Land surface temperature product which was generated by the Land service of Copernicus and distributed by IPMA and VITO. Finally, the author would like to recognize the support of Karina Palacios and Valecita for their key role in this work.
Author Contributions: Cristian Mattar, Andrés Santamaría-Artigas, Claudio Durán-Alarcón, and Luis Olivera-Guerra conceived, designed, and performed the installation of LAB-net sites. Rodrigo Fuster contributed to materials, logistics, and discussion. Dager Borvarán contributed to the discussion; and Cristian Mattar wrote the paper.
Conflicts of Interest: The authors declare no conflict of interest. The founding sponsors had no role in the design of the study; in the collection, analyses, or interpretation of data; in the writing of the manuscript, and in the decision to publish the results.
Figure 6. Time series of soil moisture at 10 cm (SM10), soil moisture at 20 cm (SM20), rainfall (Pp) andsoil moisture derived from SMOS (SMSMOS) between July 2014 and January 2016 A gap in SM at20 cm is presented between June and August.
5. Conclusions and Discussion
LAB-net stations are installed in four heterogeneous landscapes throughout Chile, which havedifferent meteorological conditions and land cover characteristics that might be used to calibrate orvalidate remote sensing approaches and products. For instance, in terms of LST, data from the Oromosite showed good agreement with Copernicus (GOES) and MODIS LST products. To improve theseresults, forthcoming works may be performed in order to obtain a better characterization of the surfaceemissivity, since the emissivity of green grass might decrease during the dry season. Soil moisture fromSMOS follows the in situ measurements behavior despite the fact the in some cases the Level-3 productdid not show an accurate magnitude on maximum soil moisture values. These results contribute togenerating future soil moisture and land surface temperature monitoring in different climate regionsof Chile and to performing further validation of satellite derived products. The Chimbarongo site hasbeen also used for several comparisons of water and mass balance [28,29] and also can be used fortesting new evapotranspiration methods over heterogeneous agricultural sites. In the case of Copiapóvalley sites, those measurements were used to develop and validate a disaggregation method forLST that was applied to an operational evapotranspiration estimation method for arid and semi-aridregions [47]. Several other applications in soil moisture, thermal remote sensing and surface energybalance can be performed by using LAB-net. Indeed, further works relating to the validation of newalgorithms that perform soil moisture retrievals in Chile [45,48] and new derived surface productsfrom the Chilean Satellite [49] will be validated with LAB-net data base. LAB-net is an open data baseand it can be ordered from the following web site: http://www.biosfera.uchile.cl/lab-net.html.
Acknowledgments: This work was partially funded by the projects Fondecyt-Iniciación (CONICYT/ref-11130359)and Fondef IDeA CA13I10102. The authors also wish to thank ECWMF, the Copernicus program, NASA/MODIS,and SMOS-CATDS teams especially to Arnaud Mialon for the data used in this work. The authors also liketo acknowledge the GOES—Land surface temperature product which was generated by the Land service ofCopernicus and distributed by IPMA and VITO. Finally, the author would like to recognize the support ofKarina Palacios and Valecita for their key role in this work.
Author Contributions: Cristian Mattar, Andrés Santamaría-Artigas, Claudio Durán-Alarcón, andLuis Olivera-Guerra conceived, designed, and performed the installation of LAB-net sites. Rodrigo Fustercontributed to materials, logistics, and discussion. Dager Borvarán contributed to the discussion; andCristian Mattar wrote the paper.
Conflicts of Interest: The authors declare no conflict of interest. The founding sponsors had no role in the designof the study; in the collection, analyses, or interpretation of data; in the writing of the manuscript, and in thedecision to publish the results.
Data 2016, 1, 6 12 of 14
References
1. Cheruy, F.; Campoy, A.; Dupont, J.-C.; Ducharne, A.; Hourdin, F.; Haeffelin, M.; Chiriaco, M.; Idelkadi, A.Combined influence of atmospheric physics and soil hydrology on the simulated meteorology at the SIRTAatmospheric observatory. Clim. Dyn. 2013, 40, 2251–2269. [CrossRef]
2. Njoku, E.G. AMSR-E/Aqua L2B Surface Soil Moisture, Ancillary Parms, & QC EASE-Grids, Version 2; NASADAAC at the National Snow and Ice Data Center: Boulder, CO, USA, 2004.
3. Kerr, Y.; Waldteufel, P.; Wigneron, J.P.; Martinuzzi, J.M.; Font, J.; Berger, M. Soil moisture retrieval from space.The soil Moisutre and Ocean Salinity (SMOS) mission. IEEE Trans. Geosci. Remote Sens. 2001, 39, 1729–1735.[CrossRef]
4. Kerr, Y.; Waldteufel, P.; Richaume, P.; Wigneron, J.P.; Ferrazzoli, P.; Mahmoodi, A.; al Bitar, A.; Cabot, F.;Gruhier, C.; Juglea, S.E.; et al. The SMOS Soil Moisture Retrieval Algorithm. IEEE Trans. Geosci. Remote Sens.2012, 50, 1384–1403. [CrossRef]
5. Wagner, W.; Hahn, S.; Kidd, R.; Melzer, T.; Bartalis, Z.; Hasenauer, S. The ASCAT Soil Moisture Product:A Review of its Specifications, Validation Results, and Emerging Applications. Meteorol. Z. 2013, 22, 5–33.[CrossRef]
6. Entekhabi, D.; Njoku, E.G.; O’Neill, P.E.; Kellogg, K.; Crow, W.T.; Edelstein, W.N.; Entin, J.K.; Goodman, S.D.;Jackson, T.J.; Johnson, J.; et al. The Soil Moisture Active Passive (SMAP) Mission. Proc. IEEE 2010, 98, 704–716.[CrossRef]
7. Brocca, L.; Hasenauer, S.; Lacava, T.; Melone, F.; Moramarco, T.; Wagner, W.; Dorigo, W.; Matgen, P.;Martínez-Fernández, J.; Llorens, P.; et al. Soil moisture estimation through ASCAT and AMSR-E sensors: Anintercomparison and validation study across Europe. Remote Sens. Environ. 2011, 115, 3390–3408. [CrossRef]
8. Leroux, D.; Kerr, Y.; Richaume, P.; Fieuzal, R. Spatial distribution and possible sources of SMOS errors at theglobal scale. Remote Sens. Environ. 2013, 133, 240–250. [CrossRef]
9. Al-Yaari, A.; Wigneron, J.-P.; Ducharne, A.; Kerr, Y.; de Rosnay, P.; de Jeu, R.; Govind, A.; al Bitar, A.;Albergel, C.; Muñoz-Sabater, J.; et al. Global-scale evaluation of two satellite-based passive microwavesoil moisture datasets (SMOS and AMSR-E) with respect to Land Data Assimilation System estimates.Remote Sens. Environ. 2014, 149, 181–195. [CrossRef]
10. Rötzer, K.; Motzka, C.; Bogena, H.; Wagner, W.; Kerr, Y.; Kidd, R.; Vereecken, H. Catchment scale validationof SMOS and ASCAT soil moisture products using hydrological modeling and temporal stability analysis.J. Hydrol. 2014, 519, 934–946. [CrossRef]
11. Louvet, S.; Pellarin, T.; Al-Bitar, A.; Cappelaere, B.; Galle, S.; Grippa, M.; Gruhier, C.; Kerr, Y.; Lebel, T.;Mialon, A.; et al. SMOS soil moisture product evaluation over West-Africa from local to regional scale.Remote Sens. Environ. 2015, 156, 383–394. [CrossRef]
12. Liu, Y.Y.; Parinussa, R.M.; Dorigo, W.A.; de Jeu, R.A.M.; Wagner, W.; van Dijk, A.I.J.M.; McCabe, M.F.;Evans, J.P. Developing an improved soil moisture dataset by blending passive and active microwavesatellite-based retrievals. Hydrol. Earth Syst. Sci. 2011, 15, 425–436. [CrossRef]
13. Yin, J.; Zhan, X.; Zheng, Y.; Liu, J.; Fang, L.; Hain, C.R. Enhancing Model Skill by Assimilating SMOPSBlended Soil Moisture Product into Noah Land Surface Model. J. Hydrometerorol. 2015, 16, 917–931.[CrossRef]
14. Yin, J.; Zhan, X.; Zheng, Y.; Liu, J.; Hain, C.R.; Fang, L. Impact of qualitycontrol of satellite soil moisture dataon their assimilation into land surface model. Geophys. Res. Lett. 2014, 41, 7159–7166. [CrossRef]
15. Walker, J.P.; Willgoose, G.R.; Kalma, J.D. In situ measurement of soil moisture: A comparison of techniques.J. Hydrol. 2004, 293, 85–99. [CrossRef]
16. Liu, Q.; Reichle, R.H.; Bindlish, R.; Cosh, M.H.; Crow, W.T.; de Jeu, R.; de Lannoy, G.J.M.; Huffman, G.J.;Jackson, T.J. The contributions of precipitation and soil moisture observations to the skill of soil moistureestimates in a land data assimilation system. J. Hydrometerorol. 2011, 12, 750–765. [CrossRef]
17. Dorigo, W.; Wagner, W.; Hohensinn, R.; Hahn, S.; Paulik, C.; Xaver, A.; Drusch, M. The International SoilMoisture Network: A data hosting facility for global in situ soil moisture measurements. Hydrol. EarthSyst. Sci. 2011, 5, 1675–1698. [CrossRef]
18. Vivoni, E.R.; Gebremichaela, M.; Watts, C.J.; Bindlish, R.; Jackson, T.J. Comparison of ground-based andremotely-sensed surface soil moisture estimates over complex terrain during SMEX04. Remote Sens. Environ.2008, 112, 314–325. [CrossRef]

Data 2016, 1, 6 13 of 14
19. Dorigo, W.A.; Xaver, A.; Vreugdenhil, M.; Gruber, A.; Hegyiová, A.; Sanchis-Dufau, A.D.; Zamojski, D.;Cordes, C.; Wagner, W.; Drusch, M. Global automated quality control of in situ soil moisture data from theInternational Soil Moisture Network. Vadose Zone J. 2013, 12. [CrossRef]
20. Smith, A.; Walker, J.P.; Western, A.W.; Young, R.I.; Ellet, K.M.; Pipunic, R.C. The Murrumbidgee soil moisturemonitoring network data set. Water Resour. Res. 2012, 48, W07701. [CrossRef]
21. Panciera, R.; Walker, J.P.; Kalma, J.; Kim, E.; Hacker, J.; Merlin, O.; Berger, M.; Skou, N. TheNAFE’05/CoSMOS Data Set: Toward SMOS Soil Moisture Retrieval, Downscaling, and Assimilation.IEEE Trans. Geosci. Remote Sens. 2008, 46, 736–745. [CrossRef]
22. Merlin, O.; Walker, J.P.; Panciera, R.; Escorihuela, M.J.; Jackson, T. Assessing the SMOS soil moisture retrievalparameters with high-resolution NAFE’06 data. IEEE Geosci. Remote Sens. Lett. 2009, 6, 635–639. [CrossRef]
23. Peischl, S.; Walker, J.P.; Rüdiger, C.; Ye, N.; Kerr, Y.H.; Kim, E.; Bandara, R.; Allahmoradi, M. The AACESfield experiments: SMOS calibration and validation across the Murrumbidgee River catchment. Hydrol. EarthSyst. Sci. 2011, 16, 1697–1708. [CrossRef]
24. Zreda, M.; Shuttleworth, W.; Xeng, X.; Zweck, C.; Desilets, D.; Franz, T.E.; Rosolem, R. COSMOS: TheCOsmic-ray Soil Moisture Observing System. Hydrol. Earth Syst. Sci. 2012, 16, 4079–4099. [CrossRef]
25. Valdés-Pineda, R.; Pizarro, R.; García-Chevesich, P.; Valdés, J.; Olivares, C.; Vera, M.; Balocchi, F.; Pérez, F.;Vallejos, C.; Fuentes, R.; et al. Water governance in Chile: Availability, management and climate change.J. Hydrol. 2014, 519, 2538–2567. [CrossRef]
26. Mattar, C.; Franch, B.; Sobrino, J.A.; Corbari, C.; Jiménez-Muñoz, J.C.; Olivera-Guerra, L.; Skokovic, D.;Sòria, G.; Oltra-Carrió, R.; Julien, Y.; et al. Impacts of the broad-band albedo on actual evapotranspirationestimated by S-SEBI model over an agricultural. Remote Sens. Environ. 2014, 147, 23–42. [CrossRef]
27. Olivera-Guerra, L.; Mattar, C.; Galleguillos, M. Estimation of the Real Evapotranspiration and its variationin Mediterranean landscapes of central-southern Chile. Int. J. Appl. Earth Obs. Geoinform. 2014, 28, 160–169.[CrossRef]
28. Olivera-Guerra, L.; Merlin, O.; Mattar, C.; Durán-Alarcón, C.; Santamaría-Artigas, A.; Stefan, V. Combiningmeteorological and lysimeter data to evaluate energy and water fluxes over a row crop for remote sensingapplications. In Proceedings of the International Geoscience and Remote Sensing Symposium (IGARSS),Milan, Italy, 26–31 July 2015.
29. Latorre, C.; Camacho, F.; Mattar, C.; Santamaría-Artigas, A.; Leiva-Büchi, N.; Lacaze, R. Obtención de mapasde alta resolución de LAI, FAPAR y fracción de cobertura vegetal derivados de imágenes del satélite chilenoFASat-C y adquisiciones in situ en la zona agrícola de Chimbarongo, Chile. In Proceedings of the XVICongreso de la Asociación Española de Teledetección (AET), Sevilla, España, 21–23 de Octubre 2015.
30. CIREN; Estudio Agrológico X Región. Descripciones de suelos: Materiales y símbolos; CIREN: Santiago, Chile,2002; 360p. N˝ 122.
31. Quinones, H.; Ruelle, P.; Nemeth, I. Comparison of three calibration procedures for TDR soil moisturesensors. Irrig. Drain. 2003, 52, 203–217. [CrossRef]
32. Mittelbach, H.; Casini, F.; Lehner, I.; Teuling, A.; Seneviratne, S. Soil moisture monitoring for climate research:Evaluation of a low-cost sensor in the framework of the Swiss Soil Moisture Experiment (SwissSMEX)campaign. J. Geophys. Res. 2011, 116, D05111. [CrossRef]
33. Baldridge, A.; Hook, S.J.; Grove, C.I.; Rivera, G. The ASTER spectral library version 2.0. Remote Sens. Environ.2009, 113, 711–715. [CrossRef]
34. Durán-Alarcón, C.; Santamaría-Artigas, A.; Valenzuela, N.; Mattar, C. RSR Calculator, una herramienta parael proceso de Calibración/Validación. Revista Española de Teledetección 2014, 42, 111–117. [CrossRef]
35. Sobrino, J.A.; Mattar, C.; Gastellu-Etchegorry, J.P.; Jiménez-Muñoz, J.C.; Grau, E. Evaluation of DART 3Dmodel in the thermal domain using satellite/airborne imagery and ground-based measurements. Int. J.Remote Sens. 2011, 32, 7453–7477. [CrossRef]
36. Sobrino, J.A.; Mattar, C.; Pardo, P.; Jiménez-Muñoz, J.C.; Hook, S.J.; Baldridge, A.; Ibáñez, R. Soil emissivityand reflectance spectra measurements. Appl. Opt. 2009, 48, 3664–3670. [CrossRef] [PubMed]
37. Sobrino, J.A.; Jiménez-Muñoz, J.C.; Zarco-Tejada, P.J.; Sepulcre-Cantó, G.; de Miguel, E.; Sória, G.;Romaguera, M.; Julien, Y.; Cuenca, J.; Hidalgo, V.; et al. Thermal remote sensing from airborne hyperspectralscanner data in the framework of the sparc and sen2flex projects: An overview. Hydrol. Earth Syst. Sci. 2009,13, 2031–2037. [CrossRef]
Data 2016, 1, 6 14 of 14
38. Sobrino, J.A.; Jimenez-Muñoz, J.C.; Soria, G.; Gomez, M.; Barella Ortiz, A.; Romaguera, M.; Zaragoza, M.;Julien, Y.; Cuenca, J.; Atitar, M. Thermal remote sensing in the framework of the sen2flex project: Fieldmeasurements, airborne data and application. Int. J. Remote Sens. 2008, 29, 4961–4991. [CrossRef]
39. Prata, A.J. A new long-wave formula estimating downward clear sky radiation at the surface. Q. J. R.Meteorol. Soc. 1996, 122, 1127–1151. [CrossRef]
40. Allen, R.G.; Pereira, L.S.; Raes, D.; Smith, M. Crop evapotranspiration guidelines for computing crop waterrequirements. In FAO Irrigation and Drainage Paper 56; Food and Agriculture Organization: Italy, Rome, 1998.
41. MODIS Data Products. Available online: http://modis.gsfc.nasa.gov/data/dataprod/ (accessed on 22November 2015).
42. Wan, W.; Dozier, J. A generalized split-window algorithm for retrieving land-surface temperature fromspace. IEEE Trans. Geosci. Remote Sens. 1996, 46, 736–745.
43. Freitas, S.; Trigo, I.; Macedo, J.; Barroso, C.; Silva, R.; Perdigao, R. Land surface temperature from multiplegeostationary satellite. Int. J. Remote Sens. 2013, 34, 3051–3068. [CrossRef]
44. Centre Aval de Traitement des Données SMOS (CATDS). Available products from CPDC. Available online:http://www.catds.fr/Products/Available-products-from-CPDC (accessed on 15 January 2016).
45. Santamaría-Artigas, A.; Mattar, C.; Wigneron, J.-P. Application of a Combined Optical–Passive MicrowaveMethod to Retrieve Soil Moisture at Regional Scale Over Chile. IEEE J. Sel. Top. Appl. Earth Obs. Remote Sens.2016, 9, 1493–1504. [CrossRef]
46. Casanova, M.; Salazar, O.; Seguel, O.; Luzio, W. The Soils of Chile; Springer: Dordrecht, The Netherlands,2013; p. 185. ISBN: 978-94-007-5948-0.
47. Olivera-Guerra, L.; Mattar, C.; Merlin, O.; Durán-Alarcón, C.; Santamaría-Artigas, A.; Fuster, R. Anoperational method for the disaggregation of land surface temperature to estimate actual evapotranspirationin the semi-arid region of Chile. Int. J. Appl. Earth Obs. Geoinform. 2016. in press.
48. Mattar, C.; Wigneron, J.; Sobrino, J.A.; Novello, N.; Calvet, J.C.; Albergel, C.; Richaume, P.; Mialon, A.;Guyon, D.; Jimenez-Munoz, J.C. A combined optical-microwave method to retrieve soil moisture overvegetated areas. IEEE Trans. Geosci. Remote Sens. 2012, 50, 1404–1413. [CrossRef]
49. Mattar, C.; Hernández, J.; Santamaría-Artigas, A.; Durán-Alarcón, C.; Olivera, L.; Inzunza, M.; Tapia, E.;Escobar-Lavín, E. A first in-flight absolute calibration of the Chilean Earth Observation Satellite. ISPRS J.Photogramm. Remote Sens. 2014, 92, 16–25. [CrossRef]
© 2016 by the authors; licensee MDPI, Basel, Switzerland. This article is an open accessarticle distributed under the terms and conditions of the Creative Commons Attribution(CC-BY) license (http://creativecommons.org/licenses/by/4.0/).