Embed Size (px)
Citation preview

The Journal of Applied Business Research – July/August 2016 Volume 32, Number 4
Copyright by author(s); CC-BY 1273 The Clute Institute
Theory And Practice In Capital Budgeting: Evidence From Kuwait
Yaser A. AlKulaib, Kuwait University, Kuwait Sulaiman A. Al-Jassar, Kuwait University, Kuwait
Khalid Al-Saad, Kuwait University, Kuwait
ABSTRACT Capital budgeting is an important tool in corporate finance, which is supported with numerous methods. Previous researches in this field shows that simple methods of capital budgeting are preferred over complex methods. With an objective to adopt relevant modification in the academic sector this paper evaluates the preferred capital budgeting practices in Kuwait, one of the strongest economy in the world, through a structured questionnaire distributed among 100 firms. The study also reveals the significance of demographic factors on real life capital budgeting practices as well as it probes in to the significance of the subjects; introductory finance, financial management and risk management. The results of the study are consistent with the previous researches in this field, that majority of the respondents use the NPV. Furthermore, age, educational qualification, managerial levels, years of experience, company size, among others all have significant effects on most capital budgeting methods. Keywords: Capital Budgeting; Corporate Finance; Project Valuation; Survey; Emerging Markets; Kuwait Stock Exchange; NPV
1. INTRODUCTION
apital budgeting techniques are methods used by companies to authorize capital spending on long-term projects. Both quantitative analysis and qualitative information are used to evaluate capital projects. Most capital budgeting analysis uses cash inflows and outflows rather than net income and certain companies
calculate cash flow using net income plus depreciation and amortization for simplicity. There are five techniques that are most popular for analyzing a capital budgeting proposal, and the best method uses the time value of money concepts. The five major methods are payback periods (PP), discounted payback periods (DPP), internal rate of return (IRR), modified internal rate of return (MIRR), and net present value (NPV). Since the assumption of NPV is more realistic in terms of the reinvestment rate, it is the most popular method in practice. Once it has been determined that a particular project has exceeded its hurdle rate, and if a firm has many potential projects, firms use the outcome of the capital budgeting to rank projects from the highest profitability index to the lowest profitability index. In addition, the highest-ranking projects should be implemented until the budgeted capital has been expended. All business schools teach these kinds of capital budgeting techniques in introductory finance courses, and discuss more in advanced courses and therefore we can assume that these are the commonly used methods. With the financial crisis in 2008, many companies began to reexamine their investment and capital budgeting methods. The main objective of this study is to investigate the nature of capital budgeting that is adopted by the business community in Kuwait and probes if demographic factors influence the adoption of a particular technique. In order to ascertain the theoretical impact of business studies in the practical application the questionnaire probed about three finance subjects, introductory finance, financial management and risk management and the perspective of the respondents regarding the practical implication of these subjects in their career. The study also probes whether, Kuwaiti firms use to authorize capital spending on long-term projects and if there are any fundamental differences between the financial market practices and corporate finance theory. The real life practice of corporate finance were enumerated in many previous researches; Bruner et al. (1998), Graham and Harvey (2001) and others are renowned researches in this field. This paper is an extended research of
C
brought to you by COREView metadata, citation and similar papers at core.ac.uk
provided by Clute Institute: Journals

The Journal of Applied Business Research – July/August 2016 Volume 32, Number 4
Copyright by author(s); CC-BY 1274 The Clute Institute
Graham and Harvey (2001) but is widened regarding its scope, response rate and focus on different managerial level too. This paper throws light to practitioners regarding the operation of Kuwait market and the findings of this study can be utilized for an academic recommendations intended to renovate the financial studies. The paper is divided into five parts. First, introduction regarding corporate finance theory and practice. Second, the literature review discusses previous studies conducted on the theory and practice of corporate finance. Third, we explain the data set and methodology. Fourth, we perform analysis on our empirical results and discuss the results from the perspectives of Kuwaiti investors and firms; we also discuss the results from an international perspective based on previous work in the extended literature. Finally, we offer a conclusion.
2. LITERATURE REVIEW Many studies have documented fundamental differences between theory and practice in corporate finance. Documentation between theory and practices in corporate finance and capital budgeting has been provided in many studies around the world especially in North and South America, Europe, Asia, and Australian continents. However, few studies have been conducted in the Middle East and North Africa (MENA). The best-known study is Graham and Harvey (2001), which surveyed 392 CFOs regarding the cost of capital, capital budgeting, and capital structure. The paper found that large firms rely heavily on present value techniques, whereas small firms are likely to use the payback technique. Moreover, the authors find that a number of firms use firm risk rather than project risk in evaluating new investments, and firms are concerned about financial flexibility and credit ratings when issuing debt, and earnings per share dilution and stock price appreciation when issuing equity. Finally, the paper found minimal evidence that executives are concerned about asset substitution, asymmetric information, transactions costs, free cash flows, or personal taxes. An earlier paper by Atkinson and LeBruto (1997) examined the capital budgeting and cost of capital procedures commonly used in 14 firms in the gaming segment of the hospitality industry. The firms surveyed indicated that they used discounted cash flow techniques and are aware of the various techniques available in capital budgeting; however, the most frequently used model is the internal rate of return. Thus, the practice of capital budgeting and cost of capital techniques in the gaming sector are better understood. In addition, Bruner et al. (1998) presents the results of a cost of capital survey of 27 highly regarded corporations, ten leading financial advisers, and seven bestselling textbooks and trade books. The paper shows close alignment among all these groups on the use of common theoretical frameworks and on many aspects of estimation. However, the paper finds large variation in the joint choices of the risk-free rate, beta, and equity market risk premium. Bennouna et al. (2010) find that the Canadian firms uses NPV but still shows a gap between theory and practice. Moreover, 17 percent of large firms did not use discounted cash flow (DCF). Of those, which did the majority favored NPV and IRR, and 8 percent used real options. The result shows a theory-practice gap remains in the detailed elements of DCF capital budgeting decision techniques and in real options. However, in Australia, McMahon (1981) presents survey results conducted in 1979, which investigated Australian practices in the determination and use of investment hurdle rates and in certain other areas of capital budgeting that, impinge on hurdle rate practice. The study also suggests a significant closure of the gap between theory and practice in capital budgeting in terms of the use of discounted cash flow techniques of capital project evaluation and in terms of the use of certain tools of finance such as the weighted average cost of capital. Furthermore, the Australian listed companies view NPV, IRR and Payback as popular evaluation techniques of US firms. Truong et al. (2008) also find that real options techniques have gained a toehold in capital budgeting but are not yet part of the mainstream. The discount rate used is target WACC and is assumed constant across divisions. In addition, the CAPM is widely used, whereas other asset pricing models are not. Furthermore, the paper finds that the popular choice method for estimating the growth rate when computing terminal value is the inflation rate, zero growth rate or industry average growth rate. In Japan, most investigative research has shown that the managers of Japanese firms tend to prefer a non-discounted cash flow model, such as a simple payback period method. This interesting gap between business practice and

The Journal of Applied Business Research – July/August 2016 Volume 32, Number 4
Copyright by author(s); CC-BY 1275 The Clute Institute
academic theory has long been a puzzle to the academic community. Shinoda (2010) shows that Japanese firms manage their decision-making by a combination of the payback period method and the net present value method. Although most financial managers utilize multiple tools in the capital budgeting process, these results reflect a better alignment of views between academia and business. Hermes et al. (2007) compared the use of capital budgeting techniques of Dutch and Chinese firms, using data from a survey of 250 Dutch and 300 Chinese companies. The empirical examination shows that Dutch CFOs on average use more sophisticated capital budgeting techniques than Chinese CFOs do. Nevertheless, the results suggest that the difference between Dutch and Chinese firms is smaller than may have been expected based upon the differences in the level of economic development between both countries, with respect to the use of methods of estimating the cost of capital and the use of CAPM as the method of estimating the cost of equity. Moreover, Benetti et al. (2007) compared Brazil and US firms, by examining 160 CFOs responses and compared the responses with those of North American CFOs obtained by Graham and Harvey. The paper found that CFOs in the two countries share opposite perspectives on several issues. For example, North Americans use more IRR and NPV, in contrast to Brazilians who use more accounting rate of return and value at risk. Differences in the response are because of institutional characteristics of the economic environment in which they operate, such as capital restrictions, poor corporate governance regulation, and less competitive financial markets. However, in the Colombian construction industry, companies use IRR and NPV but lack knowledge of the real options method (Yepes & Cuartas (2014). Moreover, studies in Europe show different capital budgeting methods between small and large firms. In an international survey among 313 CFOs on capital budgeting, cost of capital, capital structure, and corporate governance, Brounen et al. (2004) document how theoretical concepts of capital budgeting are applied by professionals in the U.K., the Netherlands, Germany, and France and compare these results with the U.S. That paper discovers variations between large and small firms across all markets. The authors found that large firms frequently use present value techniques and the capital asset pricing model when assessing the financial feasibility of an investment opportunity, whereas CFOs of small firms rely on the payback criterion. Furthermore, the most important factor when determining corporate debt is financial flexibility, which is consistent with pecking order behavior, but not driven by asymmetric information considerations, according to the authors. Finally, Kengatharan (2015) shows results from Sri Lanka that NPV was the most preferred capital budgeting method, followed closely by PB and IRR. Therefore, studies that documented fundamental differences between the financial markets practice and corporate finance theory covered all continents, including North and South America, Europe, Asia, and Australia.
3. DATA & METHODOLOGY Our survey focuses on four areas: capital budgeting cost of capital, capital structure and the importance of courses. In this paper, we will discuss the results for capital budgeting and course importance more in detail, and discuss cost of capital and capital structure in forthcoming paper. The population of interest includes all companies that are listed and unlisted in the Kuwait Stock Exchange (KSE). A pilot study was conducted among 100 companies as an initial random sample to test the questioznnaire design. The responses were analyzed to check the reliability, question clarity, and the format of the questions and the questionnaire was revised. A random sample of 908 response were chosen from different sectors according to their representation in the population as a whole. It took approximately 4 months to complete the survey. After finishing the data collection and data analysis phase, we present the analysis and comments on the answers of every research issue. First, we provide summary measures of all demographic characteristics involved in the study. Second, the research questions are summarized and tested against demographic characteristics.

The Journal of Applied Business Research – July/August 2016 Volume 32, Number 4
Copyright by author(s); CC-BY 1276 The Clute Institute
Table 1. Demographic characteristics of the sample Frequency Percentage
Gender Female 851 93.8 Male 56 6.2
Age 20 - 35 243 27.0 36 - 50 569 63.3 More than 50 87 9.7
Education Undergraduate 75 8.7 Graduate 773 89.7 Professional 14 1.6
Job Title
Higher management 51 5.7 Middle management 214 23.8 Investment Head/Finance Analyst 29 3.2 Accountant 605 67.3
Experience Less than 5 years 170 18.9 5 -10 years 401 44.5 10 years and above 330 36.6
Company Attribute Big 369 41.9 Small 512 58.1
Company Activity
Banking 129 14.3 Real Estate 124 13.7 Industrial 175 19.4 Services 241 26.7 Food 51 5.7 Others 182 20.2
Table 1 provides demographic characteristics of the sample. 93.7% of the samples were male respondents 63.3% of the sample belongs to the age group 36 to 50 years; University graduates and higher-level education respondents comprise 89.7% of the sample, whereas respondents who hold professional degrees comprise 1.6% of the total sample. With respect to job title, 67.3% are accountants and 23.8% are from middle level management. Therefore, we expect that at least more than two thirds of our sample know capital budgeting methods. In terms of experience, 44.5% of the respondents have between 5 -10 years of experience, and 36.6% of the respondents have 10 years and more work experience in their careers. In regard company attribute, 41.9% of the respondents hailing from large companies, whereas 58.1% are from small companies. Finally, the sample represents more than five sectors, 14.3% are from the banking sector, 13.7% from the real estate sector, 19.4% from the industrial sector, 26.7% from the services sector, 5.7% from the food sector, and 20.2% from other sectors. This shows that our sample represents the market and covers all sectors. Here, we determine how much each of the above techniques is adopted in firms. This determination is applied to establish the extent of application of the theories in firms. Respondents were requested to score how frequently they use the different capital budgeting technique. For each question, 5 possible scales are provided in which 0 indicates that the method is inapplicable and 4 indicates that the method is always used.
4. RESULTS In the following sections, we summarize respondents’ answers to each research question and show the results in tables. In each of our tables, we present the frequency distribution of the respondents’ answers, the mean rating and the standard deviation. Capital budgeting has many methods that management can use to evaluate upcoming projects. We will present the use of capital budgeting methods, such as NPV, IRR, MIRR, PP, DPP, hurdle rate (HR), use of ratios (UR), sensitivity analysis (SNA), value at risk (VR), scenario analysis (SA), real options (RO), variable discount rate (VDR) and average discount rate (ADR) in this section. Most respondents’ 27.7% select net present value as the most frequently used capital budgeting technique. However, it is of interest to know that the responses change when correlated with other demographic and company features.

The Journal of Applied Business Research – July/August 2016 Volume 32, Number 4
Copyright by author(s); CC-BY 1277 The Clute Institute
Although net present value is considered as the most frequently used capital budgeting technique, there is variation in the perception level on the basis of different variables such as age and management level. Table-2 represents the frequency distribution of capital budgeting technique. For questions with multi measurements, we include the Cronbach alpha measure of reliability to ensure the consistency of the questions in measuring the concept they intend to measure.
Table 2. Frequency distribution of Capital Budget Technique
Method of Evaluation
Frequency Distribution (%)
Cod
e
Not
ap
plic
able
App
licab
le
Som
etim
es
Don
’t k
now
Oft
en
App
licab
le
Usu
ally
A
pplic
able
Mea
n
St .d
ev
Coe
ffic
ient
%
Net Present Value NPV 1.5 20.4 7.4 40.9 29.7 2.77 1.129
83.4
Internal Rate Return IRR 5.0 41.9 8.4 25.7 19.0 2.12 1.274 Modified Internal Rate of Return MIRR 9.3 43.5 14.7 17.7 14.8 1.85 1.248 Hurdle Rate HR 18.2 32.8 18.9 17.7 12.4 1.73 1.289 Payback Period PP 7.3 26.6 12.3 38.0 15.8 2.28 1.221 Discounted Payback Period DPP 26.3 25.7 17.1 17.6 13.3 1.66 1.380 Use of Rations UR 24.0 27.4 19.8 12.7 16.1 1.69 1.384 Sensitivity Analysis SNA 24.9 23.0 29.1 12.8 10.1 1.60 1.265 Value at Risk Analysis VA 25.3 24.1 26.3 16.7 7.6 1.57 1.243 Scenario Analysis SA 23.2 19.6 13.4 32.7 11.2 1.89 1.374 Real Options RO 14.7 18.5 12.6 37.4 16.9 2.23 1.330 Variable Discount Rate VDR 9.3 32.7 8.8 32.7 16.4 2.14 1.290 Average Discount Ratio ADR 12.0 27.4 11.0 37.6 11.9 2.10 1.265 As shown in Table 2, the majority of the respondents indicated that the NPV technique, at 40.9%, is often used in evaluating the capital budgeting and it is the most common technique with a mean rating of 2.77 and standard deviation of 1.129 on a 5-point scale. This finding is consistent with the findings of Graham and Harvey (2001), Bennouna et al. (2010) and others. Payback period is the second method used to evaluate the capital budgeting, (mean - 2.28, standard deviation - 1.221); this method is preferred by Japanese, Shinoda (2010) and Australian firms,Truong et al. (2008). Additionally, 38% of the sample claimed that they use the payback period in their evaluation of the capital budgeting. The real option method for evaluating the capital budgeting was third among all available methods, with a mean rating of 2.23 and a standard deviation of 1.33. In addition, 37.4% of the respondents confirm that they often use the real option method in evaluating the capital budgeting. Real options techniques have gained a toehold in capital budgeting with Kuwaiti and Australian firms as shown by Truong et al. (2008). Variable discount rate occupies the fourth position with a mean rating of 2.14% and a standard deviation of 1.29. It is also evident from the result that 32.7% of the respondents use the variable discount rate to evaluate the capital budgeting. Internal return is in fifth position with a mean rating of 2.12 and a standard deviation of 1.274. In addition, 25.7% of the sample announced the use of the internal rate of return as their method of evaluation of the capital budgeting. Average discount rate is in the sixth position among the capital budgeting evaluation methods with a mean rating of 2.10 and a standard deviation of 1.265. Notably, 37.6% of the samples often use the average discount ratio to evaluate the capital budgeting. Other methods are rated lower than the average. In the following section, we test the hypotheses, whether different demographic characteristics have different perceptions for each research questions. To decide which statistical test should be used, we tested the response against normality using the Kolmogorov–Smirnov test (K–S test). From the test results in Table 3, we observe that none of the capital budgeting techniques exhibit normal behavior. Therefore, to test against the demographic characteristics, we resort to non-parametric methods of inference. If there are two groups, the Mann-Whitney test will be employed. For more than two groups, the Kruskal–Wallis test is used.

The Journal of Applied Business Research – July/August 2016 Volume 32, Number 4
Copyright by author(s); CC-BY 1278 The Clute Institute
Table 3. One-Sample Kolmogorov-Smirnov Test
NPV
IRR
MIR
R
HR
PP
DPP
UR
SA
VR
SNA
RO
VD
R
AD
R
N 906 904 899 894 892 879 900 903 902 905 907 907 906 Normal Parameters (a,b)
Mean 2.77 2.12 1.85 1.73 2.28 1.66 1.69 1.60 1.57 1.89 2.23 2.14 2.10 Std. Dev 1.129 1.274 1.248 1.289 1.221 1.380 1.384 1.265 1.243 1.374 1.330 1.290 1.265
Most Extreme Differences
Absolute .288 .279 .281 .225 .259 .204 .207 .162 .171 .229 .261 .238 .257 Positive .161 .279 .281 .225 .192 .204 .207 .162 .171 .169 .155 .232 .202 Negative -.288 -.202 -.154 -.138 -.259 -.144 -.115 -.144 -.141 -.229 -.261 -.238 -.257
Kolmogorov-Smirnov Z 8.661 8.387 8.418 6.734 7.740 6.039 6.197 4.874 5.144 6.889 7.846 7.181 7.739 Asymp. Sig. (2-tailed) .000 .000 .000 .000 .000 .000 .000 .000 .000 .000 .000 .000 .000
Table 4. Distribution of Capital Budget Technique on Gender, Age, and Education Gender Age Education
Mean Std. dev Mean Std. dev Mean Std.
dev
NPV male 2.79 1.13 20-35 2.56 1.28 Undergraduate 2.24 1.04 female 2.41 1.14 36 -50 2.84 1.06 Graduate 2.84 1.13 50 above 2.90 1.03 Professional 2.77 0.93
IRR male 2.10 1.28 20-35 2.19 1.33 Undergraduate 2.20 1.06 female 2.30 1.22 36-50 2.08 1.24 Graduate 2.11 1.30 50 above 2.13 1.30 Professional 2.21 1.19
MIRR
male 1.83 1.24 20-35 1.85 1.27 Undergraduate 1.86 1.02 female 2.09 1.34 36-50 1.84 1.24 Graduate 1.86 1.27 50 above 1.84 1.24 Professional 2.50 1.29
HR male 1.71 1.28 20-35 1.84 1.35 Undergraduate 1.81 1.08 female 2.11 1.44 36-50 1.65 1.24 Graduate 1.73 1.32 50 above 1.86 1.34 Professional 1.93 1.21
PP male 2.30 1.22 20-35 2.15 1.22 Undergraduate 1.67 1.03 female 2.07 1.26 36-50 2.31 1.23 Graduate 2.35 1.23 50 above 2.50 1.16 Professional 2.77 0.83
DPP male 1.64 1.39 20-35 1.97 1.37 Undergraduate 1.79 0.99 female 1.92 1.19 36-50 1.56 1.38 Graduate 1.65 1.41 50 above 1.37 1.30 Professional 2.07 1.21
UR male 1.69 1.39 20-35 1.62 1.34 Undergraduate 1.28 1.43 female 1.73 1.29 36-50 1.73 1.38 Graduate 1.74 1.37 50 above 1.67 1.51 Professional 3.21 0.80
SA male 1.61 1.26 20-35 1.64 1.28 Undergraduate 1.04 1.01 female 1.39 1.28 36-50 1.62 1.28 Graduate 1.66 1.27 50 above 1.41 1.12 Professional 2.36 1.28
VR male 1.58 1.23 20-35 1.60 1.23 Undergraduate 1.15 1.18 female 1.45 1.39 36-50 1.54 1.26 Graduate 1.60 1.25 50 above 1.74 1.23 Professional 2.00 1.11
SNA male 1.91 1.37 20-35 1.79 1.40 Undergraduate 1.36 1.28 female 1.59 1.37 36-50 1.94 1.38 Graduate 1.94 1.38 50 above 1.85 1.29 Professional 2.36 1.55
RO male 2.27 1.32 20-35 2.03 1.40 Undergraduate 1.83 1.01 female 1.70 1.31 36-50 2.34 1.30 Graduate 2.29 1.35 50 above 2.10 1.27 Professional 2.43 0.94
VDR male 2.17 1.29 20-35 2.06 1.37 Undergraduate 1.71 1.08 female 1.77 1.31 36-50 2.18 1.25 Graduate 2.21 1.31 50 above 2.20 1.32 Professional 2.36 0.93
ADR male 2.11 1.25 20-35 1.90 1.34 Undergraduate 2.11 1.02 female 1.89 1.45 36-50 2.11 1.23 Graduate 2.11 1.28 50 above 2.59 1.13 Professional 3.14 0.77

The Journal of Applied Business Research – July/August 2016 Volume 32, Number 4
Copyright by author(s); CC-BY 1279 The Clute Institute
Table 5. Distribution of Capital Budget Technique on Job Title, Experience, Company Size and Listing Job Title Experience Company Size Listing mean std dev mean std dev mean std dev mean std dev
NPV
Hi. Mngt 2.18 1.09 Less than 5 yrs 2.38 1.23 Large 2.87 1.05 Yes 2.84 1.064 Mid.Mngt 2.60 1.20 5 – 10 yrs 2.70 1.14 Small 2.72 1.17 No 2.72 1.81 Inv.Head 3.18 1.16 10 and more yrs 3.05 0.98 Accnt 2.85 1.12
IRR
Hi. Mngt 1.82 1.05 Less than 5 yrs 2.06 1.29 Large 2.25 1.27 Yes 2.19 1.241 Mid.Mngt 2.49 1.17 5 – 10 yrs 2.21 1.29 Small 2.03 1.27 No 2.04 1.310 Inv.Head 2.21 1.40 10 and more yrs 2.04 1.25 Accnt 2.00 1.29
MIRR
Hi. Mngt 2.00 1.12 Less than 5 yrs 1.90 1.29 Large 1.96 1.22 Yes 1.91 1.208 Mid.Mngt 2.07 1.15 5 – 10 yrs 2.00 1.24 Small 1.79 1.25 No 1.80 1.290 Inv.Head 2.07 1.28 10 and more yrs 1.65 1.21 Accnt 1.74 1.28
HR
Hi. Mngt 2.06 1.23 Less than 5 yrs 1.84 1.36 Large 1.87 1.31 Yes 1.79 1.235 Mid.Mngt 2.07 1.17 5 – 10 yrs 1.75 1.29 Small 1.64 1.26 No 1.68 1.341 Inv.Head 1.90 1.24 10 and more yrs 1.66 1.25 Accnt 1.57 1.31
PP
Hi. Mngt 2.32 1.25 Less than 5 yrs 2.08 1.16 Large 2.35 1.18 Yes 2.37 1.134 Mid.Mngt 1.93 1.18 5 – 10 yrs 2.19 1.25 Small 2.27 1.24 No 2.21 1.293 Inv.Head 2.52 1.53 10 and more yrs 2.50 1.20 Accnt 2.39 1.20
DPP
Hi. Mngt 1.57 1.16 Less than 5 yrs 1.94 1.28 Large 1.83 1.40 Yes 1.80 1.314 Mid.Mngt 1.91 1.30 5 – 10 yrs 1.70 1.42 Small 1.56 1.36 No 1.52 1.434 Inv.Head 1.39 1.37 10 and more yrs 1.48 1.35 Accnt 1.59 1.41
UR
Hi. Mngt 1.86 1.39 Less than 5 yrs 1.67 1.31 Large 1.62 1.36 Yes 1.58 1.294 Mid.Mngt 1.59 1.46 5 – 10 yrs 1.60 1.35 Small 1.78 1.39 No 1.79 1.456 Inv.Head 2.93 1.25 10 and more yrs 1.83 1.45 Accnt 1.64 1.33
SA
Hi. Mngt 1.65 1.20 Less than 5 yrs 1.59 1.23 Large 1.65 1.24 Yes 1.70 1.215 Mid.Mngt 1.55 1.39 5 – 10 yrs 1.73 1.31 Small 1.58 1.27 No 1.49 1.300 Inv.Head 1.66 1.59 10 and more yrs 1.45 1.22 Accnt 1.60 1.21
VR
Hi. Mngt 2.04 1.18 Less than 5 yrs 1.60 1.16 Large 1.68 1.29 Yes 1.67 1.260 Mid.Mngt 1.62 1.29 5 – 10 yrs 1.62 1.26 Small 1.52 1.20 No 1.48 1.231 Inv.Head 2.03 1.30 10 and more yrs 1.51 1.27 Accnt 1.50 1.21
SNA
Hi. Mngt 2.06 1.12 Less than 5 yrs 1.92 1.29 Large 2.02 1.34 Yes 2.12 1.340 Mid.Mngt 1.76 1.33 5 – 10 yrs 2.00 1.39 Small 1.84 1.38 No 1.66 1.374 Inv.Head 1.31 1.51 10 and more yrs 1.75 1.38 Accnt 1.94 1.40
RO
Hi. Mngt 1.90 1.19 Less than 5 yrs 2.01 1.34 Large 2.20 1.33 Yes 2.28 1.282 Mid.Mngt 2.02 1.28 5 – 10 yrs 2.32 1.34 Small 2.29 1.30 No 2.18 1.374 Inv.Head 2.55 1.35 10 and more yrs 2.24 1.32 Accnt 2.32 1.35
VDR
Hi. Mngt 1.94 .968 Less than 5 yrs 1.91 1.26 Large 2.21 1.29 Yes 2.33 1.236 Mid.Mngt 1.79 1.15 5 – 10 yrs 2.11 1.24 Small 2.12 1.28 No 1.97 1.323 Inv.Head 2.97 1.32 10 and more yrs 2.30 1.35 Accnt 2.24 1.32
ADR
Hi. Mngt 2.12 1.07 Less than 5 yrs 2.00 1.28 Large 2.24 1.25 Yes 2.31 1.220 Mid.Mngt 1.92 1.24 5 – 10 yrs 1.98 1.23 Small 2.05 1.25 No 1.90 1.28 Inv.Head 3.00 1.04 10 and more yrs 2.29 1.29 Accnt 2.10 1.28
Managerial levels have significant effects on all capital budgeting evaluation methods except on SA. Accordingly, table 5 shows that the PP, UR, VDR and ADR methods are primarily used by investment heads and are used least by middle management. In contrast, the NPV and RO methods are widely used by investment heads and are not popularly used by higher management. Moreover, IRR is primarily used by middle management and is not popular

The Journal of Applied Business Research – July/August 2016 Volume 32, Number 4
Copyright by author(s); CC-BY 1280 The Clute Institute
among higher management. However, middle management and investment heads use the MIRR method at the same rate, whereas the usage is not popular among accountants; in addition, HR is popular among middle management and not commonly used by accountants. At the same time, middle management popularly uses DPP, which is less commonly used among investment heads. Finally, higher-level managers and accountants popularly use VR and SNA methods, and investment heads use it least. Years of experience has significant effects on all capital budgeting evaluation methods except UR. Accordingly, from table 5, we note that the NPV, PP, VDR, and ADR methods are primarily used by persons having more than 10 years’ experience and is less common among employees having less than 5 years’ experience. With regard to ADR, it is less common among the 5-9 years’ experience category than in the less than 5 years’ experience category. At the same time, the MIRR, SA and RO method are commonly adopted methods by the 5-9 years’ experience category, whereas the first two methods are adopted less by the more than 10 years’ experience category and the third method is not common among the less than 5 years’ experience category. DPP is more common among the less than 5 years’ experience category and is rarely used by the more than 10 years’ experience category. Company size has significant effects on certain methods of evaluation of capital budgeting. The following methods such as IRR, MIRR, HR, DPP, SNA, and ADR show significant differences. Accordingly, Table 5 shows that usage of all the above said methods is more common in large companies than in small companies.
Table 6. P-value, Total mean and Std. dev of Capital Budget Techniques on demographic characters Gender Age Education Job title Experience Company
Size Listing
NPV Total Mean 2.77 2.77 2.78 2.76 2.77 2.78 2.78 Total std. dev 1.13 1.13 1.13 1.130 1.13 1.12 1.13 P-Value .012* .043* .000* .000* .000* .131 .280
IRR Total Mean 2.12 2.12 2.12 2.11 2.12 2.12 2.12 Total std. dev 1.27 1.27 1.28 1.272 1.28 1.27 1.28 P-Value .220 .525 .766 .000* .177 .011* .064
MIRR Total Mean 1.84 1.84 1.87 1.84 1.85 1.86 1.85 Total std. dev 1.25 1.24 1.25 1.246 1.25 1.24 1.25 P-Value .146 .984 .106 .000* .000* .048* .098
HR Total Mean 1.73 1.72 1.74 1.73 1.74 1.74 1.73 Total std. dev 1.29 1.28 1.30 1.289 1.29 1.28 1.29 P-Value .040* .145 .500 .000* .396 .014* .116
PP Total Mean 2.28 2.28 2.30 2.28 2.28 2.31 2.29 Total std. dev 1.22 1.22 1.22 1.222 1.22 1.21 1.22 P-Value .186 .060 .000* .000* .000* .406 .087
DPP Total Mean 1.66 1.65 1.67 1.65 1.66 1.67 1.66 Total std. dev 1.38 1.38 1.38 1.378 1.38 1.38 1.38 P-Value .086 .000* .202 .009* .001* .004* .001*
UR Total Mean 1.69 1.70 1.73 1.68 1.70 1.71 1.69 Total std. dev 1.38 1.38 1.39 1.379 1.38 1.38 1.38 P-Value .700 .540 .000* .000* .100 .091 .041*
SA Total Mean 1.60 1.60 1.62 1.60 1.60 1.61 1.59 Total std. dev 1.27 1.27 1.26 1.264 1.26 1.26 1.26 P-Value .184 .385 .000* .825 .022* .338 .004*
VR Total Mean 1.58 1.58 1.57 1.58 1.58 1.59 1.58 Total std. dev 1.25 1.25 1.25 1.240 1.24 1.24 1.25 P-Value .289 .289 .003* .003* .475 .086 1.263
SNA Total Mean 1.89 1.89 1.89 1.89 1.89 1.92 1.89 Total std. dev 1.37 1.37 1.38 1.371 1.37 1.36 1.376 P-Value .082 .336 .001* .036* .060 .038* .000*
(Table 6 continued on next page)

The Journal of Applied Business Research – July/August 2016 Volume 32, Number 4
Copyright by author(s); CC-BY 1281 The Clute Institute
(Table 6 continued)
Gender Age Education Job title Experience Company Size
Listing
RO Total Mean 2.23 2.23 2.25 2.23 2.23 2.25 2.23 Total std. dev 1.33 1.33 1.32 1.330 1.33 1.31 1.33 P-Value .002* .010* .002* .001* .038* .292 .362
VDR
Total Mean 2.14 2.15 2.17 2.14 2.14 2.16 2.15 Total std. dev 1.29 1.29 1.29 1.288 1.29 1.28 1.29 P-Value .026* .522 .005* .000* .005* .295 .000*
ADR Total Mean 2.10 2.10 2.13 2.09 2.10 2.13 2.10 Total std. dev 1.27 1.27 1.26 1.264 1.27 1.26 1.27 P-Value .240 .000* .008* .000* .001* .024* .000*
* The differences are significant at 𝛼 = 5%𝑙𝑒𝑣𝑒𝑙 Table 6 shows that gender has significant effects on certain capital budgeting evaluation methods. Methods such as NPV, RO, VDR and HR show significant differences. Accordingly, the usage of NPV, RO and VR is primarily preferred by males, whereas HR is a more likely method to be used by females (Table-4). Furthermore, age has significant effects on certain capital budgeting evaluation methods. Thus, from table 5, we note that methods such as NPV, DPP, RO, and ADR show significant differences. Accordingly, the usage of NPV and ADR is the choice for the above 50 years age group and is comparatively less used by the 20-35 years age group; in addition, the usage of the DPP method is the most likely choice for the 20-35 years age group but is not popularly used by the above 50 years age group. In addition, the RO Method is primarily used by the 36-50 years age group, but is not popularly used by the 20-35 years age group, as shown in table 4. Educational qualification has significant effects on most capital budgeting evaluation methods such as NPV, PP, UR, SNA, VR, SA, RO, VDR, and ADR; these methods show significant differences. Accordingly, from table 4, the PP, UR, SNA, VA, SA, RO, and VDR methods are primarily used by professionals but are not popularly used by undergraduates, whereas NPV is a more acceptable method for graduates but is not popular among undergraduates. At the same time, the ADR method is considered at the same rate by both graduates and undergraduates.
Table 7. Distribution of the Capital Budget Techniques Over Main Activity
Company Activity
Methods of Evaluating Capital Budget
NPV
IRR
MIR
R
HR
PP
DPP
UR
SA
VR
SNA
RO
VD
R
AD
R
Banking, Investment, Insurance
Mean 2.80 2.59 2.43 2.52 2.45 2.40 2.50 2.52 2.10 2.44 2.43 2.37 2.38
S.D. 1.28 1.32 1.33 1.19 1.26 1.28 1.27 1.19 1.31 1.32 1.33 1.34 1.22
Real Estate Mean 2.62 2.68 2.25 2.05 1.81 1.89 1.46 1.35 1.18 1.49 1.70 1.98 2.00 S.D. 0.91 0.99 1.10 1.13 1.09 1.03 1.38 1.37 1.29 1.22 1.09 1.13 1.05
Industrial Mean 2.87 2.27 1.91 1.78 2.26 1.78 1.31 0.92 1.07 0.71 1.26 1.31 1.26 S.D. 1.28 1.38 1.34 1.38 1.34 1.42 1.45 1.20 1.22 1.02 1.37 1.30 1.26
Services Mean 3.00 1.63 1.47 1.41 2.51 1.37 1.61 1.75 2.05 2.49 3.04 2.85 2.66 S.D. 1.01 1.17 1.10 1.18 1.13 1.43 1.35 1.06 0.95 1.20 0.84 1.02 1.09
Food Mean 2.04 1.86 1.80 1.49 1.90 1.32 1.29 1.56 1.63 2.06 2.00 1.92 2.02 S.D. 1.07 1.13 1.11 0.94 1.10 1.08 1.39 1.16 1.15 1.39 1.22 1.02 1.27
Others Mean 2.65 1.97 1.62 1.37 2.31 1.29 1.84 1.56 1.32 2.07 2.38 2.02 2.06 S.D. 1.06 1.21 1.19 1.30 1.20 1.38 1.17 1.14 1.22 1.23 1.23 1.20 1.22
P. value .000* .000* .000* .000* .000* .000* .000* .000* .000* .000* .000* .000* .000*
Total Mean 2.77 2.12 1.85 1.73 2.28 1.65 1.69 1.60 1.57 1.89 2.23 2.14 2.10 S.D. 1.13 1.28 1.25 1.29 1.22 1.38 1.38 1.27 1.25 1.37 1.33 1.29 1.27 N 900 898 893 888 886 874 894 897 896 899 901 901 900
* The differences are significant at 𝛼 = 5%𝑙𝑒𝑣𝑒𝑙

The Journal of Applied Business Research – July/August 2016 Volume 32, Number 4
Copyright by author(s); CC-BY 1282 The Clute Institute
Table 7 shows that company activities have significant effects on all methods of evaluation of the capital budgeting. MIRR, HR, DPP, UR, SA and VA are very popular methods utilized by banking and allied companies, whereas SA is least used in the same sector. With regard to real estate companies, the IRR method is common and the PP method is not common, similar to other areas. Industrial category reveals that SA, RO, VDR, and ADR are not widely used here. At the same time, the service sector reveals that the NPV, PP, SA, RO, VDR, and ADR methods are highly adopted methods here compared with other categories of companies. In addition, when compared to other sectors, NPV and UR are less common in the food sector, and HR and DPP are less common in the “other” category. Listing a company in KSE has significant effects on the methods they used, as presented in table 5 and Table 6. Whether the company is listed under KSE has significant effects on the methods such as DPP, UR, SNA, VR, SA, VDR and ADR. All methods are more favorable for companies listed in the KSE than for companies not listed in the KSE, except for the UR method, whereas the UR method appears to be the more accepted method for companies not listed in the KSE.
Table 8. Importance of Courses offered at College of Business Administration
Courses Frequency Distribution (%)
Mean St. dev
Cronbach coefficient Absolutely Not
Important Not
Important Neutral Important Very Important
Introductory Finance 5.3 8.5 4.3 58.2 23.7 2.86 1.040 89.4% Financial Management 5.7 7.2 3.7 53.5 29.9 2.95 1.065
Risk Management 5.0 7.0 4.9 53.1 30.0 2.96 1.039 To study the causes of the gap in knowledge or the practical difficulties of a graduate who finished his/her career, we inquired of the importance of three courses, introductory finance, financial management and risk management, to enable the students to address practical applications of corporate finance. We queried the respondents about their perceptions of the subject matter; it is significant to elucidate their perceptions with due importance. All three courses are considered important by the respondents with an average rating of 2.86, 2.95, and 2.96 for the three courses introductory finance, financial management and risk management, respectively. Table 8 provides more information.
Table 9. Importance of Courses with respect to demographic factors Introductory Finance Financial Management Risk management
Mean Std. Dev Mean Std. Dev Mean Std. Dev
Gender
Male 2.88 1.02 2.97 1.05 2.99 1.03 Female 2.56 1.24 2.59 1.25 2.54 1.15 Total Mean 2.86 2.95 2.96 Total Std.Dev 1.040 1.07 1.04 P-Value .047* .025* .001*
Age
20-35 2.82 1.09 2.78 1.12 2.81 1.09 36-50 2.88 1.01 3.00 1.04 3.01 1.02 ˃50 2.90 1.07 3.06 1.02 3.13 .992 Total Mean 2.86 2.95 2.96 Total Std.Dev 1.04 1.064 1.04 P-Value .744 .011* .006*
Education
Undergraduate 2.97 .758 3.07 .728 2.78 .763 Graduate 2.84 1.06 2.92 1.09 2.97 1.06 Professional 2.86 .663 3.36 .633 3.36 .633 Total Mean 2.85 2.94 2.96 Total Std.Dev 1.04 1.06 1.03 P-Value .707 .380 .001*
(Table 9 continued on next page)

The Journal of Applied Business Research – July/August 2016 Volume 32, Number 4
Copyright by author(s); CC-BY 1283 The Clute Institute
(Table 9 continued)
Introductory Finance Financial Management Risk management Mean Std. Dev Mean Std. Dev Mean Std. Dev
Job Title
Higher. Mngt 3.10 .707 3.18 .661 3.10 .678 Middle. Mngt 2.99 1.04 3.05 1.06 2.97 1.00 Fin. Analyst 3.07 .923 3.07 .961 3.00 1.04 Accountant 2.79 1.07 2.89 1.19 2.94 1.08 Total Mean 2.86 2.95 2.96 Total Std. Dev 1.04 1.07 1.043 P-Value .021* .110 .986
Experience
Less than 5 yrs 2.96 .960 2.99 .932 2.92 .916 5-10 yrs 2.91 .987 2.94 1.07 2.99 1.02 ˃ 10 yrs 2.76 1.14 2.92 1.13 2.94 1.13 Total Mean 2.86 2.94 2.96 Total Std. Dev 1.04 1.07 1.04 P-Value .213 .941 .196
Company Size
Big 2.87 1.10 2.96 1.16 2.99 1.12 Small 2.88 .975 2.98 .956 2.96 .965 Total Mean 2.88 2.97 2.98 Total Std. Dev 1.031 1.047 1.031 P-Value .370 .200 .060
Listing
Yes 2.84 1.084 2.94 1.120 2.98 1.077 No 2.90 .999 2.96 1.017 2.94 1.007 Total Mean 2.87 2.95 2.96 Total Std. Dev 1.042 1.068 1.042 P-Value .525 .663 .200
*The differences are significant at 5% level. Regarding gender, table 9 reveals that gender has significant effects on the importance of all the three courses needed in the college. Male respondents have a higher perception level of the importance of these courses than female respondents. When the importance of course is analyzed with respect to age, it is revealed that age has significant effects on the importance on two subjects’ financial management and risk management and above 50 years age group considered this as more important Educational level has significant effects on the importance of course risk management because professionals considered this course as more important for adoption in CBA as part of the curriculum. Job title has significant effects on the importance of the introductory finance course. Higher management considers the course as more important with a mean 3.10 out of 5. The mean value of the perception level of the investment head, middle management and accountants are 3.07, 2.99, and 2.79, respectively, which indicates a higher level of importance. Years of experience has no significant effects on the importance of courses offered at CBA. Company size and KSE listing has no significant effect on the subject matter.
Table 10. Importance of Courses with respect to Company Activity
Company Activity Financial Courses Offered
Introductory Finance
Financial Management
Risk Management
Banking, Investment, Insurance Mean 3.35 3.30 3.38 S.D. .669 .692 .615
Real Estate Mean 3.22 3.30 3.20 S.D. .716 .701 .685
Industrial Mean 1.83 1.62 1.74 S.D. 1.447 1.387 1.410
Services Mean 3.07 3.29 3.34 S.D. .574 .562 .598
(Table 10 continued on next page)
The Journal of Applied Business Research – July/August 2016 Volume 32, Number 4
Copyright by author(s); CC-BY 1284 The Clute Institute
(Table 10 continued)
Company Activity Financial Courses Offered
Introductory Finance
Financial Management
Risk Management
Food Mean 3.00 3.08 2.98 S.D. .791 .731 .661
others Mean 2.98 3.26 3.18 S.D. .867 .638 .663
P. Value .000* .000* .000*
Total Mean 2.87 2.95 2.96 N 894 894 895 S.D. 1.040 1.064 1.040
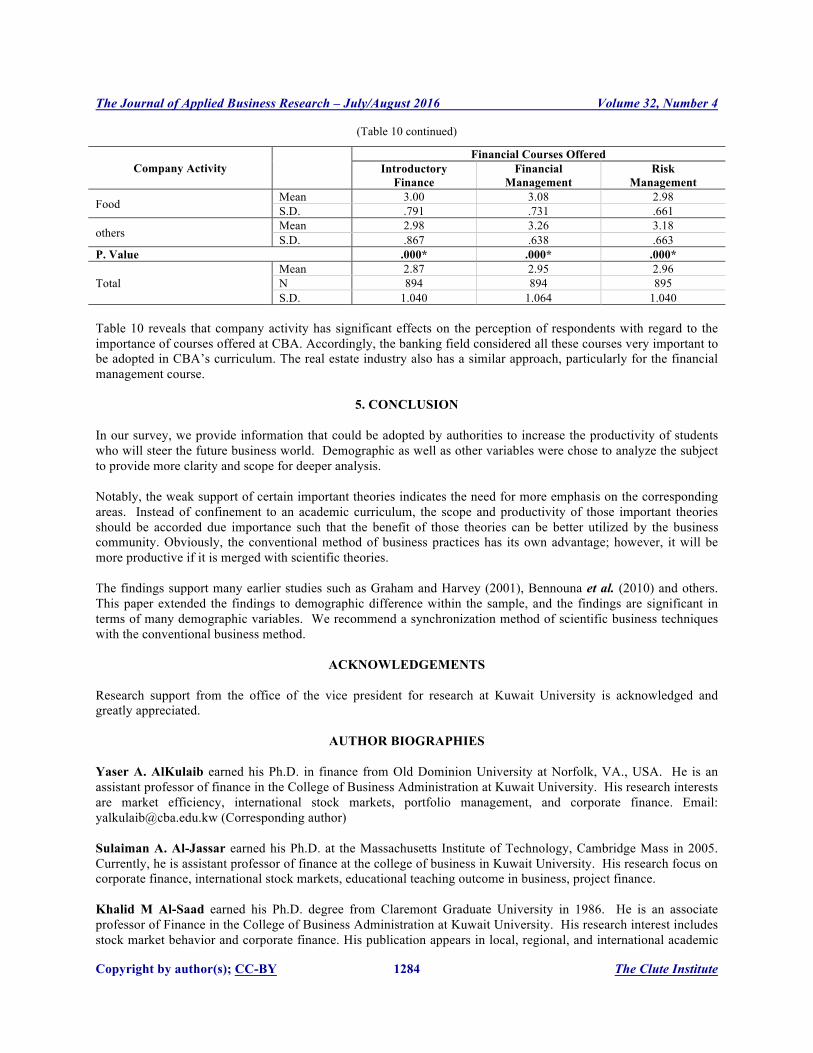
Table 10 reveals that company activity has significant effects on the perception of respondents with regard to the importance of courses offered at CBA. Accordingly, the banking field considered all these courses very important to be adopted in CBA’s curriculum. The real estate industry also has a similar approach, particularly for the financial management course.
5. CONCLUSION In our survey, we provide information that could be adopted by authorities to increase the productivity of students who will steer the future business world. Demographic as well as other variables were chose to analyze the subject to provide more clarity and scope for deeper analysis. Notably, the weak support of certain important theories indicates the need for more emphasis on the corresponding areas. Instead of confinement to an academic curriculum, the scope and productivity of those important theories should be accorded due importance such that the benefit of those theories can be better utilized by the business community. Obviously, the conventional method of business practices has its own advantage; however, it will be more productive if it is merged with scientific theories. The findings support many earlier studies such as Graham and Harvey (2001), Bennouna et al. (2010) and others. This paper extended the findings to demographic difference within the sample, and the findings are significant in terms of many demographic variables. We recommend a synchronization method of scientific business techniques with the conventional business method.
ACKNOWLEDGEMENTS Research support from the office of the vice president for research at Kuwait University is acknowledged and greatly appreciated.
AUTHOR BIOGRAPHIES Yaser A. AlKulaib earned his Ph.D. in finance from Old Dominion University at Norfolk, VA., USA. He is an assistant professor of finance in the College of Business Administration at Kuwait University. His research interests are market efficiency, international stock markets, portfolio management, and corporate finance. Email: [email protected] (Corresponding author) Sulaiman A. Al-Jassar earned his Ph.D. at the Massachusetts Institute of Technology, Cambridge Mass in 2005. Currently, he is assistant professor of finance at the college of business in Kuwait University. His research focus on corporate finance, international stock markets, educational teaching outcome in business, project finance. Khalid M Al-Saad earned his Ph.D. degree from Claremont Graduate University in 1986. He is an associate professor of Finance in the College of Business Administration at Kuwait University. His research interest includes stock market behavior and corporate finance. His publication appears in local, regional, and international academic

The Journal of Applied Business Research – July/August 2016 Volume 32, Number 4
Copyright by author(s); CC-BY 1285 The Clute Institute
journals. REFERENCES
Arnold1, G. & Hatzopoulos, P., (2000) The Theory-Practice Gap in Capital Budgeting: Evidence from the United Kingdom,
Journal of Business Finance & Accounting, 27(5-6), 603–626 Atkinson, S. and LeBruto, S. (1997) A Survey of Capital-Budgeting Methods Used by the Hotel/ Gaming Industry, Journal of
Hospitality Financial Management, 5 (1), 23-31. Benetti, C., Decourt, R., and Terra, P. (2007) The Practice of Corporate Finance in an Emerging Market: Preliminary Evidence
from the Brazilian Survey, working paper. Bennouna, K., Meredith, G. G., and Marchant, T. (2010) Improved capital budgeting decision making: evidence from Canada,
Management Decision, 48 (2), 225 – 247. Brounen, D., Jong, A., and Koedijk, K. (2004) Corporate Finance in Europe: Confronting Theory with Practice, Financial
Management, 33 (4), 71-101. Bruner, R. F., Eades, K. M., Harris, R. S., and Higgins, R. C. (1998) Best Practices in Estimating the Cost of Capital: Survey and
Synthesis, Financial Practice and Education, 8 (1), 13-28. Copeland, Thomas (2002) What Do Practitioners Want?, JOURNAL OF APPLIED FINANCE, 12(1), 7-14 Damodaran, A. (2001) Corporate Finance: Theory and Practice, John Wiley & Sons. Dittmann, I. Maug, E, & Kemper, J., (2004) How Fundamental are Fundamental Values? Valuation Methods and Their Impact
on the Performance of German Venture Capitalists, European Financial Management, 10 (4), 609–638 Famakin, I.O. & N. Saka, N., (2011) EVALUATION OF THE CAPITAL BUDGET PLANNING PRACTICE OF
CONTRACTORS IN THE CONSTRUCTION INDUSTRY, Journal of Building Performance, 2 (1), 26-32 Gitman, L. and Mercurio, V. (1982) Cost of Capital Techniques Used by Major U.S. Firms: Survey and Analysis of Fortune's
1000, Financial Management, 11 (4), 21-29. Gitman, L. J. and Vandenberg, P. A., (2000) Cost of Capital Techniques Used by Major US Firms: 1997 vs. 1980, Financial
Practice and Education, 10 (2), 53-68. Graham, J. R., and Harvey, C. R. (2001) The theory and practice of corporate finance: Evidence from the field, Journal of
Financial Economics, 60 (2–3), 187–243. Graham, J. R., and Harvey, C. R. (2003) The theory and practice of corporate finance: The data, working papers. Hermes, Niels, Smid, Peter & Yao, Lu, (2007) Capital budgeting practices: A comparative study of the Netherlands and China,
International Business Review, 16 (5), 630-654. Jagannathan, Ravi & Meier, Iwan (2002) Do We Need CAPM for Capital Budgeting?, Financial Management, vol. 31(4),
Winter. McLaneya, E., Pointona, J., Thomasa, M., and Tuckerb, J. (2004) Practitioners' perspectives on the UK cost of capital, The
European Journal of Finance, 10 (2), 123-138. McMahon, R. G. P. (1981) The Determination and use of Investment Hurdle Rate in Capital Bugeting: A Survey of Australian
Practice. Accounting & Finance, 21(1), 15–25. Mohamed Nurullah, Lingesiya Kengatharan, (2015) "Capital budgeting practices: evidence from Sri Lanka", Journal of
Advances in Management Research, Vol. 12 Iss: 1, pp.55 - 82 Nurullah, M., & Kengatharan, L. (2015). Capital budgeting practices: Evidence from Sri Lanka. Journal of Advances in
Management Research, 12(1), 55-82. doi:10.1108/JAMR-01-2014-0004 Ochoa Yepes, J., & Mora Cuartas, A. (2014). Capital budgeting practices: Empirical evaluation of company practices in the
construction sector in Colombia. Ecos De EconomíA - ISSN 1657-4206, 18(39), 143-163. doi:http://dx.doi.org/10.17230/ecos.2014.39.7
Rigopoulos, G. (2015). A review on real options utilization in capital budgeting practice. International Journal of Information, Business and Management, 7(2), 1.
Ryan, Patricia A. & Ryan, Glenn P. (2002) Capital Budgeting Practices of the Fortune 1000: How Have Things Changed?, Journal of Business and Management, 8 (4), 355-364.
Shinoda, Tomonari, (2010) Capital Budgeting Management Practices in Japan, Economic Journal of Hokkaido University, 39, 39-50.
Truong, G., Partington, G., and Peat, M. (2008) Cost of Capital Estimation and Capital Budgeting Practice in Australia, Australian Journal of Management, 33 (1), 95-121.
Wang, S., and Hwang, C., (2010) An Application of Fuzzy Set Theory to the Weighted Average Cost of Capital and Capital Structure Decision, Technology and Investment, 1 (4), 248-256.

The Journal of Applied Business Research – July/August 2016 Volume 32, Number 4
Copyright by author(s); CC-BY 1286 The Clute Institute
NOTES