Embed Size (px)
Citation preview

The Jobs at Risk from Globalization: the French Case
AbstractThis article analyzes the effect of outward Foreign Direct Investment (FDI) on the
composition of work in French firms. We use a detailed employer-employee databaseconstructed with four comprehensive datasets of French manufacturing firms over theperiod 2002-2007, in order to analyze changes in the workforce composition in termsof skills and tasks. We employ instrumental variable techniques by using two originalinstruments (the level of infrastructure and GDP per capita in host countries). Thefixed effect results show that FDI to low-income countries raises significantly the shareof executives and reduces the share of blue-collar workers in company workforces inFrance. Outward FDI to high-income countries affects negatively the share of workersperforming non-routine manual tasks. When controlling for endogeneity, the IV-resultsfurther show an overall positive effect of offshoring for employees performing interactivetasks, such as engineers and managers.
Keywords: FDI, Tasks, Inequality, Trade and labor marketJEL classification: J21, J24, F16, F14
1 Introduction
During the last two decades, the impact of offshoring on the labor market has been ofhuge interest in academic as well as in public debate. In particular, concerns are beingexpressed because offshoring of production stages could affect employment in most indus-trialized countries (Feenstra and Hanson (1996), Anderton and Brenton (1999), Becker etal. (2012)). Until now, the literature has shown little impact of offshoring on employmentand has pointed out instead the effect of technical progress (Feenstra and Hanson 1999;Hijzen, Görg, and Hine 2005; Slaughter 2000; Autor, Levy, and Murnane 2003).
However, lack of available individual employer-employee data have led previous anal-yses to study the effect of offshoring on employment at the industry level (Ekholm andHakkala (2005), Falk and Koebel (2012), Slaughter (2000), Hijzen et al. (2005)). Thisdata gap enables to have detailed information on employees, in terms of tasks performed,qualifications and wages. Only a few countries have sufficient statistical information mak-ing it possible to combine information on employees with information concerning theiremployers. Head and Ries (2002) observed 1,070 multinational firms in Japan, between1965 and 1989, and showed that higher employment in foreign subsidiaries is associatedwith greater use of non-production labor at home, relative to production labor. Hansson(2005) followed 75 multinational companies (MNC) in Sweden during the period 1990-1997and also observed a positive association between vertical offshoring, defined as offshoringto low-income countries, and the share of skilled workers, in the parent company. Beckeret al. (2012) used data on Germany for the years 1998 to 2001, and observed a statisticallysignificant correlation between offshoring and the share of highly educated workers, andalso between offshoring and the use of non-routine interactive tasks.
1

This study is interested in the effect of outward foreign direct investment (FDI) onthe work-composition of French firms. Foreign Direct Investment is an important contrib-utor of the internationalization of firms. In the United States, roughly one-half of U.Simports are transacted within the boundaries of multinational firms rather than acrossunaffiliated parties (Bernard et al. (2009)). In France, large multinational companieshave favored internationalization through in-house foreign production, compared to Ger-many who has favored internationalization through arm’s length production (Fontagnéand Gaulier (2008)).
We use a comprehensive dataset linking detailed company and employee information,allowing us to contribute to the literature in different ways. First, we argue that thedataset permits to disentangle more carefully the direction of the bias of FDI towardsoccupations and tasks than do data at the industry level. The changing nature of theproduction process in trade in tasks is of particular importance in its consequences for thelabor market. In recent times, several authors have shown that tasks give more informationon the ’offshorability’ of jobs than do occupations themselves (Blinder and Krueger 2013;Jensen and Kletzer 2010). However, to date, only a small number of studies includes taskcharacteristics to analyze the effect of offshoring on workforce composition (Becker et al.(2012), Hakkala et al. (2014))1. In this study, we adopt the classification of occupationsin terms of tasks, developed by Autor et al. (2003) to examine the relationship betweenoffshoring and the composition of tasks inside the firm.
Second, the data allows the effect of FDI on the labor market to be identified fromdifferent points of view. On the one hand, the data identifies the number of subsidiariesabroad and their location, making it possible to disentangle the effect of FDI in low-incomecountries and high-income countries on employment. We include a second decompositionof FDI by distinguishing the employment effect of first-time investors from the effect ofincreasing the number of subsidiaries for already-established firms. On the other hand,the construction of the data allows the business group perimeter of each firm to be recon-structed, in order to examine changes in the firm’s workforce composition consecutive toa shift in the offshoring strategy of the business group2.
Finally, we control for endogeneity that could arise due to simultaneity and/or dueto omitted variable bias. Our measure of offshoring focuses on in-house foreign directinvestment (FDI) and does not account for outsourcing to independent suppliers, whichimplies that a part of the offshoring process could be captured in the error term. Only asmall number of studies address the endogeneity problem in the literature. Becker et al.(2012) used a lagged instrument variable in the spirit of Blundell and Bond’s estimation(2000), while Hummels et al. (2011) used an original set of instrumental variables tocontrol for endogeneity associated with a firm’s exports and imports. In this study, wecontrol for the omitted variables bias by using an IV-model with two instruments: (i)the mean level of GDP per capita, and (ii) the average level of infrastructure in the hostcountries.
1Many countries and particularly France lack information on the task content of occupations. Frenchstudies often use the Reich classification that defines occupation categories according to the type of workperformed: routine occupations, symbol managers, officials and farmers. The Reich classification showsthat routine occupations are more sensitive to offshoring than farmers or officials (Allain, Collobert, andFraboul 2004). Becker et al. (2012) and Spitz-Oener (2006) used a task classification based on Germandata.
2A group is composed of an independent parent company and all other entities controlled by the parentcompany. We include information at the group level, because foreign direct investment could not onlyimpact employment inside the investing firm but also inside all other firms belonging to the same businessgroup.
2
The analysis depicts different results depending on the destination country. On the onehand, a firm’s FDI to low-wage countries negatively affects the firm’s share of blue-collarworkers and positively impacts the firm’s share of skilled workers (managers and workersperforming non-routine interactive tasks). On the other hand, offshoring to high-wagecountries is associated with a lower share of workers performing non-routine manual tasksin the home country.
When distinguishing country destinations between EU-15, low-wage countries, high-wage countries, East European and emerging economies (BRICS), the negative effectof FDI to low-income countries is mainly driven by offshoring to emerging economies(BRICS). The results underscore a significant and positive impact of FDI to BRICS, bothon the share of managers and non-routine occupations. The negative effect of FDI to high-wage countries on the share of workers performing non-routine manual tasks is driven byoffshoring to high-income countries other than in the EU-15. Results show that FDI tohigh-income countries reduces significantly the share of skilled blue-collar workers insidethe domestic firm. The results are stable when aggregating the foreign direct investmentstrategy at the level of the business group. We check for these effects on first time investors(extensive margin) and on already-established firms (intensive margin). The results high-light that firms significantly increase their share of managers at the extensive margin andreduce the share of blue-collar workers at the intensive margin. However, when controllingfor endogeneity, the negative impact on the share of unskilled blue-collar workers is nolonger significant, whereas the positive effect of FDI to low-income countries on the shareof managers and on the share of workers performing skilled non-routine tasks remainssignificant.
The paper is organized as follows. Section 2 reviews the theoretical and empiricalliterature on the effect of offshoring on employment. Section 3 describes the data and thevariables constructed. Section 4 details the methodology and Section 5 reports the resultsof the fixed-effect model. Finally, section 6 reports the results of the instrumental variablemodel, and Section 7 concludes.
2 Related LiteratureReduced barriers to international trade due to tariff reductions and falling transport
costs have created incentives for firms to establish part of their production abroad. Pro-duction is now geographically widespread and involves tasks being undertaken in manydifferent geographic locations. There are several theoretical models analyzing the labormarket effect of international fragmentation, including Feenstra and Hanson (1996) andGrossman and Rossi-Hansberg (2008).
The Grossman and Rossi-Hansberg (2008) model identifies three channels throughwhich offshoring could affect domestic wages. First, a relative price impact that worksthrough a Stolper-Samuelson effect. Offshoring reduces the cost of unskilled tasks andlowers the relative price of unskilled intensive goods, resulting in a decrease of the relativewage of unskilled workers. The second effect comes from an excess of the low-skilled laborsupply that implies a reduction of low-skilled workers’ relative wages. Finally, offshoringcan induce productivity gains that might translate into higher wages for both skilled andunskilled workers. The same reasoning may hold for employment (See Crinò (2009) for areview).
The Grossman and Rossi-Hansberg (2008) model places tasks rather than interme-diate inputs as the central unit of analysis of international fragmentation of production
3

processes. Occupational task characteristics become a key component of understandingthe ’offshorability’ of jobs (Blinder and Krueger (2013)). According to Blinder (2009),the offshorability of a task depends on its potential to be carried out in another location,without loss of quality and on the importance of face-to-face contact with people otherthan fellow workers. According to Jensen and Kletzer (2010), the potential offshorabilityof a task is determined by the need for proximity with the customer.3
To date, only a small number of studies have analyzed the effect of offshoring on tasks.Hakkala et al. (2014) show a negative effect of horizontal investment on non-routineemployment and Becker et al. (2012) show in-house offshoring to be associated with astatistically significant shift towards more non-routine and more interactive tasks.
A full range of tasks are needed to bring a product from its conception to its end use. Aproducer can choose between producing each of these activities in-house (inside a home ora foreign subsidiary) and outsourcing them from a local or a foreign supplier. The ’make-or-buy’ decision is a trade-off between the cost of arm’s-length relationships and the costof in-sourcing through foreign direct investment. Grossman and Helpman (2002) identifydifferent types of costs depending on the mode of integration. On the one hand, a verticallyintegrated firm may face a higher cost of producing components and services, becausesuch a firm has many divisions to manage, and because the organization does not benefitfrom the learning that comes with specializing in a single activity. On the other hand,arm’s length transaction costs stem from incomplete contracts and the search for partners.Several determinants influence the choice of integration and outsourcing: the type ofindustry (Antràs (2003), Antràs and Helpman (2004));4 the life product cycle (Antràs(2005)); the extent of contractual incompleteness (Grossman and Helpman (2005)); and afirm’s productivity (Antràs and Helpman (2004)).
One can argue that a firm’s outward FDI has a specific impact on employment com-pared to international subcontracting, due to differences in terms of technology transfersand incentives to access foreign markets.
First, technology transfers may differ depending on the mode of internationalization.Several studies have highlighted that the international strategy (arm’s length trade/FDI)determines skills formation and technology transfers (Grover (2008), Antràs (2005), Gross-man and Helpman (2002)). The firm prefers to integrate through foreign direct invest-ment when the good is high-technology intensive (Feenstra and Hanson (2005)) and non-standardized (Antràs (2005)), which implies human-capital intensive inputs.5 Other stud-ies have highlighted a higher speed of technological transfer and a higher investment inhuman capital in integrated subsidiaries compared to that of independent suppliers (Moran(2001), Mansfield and Romeo (1980)). Hence, technology transfer occurring through for-eign direct investment could imply a specific effect on employment (see Chusseau et al.(2008) for a review on the employment effect of technological change).
3The underlying idea is that when industries and occupations are highly concentrated, the tasks per-formed in these occupations may a priori be performed remotely from a single work site. They addinformation on occupational task characteristics to complement their analysis.
4Antràs (2003) develops a framework in which there are two inputs, one controlled by the final-goodsproducer, the other by the supplier. Ownership is directed to the party whose investment contributes mostto the value of the relationship. If the final-good is capital intensive, the final producer will prefer verticalintegration in capital-intensive processes and arm’s length transaction in labor intensive process.
5Moran (2001) cites Kodak as an interesting case study: Kodak used to produce conventional film inChina through an unrelated affiliate, they started producing the latest digitized film and camera productswhen the Chinese government allowed Kodak to establish a parallel, wholly-owned plant.
4
Second, the motivation of FDI (vertical versus horizontal FDI) could have a specificimpact on employment. On the one hand, FDI can act as a form of offshoring if thecreation and/or the acquisition of a foreign company allow the value chain to be brokenup, which is often referred to as vertical investment. On the other hand, FDI can bedone for market-seeking reasons and does not necessarily increase the fragmentation ofthe production process, which is often referred to as horizontal investment.6
The effect on the labor market can vary considerably from one integration strategy toanother. For Lipsey (2002), access to new markets (horizontal FDI) can increase firms’profits and competitiveness and a positive effect on home employment may occur. Theextent to which domestic employment might benefit from firms’ international expansionwill depend on the share of foreign profits which are repatriated. If the parent com-pany benefits from additional revenues from its foreign subsidiaries, domestic employmentmay increase.7 Whereas vertical FDI is associated with relocation of low-skilled activitiesabroad, that could both increase the average skill-intensity for the investing firm at home,and reduce the share of unskilled workers, depending on whether domestic and foreignemployment are substitutes or complements. The link between the complementary natureof foreign and domestic labor is not empirically clear. Several studies conclude that sub-stitution may occur when FDI is horizontal (Konings and Murphy 2006; Cuyvers et al.2005), whereas others conclude that substitution between domestic and foreign workers ismore likely to arise when investments are made in low-wage countries (Riker and Brainard1997; Head and Ries 2002; Strauss-Kahn 2004).
3 The Data and the Construction of VariablesOur database is constructed with four micro-data sources provided by the French
National Institute for Statistics and Economic Studies (INSEE). Our database allows anoriginal employer-employee database to be constructed for France, over the period 2002-2007.8
Employee Level Information. Employee level information comes from confidentialyearly social security records, processed and transmitted by the INSEE, the so-called Déc-laration Annuelles des Données Sociales (DADS Postes). All French employers, includingnational companies, public administrations and local governments are required annuallyto declare to state social security organizations and to the tax administration informationabout each of their employees. Every row in the declaration corresponds to a particularemployee’s position in a plant and reports information on the sex, age, occupation, numberof worked hours, wages and the corresponding plant number. We sum each position (thatcorresponds to each line of the database) in groups of occupations for a given firm.9 Hence,
6Vertical offshoring often takes place in low-income countries, whereas horizontal FDI is generallyrealized in high-income countries. Statistics suggest that FDI to low income countries is expanding rapidlywith the development of emerging economies. In 2013, FDI flows to all major developing regions accountedfor 54 per cent of global inflows (World investment report (2013)).
7This idea is close to the productivity effect developed in Grossman and Rossi-Hansberg (2008).8We do not take into account information after 2007 because it could capture the labor market effect
of the recent economic crisis. We do not use the data before 2002 because the occupational categories weuse to define the groups of occupations (see below) changed that year.
9These include a group of skilled/unskilled workers, a group of managers and blue-collar workers, and agroup of production/non- production workers for instance. A detailed description of occupational groupsis given in the following sections.
5
the final database allows changes in the workforce composition for each French firm to betracked, during the period 2002-2007.10
In order to obtain wage-bill shares for tasks, we add information on occupational tasks’content by using the ONET index. The ONET index is provided by the Department ofLabor’s Occupational Information Network. For the United States, the ONET databaseprovides a detailed description of workers, occupations or jobs. We use information aboutoccupation requirements that detail typical activities required across occupations to sum-marize the specific types of job behavior and tasks that may be performed within occupa-tions.
The ONET index is built using a specific occupation classification based on the Amer-ican SOC classification of occupations. We assume that the task content of occupationsis identical in the United States and in France, so we can use the ONET classification toanalyze the job content of French occupations.11 The key point has been to link the ONEToccupation classification with the French PCS-ESE classification. To do this, we build amapping table from PCS-ESE to SOC 2010, thanks to the EurOccupations database.12The EurOccupations project aimed at building a publicly available database containingthe most common occupations in multi-country data-collection. The database includesa source list of 1,594 distinct occupational titles within the ISCO-08 classification andprovides a mapping table between the EurOccupation classification and the ISCO-08 clas-sification, as well as a French translation of these occupations. We then match the 412PCS-ESE occupational classification for which there is at least a perfect pair with oc-cupations described in the EurOccupation database. Finally, a mapping table from theISCO-08 to the SOC-2010 classification is used to link the PCS-ESE occupational classifi-cation with the SOC-2010. By creating this mapping table, we can use the ONET index toanalyze the task content of French occupations. We build a score on the task importancefor each firm by aggregating ONET scores on the work composition of each firm. Firmscan then be identified by task vectors13.
Firm Level Information. Firm level information comes from two confidential databases.The first is the Liaison Finanière survey (LIFI), that collects all the links between up-stream and downstream firms and allows firms having at least one FDI project to beidentified (i.e., firms having 10 % or more of voting stock). We are able to identify both afirm’s parent company and a firm’s foreign subsidiaries.14 We have information on foreignsubsidiaries’ locations, on the balance sheet value of the ownership interest, and on thepercentage of voting stocks at each subsidiary’s general assembly. We distinguish the num-ber of FDI holdings by country destination to BRICS, Eastern Europe, European Unioncountries, other high-income countries, and low-income countries15.
10We only keep firms for which at least 90% of their work composition is referenced.11This hypothesis is based on the idea that two countries with the same level of development should
have the same production function, as suggested by traditional international trade theory.12We are very grateful to Professor Kea Tijdens for having allowed us to use this database.13Details on tasks are given in the following sections14A small number of these firms are joint ventures, so we are unable to identify a unique parent company.
In order to reconstruct the group perimeter by allocating one parent company to each legal entity, wedecided to drop information about joint ventures. In 2007, there were 15,006 joint ventures, representing6% of our sample.
15East European countries are composed of countries which joined the European Union after 2004;European countries include countries which joined the EU before 2004; high-income countries are composedof Iceland, Norway, Liechtenstein, Andorra, Gibraltar, Monaco, Switzerland, Japan, South Korea, Canada,
6

Finally, we use a threshold survey from the France’s manufacturing census, calledthe Enquête Annuelle Entreprise (EAE). This data source provides the detailed incomestatement of all French manufacturing firms employing more than 20 employees. Thedatabase allows several control variables of company characteristics to be constructed,such as: value added, tangible assets, revenue, and different technology proxies.
The panel is unbalanced, with 42% of the sample being observed during the wholeperiod. Firms observed during the 6-year period are on average more capital intensive,have higher R&D investment, more employees and higher revenues than firms lost due toattrition. These differences might alter our results, due to a selection bias effect. Therefore,we only report results in the balanced panel data.16
3.1 Measuring Foreign Direct Investment
There are different degrees of commitment when investing in a foreign subsidiary. Afirm can choose to engage alone and maintain full control over the foreign subsidiary(wholly owned subsidiary), or to share the ownership with one or more partners to set upa joint venture.17 The exercise of power (i.e. the mobilization of corporate assets in a jointstock company) is a matter of control which depends on the share of voting stocks held ina foreign subsidiary (Schott (1990)).
Moran (2004) has argued that the failure to differentiate between FDI with minorityshareholding and investments with majority ownership makes it impossible to isolate theeffect of FDI on the host country. The entry mode choice (a wholly-owned subsidiaryversus a joint venture) has indeed several implications for the firm’s management andtechnology transfer. A large number of shareholders can create an agency problem inwhich shareholders are passive in monitoring subsidiaries, because the benefits and costsof ownership are shared by a multitude of owners (Berle and Means (1932)). In addition,fear of a technology property leakage reduces technology transfer when the degree ofownership is low (Smarzynska-Javorcik and Spatareanu (2008), Abraham et al. (2010)).In contrast, the greater the concentration of ownership, the greater the degree of costsand benefits that are borne by any one owner (Demsetz and Lehn (1985)). Hence, ownersoperating under concentrated ownership have an incentive to discipline management andto supervise actively the controlled firm (Vermeulen (2013)).
The employment effect of making an FDI could thus vary depending on the entrymode choice. Bircan (2011) shows that greater foreign equity participation leads to thegreater transfer of both tangible and intangible assets and also observed a higher wagepremium, especially for skilled workers. In particular, Bircan (2011) shows that more than15 percentage points of the multinational wage premium can be explained by the level offoreign ownership.18
the United States, Australia, New Zealand; and low-income countries are composed of other Asian, Africanand South American countries.
16The Hausman test fails to reject the hypothesis of random attrition, still, we find similar results withthe unbalanced panel data and do not alter our principal conclusions.
17Foreign investment may be undertaken by constructing new operational facilities from the ground up(greenfield or brownfield investment), or without actually creating a new subsidiary (merger and acquisi-tion).
18We have tested the impact of a change in the share of voting stocks held in a foreign subsidiary on theshare of employment in the investing firm. Results reveal that increases in the share of voting stock in afirm’s subsidiary raises significantly the share of executives and reduces the share of blue-collar workers.Results are available in the online appendix of the authors’ website.
7

Our measure of FDI is calculated by summing the number of foreign subsidiaries con-trolled by each firm j over the period t ∈ [2002, 2007]. We weight this number by the firmj’s percentage of votes at general meetings19 in subsidiary k.
κjt =∑k
V otingkjt (1)
Where voting is the share of voting stock held in firm j’s subsidiary k at time t. Thedata provide information on the location of subsidiaries, which we group into low-incomeand high-income countries (as done by Becker et al. (2012) and Hijzen et al. (2011) amongothers). By doing so, we aim at capturing the motivations of foreign direct investment:horizontal versus vertical FDI (See Markusen (1995)).
The following table shows descriptive statistics on the number of subsidiaries by regionsin which subsidiaries are located, for year 2007.
Table 1: MNC Subsidiaries
Average % changea % of WOSb
number of subsidiaries
High income countries 0.704 [1,276] 0.164 [0,653] 51.9% [0.499]Low income countries 0.755 [1,666] 0.112 [0,876] 28.6% [0.452]BRICS 0.462 [1,096] 0.254 [0,809] 48.1% [0.499]Eastern Europe 0.251 [0,727] 0.191 [0,693] 56.6% [0.495]EU-15 1.736 [2,313] 0.086 [0,891] 44.6% [0.497]
a. Measure the percentage change of subsidiaries between 2002 and 2007.b. Measure the percentage of Wholly Owned Subsidiaries (WOS) in each region in 2007.Lecture: The table gives the average number of subsidiaries in multinational firms by country
destination for year 2007Source: LIFI survey, French annual census for manufacturing (EAE);Note: Balanced Panel; Standard deviations under brackets. Authors’ calculations. High-income
countries are composed of the United States, Canada, New Zealand, Japan, Norway, Switzerland, Iceland,Andorra, Monaco and Lichtenstein; Eastern Europe includes countries having joined the European Unionafter 2004; Low-income countries are composed of all other countries.
French multinational firms have on average more subsidiaries in high-income countries,low-income countries and in the European Union than in other parts of the world. Thelarge number of subsidiaries in low-income countries is partly due to France’s colonialhistory in North Africa and in sub-Saharan countries in the 19th century. French colo-nization has had an impact on language and the institutional proximity of France andthe countries it colonized, by imposing French as an official language and by imposinglegal and judicial institutions. Since lower geographic and cultural distance, as well as acommon language have a positive impact on outward FDI (Bénassy-Quéré et al. (2007)),the number of subsidiaries in former French colonies is particularly important. In 2007,there were more than 1,500 subsidiaries established in Cameron, Côte d’Ivoire, Morocco,Tunisia and Algeria. In comparison, there were only 328 French subsidiaries in Japanin 2007, 996 in Switzerland, and 3,146 in the United States. The third main group ofdestination countries are the BRICS and which experienced the highest increase between2002 and 2007. In 2007, there were 2,267 French subsidiaries in the BRICS, with 1,067 ofthem established in China.
Roughly one half of FDI in BRICS takes the form of wholly owned subsidiaries (see thelast column of Table 1). Emerging economies (and BRICS in particular) continue to at-tract knowledge-intensive and technology-intensive FDI from developed countries (Gryczka
19For example, a firm having 2 subsidiaries controlled at 40% and 100% has a measure κ equals to 1.4.
8

2010), which could create incentives for French multinational firms to settle wholly ownedsubsidiaries in order to protect themselves against the leakage of technology, know-howand/or intangible assets. In contrast, French multinational firms seem to access low incomecountries by setting up a joint venture, since only 28.6% of FDI to low-income countriestakes the form of wholly-owned subsidiaries. The need of a partner’s experience of theforeign market is all the more important in a country where corruption and the culturaldistance are high (Nunnenkamp and Andreis (2013), Brouthers and Brouthers (2001),Gatignon and Andersen (1988), Johansen and Vahlne (1977)). The predominance of joint-ventures in low-income countries suggests that FDI mainly concerns labor-intensive goodswith standardized procedures and low-technology (Antràs (2005)). We also notice thatinternationalization in East European countries predominantly takes the form of wholly-owned subsidiaries. Firms prefer to avoid coordination with joint-venture partners in orderto ensure quality standards and processes, by relying only on their own resources (Klug(2006), Stiegert et al. (2006)).
We control our result by building other proxies of outward FDI, as described in Ap-pendix A. We find estimation results to be similar whatever the proxy retained (see Table9 and 10).
3.2 Measuring tasks
In order to classify occupations by their task intensity, we follow the strategy of Autor,Levy, Murnane (2003): hereafter ALM. ALM use the US Department of Labor’s Dictionaryof Occupational Titles (DOT) to break down different tasks into five major components:non-routine analytical, non-routine interactive, non-routine manual, cognitive routine andmanual routine tasks.
According to ALM, the codified nature of a task determines its potential for relocation.The more a task can be determined by specific rules, the less it relies on tacit knowledgeand the easier it is to explain to someone else and also to control. As information onthe task content of an occupation is very difficult to obtain, even more so because thegiven data is not available in every country, we use the US database of the Departmentof Labor’s Occupational Information Network (ONET). Table 12 in Annex B reports the41 work activities divided into five groups: non-routine analytical, non-routine cognitive,non-routine interactive, non-routine manual and routine manual.20
We follow Oldenski (2012) in linking the ONET routine/non-routine score to occupa-tions. The score importance of each task i in group j is:
Mij =∑o
γojloi (2)
With γoj being the share of occupation o used in the production of firm j and loi beingan index of the importance of task i in the occupation o. We normalize the task index, sothat for every occupation a task intensity measure varies in the range of 0 to 121.
20Table 13 in Annex B gives examples of occupations in the metal industry, ranging from engineer toassembler. This table shows that engineers have a higher index of non-routine tasks and assemblers ahigher index than manual tasks.
21However, because the ONET database does not provide information on workers, we are unable tofollow the evolution of task requirements within a given occupation. Therefore, our empirical estimationsonly analyze inter-occupational change by assuming that there are no intra-occupation variations. Thislimitation can be avoided by using data that provides for the evolution of each task within an occupation,
9
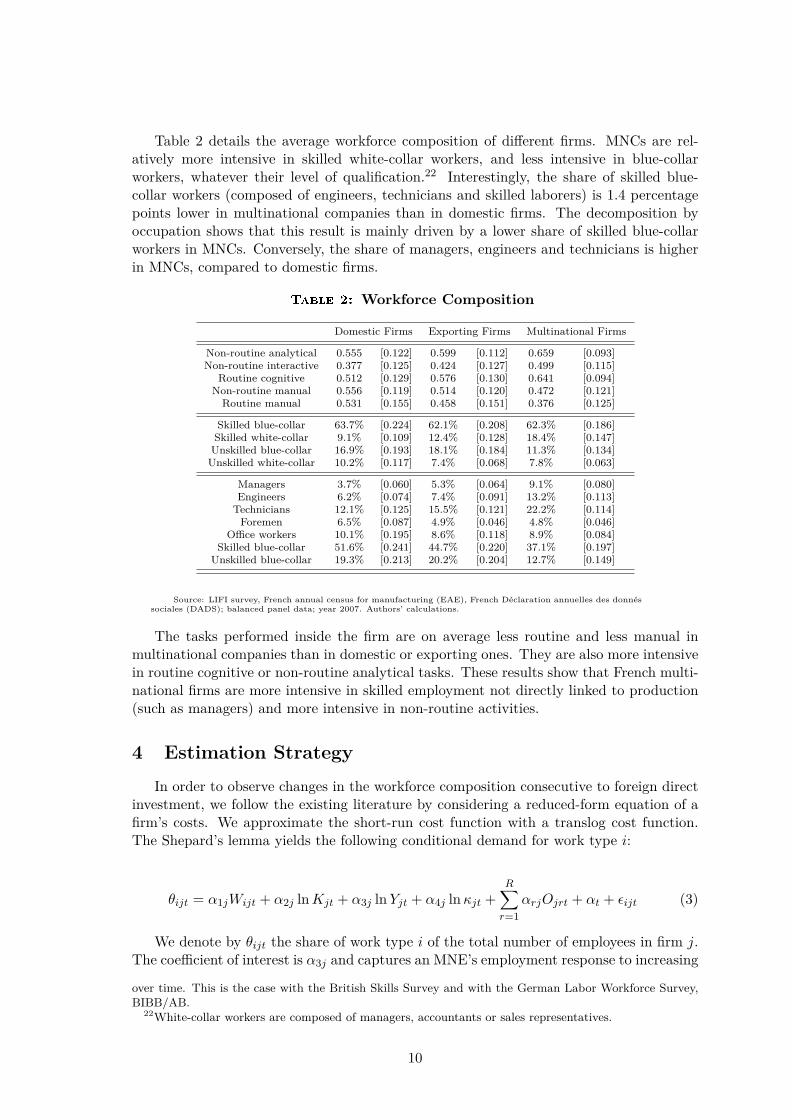
Table 2 details the average workforce composition of different firms. MNCs are rel-atively more intensive in skilled white-collar workers, and less intensive in blue-collarworkers, whatever their level of qualification.22 Interestingly, the share of skilled blue-collar workers (composed of engineers, technicians and skilled laborers) is 1.4 percentagepoints lower in multinational companies than in domestic firms. The decomposition byoccupation shows that this result is mainly driven by a lower share of skilled blue-collarworkers in MNCs. Conversely, the share of managers, engineers and technicians is higherin MNCs, compared to domestic firms.
Table 2: Workforce Composition
Domestic Firms Exporting Firms Multinational Firms
Non-routine analytical 0.555 [0.122] 0.599 [0.112] 0.659 [0.093]Non-routine interactive 0.377 [0.125] 0.424 [0.127] 0.499 [0.115]
Routine cognitive 0.512 [0.129] 0.576 [0.130] 0.641 [0.094]Non-routine manual 0.556 [0.119] 0.514 [0.120] 0.472 [0.121]Routine manual 0.531 [0.155] 0.458 [0.151] 0.376 [0.125]
Skilled blue-collar 63.7% [0.224] 62.1% [0.208] 62.3% [0.186]Skilled white-collar 9.1% [0.109] 12.4% [0.128] 18.4% [0.147]Unskilled blue-collar 16.9% [0.193] 18.1% [0.184] 11.3% [0.134]Unskilled white-collar 10.2% [0.117] 7.4% [0.068] 7.8% [0.063]
Managers 3.7% [0.060] 5.3% [0.064] 9.1% [0.080]Engineers 6.2% [0.074] 7.4% [0.091] 13.2% [0.113]Technicians 12.1% [0.125] 15.5% [0.121] 22.2% [0.114]Foremen 6.5% [0.087] 4.9% [0.046] 4.8% [0.046]
Office workers 10.1% [0.195] 8.6% [0.118] 8.9% [0.084]Skilled blue-collar 51.6% [0.241] 44.7% [0.220] 37.1% [0.197]
Unskilled blue-collar 19.3% [0.213] 20.2% [0.204] 12.7% [0.149]
Source: LIFI survey, French annual census for manufacturing (EAE), French Déclaration annuelles des donnéssociales (DADS); balanced panel data; year 2007. Authors’ calculations.
The tasks performed inside the firm are on average less routine and less manual inmultinational companies than in domestic or exporting ones. They are also more intensivein routine cognitive or non-routine analytical tasks. These results show that French multi-national firms are more intensive in skilled employment not directly linked to production(such as managers) and more intensive in non-routine activities.
4 Estimation StrategyIn order to observe changes in the workforce composition consecutive to foreign direct
investment, we follow the existing literature by considering a reduced-form equation of afirm’s costs. We approximate the short-run cost function with a translog cost function.The Shepard’s lemma yields the following conditional demand for work type i:
θijt = α1jWijt + α2j lnKjt + α3j lnYjt + α4j ln κjt +R∑r=1
αrjOjrt + αt + εijt (3)
We denote by θijt the share of work type i of the total number of employees in firm j.The coefficient of interest is α3j and captures an MNE’s employment response to increasing
over time. This is the case with the British Skills Survey and with the German Labor Workforce Survey,BIBB/AB.
22White-collar workers are composed of managers, accountants or sales representatives.
10

in-house FDI, as described in equation 1. Here, in order to fit the economic reality, weassume that in every period t ∈ [2002; 2007] firm j produces output Y by using capitalK and different types of workers i. Kj is measured by the input of capital and Yj by therevenue of firm j.
A source of potential bias arises from the inclusion of the variable Wij . Wij equals theratio of the wage paid to work type i (wijt) out of the wage paid to the complementarywork type not in i (w−ijt). This wage variable captures trends in education and thereforefirm j’s cost share. Moreover, there could be collinearity between time dummies and wagesif they are linearly dependent. We drop the wage variable by assuming that there is noexogenous variation across companies23. εijt is the idiosyncratic error term that can bedecomposed as εijt = ηj + vijt, where ηj is the constant individual-specific residual andvijt is a standard residual.
We add several control variables to the specification (captured in Ojt): a technologyproxy, the amount of exports and domestic insourcing.
From an already-vast literature, we know that technological change is responsible forchanges in the wage-bill share (Goos et al. (2009), Autor et al. (2003), Acemoglu and Autor(2011)). We account for technological change by building a technology proxy, measured asthe proximity to the firm’s technology frontier.24 It represents the gap between the (log)productivity of a particular firm and the highest productivity (or the highest percentileproductivity) in the same industry. The productivity of the firm is measured as the valueadded per worker such as: Proximityikt = P 95 log
(V AL
)kt− log
(V AL
)ikt
. We use the 95order percentile in order to have a robust measure, by excluding outliers. The lower thevariable, the more productive the firm is.
We also control for the value firms’ exports (in emillion), in order to disentangle theeffect of exports linked to the effect of foreign direct investment.25 Most heterogeneousfirm models treat internationalization as a progressive process: the least productive firmsexit the market, low productive firms remain in the domestic market, highly productivefirms export; and top-notch productive firms integrate through foreign direct investment(Helpman et al. (2004)). In practice, multinational firms continue to reach foreign marketsthrough exports rather than only through foreign subsidiaries. Roughly 90 percent of USexports and imports flow through multinational firms (Bernard et al. (2005)). Moreover,recent empirical findings have shown that exporting is a key step prior to internationalsettlement. 95 percent of new FDI are preceded by exports in the same country (Gazaniol(2014)). Hence, including exports in the specification would reduce a potential endogeneityproblem, in which exports may not only affect the FDI decision, but also employment (SeeCrinò (2009) for a review of studies analyzing the effect of trade on employment).
Finally, we control for the possibility of domestic in-sourcing. A firm can choose tokeep the production of an intermediate input within its boundaries by producing theintermediate input at home or abroad. Domestic in-sourcing is considered as traditionalvertical integration that could affect employment within the investing firm (Antràs and
23However, we report results by including wages in Annex A, and do not alter our conclusions.24We have used different proxies for technological change, such as investment in R&D, proximity to the
sector technology frontier and software investment. Whatever the variable retained, our results are notaltered. However, we prefer the measure of proximity to the technology frontier for several reasons. First,the software investment variable is not referenced for all firms. Second the R&D variable is built from theEAE survey that accounts for fixed R&D, i.e., R&D accounted as capital expenditure in the balance-sheetrather than as an expense of research and development.
25The data we use do not allow control for a firm’s imports of finished or intermediate goods.
11

Helpman (2004)). Domestic in-sourcing could also be a first step before undertaking aforeign direct investment. Indeed, Antràs and Helpman (2004) model the same peckingorder as Melitz (2003), in which the least productive firms insource through domesticsubsidiaries, whereas the most productive firms integrate via foreign direct investment.26A firm’s productivity would determine whether a firm insources or integrates throughforeign direct investment. In order to account for domestic in-sourcing, we build the samemeasure as described by equation 1, by summing the total number of French subsidiaries27.
The following table presents some descriptive statistics of companies’ characteristics,distinguishing between domestic, exporting and multinational firms. As already shownin the literature, multinational companies are on average bigger, more productive, moreintensive in capital and also have higher revenue and value added. Multinational firms arealso closer to their technology frontier, as shown by the last row of Table 3.
Table 3: Firm’s Characteristics
Domestic Firms Exporting Firms Multinational Firms
Number of Firms 1,207 4,578 767Apparent labor productivity (value 66.3 [67.33] 63.6 [79.86] 88.1 [154.39]added/workforce) in K eCapital Intensity (Property, Plant 2264.9 [55687.36] 2665.6 [28556.15] 45022.3 [491608.2]and Equipment) in K e
Value Added 6343.6 [20967.86] 11534.7 [26839.2] 64969 [139050.2]Revenue 22975.3 [113723.5] 42552.9 [107501.5] 242731.8 [529145.3]Workforce 113.7 [245.935] 200.7 [354.200] 914.1 [1932.06]
Proximity to the frontier 0.471 [0.522] 0.455 [0.529] 0.194 [0.545]technology frontier
Source: LIFI survey, French annual census for manufacturing (EAE), French Déclaration annuelles des donnés sociales (DADS);Year 2007; Balanced panel data; Standard deviation under brackets. Authors’ calculations.
5 Estimation ResultsIndustry level studies use a classification of workers based on levels of skilled ver-
sus unskilled education (Feenstra and Hanson 1996; Feenstra and Hanson 1999; Hansson2000). Other studies have used a more-detailed disaggregation of labor than the tra-ditional skilled/unskilled dichotomy, by adding layers of educational categories (Ekholmand Hakkala (2005), Falk and Koebel (2002), Hijzen et al. (2005), Morrinson and Siegel(2001)), and by defining groups of occupations according to their link to production (Bis-courp and Kramarz 2007; Head and Ries 2002). The underlying assumptions for makingthis classification is that MNCs may maintain their non-production upstream activitiesin the home country (such as R&D, coordination, accounting or marketing activities),while offshoring their production activities. Yet, jobs can significantly differ inside a sameeducation group, due to different occupational characteristics. Indeed, some occupationsare more manual or cognitive, even though they have the same level of education. Forexample, workers with a medium level of education may be administrative workers, whileothers are technicians. Occupation heterogeneity inside a group of education could leadto an overall effect of FDI which is insignificant.
26This result holds in a world with no outsourcing and if the final good is intensive in inputs brought bythe final-good producer.
27All French subsidiaries controlled by another company are considered as French subsidiary.
12

In the following section, we define different groups of occupations in order to accountfor aggregation bias. The first selects occupations by their level of qualification and definesexecutives, blue-collar workers, intermediate professions and employees. The second selectsoccupations by their link to the production process, and identifies the skilled and unskilledworkers who are linked to the production process and those who are not. Finally, we look atseven specific occupations (managers, engineers, skilled and unskilled blue-collar workers,employees, foremen and technicians). A detailed description of occupational groups isprovided in Annex C. We also report results on task classifications and define manualversus analytical, cognitive and interactive tasks.
The Hausman test of exogeneity confirms the existence of constant unobserved variablescorrelated with the independent variables in all specifications. Consequently, our estimatesbased on the random effect model are biased and standard errors may be underestimated.To account for individual-level heterogeneity, the constant individual-specific residual ηj isdifferenced out and within-firm equation estimates are provided. Time dummies are usedto control for common time trends. Equation 3 is run using robust and clustered standarderrors.
5.1 Changes in the share of occupations
In a first regression, we consider four groups of occupations, differentiated by their levelof qualification. The first group of executives is composed of skilled workers (engineersand administrative managers) in column (1); the group of intermediate professions is madeup of middle-skilled workers, some of whom are skilled secretaries (primary or executivesecretaries), while others are skilled production workers such as technicians or foremen, incolumn (3). We also define two other groups of unskilled workers, the first is composed ofunskilled administrative employees (operators, receptionists and unskilled secretaries), incolumn (4) and the second is made up of blue-collar workers in column (2).
Controlling for unobserved firm-level heterogeneity, table 4 reveals a positive relation-ship between a firm’s revenue and the share of skilled and middle skilled workers (i.e.,executives and intermediate professions). In contrast, a negative correlation between theshare of blue-collar workers and an increase in a firm’s revenue is observed.
The results reveal a statistically significant and positive relationship between increasingFDI in low-income countries and changes in the share of executives in the home company.Conversely, the relationship between FDI in low-income countries and the share of blue-collar worker is significantly negative, at the 10% level. This result is in line with traditionalinternational trade theory predictions.
In contrast, when identifying occupations according to their link to production 28 (as inBiscourp and Kramarz (2007), and Head and Ries (2002)),29 we do not find any significanteffect of offshoring on employment (see Table 16 in Appendix D). We argue that the non-
28The first two are composed of production workers. First, we define skilled production workers (i.e.,engineers, technicians, foremen, skilled blue-collar workers), and second unskilled production workers (i.e.,unskilled blue-collar workers). The last two are composed of non-production workers. The first are skilled(administrative managers and administrative intermediate professions, mostly composed of skilled sec-retaries) and the second are unskilled, mostly made up of administrative employees (i.e., receptionists,unskilled secretaries and typists).
29Biscourp and Kramarz (2007) found a negative effect of imports of intermediate inputs on the shareof unskilled production workers, while Head and Ries found a positive effect of increasing employment inlow-wage subsidiaries on the share of skilled non-production workers.
13

significant result is due to the high degree of heterogeneity in occupational categories,which could imply an aggregation bias.
When disaggregating occupational classifications into occupations, we are able to iden-tify which occupations demonstrate the results obtained previously. We split occupationsinto seven major groups: administrative managers, engineers, employees, technicians, fore-men, skilled and unskilled blue-collar workers (See Table 17 in Appendix D).
Table 4: Changes in the Share of Occupations by Qualification Groups
FE FE FE FE(1) (2) (3) (4)
IntermediateExecutives Blue-collars professions Employees
Subsidiaries inLI countries 0.015*** -0.008* -0.005 -0.007
[0.006] [0.005] [0.005] [0.005]HI countries 0.002 -0.008 0.007 0.001
[0.008] [0.008] [0.007] [0.007]France -0.002 -0.001 0.002 0.002
[0.002] [0.004] [0.003] [0.003]Technology Frontier 0.001 -0.000 -0.000 -0.000
[0.001] [0.001] [0.001] [0.001]Export -0.000 0.001 -0.000 0.001
[0.000] [0.000] [0.000] [0.001]Revenue 0.007** -0.012*** 0.006* 0.006
[0.004] [0.005] [0.003] [0.007]Capital -0.001 0.002 0.000 -0.000
[0.001] [0.002] [0.001] [0.002]Constant 0.101*** 0.625*** 0.183*** 0.052
[0.020] [0.025] [0.019] [0.039]
Observations 18,729 18,729 18,729 18,721R2 between 0.098 0.193 0.047 0.016R2 within 0.039 0.025 0.003 0.003R2 overall 0.083 0.159 0.048 0.024
Source: LIFI survey, French annual census for manufacturing (EAE), French Déclaration an-nuelles des données sociales (DADS); period 2002-2007. Authors’ calculations. Note: Estimationsare for firm fixed effects (FE) and variables are calculated at the level of the firm. Wage-bill sharesare in percent, varying between zero and 100.
The negative correlation between a firm’s foreign direct investment to low-income coun-tries and the share of blue-collar workers is mainly driven by unskilled blue-collar workers,as shown by column (4) in Table 17. The positive correlation between FDI to low in-come countries and executives is only observed for skilled white collar workers (managers)and is not significant in the sample of skilled blue collar workers (engineers). Hence, re-sults in Table 17 show that compensatory effects could occur when aggregating groups ofoccupations30.
5.2 Changes in task intensity
In this section, we analyze change in the composition of tasks performed inside thefirm. The theoretical and empirical literature has shown that some occupations might beeasier to offshore because they perform offshorable manual and routine tasks (Acemogluand Autor 2011b; Grossman and Rossi-Hansberg 2008; Hummels et al. 2011; Ebensteinet al. 2009). While other occupations, such as managers and engineers, might be less
30For instance, the coefficient associated with technicians is positive while the coefficient associated withforemen is negative, while there are both captured in the group of intermediate occupations.
14

’substituable’ by offshored employees, because they perform specific tasks that can bedifficult to offshore without loss of quality (such as interactive or analytical tasks).
Table 5 shows a positive and significant complementarity between a firm’s capitalintensity and the use of non-routine manual, interactive and analytical tasks. This resultis also observed in Becker et al. (2012), who show a positive correlation between the ratioof a firm’s capital over value-added and the non-routine task index in the manufacturingsector.
Table 5: Changes in Task Intensity
Model FE FE FE FE FE(1) (2) (3) (4) (5)
Routine Non-routine Non-routine Non-routine RoutineDependant variable manual manual interactive analytic cognitive
Subsidiaries inLow-income countries -0.000 0.003 0.014* 0.004 0.004
[0.007] [0.007] [0.007] [0.006] [0.007]High-income countries -0.011 -0.017** -0.005 -0.004 0.005
[0.010] [0.009] [0.009] [0.008] [0.007]France -0.005 -0.010** -0.001 -0.002 0.000
[0.005] [0.004] [0.004] [0.004] [0.004]Technology frontier -0.001 -0.002 -0.002 -0.002* -0.001
[0.001] [0.001] [0.001] [0.001] [0.001]Exports -0.001 -0.001** -0.000 -0.001 -0.000
[0.001] [0.001] [0.001] [0.000] [0.001]Revenue 0.004 0.002 0.007 0.004 0.001
[0.006] [0.005] [0.005] [0.004] [0.005]Capital -0.002 0.003** 0.004** 0.005*** 0.001
[0.002] [0.002] [0.002] [0.002] [0.002]Constant 0.446*** 0.499*** 0.380*** 0.572*** 0.571***
[0.031] [0.026] [0.028] [0.020] [0.024]
Observations 18,246 18,246 18,246 18,246 18,246R2 between 0.005 0.027 0.016 0.000 0.005R2 within 0.002 0.024 0.039 0.032 0.021R2 overall 0.006 0.024 0.021 0.002 0.006
Source: LIFI survey, French annual census for manufacturing (EAE), French Déclaration annuellesdes donnés sociales (DADS); period 2002-2007. Note: Estimations are for firm fixed effects (FE) andvariables are calculated at the level of the firm. The wage-bill shares are in percent, varying betweenzero and 100.
Examining the results of exports on a company’s task intensity, we notice that exportshave a significant and negative impact on the share of workers performing non-routinemanual tasks. This result mirrors the ones in Peri and Poole (2013) on Brazil, who finda rising demand for cognitive relative to manual tasks within the firm consecutive to afirm’s openness.
Turning to the coefficients of the variables of interest, the results show that there is anegative effect of outward-FDI to high-income countries on the share of workers performingnon-routine manual tasks. This result is driven by the capital goods industry.31 The capitalgoods industry is relatively less fragmented at the top, as it requires heavy intermediateinputs which are costly to export, and requires heavy engineering, which involves skilledmanual competences (see Table 18). Companies often choose relocation when exporting iscostly in order to access foreign markets and to benefit from specific competences availablein the North (Riker and Brainard (1997), Grossman et al. (2006)). In 2007, roughly 70%of FDI in capital goods industries was directed to high income countries. Production
31We split the data into the three main sectors composing our sample. Results are reported in Annex E.
15

offshored to high-wage countries in capital goods industries implies the substitution ofskilled production workers, resulting in a decrease in the share of workers performingnon-routine manual tasks.
By contrast, we notice a positive effect of FDI to low-income countries on the intensityof interactive tasks performed in the home country. The fragmentation of production pro-cesses to low-income countries increases the need for skilled workers in upstream productionactivities and raises the average skills-intensity of the investing firm at home. The positiveeffect of FDI to low-income countries on the share of workers performing interactive tasksis mainly driven by FDI in the intermediate goods sectors32 and is not observed in theconsumer goods industry. One explanation could be that vertical fragmentation in theconsumer goods sector is mainly realized through international arms-length production,because the cost of importing intermediate-goods and exporting final-goods is relativelysmall compared to that in capital goods and in the intermediate goods sector.
To conclude, these two subsections have shown the importance of having micro datato understand which occupations are exposed to FDI. There is a clear FDI bias towardskilled executives, at the expense of blue-collar workers in the home country. More specif-ically, FDI to low-income countries raises the demand for skilled executives performinginteractive tasks, whereas FDI to high-income countries reduces the demand for workersperforming non-routine manual tasks. However, aggregate occupation classifications (suchas production versus non-production workers) do not provide an understanding of whichjobs are affected by the FDI strategies of French firms.
In the following subsections, we go a step further in order to understand what is drivingthe occupational bias: (i) the countries of destination; (ii) first-time investors or alreadyestablished multinational firms; and (iii) the parent companies’ strategies.
5.3 Country of destination
In this subsection, we estimate equation 3 by dividing FDI into five major destinationcountry groups: the BRICS, Eastern Europe (countries belonging to the EU prior to 2004),the European Union (countries belonging to the EU before 2004), other high-income andlow-income countries33. We report the results in Table 6, for executives, blue-collar workersand for occupational tasks34.
The results show that there is a negative and significant correlation between a firm’sexports and the share of workers performing non-routine manual tasks. Similar to theresults obtained in Table 5, we observe that a firm’s capital intensity has a positive andsignificant effect on the share of workers performing tasks more intensively which are non-routine manual, interactive and analytical. These tasks are features of skilled occupationssuch as managers and engineers (as described in Table 14 in appendix B).
Concerning the variable of interest here, we first notice that foreign direct investmentin high-income countries does not affect the workforce composition in the domestic firm.This is true except for workers performing non-routine manual tasks intensively, which areadversely affected. These tasks are mainly performed by skilled production workers, such
32See Table 21 in Annex E.33High-income countries include: Norway, Switzerland, the United States, Australia, Canada, New
Zealand, Liechtenstein, Monaco, Gibraltar, Iceland, Alaska and Andorra, while other countries are consid-ered as low-income countries.
34Our analysis is conducted at the firm level, rather than at the plant level, so we do not account for thereplication of establishments in other countries.
16

as engineers, technicians and skilled blue-collar workers and need specific qualificationsand experience (see Table 14 in appendix B). Hakkala and Huttunen (2014) also find anegative effect of imports of intermediate inputs on the share of non routine physical tasksin Finland.
Table 6: Changes in the Share of Occupations
Executive Blue-collar Routine Non-routine Non-routine Non-routine Routineworkers manual manual interactive analytic cognitive
VARIABLES (1) (2) (3) (4) (5) (6) (7)
Subsidiaries inHI countries 0.002 -0.006 -0.010 -0.019** -0.005 -0.004 0.003
[0.008] [0.008] [0.010] [0.008] [0.010] [0.007] [0.007]Eastern Europe 0.001 0.005 0.021* 0.021* 0.002 -0.003 -0.003
[0.006] [0.010] [0.011] [0.012] [0.014] [0.011] [0.009]BRICS 0.022** -0.015* -0.008 -0.003 0.025** 0.012 0.005
[0.011] [0.008] [0.011] [0.010] [0.012] [0.009] [0.009]LI countries 0.006 -0.002 -0.010 0.003 0.006 0.002 0.004
[0.009] [0.009] [0.013] [0.011] [0.011] [0.010] [0.011]EU-15 -0.004 -0.005 -0.001 -0.002 -0.004 -0.003 0.005
[0.004] [0.005] [0.008] [0.006] [0.007] [0.006] [0.005]France -0.001 -0.001 -0.006 -0.010** -0.001 -0.001 0.000
[0.002] [0.004] [0.005] [0.004] [0.004] [0.004] [0.004]Technology frontier 0.001 -0.000 -0.001 -0.002 -0.002 -0.002* -0.001
[0.001] [0.001] [0.001] [0.001] [0.001] [0.001] [0.001]Exports -0.000 0.001 -0.001 -0.001** -0.000 -0.001 -0.000
[0.000] [0.000] [0.001] [0.001] [0.001] [0.001] [0.001]Revenue 0.007* -0.012*** 0.004 0.003 0.007 0.004 0.001
[0.004] [0.005] [0.006] [0.004] [0.005] [0.005] [0.005]Capital -0.001 0.002 -0.002 0.004** 0.004** 0.005*** 0.001
[0.001] [0.002] [0.002] [0.002] [0.002] [0.002] [0.002]Constant 0.101*** 0.625*** 0.446*** 0.495*** 0.380*** 0.572*** 0.571***
[0.020] [0.025] [0.031] [0.020] [0.028] [0.025] [0.024]
Observations 18,729 18,729 18,246 18,246 18,246 18,246 18,246R-squared 0.038 0.024 0.002 0.024 0.041 0.033 0.026
Log Likelihood 44781.543 38957.739 28786.676 32071.302 30798.131 32840.598 33189.570Source: LIFI survey, French annual census for manufacturing (EAE), French Déclaration annuelles des donnés sociales (DADS); period 2002-2007. Note: Estimations are firm fixed effects (FE) and variables are calculated at the level of the firm. The wage-bill shares are in percent,varying between zero and 100.
Amongst high-income countries, it is possible to separate out the EU-15, which istraditionally one of the main area of French foreign investment. We do not observe anysignificant results regarding the demand for skills and tasks. This may be due to the highheterogeneity of countries inside European Union. Indeed, the reasons for offshoring tothe EU-15 are more diverse than relocation to other areas (Topiol and Héricher 2013).This could explain the overall insignificant effect of FDI on employment35.
When isolating the Central and East European countries (CEECs), the effect of FDIon employment in France is clearer. Increasing FDI in CEECs raises the demand formanual workers. FDI in CEECs generally combines mixed strategies and includes both costreductions and market access strategies. For example, car manufacturers have relocatedto CEECs to benefit from low production costs, but also to be close to local marketswith strong growth potential. The traditional logic of fragmenting production processes inCEECs by French and German firms consists of offshoring stages of production related tointermediate goods, by applying the logic of exploiting comparative advantages betweencountries. In contrast, the assembly and logistics stages in the production process are
35Some strategies may be linked to reasons of market access: for example, in Germany, the UnitedKingdom and the Benelux countries. Other FDI strategies may be carried out to take advantage of factorcost differentials: for example, in Portugal, Spain and Ireland.
17
concentrated in the home country, in a region which is geographically central to accessingthe EU market (Moati and Mouhoud (2005), Martinez-Zarzoso et al. (2011)).36 Indeed,when splitting our sample into different sectors, the positive significant result of FDI tothe CEECs on the domestic share of manual workers is only driven by the intermediategoods industry. Therefore, FDI in the CEECs raises the demand for non-routine manualtasks, mostly carried out by skilled production workers, because firms mainly re-importintermediate goods, in order to assemble final products in France. This raises the demandfor production workers performing skilled and unskilled manual tasks. This result is similarto Falk and Wolfmayr (2008) as well as to Konings and Murphy (2006).
The results are quite different when FDI is undertaken in major emerging countries.FDI inflows in developing economies increased by 68 percent between 2005 and 2007, andnow surpass developed economies as recipients of FDI (World investment report, 2007,2013). In France in 2002, the amount of imports of intermediate inputs reached e96.2billion and rose to e197.16 billion by 2012, with the BRICS accounting for 10.6% percentof this growth.37. FDI to the BRICS could thus have a higher impact on employmentcompared to what was observed in the 1990s statistics (Krugman (2008), Autor et al.(2013)). Table 6 indeed reveals that the preceding results are driven by FDI to BRICS,which are favorable for executives and workers performing non-routine interactive tasksintensively (carried out by skilled workers) in France. In contrast, substitutability isobserved between FDI to BRICS and the demand for blue-collar workers.
5.4 Increasing FDI and first-time investors
The preceding estimations included information on both multinational and domesticfirms (composed of exporting and purely domestic firms). This section focuses on thesample of multinational firms. The sample is divided into firms that were already multi-national at the beginning of the sample period and changed their number of subsidiariesabroad (we call this increasing intensive margin), and those that became multinational forthe first time by undertaking at least one FDI project between 2002 and 2007 (we call thisincreasing extensive margin). The results are reported in Table 7.
First-time investors in low-income countries increase the demand for managers withoutreducing employment of blue-collar workers. In contrast, results indicate that, once firmsare multinational, increasing FDI in low-wage countries decreases the demand for blue-collar workers.
Exports play a positive role in the demand for blue-collar workers. An increase in ex-ports raises the share of blue-collar workers. But this result is only observed in the sampleof first time-investors. We explain this result by the fact that export is an important deter-minant of the first settlement (Gazaniol 2012). International experience through exportsallows a firm to collect additional information on the foreign market (legal and judicialinstitutions for instance), and is a good way to gain experience from internationalizationbefore making the first settlement (Conconi et al. (2013)). Increasing exports prior to
36In France, for example, these assembly phases are concentrated in the North Eastern region, to beclose to the EU market. We have run the equation per region and the region that leads these results areAlsace and Lorraine, which are two regions close to the German border. Trade in parts and componentsproduced in the CEEC-10 for export to the OECD countries now accounts for approximately 30% of theOECD’s total trade (Yeats 1998).
37These statistics are calculated from Comext, Eurostat sources stemming from aggregate input- outputtables in national accounts. Intermediate goods are identified in three broad categories with the BECclassification (BEC 420, BEC 530, BEC 220).
18

a first investment could thus lead to an increase in domestic production, and thereforeincrease the proportion of blue-collar workers.
Table 7: Comparaison between First-Time Investors and MultinationalFirms
Extensive Margin Intensive MarginExecutives Blue-collar Executives Blue-collar
workers workers
Subsidiaries inLI countries 0.024*** -0.003 0.009 -0.010*
[0.008] [0.008] [0.006] [0.005]HI countries 0.007 0.003 0.003 -0.008
[0.010] [0.009] [0.006] [0.005]France -0.003 -0.106 -0.018 -0.007*
[0.007] [0.006] [0.004] [0.004]Technology Frontier -0.001 -0.003 -0.003 0.003
[0.004] [0.003] [0.002] [0.002]Export -0.000 0.005*** 0.000 0.000
[0.003] [0.001] [0.001] [0.001]Revenue 0.043*** -0.028** 0.010 -0.006
[0.013] [0.012 [0.007] [0.007]Capital 0.000 -0.001 -0.002 0.006*
[0.004] [0.003] [0.003] [0.003]Constant -0.051 0.598*** 0.151*** 0.466***
[0.073] [0.068] [0.042] [0.435]
Observations 990 990 2,299 2,299R-squared 0.051 0.025 0.047 0.069
Log Likelihood 1851.183 1914.168 4684.909 4568.450
Source: LIFI survey, French annual census for manufacturing (EAE), French Déclaration annuellesdes donnés sociales (DADS); period 2002-2007. Note: Estimations are of firm fixed effects (FE)and variables are calculated at the level of the firm. The wage-bill shares are in percent, varyingbetween zero and 100.
Our results mirror those of Hijzen et al. (2011) and of Barba Navaretti et al. (2010).The study of Hijzen et al. (2011) uses French data over the period 1987-1999. Theyuse a matching technique to measure the effect of FDI, three years after the first foreigninvestment. They show that investment in low-income countries has no significant effecton employment, only FDI to high-income countries does. The study of Barba Navarettiet al. (2010) analyze the effect of FDI on employment in France and Italy over the period1993-2000. They show that first time investors in both developed and developing countriesexperience significantly higher employment relative to the control group. However, the twostudies do not distinguish workers by qualification group, and are not able to observe thepositive correlation between the first settlement in low-income countries and the averageskill intensity of the investing firm at home.
The estimated coefficient of FDI to low-income countries on the share of executives ismore than three times the size than that of the negative coefficient associated with FDI tolow-income countries on the share of blue-collar workers. Hence, as in Barba Navaretti etal. (2010), we find evidence of an overall positive effect of outward investments to cheaplabor countries on total employment.
5.5 Robustness test: Parent company strategies and Foreign acquisition
In the preceding estimations, the labor effect of foreign direct investment is exactlyidentified for each firm. However, carrying out the study at the firm level could tend tooverestimate or underestimate the coefficient associated with outward-FDI.
19

Firms can be either independent or be part of a business group. A group is composedof an independent parent company and all other entities controlled by the parent company.In our sample in 2007, 81% of the firms belonged to a group (as a parent company or asa subsidiary) and 82% of them were not directly engaged in outward FDI (i.e., they donot directly control any foreign subsidiary). Foreign direct investment of a particular firmbelonging to a group may not only affect the investing firm, but also all other Frenchsubsidiaries belonging to the group, if foreign subsidiaries are substitutes for domesticones. Hence, FDI at the group level can affect the work-composition of all the group’ssubsidiaries; even those that are not engaged in outward FDI. For example, if a Frenchgroup decides to offshore part of its production process, it can decide to restructure itswhole perimeter by strengthening its tertiary functions (such as R&D, IT or sales) in thenational territory inside its domestic subsidiaries (Gazaniol and Peltrault 2013). Therefore,domestic subsidiaries could go through major changes without directly investing abroadand this result would not be observed with estimation at the firm level.
In order to control for a firm’s exposure to the group’s FDI activities, we attributeto each firm the κ variable at the group level38. The results revealed by Table 11 areconsistent with those obtained by taking into account the relocation strategy at the firmlevel, as detailed in appendix A.
In a second robustness test, we control for change in firm nationality. A recent lit-erature has shown an impact of foreign acquisition on employment: more skilled andproductive firms tend to be the targets of foreign acquisition (Bloningen et al. (2012),Almeida (2007))). Hence, the non-inclusion of foreign acquisition could alter our resultsfor two reasons. First, if foreign-owned firms are on average more productive and moreskills-intensive, foreign acquisition could affect both the share of skilled workers and theexplanatory variables (such as a firm’s size and productivity), resulting in an endogene-ity problem.39 Second, foreign-acquisition can imply an artificial change in the firm’sbalance-sheet information for fiscal optimization reasons (by transferring a firm’s profitsin countries where tax policies are more accommodating for instance), resulting in a mea-surement error bias. Results however show that the inclusion of the firm’s nationality doesnot alter the conclusions (See Table 9 and 10 in Appendix A).
6 IV ResultsAfter controlling for firm-specific heterogeneity, the main residual still contains time-
varying and firm-specific factors that can affect the workforce’s composition. A cause forconcern is that simultaneity problems, measurement errors and/or omitted variable biascould affect the preceding estimations. First, simultaneity problems arise if unobservedcomponents, such as change in the composition of shareholders, directors, head of humanresources or changes in the strength of unions affect simultaneously the decision to makea foreign direct investment, and the composition of activities undertaken by the firm40.
38We build the measure described in equation 1 by summing the number of subsidiaries of the businessgroup. We attribute this measure to each firm belonging to the same group. All other variables aredetermined at the firm level. For simplicity, we only retained firms in our sample that did not change theirparent company during the whole period of observation.
39The inclusion of firm fixed effects considerably reduces the bias, since only 1,138 firms observed duringthe period changed nationality.
40Dewit et al. (2009) have shown that high levels of employment protection tend to discourage outwardFDI. In contrast, Kramarz (2008) shows that firms with strong unions increase offshoring and are associatedwith a decline in employment. France has strong labor market institutions. The OECD EmploymentOutlook 2004 presents an overall summary index of employment protection that relies on three main
20
In this case, the estimated coefficient of interest would be biased. Second, our estimationcould suffer from measurement error bias because our proxy for in-house offshoring doesnot reflect the offshored activity composition of the firm. In particular, we do not accountfor foreign employment or sales.41 Finally, an omitted variable bias could arise becausewe focus on in-house foreign direct investment and we do not account for outsourcingto independent suppliers. However, the offshoring strategy of a firm could include bothforeign outsourcing from unrelated suppliers (international arm’s-length production) andtasks performed abroad by subsidiaries or related entities of a multinational firm (Kroeger(2013).42
We answer these problems by using instrumental variable techniques to explain the FDIdecision.43 The first instrument is the host country’s GDP per capita. A high level of GDPwould capture relocation motivated by reasons of market access, and conversely, a low levelof GDP would capture relocation decisions in order to take advantage of less costly labor(Brainard and Riker 1997; Markusen 1995; Kohler 2002). The second instrument is thehost country’s level of infrastructure. The quality of institutions and infrastructure havebeen highlighted as important sources of comparative advantage in the recent literatureof offshoring (Gamberoni et al. (2010)).
In addition, GDP per capita and the level of infrastructure are important determinantsof the development of intellectual property rights, and the level of corruption in the hostcountry. These elements may not only influence a firm’s choice to settle a foreign subsidiaryin a particular country, but also influence the entry mode choice, between maintaining fullcontrol over the subsidiary or sharing ownership with one or more partners (Nunnenkampand Andreis (2013), Broughter and Broughters (2001), Javorcik and Wei (2009)).
Based on these results, we construct the average level of GDP and infrastructure in thefirm’s host countries. For each of these two variables, we distinguish between subsidiariesin high-income countries and low-income countries, as done previously. The two variablesare constructed as follows:
GDPcjt =
K∑k=1
GDPckjt
K(4)
Infracjt =
K∑k=1
Infrackjt
K(5)
components. The first is related to protection of regular workers against dismissal; the second is related tospecific requirements for collective dismissals; and the third is related to regulation of temporary forms ofemployment. On a scale from 0 to 6, France has an employment protection index of 2.9, the sixth highestindex from a sample of 28 countries. In comparison, the US has an index of 0.6.
41Other studies, including Becker et al. (2012), Hanson (2005) and Head and Ries (2002) approximatedtransfers within multinationals by a multinational company’s share of employment by subsidiaries in totalemployment.
42The literature often captures outsourcing by measuring the share of imported intermediate inputsfrom the same industry abroad, relative to total inputs used in the production (Feestra and Hanson(1996)) However, this measure is not able to distinguish imports from foreign subsidiaries and importsfrom subcontractors abroad.
43We have assumed clustered errors, i.e., that observations for firms in two different time periods arecorrelated, but not observations between different firms. Hence, in order to relax the assumption that thecorrelation of a firm’s observations within a group is constant, we run a feasible, efficient two-step GMM,as described in Baum et al. (2007) and Baum et al. (2002).
21

c = L,H corresponds to high-income and low-income countries and k is a firm’s sub-sidiary. For each subsidiary, we measure the GDP per capita and the level of infrastructurein the country. K is the total number of firm j’s subsidiaries. GDP per capita and in-frastructure are calculated from the World Bank database. The GDP per capita variablesare gross domestic product for 220 countries, converted into international dollars usingpurchasing power parity rates. The proxy for infrastructure is the number of broadbandInternet subscribers with a digital subscriber line, cable modem, or other high-speed tech-nology (per 100 persons).
There are two conditions for an instrument to work well. First, it must be valid, theinstrument must be uncorrelated with the error term. Second, it must be powerful, i.e.,the instrument must be sufficiently correlated to the endogenous variable.
Our instruments are valid if domestic employment is not related to the instrumentsother than through foreign direct investment, conditional on other multinational firm’s(MNC) characteristics. While we consider this assumption to be plausible, GDP percapita could still influence MNCs’ employment through trade. However, the Hanson-Jstatistic shows that the test of over-identifying restrictions cannot reject its null hypothesis:the instruments are distributed independently of the error process and they are properlyexcluded from the model.44.
We then test to ensure that our instruments are not weak, i.e., that they are sufficientlycorrelated with the endogenous variables included. In each case, the F statistic is suffi-ciently large,45 compared to Stock and Yogo critical value with two endogenous regressors(Stock and Yogo 2002)46.
Table 8 reports results of the IV-GMM estimator. It analyzes the effect of FDI tolow-income and high-income countries on the share of skilled managers (column (1)) andskilled and unskilled blue-collar workers (column (2)), and on the task index (columns (3)to (7)). Results of the first stage estimates are discussed in appendix F.
When controlling for endogeneity, the positive correlation between FDI to low-incomecountries and the share of managers in the domestic firm is stable and significant at the5% level. Turning to the results on the composition of tasks executed inside the firm,we notice that FDI to low-income countries significantly and positively affects the shareof workers performing intensively interactive tasks, at the 5% level. However, resultson routine and non-routine manual tasks are non-significant, whatever the host country.Hence, the IV-GMM results confirm our previous findings and show that investing in low-income countries raises significantly the share of managers and skilled non-routine tasks.However, when controlling for endogeneity, the negative correlation between blue-collarworkers and FDI to low-income countries is not significantly different to zero (still, thesign of the coefficient remains negative).
44Over identification tests are based on the assumption that one of the instruments is valid. We havetherefore decided to report the IV results in a just-identified equation, by using GDP per capita on the onehand, and the level of infrastructure on the other hand. The results are reported in the online appendixand depict similar findings. In both cases the instruments are sufficiently strong. We prefer to report theover-identified results to prove the validity of our instruments.
45We use the Kleibergen-Paap rk statistic F statistic, as we do not assume i.i.d errors.46In each case, the F statistic also exceeds the conventional ’rule of thumb’ of the minimum standard of
power of F=10. However, as we have multiple endogenous variables, this indicator may not be sufficientlyinformative (Baum et al, 2003). In this respect, the use of the Shea Partial R2 is preferable, as it accountsfor the inter-correlations among the instruments. The Shea measure is always close to the partial R2. Wetherefore conclude that our instruments are relevant.
22

Table 8: IV-Results
Managers Blue-Collar Routine Non-routine Non-routine Non-routine Routineworkers manual manual interactive analytic Cognitive
Subsidiaries inLow-income countries 0.019** -0.005 0.003 0.009 0.020** 0.011 0.012
[0.008] [0.007] [0.008] [0.009] [0.009] [0.008] [0.008]High-income countries -0.003 -0.004 -0.008 -0.010 0.003 0.001 0.010
[0.004] [0.004] [0.007] [0.007] [0.008] [0.006] [0.006]First Stage Estimates (low income)
High-income GDP per capita -0.026*** -0.026*** -0.025*** -0.025*** -0.025*** -0.025*** -0.025***[0.009] [0.009] [0.009] [0.009] [0.009] [0.009] [0.009]
Low-income GDP per capita 0.061*** 0.061*** 0.061*** 0.061*** 0.061*** 0.061*** 0.061***[0.007] [0.007] [0.007] [0.007] [0.007] [0.007] [0.007]
High-income infrastructure 0.029 0.029 0.031 0.031 0.031 0.031 0.031[0.023] [0.023] [0.022] [0.022] [0.022] [0.022] [0.022]
Low-income infrastructure 0.087*** 0.087*** 0.084*** 0.084*** 0.084*** 0.084*** 0.084***[0.027] [0.027] [0.027] [0.027] [0.027] [0.027] [0.027]
First Stage Estimates (high income)
High-income GDP per capita 0.027** 0.027** 0.027** 0.027** 0.027** 0.027** 0.027**[0.011] [0.011] [0.012] [0.012] [0.012] [0.012] [0.012]
Low-income GDP per capita 0.012** 0.012** 0.011** 0.011** 0.011** 0.011** 0.011**[0.004] [0.004] [0.004] [0.004] [0.004] [0.004] [0.004]
High-income infrastructure 0.123*** 0.123*** 0.124*** 0.124*** 0.124*** 0.124*** 0.124***[0.033] [0.033] [0.033] [0.033] [0.033] [0.033] [0.033]
Low-income infrastructure -0.022 -0.022 -0.020 -0.020 -0.020 -0.020 -0.020[0.015] [0.015] [0.014] [0.014] [0.014] [0.014] [0.014]
Subsidiaries in France -0.002 0.000 -0.005 -0.010** -0.002 -0.002 -0.001[0.003] [0.004] [0.005] [0.004] [0.005] [0.004] [0.004]
Exports -0.000 0.001 -0.001 -0.001** -0.000 -0.001 -0.000[0.000] [0.000] [0.001] [0.001] [0.001] [0.001] [0.001]
Revenue 0.007** -0.012*** 0.004 0.003 0.007 0.004 0.001[0.004] [0.005] [0.006] [0.005] [0.005] [0.005] [0.005]
Capital -0.001 0.002 -0.002 0.004** 0.004** 0.005*** 0.001[0.001] [0.002] [0.002] [0.002] [0.002] [0.002] [0.002]
Technology Frontier 0.001 -0.000 -0.001 -0.002 -0.002 -0.002* -0.001[0.001] [0.001] [0.001] [0.001] [0.001] [0.001] [0.001]
Observations 17,474 17,474 16,981 16,981 16,981 16,981 16,981R-squared 0.038 0.024 0.002 0.025 0.041 0.033 0.025
Under-identificationKeibergen-Paap LM stat 127.772*** 127.772*** 130.398*** 130.398*** 130.398*** 130.398*** 130.398***
Weak indentificationKleibergen-Paap rk-stat 115,433 115,433 122,974 122,974 122,974 122,974 122,974Stock-Yogo 5% max IV bias 11.04 11.04 11.04 11.04 11.04 11.04 11.04
Over-identificationHansen J statistic 0.914 3.016 1.620 0.137 6.678 3.498 2.100P-value 0.633 0.2214 0.445 0.934 0.035 0.174 0.350
Source: LIFI survey, French annual census for manufacturing (EAE), French Déclaration annuelles des donnés sociales (DADS); period 2002-2007. Note:Estimations are for firm fixed effects (FE) and variables are calculated at the level of the firm. The wage-bill shares are in percent, varying between zeroand 100.
7 ConclusionThis paper shows that foreign direct investment has a real impact on the composition
of skills and tasks in the case of French manufacturing firms. Carrying out this type ofanalysis however requires access to available employer-employee specific data as well asinformation on job-related task requirements.
We use a detailed database for France to be able to observe the work composition of
23

French firms employing more than 20 employees, both in terms of skills and tasks. Theresults highlight the necessity of using detailed micro data to identify the jobs at risk fromFDI. Aggregate groups of occupations are not able to disentangle the real effect of outwardFDI on occupations and tasks.
The limitation of the study stems from the use of data reflecting the number of foreignsubsidiaries without taking into account other strategies of the international fragmentationof production processes (such as outsourcing). This approach is suitable for horizontaloffshoring which, by and large, takes place through FDI. However, vertical offshoring isprobably under-estimated when based on data from subsidiaries, since offshoring oftenpasses through international subcontracting. In order to control for the omitted variablebias, we use two original instruments and run an IV model.
The results show that, when controlling for the relevant variables, FDI in low-incomecountries impacts negatively on a firm’s share of blue-collar workers and positively affectsa firm’s share of managers (particularly when offshoring occurs to the BRICS). On theother hand, horizontal FDI in developed countries removes the incentive for employingskilled production workers, who hold manual, non-routine tasks in manufacturing produc-tion. These results indicate a clear substitutablility between manual workers and offshoredworkers, and a clear complementarity with skilled managers, in the home country. Inter-estingly, we notice a positive effect of FDI to Central and East European countries on theshare of routine manual tasks. This result is driven by intermediate goods industries, andreflects French firms’ strategies of producing intermediate goods in Eastern Europe andto assemble final products in France. Increased assembly activity in France (in particularin the North of France) raises the incentive to hire manual workers.
Furthermore, we show that the rise of the share of managers consecutive to FDI isparticularly marked in the sample of first-time investors, whereas the declining demandof blue-collar workers consecutive to FDI is observed when already established firms raisetheir number of foreign subsidiaries. Hence, becoming a multinational company changesthe workforce composition in favor of managers and the intensification of vertical offshoringresults in a decline of unskilled jobs and routine tasks.
In short, we highlight an overall positive effect of offshoring to low-income countries,especially to the BRICS; but the positive effect is concentrated on skilled workers, whosework is intensive in non-routine interactive tasks. In contrast, the data reveal that thepotential jobs at risk from FDI are for: i) skilled production workers performing non-routine manual tasks when FDI occurs in high-wage countries; and ii) unskilled productionworkers when FDI occurs in low-wage countries.
The IV-model show a positive effect of FDI to low-income countries on the share ofskilled executives and skilled non-routine tasks in the domestic firm. However, the negativeeffect on the share of blue-collar workers is no longer observed. We are thus more cautiousabout the interpretation of the negative effect of FDI to low-income countries on the shareof blue-collar workers.
ReferencesAbraham, F., J. Konings, and V. Slootmaekers. 2010. “FDI Spillovers, firm heterogeneity
and degree of ownership: evidence from Chinese manufacturing.” Technical Report,Katholieke Universiteit Leuven.
24

Acemoglu, D., and D. Autor. 2011a. Skills, Tasks and Technologies: Implications forEmployment and Earnings. Volume 4 of Handbook of Labor Economics. Edited byO. Ashenfelter and D. Card. Elsevier.
. 2011b. “Skills, Tasks and Technologies: Implications for Employment andEarnings.”
Allain, B., J. Collobert, and S. Fraboul. 2004. “Emplois exposés en Pays de la Loire :une nouvelle approche.” Insee Pays de la Loire. Etudes, no. 24.
Almeida, R. 2007. “The labor market effects of foreign owned firms.” Journal of Inter-national Economics 72 (1): 75–96.
Anderton, B., and P. Brenton. 1999. “Outsourcing and low-skilled workers in the UK.”Bulletin of Economic Research 51 (4): 267–286.
Antràs, P. 2003. “Firms, Contracts, And Trade Structure.” The Quarterly Journal ofEconomics 118 (4): 1375–1418.
. 2005. “Incomplete contracts and the product cycle.” The American economicreview 95 (4): 1054–1073.
Antras, p., and Elhanan H. 2004. “Global Sourcing.” Journal of Political Economy 112(3): 552–580 (June).
Autor, D., D. Dorn, G. H. Hanson, and J. Song. 2013, July. “Trade Adjustment: WorkerLevel Evidence.” Nber working papers 19226, National Bureau of Economic Research,Inc.
Autor, D., F. Levy, and R. Murnane. 2003. “The Skill Content of Recent TechnologicalChange: An Empirical Exploration.” Quarterly Journal of Economics 118 (4): 1279–1333 (November).
Barba Navaretti, G., D. Castellani, and A-C. Disdier. 2010. “How does investing in cheaplabour countries affect performance at home? Firm-level evidence from France andItaly.” Oxford Economic Papers 62 (2): 234–260.
Baum, C., M. Schaffer, and S. Stillman. 2002, November. “Instrumental variables andGMM: Estimation and testing.” Boston college working papers in economics 545,Boston College Department of Economics.
. 2007, May. “Enhanced routines for instrumental variables/GMM estimation andtesting.” Boston college working papers in economics 667, Boston College Departmentof Economics.
Becker, S. O, K. Ekholm, and M-A Muendler. 2012. “Offshoring and the onshore com-position of tasks and skills.” Journal of International Economics.
Bénassy-Quéré, A., M. Coupet, and T. Mayer. 2007. “Institutional determinants offoreign direct investment.” The World Economy 30 (5): 764–782.
Berle, A., and G. Means. 1932. The Modern Corporation and Private Property.Bernard, A., J. B Jensen, and P K. Schott. 2009. “Importers, Exporters and Multination-
als: A Portrait of Firms in the U.S. that Trade Goods.” In Producer Dynamics: NewEvidence from Micro Data, NBER Chapters, 513–552. National Bureau of EconomicResearch, Inc.
Biscourp, P., and F. Kramarz. 2007. “Employment, skill structure and internationaltrade: Firm-level evidence for France.” Journal of International Economics 72 (1):22–51 (05).
25

Blinder, A. S, and A. B Krueger. 2013. “Alternative measures of offshorability: a surveyapproach.” Journal of Labor Economics 31 (2 Part 2): S97–S128.
Blinder, A S. 2009. “How many US jobs might be offshorable?” World Economics 10(2): 41.
Blonigen, B A., L. Fontagné, N. Sly, and F. Toubal. 2012, September. “Cherries for Sale:Export Networks and the Incidence of Cross-Border M&A.” Nber working papers,National Bureau of Economic Research, Inc.
Blundell, R., and S. Bond. 2000. “GMM estimation with persistent panel data: anapplication to production functions.” Econometric reviews 19 (3): 321–340.
Brainard, S. L., and D. A. Riker. 1997, March. “Are U.S. Multinationals Exporting U.S.Jobs?” Nber working papers 5958, National Bureau of Economic Research, Inc.
Brouthers, K. D, and L E Brouthers. 2001. “Explaining the national cultural distanceparadox.” Journal of International Business Studies 32 (1): 177–189.
Conconi, P., A. Sapir, and M. Zanardi. 2013, February. “The Internationalization Processof Firms: from Exports to FDI.” Cepr discussion papers 9332, C.E.P.R. DiscussionPapers.
Crino, R. 2009. “Offshoring, Multinationals And Labour Market: A Review Of TheEmpirical Literature.” Journal of Economic Surveys 23 (2): 197–249 (04).
Cuyvers, L., M. Dumont, G. Rayp, and K. Stevens. 2005. “Home Employment Effects ofEU Firms Activities in Central and Eastern European Countries.” Open EconomiesReview 16 (2): 153–174 (April).
Demsetz, Harold, and Kenneth Lehn. 1985. “The structure of corporate ownership:Causes and consequences.” The Journal of Political Economy, pp. 1155–1177.
Dewit, G., H. Görg, and C. Montagna. 2009. “Should I stay or should I go? Foreigndirect investment, employment protection and domestic anchorage.” Review of WorldEconomics (Weltwirtschaftliches Archiv) 145 (1): 93–110 (April).
Ebenstein, A., A. Harrison, M. McMillan, and S. Phillips. 2009. “Estimating the impactof trade and offshoring on American workers using the current population surveys.”Review of Economics and Statistics.
Ekholm, K, and K. Hakkala. 2005, Dec. “The Effect of Offshoring on Labor Demand:Evidence from Sweden.” Working paper series 654, Research Institute of IndustrialEconomics.
Falk, M., and B. Koebel. 2002. “Outsourcing, Imports and Labour Demand.” Scandina-vian Journal of Economics 104 (4): 567–86 (December).
Falk, M., and Y. Wolfmayr. 2008, June. “The Impact of Outward FDI in Central andEastern Europe on Employment in the EU-15 Countries.” Fiw research reports seriesI-016, FIW.
Feenstra, R., and G. Hanson. 1996. “Globalization, outsourcing and wage inequality.”american economic review 86:240–245.
. 1999. “Producctivity Measurement and the Impact of Trade and Technology onWages: Estimates for rhe US, 1972-1990.” Quaterly Journal of Economics 3 (114):907–940 (august).
Feenstra, R. C, and G H Hanson. 2005. “Ownership and Control in Outsourcing toChina: Estimating the Property-Rights Theory of the Firm.” The Quarterly Journalof Economics 120 (2): 729–761.
26

Fontagne, L., and T. Mayer. 2005. Applied Economics Quarterly 51:9–34.Gamberoni, E., R. Lanz, and R. Piermartini. 2010, November. “Timeliness and contract
enforceability in intermediate goods trade.” Policy research working paper series 5482,The World Bank.
Gatignon, H., and E. Anderson. 1988. “The multinational corporation’s degree of controlover foreign subsidiaries: An empirical test of a transaction cost explanation.” Journalof Law, Economics, & Organization, pp. 305–336.
Gazaniol, A. 2012, April. “The impact of outward FDI on the domestic perimeter of man-ufacturing groups.” Working papers DT/2012/03, DIAL (Développement, Institutionset Mondialisation).
Gazaniol, A., and F. Peltrault. 2013. “Outward FDI, performance and group affiliation:evidence from French matched firms.” Economics Bulletin 33 (2): 891–904.
Goos, M., A. Manning, and A. Salomons. 2009. “Job polarization in Europe.” TheAmerican Economic Review 99 (2): 58–63.
Grossman, G. M, and E. Helpman. 2002. “Integration versus Outsourcing in IndustryEquilibrium*.” The Quarterly journal of economics 117 (1): 85–120.
. 2005. “Outsourcing in a global economy.” The Review of Economic Studies 72(1): 135–159.
Grossman, G. M, and E. Rossi-Hansberg. 2008. “Trading tasks: A simple theory ofoffshoring.” American Economic Review 98 (5): 1978.
Grossman, G M., E. Helpman, and A. Szeidl. 2006. “Optimal integration strategiesfor the multinational firm.” Journal of International Economics 70 (1): 216–238(September).
Grover, A. 2008. “Vertical FDI versus Outsourcing: A Welfare Comparison from thePerspective of the Host Country.” Technical Report, DEGIT, Dynamics, EconomicGrowth, and International Trade.
Hakkala Nilsson, K., F. Heyman, and F. Sjöholm. 2014. “Multinational firms, acquisitionsand job tasks.” European Economic Review 66 (C): 248–265.
Hakkala Nilsson, K., and K. Huttunen. 2014. “Displacing Tasks: Understanding theEmployment Effects of Offshoring.”
Hansson, P. 2000. “Relative demands for skilled in Swedish manufacturing: Technologyor trade?” Review of International Economics 8 (3): 533–555.
. 2005. “Skill Upgrading and Production Transfer within Swedish Multinationals.”Scandinavian Journal of Economics 107 (4): 673–692 (December).
Head, K., and J. Ries. 2002. “Offshore production and skill upgrading by Japanesemanufacturing firms.” Journal of international economics 58 (1): 81–105.
Helpman, E., M. Melitz, and S. R. Yeaple. 2004. “Export Versus FDI with HeterogeneousFirms.” American Economic Review 94 (1): 300–316 (March).
Hijzen, A., H. Görg, and R C Hine. 2005. “International Outsourcing and the SkillStructure of Labour Demand in the United Kingdom*.” The Economic Journal 115(506): 860–878.
Hijzen, A., H. Görg, and R C. Hine. 2005. “International Outsourcing and the SkillStructure of Labour Demand in the United Kingdom.” Economic Journal 115 (506):860–878 (October).
27

Hijzen, A., S. Jean, and T. Mayer. 2011. “The effects at home of initiating produc-tion abroad: evidence from matched French firms.” Review of World Economics(Weltwirtschaftliches Archiv) 147 (3): 457–483 (September).
Hummels, D., R. Jørgensen, J. Munch, and C. Xiang. 2011, October. “The Wage Effectsof Offshoring: Evidence from Danish Matched Worker-Firm Data.” Nber workingpapers 17496, National Bureau of Economic Research, Inc.
Huttunen, K. 2007. “The effect of foreign acquisition on employment and wages: Evidencefrom Finnish establishments.” The Review of Economics and Statistics 89 (3): 497–509.
Javorcik, B. S, and S-J. Wei. 2009. “Corruption and cross-border investment in emergingmarkets: Firm-level evidence.” Journal of International Money and Finance 28 (4):605–624.
Jensen, J. B, and L. G. Kletzer. 2010, 09. “Measuring Tradable Services and the TaskContent of Offshorable Services Jobs.” In Labor in the New Economy, NBER Chapters,309–335. National Bureau of Economic Research, Inc.
Johanson, J., and J-E. Vahlne. 1977. “The internationalization process of the firm-a modelof knowledge development and increasing foreign market commitments.” Journal ofinternational business studies, pp. 23–32.
Klug, M. 2006. “Market Entry Strategies in Eastern Europe in the Context of theEuropean Union.” Wiesbaden: Deutcher Universitats-Verlag.
Kohler, W. 2002, April. “The Distributional Effects of International Fragmentation.”Economics working papers, Johannes Kepler University Linz.
Konings, J., and A. Murphy. 2006. “Do multinational enterprises relocate employmentto low-wage regions? Evidence from European multinationals.” Review of WorldEconomics 142 (2): 267–286.
Kramarz, F. 2008. “Offshoring, Wages, and Employment: Evidence from data matchingimports, firms, and workers.” Technical Report, CREST-INSEE.
Kroeger, S. 2013. “The Contribution of Offshoring to the Convexification of the US WageDistribution.”
Krugman, P. 2008. “Trade and Wages, Reconsidered.” Brookings Papers on EconomicActivity 39 (1): 103–154.
Mansfield, Edwin, and Anthony Romeo. 1980. “Technology transfer to overseas sub-sidiaries by US-based firms.” The Quarterly Journal of Economics, pp. 737–750.
Markusen, J.R. 1995. “The Boundaries of Multinational Enterprises and the Theory ofInternational Trade.” Journal of Economic Perspectives 9 (2): 169–89 (Spring).
Martínez-Zarzoso, I., A. Voicu, and M. Vidovic. 2011. “CEECs integration into regionaland global production networks.” Technical Report.
Moati, P., and E M Mouhoud. 2005. “Les nouvelles logiques de décomposition interna-tionale des processus productifs.” Revue d’économie politique 0 (5): 573–589.
Moran, T. 2001. “Parental Supervision: The New Paradigm for Foreign Direct Investmentand Development.” Technical Report, Washington DC: Institute for InternationalEconomics.
Morrison, C., and D. Siegel. 2001. “The Impacts of Technology, Trade and Outsourcingon Employment and Labor Composition.” Scandinavian Journal of Economics 103(2): 241–64 (June).
28

Nunnenkamp, P., and M S Andrés. 2013, May. “Ownership Choices of Indian DirectInvestors: Do FDI Determinants Differ between Joint Ventures and Wholly-ownedSubsidiaries?” Kiel working papers, kiel institute for the world economy 1841, KielInstitute for the World Economy.
Oldenski, L. 2012. “The Task Composition of Offshoring by U.S. Multinationals.”Economie Internationale, no. 131:5–21.
Peri, G., and J. Poole. 2013. “Offshoring and Firm-Level Task composition: Is there agender component?” Technical Report, Working paper.
Riker, D., and S. Brainard. 1997, Mar. “U.S. Multinationals and Competition from LowWage Countries.” Nber working papers 5959, National Bureau of Economic Research,Inc.
Scott, J. 1990. “Corporate control and corporate rule: Britain in an internationalperspective.” British journal of sociology, pp. 351–373.
Slaughter, M J. 2000. “Production transfer within multinational enterprises and Ameri-can wages.” Journal of International Economics 50 (2): 449–472 (April).
Smarzynska-Javorcik, B., and M. Spatareanu. 2008. “To share or not to share: Doeslocal participation matter for spillovers from foreign direct investment?” Journal ofDevelopment Economics 85 (1-2): 194–217 (February).
Spitz-Oener, A. 2006. “Technical Change, Job Tasks and Rising Educational Demands:Looking Outside the Wage Structure.” Journal of Labor Economics 24 (2): 235–270.
Stiegert, K. W, A. Ardalan, and T L. Marsh. 2006. “Foreign-Market Entry Strategies inthe European Union.” Journal of Food Distribution Research 37, no. 03.
Stock, J.H, and M. Yogo. 2002, November. “Testing for Weak Instruments in LinearIV Regression.” Nber technical working papers 0284, National Bureau of EconomicResearch, Inc.
Strauss-Kahn, V. 2004. “The Role of Globalization in the Within-Industry Shift Awayfrom Unskilled Workers in France.” In Challenges to Globalization: Analyzing theEconomics, NBER Chapters, 209–234. National Bureau of Economic Research, Inc.
Topiol, A., and C. Héricher. 2013. “Les groupes français à l’étranger En 2010, 4,7 millionsde salariés dont près de 2 millions dans l?industrie.” Insee Première, no. 1439 (march).
Vermeulen, E P. 2013. “Beneficial Ownership and Control: A Comparative Study-Disclosure, Information and Enforcement.” Technical Report, OECD Publishing.
Yeats, A. 1998, January. “Just how big is global production sharing?” Policy researchworking paper series 1871, The World Bank.
29

A Robustness TestsThe following section gives results of equation 3 by using different measures of off-
shoring. We define three other measures of FDI.
The first proxy is constructed by taking into account the possibility that a firm uses itsblocking minority power.47 The underlying idea for using blocking minority as a weightedmeasure is to assuming increasing control over the foreign subsidiary when the firm hasthe possibility to veto certain decisions at extraordinary general meetings of shareholders.The investing firm could thus have incentives to actively manage employment inside thesubsidiary and to transfer its intangible assets.
The measure is built as follows:
ρjt =∑k
subsidiarykjt (6)
Where{subsidiarykjt = 1, when V otingkjt ≥ 34%subsidiarykjt = V otingkjt, when V otingkjt < 34%
Here, we assume that when a firm owns more than 34% of the voting stock, thenthe firm has a blocking minority and can intervene in important decisions concerning itssubsidiary. Therefore the firm owns the subsidiary entirely, and the number of FDI projectsis equal to 1. If the firm does not hold a blocking minority, then we do not consider thatthe firm holds the entire subsidiary, but only holds the subsidiary weighted by the votingstock.
The ρmeasure controls for the blocking minority, but has the disadvantage of overridingthe existing hierarchy when votes are held.
We also control our results by using a second proxy of a firm’s FDI size, by weightingthe firm’s number of subsidiaries by firm j’s average outward investment stock.48 Thethird measure is constructed as follows:
ϕjt =∑k
V aluekjt (7)
Where V aluekjt is the balance sheet value of firm j’s subsidiary k at time t. However,information on the gross value of investment purchased in each subsidiary is not availableprior to 2004. As it is a stock value, the average over a 4-year period gives a good proxy of afirm’s mean size of foreign investments. We first measure the number of foreign subsidiariescontrolled by each firm j over the period t ∈ [2002, 2007]. We weight this number by thefirm j’s mean outward investment stock amount over the period 2004-2007.
However, the measure ϕ does not account for all multinational companies, since infor-mation on subsidiaries’ stock amounts are not referenced for each subsidiary in the LIFIsurvey.
47A blocking minority represents one quarter or one third of the shares plus one share, depending on thecountry and the legal form of the company.
48This corresponds to the gross value of shares owned in the foreign subsidiary, in thousands of euros.This measure corresponds to a book value and does not reflect the market value of the firm. The amountis identified in euros. Therefore, we deflate this nominal value by using the CPI base 2005, provided byINSEE
30

Finally, we use the number of subsidiaries abroad without weights (we call this δ).
The measure κ is preferred for different reasons. First, it allows the effect of a changein the share of voting stock held in a foreign subsidiary to be captured, even if the firmdoes not change its number of foreign subsidiaries. Several studies have highlighted theimpact of control over wages and employment (see Bircan (2011) for a review). Second, itallows control for multiple authority sources in a group. Indeed, if two French subsidiariesinside a domestic group control the same subsidiary abroad, it allows firm holdings witha clear majority to be distinguished.
Tables 9 and 10 report results with the different measures of FDI on the share ofexecutives and blue-collar workers respectively. Columns (1) and (7) report the resultswith the measure of offshoring κ. Columns (2) and (8) report the results with the measureof offshoring ρ. Columns (3) and (9) report the results with the measure ϕ. Columns (4)and (10) report the result with the measure of offshoring δ. Columns (5) and (11) reportthe results with the measure of offshoring κ, and include the variables on the wages paidby type of work i relative to the composite wage of work type not in i. Whatever theproxy retained, the preceding conclusions are not altered.
Table 9: Robustness Test with Different Measures of Offshoring (Executives)
Executives(1) (2) (3) (4) (5) (6)
VARIABLES κ ρ ϕ δ κ κ
Subsidiaries inLI countries 0.015*** 0.015*** 0.003*** 0.013** 0.018*** 0.016***
[0.006] [0.006] [0.001] [0.005] [0.006] [0.006]HI countries 0.002 -0.002 0.002 -0.001 0.001 -0.001
[0.008] [0.004] [0.003] [0.004] [0.008] [0.008]France -0.002 0.002 -0.000 -0.002 -0.002 -0.001
[0.002] [0.003] [0.001] [0.002] [0.003] [0.002]Technology Frontier 0.001 0.001 0.001 0.001 0.000 0.000
[0.001] [0.001] [0.001] [0.001] [0.001] [0.001]Export -0.000 -0.000 -0.000 -0.000 -0.000 -0.000
[0.000] [0.000] [0.000] [0.000] [0.000] [0.000]Revenue 0.007** 0.007* 0.007** 0.007* 0.008** 0.007*
[0.004] [0.004] [0.003] [0.004] [0.004] [0.003]Capital -0.000 -0.001 -0.000 -0.001 -0.001 -0.000
[0.001] [0.001] [0.001] [0.001] [0.002] [0.001]wij/w−ij 0.005***
[0.001]Nationality 0.006***
[0.002]Constant 0.101*** 0.101*** 0.117*** 0.101*** 0.091*** 0.099***
[0.020] [0.020] [0.042] [0.020] [0.021] [0.021]
Observations 18,729 18,729 16,494 18,729 16,160 16,228R-squared 0.039 0.039 0.039 0.038 0.040 0.094
Number of codesiren 6,474 6,474 5,740 6,474 6,279 6,108Log Likelihood 44778.877 44780.333 39959.054 44780.333 41664.506 39956.032
Source: LIFI survey, French annual census for manufacturing (EAE), French Déclaration annuelles des données sociales(DADS); period 2002-2007. Note: Estimations are for firm fixed effects (FE), and variables are calculated at the levelof the firm. The wage-bill shares are in percent, varying between zero and 100.
31

Table 10: Robustness Test with Different Measures of Offshoring (Blue-CollarWorkers)
Blue-collar workers(7) (8) (9) (10) (11) (12)
VARIABLES κ ρ ϕ δ κ κ
Subsidiaries inLI countries -0.008* -0.009* -0.003*** -0.006* -0.007 -0.008*
[0.005] [0.005] [0.001] [0.003] [0.005] [0.005]HI countries -0.008 -0.002 0.000 -0.002 -0.005 -0.007
[0.008] [0.004] [0.002] [0.004] [0.006] [0.007]France -0.001 -0.001 0.000 -0.000 -0.001 -0.001
[0.004] [0.004] [0.001] [0.003] [0.003] [0.004]Technology Frontier -0.000 -0.000 -0.000 -0.000 -0.001 -0.001
[0.001] [0.001] [0.001] [0.001] [0.001] [0.001]Export 0.001 0.001 -0.000 0.001 0.001* 0.001
[0.000] [0.000] [0.000] [0.000] [0.000] [0.000]Revenue -0.012*** -0.012*** -0.014*** -0.012*** -0.012*** -0.012***
[0.005] [0.005] [0.005] [0.005] [0.005] [0.003]Capital 0.002 0.002 0.003 0.002 0.003 0.002
[0.002] [0.002] [0.002] [0.002] [0.002] [0.002]wij/w−ij 0.032***
[0.004]Nationality -0.001
[0.003]Constant 0.625*** 0.625*** 0.661*** 0.624*** 0.603*** 0.624***
[0.025] [0.025] [0.056] [0.025] [0.026] [0.025]
Observations 18,729 18,729 16,494 18,729 17,160 16,228R-squared 0.025 0.025 0.027 0.038 0.036 0.102
Number of codesiren 6,474 6,474 5,740 6,279 6,474 6,474Log Likelihood 38956.014 38957.012 39959.054 36566.231 38957.012 39959.054
Source: LIFI survey, French annual census for manufacturing (EAE), French Déclaration annuelles des données sociales(DADS); period 2002-2007. Note: Estimations are for firm fixed effects (FE), and variables are calculated at the levelof the firm. The wage-bill shares are in percent, varying between zero and 100.
Columns (6) and (12) report the results with the measure of offshoring κ, by includingthe variable of parent company nationality. We add a dummy that takes the value of 1 if afirm is controlled by a foreign parent company, and 0 otherwise. The coefficient associatedwith this dummy is identified for firms that changed nationality in the sample period.The inclusion of the firm’s nationality does not alter the conclusions. FDI to low-incomecountries is significantly associated with a higher share of executives employees, and isassociated with a lower share of blue-collar workers.49
Finally, we report the results when controlling for the FDI strategy at the group level(see Table 11). The results are consistent with those obtained by taking into accountthe relocation strategy at the firm level. A group’s number of subsidiaries in low-incomecountries raises the share of executives inside domestic firms and reduces the share of blue-collar workers. Relocation in high-income countries does not show any significant impacton either types of jobs and tasks. However, contrary to results at the firm level, whenthe group raises its FDI in low-income countries, manual non-routine tasks are negatively
49We highlight a positive coefficient associated with change in a firm’s nationality on the share of ex-ecutives. We interpret the positive coefficient as a positive correlation between high-skilled firms andforeign-acquisition, reflecting the fact that foreign-owned firms are on average more skills-intensive thanFrench-owned firms. Theories of ownership have shown that acquisition can result in a reduction of em-ployment, because takeovers are a good way for shareholders to get rid of non-value-maximizing managers(Huttunen (2007)). However, changes in employment are likely to take time, because of attendant adjust-ment costs.
32

affected. The reason is certainly due to an overall effect on the rationalization of productionprocesses by eliminating unnecessary domestic capacity at the group level. Indeed, whenthe group increases FDI to low-income countries it may decide to reduce the employmentof blue-collar workers in dedicated subsidiaries, even those that are not directly engagedin outward FDI.
Table 11: International Strategies at the Group Level
Executive Blue-collar Routine Non-routine Non-routine Non-routine RoutineVARIABLES workers manual manual interactive analytic cognitive
(1) (2) (3) (4) (5) (6) (7)
Subsidiaries inHI countries -0.002 0.001 0.000 0.000 -0.002 -0.002 -0.003
[0.002] [0.002] [0.003] [0.003] [0.003] [0.003] [0.003]LI countries 0.004* -0.004* -0.002 -0.005* 0.001 -0.001 0.002
[0.002] [0.002] [0.003] [0.003] [0.003] [0.003] [0.003]France -0.001 0.000 0.001 0.002 0.000 0.001 0.000
[0.001] [0.001] [0.002] [0.002] [0.002] [0.002] [0.002]Exports -0.000 0.001 -0.001 -0.001** -0.000 -0.001 -0.000
[0.000] [0.000] [0.001] [0.001] [0.001] [0.001] [0.001]Revenue 0.007** -0.012*** 0.004 0.002 0.007 0.004 0.001
[0.004] [0.005] [0.006] [0.005] [0.005] [0.005] [0.005]Capital -0.001 0.002 -0.002 0.003* 0.004** 0.005*** 0.001
[0.001] [0.002] [0.002] [0.002] [0.002] [0.002] [0.002]Technology Frontier 0.001 -0.000 -0.001 -0.002 -0.002 -0.002* -0.001
[0.001] [0.001] [0.001] [0.001] [0.001] [0.001] [0.001]Constant 0.102*** 0.626*** 0.444*** 0.497*** 0.381*** 0.573*** 0.573***
[0.020] [0.025] [0.031] [0.026] [0.028] [0.025] [0.024]
Observations 18,729 18,729 18,246 18,246 18,246 18,246 18,246R-squared 0.037 0.024 0.001 0.025 0.040 0.033 0.026
Log Likelihood 44769.763 38961.518 28782.137 32064.988 30790.877 32837.520 33190.064Source: LIFI survey, French annual census for manufacturing (EAE), French Déclaration annuelles des donnés sociales (DADS); period 2002-2007.Note: Estimations are firm fixed effects (FE) and variables are calculated at the level of the firm, except for the number of foreign subsidiarieswhich is calculated at the group level. The wage-bill shares are in percent, varying between zero and 100.
B The Composition of Tasks within OccupationsONET provides information on the characteristics of nearly 900 occupations in its
latest version. These characteristics are listed in seven broad categories: abilities, interests,knowledge, skills, work activities, work context, and work value. The ONET database iscomposed of different files. We focus on work activities which are closest to the notion oftask. To do so, we use the Generalized Work activity file. This file gives a score rankingfrom 0-100 for 41 different tasks, indicating the degree (or point along a continuum) towhich a particular descriptor is required or needed to perform the occupation. We dividethese tasks into the five major groups described above, and we normalize the index.
The following table lists the 41 main work activities. We choose to classify them intofive major categories as in ALM (2003). They distinguish between: i) non-routine ana-lytical tasks are usually performed in technical or managerial occupations. They requirecognitive capacity in which responsiveness, creativity, decision making and problem solv-ing are important. ii) The second major task category includes non-routine interactivetasks. These tasks require physical interaction and adaptability to certain types of situ-ations. iii) The third category identifies cognitive routine tasks that are usually carriedout by administrative or clerical occupations, such as secretaries and accounting officerswho perform repetitive tasks using an identified procedure. iv) Manual routine tasks are
33

performed by production operators such as handlers, machine operators, workers in pack-aging and transportation. These tasks can be seen as unskilled manual tasks. v) Finally,the last category lists manual tasks that require specific knowledge and are considered asskilled manual tasks. These tasks are mostly performed by technicians or foremen.
Table 12: Occupational Tasks
Non-routine Analytical Organizing, Planning, and Prioritizing Work; Getting Information; Analyzing Data or In-formation; Making Decisions and Solving Problems; Developing Objectives; Judging theQualities of Things, Services, or People; Updating and Using Relevant Knowledge; Inter-acting with Computers; Thinking Creatively; Estimating the Quantifiable Characteristicsof Products, Events, or Information; Evaluating Information to Determine Compliance withStandards; Scheduling Work and Activities; Interpreting the Meaning of Information forOthers; Processing Information and Strategies
Non-routine Interac-tive
Guiding, Directing, and Motivating Subordinates; Communicating with Supervisors, Peers,or Subordinates; Communicating with Persons Outside the Organization; Developing andBuilding Teams; Resolving Conflicts and Negotiating with Others; Performing for or Work-ing Directly with the Public; Staffing Organizational Units Providing Consultation andAdvice to Others; Coordinating the Work and Activities of Others; Selling or InfluencingOthers; Training and Teaching Others; Assisting and Caring for Others; Coaching and De-veloping Others; Establishing and Maintaining Interpersonal Relationships; Monitoring andControlling Resources
Routine Cognitive Performing Administrative Activities, Documenting/Recording InformationRoutine Manual Handling and Moving Objects; Performing General Physical Activities ; Repairing and
Maintaining Mechanical Equipment; Repairing and Maintaining Electronic EquipmentNon-routine Manual Operating Vehicles, Mechanized Devices, or Equipment; Inspecting Equipment, Structures,
or Material; Monitoring Processes, Materials, or Surroundings; Drafting, Laying Out, andSpecifying Technical Devices, Parts, and Equipment
Source: Constructed using data from O*NET as described in Section 3.1.2
The following table gives examples of different types of tasks performed in four mainoccupations in the metal industry. The index for these tasks is normalized. Here we seethat engineers have a higher score in making decision, whereas mechanics have the lowerscore. In contrast, skilled assemblers have a higher score in the task of handling andmoving objects compared to engineers.
Table 13: Examples in the Metal Industry
Making decisions Guiding, Communicating Performing Handling andTask Descriptions and solving directing with supervisors adminisrative moving
problems and motivating and motivating activities objectssubordinates subordinates
Engineers 0.741 0.589 0.731 0.608 0.421Technicians 0.59 0.373 0.638 0.388 0.708
Skilled assemblers 0.558 0.306 0.362 0.176 0.857Mechanics 0.375 0.171 0.329 0.256 0.838
Occupations in the metal industry, index values are normalized for each occupation. Sources: O*NET linked with EurOccupations.
Table 14 provides descriptive statistics, showing the mean intensity of each score forthe seven major occupations.
34

Table 14: Tasks’ Intensity within Occupations
Employees Managers Engineers Technicians Foremen Skilled Non-skilledblue-collar blue-collar
Non-routine analytical 0.40 0.72 0.79 0.67 0.61 0.42 0.34Non-routine interactive 0.34 0.62 0.56 0.42 0.62 0.29 0.25
Routine manual 0.34 0.19 0.35 0.47 0.50 0.69 0.70Non-routine manual 0.24 0.24 0.62 0.59 0.56 0.59 0.53Routine cognitive 0.51 0.75 0.74 0.66 0.63 0.41 0.33
Source: O*NET work activity normalized measure, merged with French PCS-ESE classifications using EurOccupation correspondencetables. Authors’ calculations.
It shows that skilled production workers (composed of skilled blue-collar workers, engi-neers, technicians and foremen) have an important index of non-routine manual, interactiveand analytical tasks. Managers and engineers are the two occupations having the highestscore of routine cognitive tasks, whereas skilled and unskilled blue-collar workers performroutine manual tasks more intensively.
C Description of VariablesWe report a detailed description of groups of occupations, set out in Subsections
5.1 to 5.4. We also refer to their French classification (PCS-ESE 2003), available at<http://www.insee.fr/>.
Table 15: Description of the Groups of Occupations
Major Occupations Code Major Qualification Code Detailed Occupations CodePCS-ESE PCS-ESE PCS-ESE
Executives Skilled Production WorkersLicensed professionals 31 Engineers 38 Technicians 47
Administrative managers 37 Technicians 47 Foremen 48Engineers 38 Foremen 48
IP Skilled handling BC workers 65 EmployeesFirm’s administrative IP 45 Industrial skilled BC workers 62 Firm’s administrative employees 54
Commercial administrative IP 46 Craft skilled BC workers 63 Commercial employees 55Technicians 47 Engineers 38
Foremen 48 Skilled non-production workers Managers 37Employees Administrative managers 37
Supervising officers 53 Firm’s administrative IP 45 Skilled BC workersFirm’s administrative employees 54 Commercial administrative IP 46 Skilled handling BC workers 65
Commercial employees 55 Industrial skilled BC workers 62BC workers Non-skilled production workers Craft skilled BC workers 63
Skilled handling BC workers 65 Industrial non-skilled BC workers 67Industrial skilled BC workers 62 Craft non-skilled BC workers 68 Non- skilled BC workers
Craft skilled BC workers 63 Industrial non-skilled BC workers 67Industrial non-skilled BC workers 67 Non-skilled non-production workers Craft non-skilled BC workers 68
Craft non-skilled BC workers 68 Supervising officers 53Agricultural BC workers 69 Firm’s administrative employees 54
Commercial employees 55
Note: The abbreviation ’IP’ stems from intermediate occupations and the abbreviation ’BC’ stems from blue-collar.
35

D Regression on Groups of Occupations
Table 16: Changes in the Share of Occupations by Production Groups
Model FE FE FE FE(1) (2) (3) (4)
Dependant variable Skilled Skilled Unskilled Unskilledproduction non-production production non-productionworkers workers workers workers
Subsidiaries inLow-income countries 0.003 0.006 -0.006 -0.003
[0.008] [0.005] [0.006] [0.003]High-income countries -0.017 0.003 0.015 -0.001
[0.012] [0.006] [0.010] [0.005]France -0.004 -0.000 0.002 0.002
[0.005] [0.003] [0.004] [0.002]Exports -0.001** -0.000 0.001*** -0.000
[0.001] [0.000] [0.000] [0.000]Revenue 0.003 0.007* -0.008* -0.003
[0.006] [0.004] [0.005] [0.002]Capital 0.007*** -0.002 -0.004** -0.001
[0.002] [0.001] [0.002] [0.001]Technology frontier 0.001 0.000 -0.001 -0.000
[0.001] [0.001] [0.001] [0.000]Constant 0.597*** 0.098*** 0.207*** 0.098***
[0.031] [0.023] [0.026] [0.015]
Observations 18,729 18,729 18,729 18,729R2 overall 0.000 0.015 0.015 0.019
Source: LIFI survey, French annual census for manufacturing (EAE), French Déclaration annuelles desdonnées sociales (DADS); period 2002-2007. Note: Estimations are of firm fixed effects (FE), and variablesare calculated at the level of the firm. The wage-bill shares are in percent, varying between zero and 100.
Table 17: Changes in the Share of Occupations by Occupational Groups
Model FE FE FE FE FE FE FE(1) (2) (3) (4) (5) (6) (7)
Skilled UnskilledDependant variable Managers Engineer blue-collars blue-collars Employees Technicians Foremen
Subsidiaries inLow-income countries 0.007** 0.006 -0.006 -0.013** 0.001 0.006 -0.002
[0.004] [0.004] [0.009] [0.006] [0.001] [0.004] [0.003]High-income countries -0.000 -0.000 -0.019 0.013 -0.001 0.007 0.001
[0.004] [0.005] [0.013] [0.011] [0.002] [0.005] [0.004]France 0.000 -0.002 -0.003 0.002 -0.000 0.003 0.001
[0.002] [0.002] [0.005] [0.004] [0.001] [0.003] [0.001]Exports -0.000 -0.000 -0.001 0.001** -0.000 -0.000 -0.000
[0.000] [0.000] [0.001] [0.001] [0.000] [0.000] [0.000]Revenue 0.008*** 0.014*** -0.008 -0.031*** 0.000 0.017*** -0.001
[0.002] [0.003] [0.006] [0.005] [0.001] [0.003] [0.002]Capital -0.000 0.002 0.006** -0.010*** -0.001* 0.002 0.001
[0.001] [0.001] [0.003] [0.002] [0.000] [0.001] [0.001]Technology frontier -0.000 0.001** 0.001 -0.002 0.000 0.000 -0.000
[0.000] [0.000] [0.001] [0.001] [0.000] [0.001] [0.000]Constant 0.008 0.014 0.478*** 0.380*** 0.005 0.064*** 0.052***
[0.010] [0.012] [0.025] [0.021] [0.004] [0.012] [0.007]
Observations 18,760 18,760 18,760 18,760 18,760 18,760 18,760R2 overall 0.032 0.067 0.020 0.006 0.000 0.024 0.121
Source: LIFI survey, French annual census for manufacturing (EAE), French Déclaration annuelles des donnés sociales (DADS); period 2002-2007. Note: Estimations are of firm fixed effects (FE) and variables are calculated at the level of the firm. The wage-bill shares are in percent,varying between zero and 100.
36

E Sector DecompositionTable 18 presents the average wage bill share for seven broad occupations per sector.
The consumer goods industries are relatively more intensive in administrative workers(managers and employees), while the capital and intermediate goods industries are moreintensive in skilled production workers (engineers, skilled blue-collars and technicians).The share of unskilled blue-collar workers and foremen are relatively similar in the threesectors.
Table 18: Decomposition of the Wage-Bill Share by Sector
Mean wage-bill share Consumer goods Capital goods Intermediate goods(in %) industries industries industries
Managers 12% 10% 11%Engineers 7% 16% 10%Skilled blue-collar workers 18% 26% 26%Unskilled blue-collar workers 11% 9% 14%Employees 3% 0.1% 0.5%Technicians 16% 22% 17%Foremen 2% 4% 4%
Source: LIFI survey, French annual census for manufacturing (EAE), French Déclaration annuelles desdonnés sociales (DADS); period 2002-2007.
The following tables present the results of the fixed effect model by dividing the sampleinto three main industry categories. Firms belonging to consumer goods industries arereported in Table 19. Firms belonging to intermediate goods industries are reported inTable 21. Finally, firms belonging to capital goods industries are reported in Table 20.20.82% of our sample are in the consumer goods industries, 23.69% are in capital goodsindustries and 50.99% are in the intermediate goods industries.
Table 19 shows no clear effect of offshoring on employment. Whereas Table 20 showsa positive effect of offshoring to low-income countries on the share of executives, and theshare of workers performing intensively cognitive and analytical tasks.
Interestingly, Table 20 shows that the negative bias towards manual workers whenoffshoring occurs in high-wage countries and is mainly driven by firms in capital goodsindustries, as described in Section 5.2. We also observe a positive association betweenoffshoring in high-income countries and the share of workers performing interactive tasks.This is similar to results obtained in Becker et al. (2012).
Table 21 shows a clear substitution between blue-collar workers and a complementaritybetween skilled executives and offshored employment in low-income countries. Similarresults were obtained for Sweden by Hanson (2005).
37
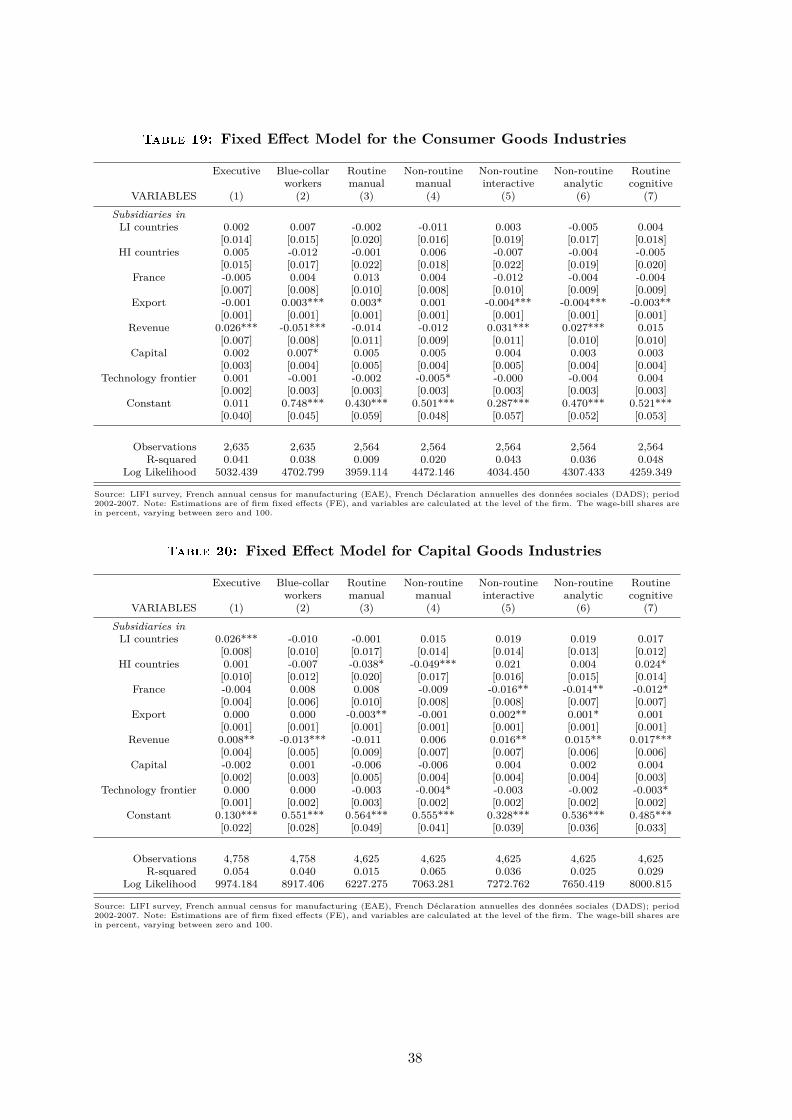
Table 19: Fixed Effect Model for the Consumer Goods Industries
Executive Blue-collar Routine Non-routine Non-routine Non-routine Routineworkers manual manual interactive analytic cognitive
VARIABLES (1) (2) (3) (4) (5) (6) (7)
Subsidiaries inLI countries 0.002 0.007 -0.002 -0.011 0.003 -0.005 0.004
[0.014] [0.015] [0.020] [0.016] [0.019] [0.017] [0.018]HI countries 0.005 -0.012 -0.001 0.006 -0.007 -0.004 -0.005
[0.015] [0.017] [0.022] [0.018] [0.022] [0.019] [0.020]France -0.005 0.004 0.013 0.004 -0.012 -0.004 -0.004
[0.007] [0.008] [0.010] [0.008] [0.010] [0.009] [0.009]Export -0.001 0.003*** 0.003* 0.001 -0.004*** -0.004*** -0.003**
[0.001] [0.001] [0.001] [0.001] [0.001] [0.001] [0.001]Revenue 0.026*** -0.051*** -0.014 -0.012 0.031*** 0.027*** 0.015
[0.007] [0.008] [0.011] [0.009] [0.011] [0.010] [0.010]Capital 0.002 0.007* 0.005 0.005 0.004 0.003 0.003
[0.003] [0.004] [0.005] [0.004] [0.005] [0.004] [0.004]Technology frontier 0.001 -0.001 -0.002 -0.005* -0.000 -0.004 0.004
[0.002] [0.003] [0.003] [0.003] [0.003] [0.003] [0.003]Constant 0.011 0.748*** 0.430*** 0.501*** 0.287*** 0.470*** 0.521***
[0.040] [0.045] [0.059] [0.048] [0.057] [0.052] [0.053]
Observations 2,635 2,635 2,564 2,564 2,564 2,564 2,564R-squared 0.041 0.038 0.009 0.020 0.043 0.036 0.048
Log Likelihood 5032.439 4702.799 3959.114 4472.146 4034.450 4307.433 4259.349
Source: LIFI survey, French annual census for manufacturing (EAE), French Déclaration annuelles des données sociales (DADS); period2002-2007. Note: Estimations are of firm fixed effects (FE), and variables are calculated at the level of the firm. The wage-bill shares arein percent, varying between zero and 100.
Table 20: Fixed Effect Model for Capital Goods Industries
Executive Blue-collar Routine Non-routine Non-routine Non-routine Routineworkers manual manual interactive analytic cognitive
VARIABLES (1) (2) (3) (4) (5) (6) (7)
Subsidiaries inLI countries 0.026*** -0.010 -0.001 0.015 0.019 0.019 0.017
[0.008] [0.010] [0.017] [0.014] [0.014] [0.013] [0.012]HI countries 0.001 -0.007 -0.038* -0.049*** 0.021 0.004 0.024*
[0.010] [0.012] [0.020] [0.017] [0.016] [0.015] [0.014]France -0.004 0.008 0.008 -0.009 -0.016** -0.014** -0.012*
[0.004] [0.006] [0.010] [0.008] [0.008] [0.007] [0.007]Export 0.000 0.000 -0.003** -0.001 0.002** 0.001* 0.001
[0.001] [0.001] [0.001] [0.001] [0.001] [0.001] [0.001]Revenue 0.008** -0.013*** -0.011 0.006 0.016** 0.015** 0.017***
[0.004] [0.005] [0.009] [0.007] [0.007] [0.006] [0.006]Capital -0.002 0.001 -0.006 -0.006 0.004 0.002 0.004
[0.002] [0.003] [0.005] [0.004] [0.004] [0.004] [0.003]Technology frontier 0.000 0.000 -0.003 -0.004* -0.003 -0.002 -0.003*
[0.001] [0.002] [0.003] [0.002] [0.002] [0.002] [0.002]Constant 0.130*** 0.551*** 0.564*** 0.555*** 0.328*** 0.536*** 0.485***
[0.022] [0.028] [0.049] [0.041] [0.039] [0.036] [0.033]
Observations 4,758 4,758 4,625 4,625 4,625 4,625 4,625R-squared 0.054 0.040 0.015 0.065 0.036 0.025 0.029
Log Likelihood 9974.184 8917.406 6227.275 7063.281 7272.762 7650.419 8000.815
Source: LIFI survey, French annual census for manufacturing (EAE), French Déclaration annuelles des données sociales (DADS); period2002-2007. Note: Estimations are of firm fixed effects (FE), and variables are calculated at the level of the firm. The wage-bill shares arein percent, varying between zero and 100.
38

Table 21: Fixed Effect Model for Intermediate Goods Industries
Executive Blue-collar Routine Non-routine Non-routine Non-routine Routineworkers manual manual interactive analytic cognitive
VARIABLES (1) (2) (3) (4) (5) (6) (7)
Subsidiaries inLI countries 0.011** -0.012** -0.001 0.000 0.017* -0.000 -0.004
[0.005] [0.006] [0.009] [0.008] [0.009] [0.008] [0.008]HI countries -0.003 -0.001 0.002 -0.005 -0.021* -0.011 0.002
[0.006] [0.008] [0.013] [0.012] [0.013] [0.011] [0.011]France -0.001 -0.008** -0.014** -0.013*** 0.006 0.002 0.005
[0.003] [0.004] [0.006] [0.005] [0.005] [0.005] [0.005]Export -0.001* 0.000 -0.001 -0.002** -0.001 -0.001 -0.000
[0.000] [0.000] [0.001] [0.001] [0.001] [0.001] [0.001]Revenue 0.003 -0.001 0.017*** 0.004 -0.002 -0.009 -0.009*
[0.003] [0.004] [0.006] [0.005] [0.006] [0.005] [0.005]Capital -0.000 -0.000 -0.001 0.006** 0.001 0.005* 0.001
[0.001] [0.002] [0.003] [0.003] [0.003] [0.003] [0.003]Technology frontier 0.001 -0.001 0.000 -0.000 -0.002 -0.002 -0.001
[0.001] [0.001] [0.002] [0.001] [0.002] [0.001] [0.001]Constant 0.103*** 0.626*** 0.384*** 0.477*** 0.428*** 0.624*** 0.614***
[0.016] [0.021] [0.034] [0.030] [0.033] [0.029] [0.029]
Observations 10,387 10,387 10,120 10,120 10,120 10,120 10,120R-squared 0.034 0.020 0.009 0.014 0.047 0.043 0.025
Log Likelihood 22753.005 19916.641 15005.990 16272.487 15428.356 16559.497 16425.647
Source: LIFI survey, French annual census for manufacturing (EAE), French Déclaration annuelles des données sociales (DADS); period2002-2007. Note: Estimations are of firm fixed effects (FE), and variables are calculated at the level of the firm. The wage-bill shares arein percent, varying between zero and 100.
F First Stage EstimatesResults of the first stage estimates show that there is a positive correlation between our
κ measure, reflecting the number of subsidiaries, in high-income countries and the averageGDP per capita in the destination country. Conversely, there is a positive correlationbetween GDP per capita in low-wage countries and the number of subsidiaries in low-wage countries. Overall, we observe that increasing GDP per capita raises the incentivefor firms to invest, whatever the type of country (low-income or high-income).
Interestingly, we observe a positive correlation between FDI to high-income countriesand the GDP per capita in low-income countries. FDI to low-income countries and moreparticularly in emerging economies combines strategies of market access and saving laborcosts (which are often called mixed investment strategies). On the one hand, productioncosts are lower than in developed countries, which increasingly drive efficiency-seekinginvestments. On the other hand, growing demand and strong market potential increaseincentives to invest in emerging economies. Mixed investment strategies represent themajor share of investment, since roughly 80% of FDI to low-income countries is directedtowards only ten emerging countries with strong growth potential. Large firms in Euro-pean countries and French CAC 40 companies, in particular, have created more jobs andbusiness in emerging countries than in high-income European countries in recent years.This is because a part of the global demand and growth have shifted to emerging mar-kets (UNCTAD, 2012). Therefore, increasing low-income countries’ GDP per capita wouldraise consumer demand without increasing production costs as much as in developed coun-tries. A firm could gain in efficiency and profitability as a result of increasing low-incomecountries’ GDP, and would allow it to raise FDI in high-income countries.
In contrast, we observe a negative and significant correlation between high-income
39

countries’ GDP per capita and FDI to low-income countries. These results show that,other things being equal, increasing market potential in high-income countries reduces theincentive for firms to invest in low-income countries. This corroborates the result thatmarket access is a powerful force of attraction for companies (Fontagne and Mayer 2005).
Results for infrastructure variables are intuitive and are in line with the existing,vast literature. They show that the quality of infrastructure is an important source ofcomparative advantage. Increases in the level of infrastructure in low-income countriesraise the incentive for firms to invest in these countries. The same conclusion holds foroffshoring to high-income countries.
40