Embed Size (px)
Citation preview

19
19 Six-Year Summary
20 Financial Performance (Consolidated)
22 Consolidated Balance Sheets
24 Consolidated Statements of Income
25 Consolidated Statements of Comprehensive Income
26 Consolidated Statements of Changes in Net Assets
27 Consolidated Statements of Cash Flows
28 Notes to Consolidated Financial Statements
45 Report of Independent Auditors
The Japan STeel WorkS, lTd.
Six-Year SummaryYears ended March 31
Financial Section
Contents
ConsolidatedMillions of Yen
2011 2010 2009 2008 2007 2006
Net sales ................................... ¥212,929 ¥201,680 ¥227,113 ¥220,851 ¥207,138 ¥173,353
Net income ................................ 16,532 17,528 16,034 17,484 12,515 6,586
Total assets ............................... 339,263 322,986 296,909 262,453 232,444 196,656
Total net assets ......................... 120,820 111,149 90,125 85,231 75,621 66,039
Amounts per share (yen): Net income ............................ ¥44.54 ¥47.22 ¥43.19 ¥47.10 ¥33.71 ¥17.57
Non-ConsolidatedMillions of Yen
2011 2010 2009 2008 2007 2006
Net sales ................................... ¥179,325 ¥175,333 ¥196,030 ¥189,318 ¥177,493 ¥145,555
Net income ................................ 14,527 16,665 15,449 15,878 12,233 6,026
Total assets ............................... 316,176 298,783 277,301 243,433 215,693 180,734
Total net assets ......................... 109,734 101,615 82,449 77,958 69,907 60,602
Amounts per share (yen): Net income ............................ ¥39.14 ¥44.90 ¥41.62 ¥42.77 ¥32.95 ¥16.07
Cash dividends applicable to the year ................................
¥12.00 ¥12.00 ¥12.00 ¥12.00 ¥9.00 ¥5.00

20
Cash Flows
Cash and cash equivalents stood at ¥41,116 million
(US$494 million) at the reporting term-end, down
¥4,486 million year on year after adjusting noncash
items. This was attributable to increases in capital
investments for the enhancement of production effi-
ciency as well as in working capital, which outweighed
the posting of income before income taxes and minority
interests in the amount of ¥27,923 million, compared
with ¥29,603 million for the previous term, in addition
to depreciation and amortization, which is a noncash
item, as well as proceeds from long-term debt.
Cash Flow from Operating Activities
Net cash provided by operating activities amounted
to ¥21,774 million (US$261 million), compared with
¥45,668 million in the previous term. This was mainly
Net Sales
Net sales increased ¥11,249 million, or 5.6%, year on
year, to ¥212,929 million (US$2,560 million) in the
reporting period. This was due to an increase in the
Industrial Machinery Products Business.
Operating Income
Operating income declined ¥3,690 million, or 11.5%,
to ¥28,495 million (US$342 million). This decrease was
mainly attributable to a more efficient balance between
inventory turnover and notes and accounts receivable as
a measure to strengthen our financial position, as well
as to aggressive cost-cutting including improved variable
costs and further reductions in fixed costs as efforts to
lower the break-even point, both of which were more
than offset by the appreciation of the yen, lower product
price as a result of intensified competition, as well as
increased depreciation and amortization.
Net Income
Net income decreased ¥996 million, or 5.7%, to
¥16,532 million (US$198 million).
Geographical Information
Sales in Japan came to ¥99,070 million (US$1,191
million), and sales in China and South Korea were
¥29,836 million (US$358 million) and ¥21,810
million (US$262 million) respectively. Sales in North
America were ¥10,248 million (US$123 million), while
sales in other regions were ¥51,963 million (US$624
million).
Operating Results
Financial Performance (Consolidated)
Oversea sales % of total salesOversea sales % of total sales
32,076
28,592
53,388
65,685
75,621
85,231
120,820
90,125
2007 2008 201120102009
2007 2008 201120102009
2007 2008 201120102009
Interest-Bearing D
ebt
Net A
ssetsR
OE
¥ million
0
18,000
36,000
54,000
72,000
¥ million
0
30,000
60,000
90,000
120,000
%
0
6.0
12.0
18.0
24.0
2007 2008 201120102009
Eq
uity Ratio
%
0
9.0
18.0
27.0
36.0
32.4 32.430.3
35.3
17.7
21.8
18.3
14.4
34.0
17.6
24,678
32,475
36,633
28,495
85,921
103,937
119,853
113,858
35,630
42,040
26,319
21,774
58,440111,149
32,18593,903
45,668
2007 2008 201120102009
2007 2008 201120102009
2007 2008 201120102009
Op
erating Income
Geograp
hical Information
Net Cash Provided by Operating Activities
¥ million
0
10,500
21,000
31,500
42,000
¥ million
0
37,500
75,000
112,500
150,000%
0
14
28
42
56
¥ million
0
11,500
23,000
34,500
46,000
41.5
47.1
52.8 53.5
46.6

21
due to the posting of ¥27,923 million in income before
income taxes and minority interests, as well as depreciation
and amortization in the amount of ¥20,003 million, which
was not a physical cash outflow, and an increase in work-
ing capital and other factors.
Cash Flow from Investing Activities
Net cash used in investing activities amounted to ¥28,238
million (US$339 million), compared with ¥37,287 million
for the previous term. This was due mainly to an investment
of ¥27,626 million in increase in tangible and intangible
assets for the purpose of raising production efficiency.
Cash Flow from Financing Activities
Net cash provided by financing activities amounted to
¥2,116 million (US$25 million) compared with a net cash
outflow of ¥2,687 million for the previous term. This net
cash inflow resulted from an inflow of ¥10,420 million
from long-term debt, which exceeded an outflow of ¥4,454
million in cash dividend paid.
Financial Position
Total assets as of the end of March 2011 stood at ¥339,263
million (US$4,080 million), up ¥16,277 million, or 5.0%,
from the previous term-end. This was due to an increase
in noncurrent assets from the acquisition of such property,
plant and equipment as buildings and structures as well as
machinery and transport equipment as a result of capital
expenditures, mainly in the Steel and Energy Products
Business, in addition to an increase in current assets
owing to an increase in work in process. Liabilities at the
reporting term-end stood at ¥218,443 million (US$2,627
million), up ¥6,606 million, or 3.1%, over the previous
term-end. This was largely attributable to an increase in
long-term debt. Interest-bearing debt stood at ¥65,685 mil-
lion (US$789 million), up ¥7,244 million from the previ-
ous fiscal year. Net assets at the reporting term-end totaled
¥120,820 million (US$1,453 million), for an increase of
¥9,671 million, or 8.7%, over the previous term-end.
Oversea sales % of total salesOversea sales % of total sales
32,076
28,592
53,388
65,685
75,621
85,231
120,820
90,125
2007 2008 201120102009
2007 2008 201120102009
2007 2008 201120102009
Interest-Bearing D
ebt
Net A
ssetsR
OE
¥ million
0
18,000
36,000
54,000
72,000
¥ million
0
30,000
60,000
90,000
120,000
%
0
6.0
12.0
18.0
24.0
2007 2008 201120102009
Eq
uity Ratio
%
0
9.0
18.0
27.0
36.0
32.4 32.430.3
35.3
17.7
21.8
18.3
14.4
34.0
17.6
24,678
32,475
36,633
28,495
85,921
103,937
119,853
113,858
35,630
42,040
26,319
21,774
58,440111,149
32,18593,903
45,668
2007 2008 201120102009
2007 2008 201120102009
2007 2008 201120102009
Op
erating Income
Geograp
hical Information
Net Cash Provided by Operating Activities
¥ million
0
10,500
21,000
31,500
42,000
¥ million
0
37,500
75,000
112,500
150,000%
0
14
28
42
56
¥ million
0
11,500
23,000
34,500
46,000
41.5
47.1
52.8 53.5
46.6

22
The Japan STeel WorkS, lTd. and ConSolidaTed SubSidiarieS
Consolidated Balance Sheets March 31, 2011 and 2010
Millions of YenThousands of
U.S. Dollars (Note 3)
Assets 2011 2010 2011
Current assets:
Cash on hand and in banks (Notes 8, 15 and 17) ............................... ¥ 41,187 ¥ 45,646 $ 495,334
Notes and accounts receivable:
Unconsolidated subsidiaries and affiliates ....................................... 1,251 708 15,045
Trade (Notes 8 and 17) .................................................................. 43,998 41,734 529,140
Other ............................................................................................. 1,608 1,228 19,339
Less allowance for doubtful accounts ............................................ (208) (281) (2,502)
Inventories (Note 4) ............................................................................ 82,241 69,627 989,068
Deferred tax assets (Note 21) ............................................................. 6,852 4,206 82,405
Other current assets ........................................................................... 8,535 8,648 102,646
Total current assets ................................................................... 185,467 171,518 2,230,511
Property, plant and equipment, at cost (Notes 5, 6 and 8):
Land .................................................................................................. 11,381 11,448 136,873
Buildings and structures ...................................................................... 96,665 84,634 1,162,538
Machinery and equipment .................................................................. 139,417 119,904 1,676,693
Leased assets .................................................................................... 8,339 8,551 100,289
Construction in progress .................................................................... 2,631 11,564 31,642
258,434 236,102 3,108,046
Less accumulated depreciation .......................................................... (140,893) (124,936) (1,694,444)
Property, plant and equipment, net ............................................. 117,540 111,166 1,413,590
Intangible assets ................................................................................... 1,005 1,236 12,087
Investments, long-term loans and other assets:
Investments in unconsolidated subsidiaries and affiliates ..................... 875 737 10,523
Investment securities (Notes 17 and 18) .............................................. 27,613 31,710 332,087
Other long-term loans receivable ......................................................... 111 61 1,335
Deferred tax assets (Note 21) ............................................................. 2,075 1,934 24,955
Other assets ........................................................................................ 4,772 5,036 57,390
Less allowance for doubtful accounts ................................................. (198) (415) (2,381)
total investments, long-term loans and other assets ............ 35,249 39,064 423,921
total assets .............................................................................. ¥339,263 ¥322,986 $4,080,132
The accompanying notes are an integral part of these statements.

23
Millions of YenThousands of
U.S. Dollars (Note 3)
LIAbILItIes AND Net Assets 2011 2010 2011
Current liabilities:
Short-term borrowings (Notes 8 and 17) .............................................. ¥ 13,120 ¥ 13,722 $ 157,787
Current portion of long-term debt (Notes 8 and 17) .............................. 2,435 12,694 29,284
Notes and accounts payable:
Unconsolidated subsidiaries and affiliates ........................................... 81 34 974
Trade (Note 17) .................................................................................. 44,932 36,197 540,373
Other .................................................................................................. 6,384 7,556 76,777
Advances received for products ........................................................... 31,024 42,131 373,109
Accrued income taxes (Note 21) .......................................................... 7,979 6,436 95,959
Other current liabilities (Note 8) ............................................................ 27,600 23,965 331,930
Total current liabilities ...................................................................... 133,558 142,738 1,606,230
Long-term liabilities:
Long-term debt (Notes 8 and 17) .......................................................... 50,130 32,025 602,886
Accrued retirement benefits (Note 20):
For employees .................................................................................... 9,339 8,520 112,315
For directors and corporate auditors ................................................... 199 161 2,393
Deferred tax liabilities (Note 21) ............................................................ 1,720 2,661 20,686
Other long-term liabilities (Note 8) ........................................................ 23,494 25,730 282,550
Total long-term liabilities .................................................................. 84,884 69,098 1,020,854
Net assets:
shareholders’ equity (Note 14)
Common stock:
Authorized — 1,000,000,000 shares
Issued — 371,463,036 shares ............................................................ 19,694 19,694 236,849
Capital surplus ..................................................................................... 5,426 5,425 65,256
Retained earnings ................................................................................. 94,779 82,701 1,139,856 Treasury stock, at cost (299,234 shares in 2011 and
287,708 shares in 2010) .................................................................... (224) (213) (2,694)
Total shareholders’ equity .............................................................. 119,676 107,607 1,439,278
Accumulated other comprehensive income:
Unrealized holding gain (loss) on securities .......................................... 687 2,949 8,262
Unrealized gain (loss) from hedging instruments .................................. 102 (213) 1,227
Translation adjustments ...................................................................... (586) (425) (7,048)
Total accumulated other comprehensive income............................. 203 2,310 2,441
Minority interests ............................................................................... 940 1,231 11,305
total net assets ................................................................................ 120,820 111,149 1,453,037
total liabilities and net assets ...................................................... ¥339,263 ¥322,986 $4,080,132

24
The Japan STeel WorkS, lTd. and ConSolidaTed SubSidiarieS
Consolidated Statements of IncomeFor the years ended March 31, 2011 and 2010
Millions of YenThousands of
U.S. Dollars (Note 3)
2011 2010 2011
Net sales ................................................................................................ ¥212,929 ¥201,680 $2,560,782
Cost of sales (Note 10) ........................................................................... 155,433 143,708 1,869,308
Gross profit .................................................................................... 57,496 57,971 691,473
selling, general and administrative expenses (Note 10) ..................... 29,000 25,786 348,767
Operating income ........................................................................... 28,495 32,185 342,694
Other income (expenses):
Interest and dividend income ............................................................... 484 445 5,821
Interest expense ................................................................................. (739) (694) (8,888)
Other, net (Note 11) ............................................................................ (316) (2,333) (3,800)
(571) (2,582) (6,867)
Income before income taxes and minority interests ........................... 27,923 29,603 335,815
Income taxes (Note 21):
Current ................................................................................................ 14,075 12,142 169,272
Deferred ............................................................................................. (2,396) (89) (28,815)
Income before minority interests ........................................................ 16,244 — 195,358
Minority interests in net income (loss) of consolidated subsidiaries ... (287) 22 (3,452)
Net income (Note 26) ............................................................................ ¥ 16,532 ¥ 17,528 $ 198,821
The accompanying notes are an integral part of these statements.

25
The Japan STeel WorkS, lTd. and ConSolidaTed SubSidiarieS
Consolidated Statements of Comprehensive IncomeFor the years ended March 31, 2011 and 2010
Millions of YenThousands of
U.S. Dollars (Note 3)
2011 2010 2011
Income before minority interests .......................................................... ¥16,244 ¥— $195,358
Other comprehensive income:
Unrealized holding gain (loss) on securities .......................................... (2,261) — (27,192)
Unrealized gain (loss) from hedging instruments .................................. 315 — 3,788
Translation adjustments ...................................................................... (161) — (1,936)
total other comprehensive income (Note 13) ....................................... (2,107) — (25,340)
Comprehensive income ........................................................................ ¥14,137 ¥— $170,018
total comprehensive income attributable to:
Shareholders of The Japan Steel Works, Ltd. ..................................... ¥14,426 — $173,494
Minority interests ................................................................................. ¥ (288) ¥— $ (3,464)
The accompanying notes are an integral part of these statements.

26
The Japan STeel WorkS, lTd. and ConSolidaTed SubSidiarieS
Consolidated Statements of Changes in Net AssetsFor the years ended March 31, 2011 and 2010
Millions of Yen
Thousands of U.S. Dollars
(Note 3)
2011 2010 2011
Common stock:
Balance at beginning of year ..... ¥ 19,694 ¥ 19,694 $ 236,849
Balance at end of year .............. ¥ 19,694 ¥ 19,694 $ 236,849
Capital surplus:
Balance at beginning of year ..... ¥ 5,425 ¥ 5,424 $ 65,244
Disposal of treasury stock ......... 0 1 0
Balance at end of year .............. ¥ 5,426 ¥ 5,425 $ 65,256
Retained earnings:
Balance at beginning of year ..... ¥ 82,701 ¥ 69,627 $ 994,600
Cash dividends paid .................. (4,454) (4,454) (53,566)
Net income ............................... 16,532 17,528 198,821
Balance at end of year .............. ¥ 94,779 ¥ 82,701 $1,139,856
Treasury stock, at cost:
Balance at beginning of year ..... ¥ (213) ¥ (182) $ (2,562)
Purchases of treasury stock ...... (12) (32) (144)
Disposal of treasury stock ......... 2 1 24
Balance at end of year .............. ¥ (224) ¥ (213) $ (2,694)
Total shareholders’ equity:
Balance at beginning of year ..... ¥107,607 ¥ 94,563 $1,294,131
Cash dividends paid .................. (4,454) (4,454) (53,566)
Net income ............................... 16,532 17,528 198,821
Purchases of treasury stock ...... (12) (32) (144)
Disposal of treasury stock ......... 3 3 36
Balance at end of year .............. ¥119,676 ¥107,607 $1,439,278
Unrealized holding gain (loss) on securities:
Balance at beginning of year ..... ¥ 2,949 ¥ (3,868) $ 35,466
Net changes in items other than those in shareholders’ equity ... (2,261) 6,818 (27,192)
Balance at end of year .............. ¥ 687 ¥ 2,949 $ 8,262
Millions of Yen
Thousands of U.S. Dollars
(Note 3)
2011 2010 2011
Unrealized gain (loss) from hedging instruments:
Balance at beginning of year ..... ¥ (213) ¥ (379) $ (2,562)
Net changes in items other than those in shareholders’ equity ... 315 165 3,788
Balance at end of year .............. ¥ 102 ¥ (213) $ 1,227
Translation adjustments:
Balance at beginning of year ..... ¥ (425) ¥ (435) $ (5,111)
Net changes in items other than those in shareholders’ equity ... (160) 9 (1,924)
Balance at end of year .............. ¥ (586) ¥ (425) $ (7,048)
Total accumulated other comprehensive income:
Balance at beginning of year ..... ¥ 2,310 ¥ (4,683) $ 27,781
Net changes in items other than those in shareholders’ equity ... (2,106) 6,994 (25,328)
Balance at end of year .............. ¥ 203 ¥ 2,310 $ 2,441
Minority interests:
Balance at beginning of year ..... ¥ 1,231 ¥ 246 $ 14,805
Net changes in items other than those in shareholders’ equity ... (290) 984 (3,488)
Balance at end of year .............. ¥ 940 ¥ 1,231 $ 11,305
Total net assets:
Balance at beginning of year ..... ¥111,149 ¥ 90,125 $1,336,729
Cash dividends paid .................. (4,454) (4,454) (53,566)
Net income ............................... 16,532 17,528 198,821
Purchases of treasury stock ...... (12) (32) (144)
Disposal of treasury stock ......... 3 3 36
Net changes in items other than those in shareholders’ equity ... (2,397) 7,979 (28,827)
Balance at end of year .............. ¥120,820 ¥111,149 $1,453,037
The accompanying notes are an integral part of these statements.

27
The Japan STeel WorkS, lTd. and ConSolidaTed SubSidiarieS
Consolidated Statements of Cash FlowsFor the years ended March 31, 2011 and 2010
Millions of YenThousands of
U.S. Dollars (Note 3)
2011 2010 2011
Operating activities: Income before income taxes and minority interests ............................. ¥27,923 ¥29,603 $335,815 Depreciation and amortization ............................................................. 20,021 14,512 240,782 Impairment loss ................................................................................... 197 — 2,369 Interest and dividend income ............................................................... (484) (445) (5,821) Interest expense .................................................................................. 739 693 8,888 Bond issuance expenses .................................................................... 50 — 601 Equity in (earnings) losses of affiliates .................................................. 0 (1) 0 Loss on abandonment of investments ................................................. — 680 — Loss on write-downs of investment securities ...................................... 340 105 4,089 Amortization of net retirement benefit obligation at transition ............... — 765 — Loss on disposal of tangible and intangible assets............................... 481 847 5,785 Gain and loss on sales of property, plant and equipment..................... (15) (11) (180) Loss on adjustment for change in accounting principal for
asset retirement obligations ............................................................... 236 — 2,838 Changes in operating assets and liabilities: Trade assets (Note 20) .................................................................... (16,489) 8,672 (198,304) Trade liabilities ................................................................................ 11,255 (7,708) 135,358 Inventories (Note 4) ......................................................................... (12,614) 4,957 (151,702) Other .............................................................................................. 2,897 3,012 34,841 Subtotal ...................................................................................... 34,539 55,683 415,382 Interest and dividends received ........................................................... 487 447 5,857 Interest paid ........................................................................................ (725) (698) (8,719) Income taxes paid .............................................................................. (12,527) (9,763) (150,655) Net cash provided by operating activities .............................. 21,774 45,668 261,864Investing activities: Increase in tangible and intangible assets ............................................ (27,626) (35,892) (332,243) Decrease in tangible and intangible assets .......................................... 157 20 1,888 Purchases of investment securities ...................................................... (41) (1,673) (493) Proceeds from sales of investment securities ...................................... 0 19 0 Reimbursement of long-term deposits on contracts ............................ (487) (436) (5,857) (Increase) decrease in short-term loans receivable ............................... 2 (1) 24 Long-term loans receivable made........................................................ (56) — (673) Purchase of investment of unconsolidated subsidiaries ....................... (174) (35) (2,093) Purchase of investments in subsidiaries resulting in
change in scope of consolidation ...................................................... — 754 — Purchases of common stock of affiliates .............................................. — (3) — Other ................................................................................................... (12) (38) (144) Net cash used in investing activities ...................................... (28,238) (37,287) (339,603)Financing activities (Notes 8 and 17): Net increase (decrease) in short-term borrowings ................................ (602) 5,467 (7,240) Increase in long-term debt .................................................................. 10,420 900 125,316 Decrease in long-term debt ................................................................ (1,087) (2,322) (13,073) Proceeds from issuance of bonds ....................................................... 9,949 — 119,651 Redemption of bonds .......................................................................... (10,000) — (120,265) Cash dividend paid.............................................................................. (4,454) (4,454) (53,566) Acquisition of treasury stock ................................................................ (12) (32) (144) Proceeds from sales of treasury stock ................................................. 3 3 36 Repayments of finance lease obligations ............................................. (2,097) (2,241) (25,219) Other ................................................................................................... (2) (6) (24) Net cash provided by (used in) financing activities ................ 2,116 (2,687) 25,448effect of exchange rate changes on cash and cash equivalents ....... (138) 5 (1,660)(Decrease) increase in cash and cash equivalents .............................. (4,486) 5,698 (53,951)Cash and cash equivalents at beginning of the year ........................... 45,603 39,904 548,443Cash and cash equivalents at end of the year (Notes 15 and 17) ........ ¥41,116 ¥45,603 $494,480The accompanying notes are an integral part of these statements.

28
1. Basis of PresentationThe Japan Steel Works, Ltd. (the “Company”) and its domestic subsid-iaries maintain their books of account in conformity with the financial accounting standards of Japan, and its foreign subsidiaries maintain their books of account in conformity with those of their respective countries of domicile. The accompanying consolidated financial statements have been prepared in accordance with accounting principles generally accepted in Japan, which are different in certain respects as to the application and disclosure requirements of IFRS, and have been compiled from the consolidated financial statements prepared by the Company as required by the Financial Instruments and Exchange Law of Japan. As permitted by the Financial Instruments and Exchange Law of Japan, amounts of less than one million yen have been omitted. As a result, the totals shown in the accompanying consolidated financial statements (both in yen and in U.S. dollars) do not necessarily agree with the sums of the individual amounts. Certain amounts in the prior year’s consolidated financial state-ments have been reclassified to conform to the current year’s presentation.
2. Summary of Significant Accounting Policies(a) Principles of consolidation and accounting for investments in
unconsolidated subsidiaries and affiliatesThe accompanying consolidated financial statements include the accounts of the Company and any significant companies (collectively, the “Companies”) controlled directly or indirectly by the Company. Companies over which the Company exercises significant influence in terms of their operating and financial policies have been accounted for by the equity method. All significant intercompany balances and transactions have been eliminated in consolidation. As of March 31, 2011, the numbers of consolidated subsidiaries, and subsidiaries and affiliates accounted for by the equity method were 37 and 1 (37 and 1 in 2010), respectively. Effective March 31, 2010, Meiki Co., Ltd. was included in the scope of consolidation because the Company’s ownership increased to 50.96%. Certain foreign subsidiaries are consolidated on the basis of fiscal periods ended December 31, and one domestic subsidiary’s year end is January 31, both of which differ from that of the Company. However, the necessary adjustments have been made if the effect of the differ-ence is material. Investments in subsidiaries and affiliates which are neither consolidated nor accounted for by the equity method are carried at cost or less. Where there has been a permanent decline in the value of such investments, the Company has written them down. Differences between the cost and the underlying net equity at fair value of investments in consolidated subsidiaries and in companies accounted for by the equity method have been amortized by the straight-line method over five years after acquisition and are included in selling, general and administrative expenses.
(b) Foreign currency translationThe balance sheet accounts of the foreign consolidated subsidiaries are translated into yen at the rates of exchange in effect at the balance sheet date, except for the components of net assets excluding minority interests which are translated at their historical exchange rates. Revenue and expense accounts are translated at the average rates of exchange in effect during the year. Differences arising from the transla-tion are presented as translation adjustments and minority interests in the consolidated financial statements. Revenue and expense items arising from transactions denominated
in foreign currencies are generally translated into yen at the rates of exchange in effect at the respective transaction dates. All monetary assets and liabilities denominated in foreign currencies are translated into yen at the rates of exchange in effect at the balance sheet date and differences arising from the translation are included in the consolidated statements of income.
(c) Cash equivalentsShort-term investments with a maturity of three months or less when purchased which can easily be converted to cash and are subject to little risk of change in value are considered to be cash equivalents.
(d) InventoriesReal estate held for sale, finished products and work in process are stated the lower of or net realizable value at cost determined principally by the specific identification method. Raw materials are stated at the lower of cost or replacement cost determined principally by the moving average method.
(e) Short-term investments and investment securitiesSecurities other than equity securities issued by subsidiaries and affiliates are classified into two categories: held-to-maturity or other securities. Held-to-maturity securities are carried at amortized cost. Marketable securities classified as other securities are carried at fair value with changes in unrealized holding gain or loss, net of the applicable income taxes, included directly in net assets. Non-marketable securities clas-sified as other securities are carried at cost. Cost of securities sold is determined by the moving average method.
(f) Allowance for doubtful accountsThe allowance for doubtful accounts is provided for possible bad debts at an amount estimated based on the historical experience with bad debts on normal receivables plus an additional allowance for specific uncollectible amounts determined by reference to the collectability of individual doubtful accounts.
(g) Provision for warranties for completed constructionThe Company provides a provision for warranties for completed construction by estimating losses on future possible claims.
(h) Provision for loss on construction contractsThe Company provides a provision for loss on construction contracts, which has not been delivered by the fiscal year end, by estimating the amount of total losses anticipated in the following fiscal year and thereafter to be incurred, when the amounts that can be reasonably estimated.
(i) Property, plant and equipment and depreciation Property, plant and equipment is stated on the basis of cost. Depreciation of property, plant and equipment is determined by the declining-balance method over the estimated useful lives of the respec-tive assets, except that the straight-line method is applied to buildings. Significant renewals and additions are capitalized at cost. Maintenance and repairs are charged to income as incurred.
(j) Bond issuance expensesBond issuance expenses are charged to income as incurred.
(k) Leases and depreciationFinance lease transactions which do not stipulate the transfer of
The Japan STeel WorkS, lTd. and ConSolidaTed SubSidiarieS
Notes to Consolidated Financial Statements

29
ownership of the leased assets to the lessee are accounted for as sales and purchase transactions. With regard to the depreciation method of leased assets, the straight-line method is applied using the lease period as the estimated useful life and a residual value of zero.
(l) Retirement benefitsAn employee whose employment is terminated is entitled, in most cases, to a lump-sum severance payment determined by reference to the current basic rate of pay, length of service and the conditions under which the termination occurs. Accrued retirement benefits for employees at March 31, 2011 and 2010 have been provided primarily at an amount calculated based on the retirement benefit obligation and the fair value of the pension plan assets at the balance sheet dates, as adjusted for the unrecognized net retirement benefit obligation at transition, prior service cost and unrecognized actuarial gain or loss. The retirement benefit obligation is attributed to each period by the straight-line method over the estimated years of service of the eligible employees. The net retirement benefit obligation at transition is being amortized principally over a period of ten years by the straight-line method. Prior service cost is being amortized as incurred by the straight-line method over ten years, which is shorter than the average remaining years of service of the eligible employees. Actuarial gain or loss is amortized in the year following the year in which the gain or loss is recognized by the straight-line method over ten years, which is shorter than the average remaining years of service of the employees participating in the plans. Effective the year ended March 31, 2010, the Company and its domestic subsidiaries adopted the “Partial Amendments to Accounting Standard for Retirement Benefits (Part 3)” (ASBJ Statement No. 19, July 31, 2008). The effects of this change on operating income, income before income taxes and minority interests were not material for the year ended March 31, 2010.
(m) Income taxesDeferred tax assets and liabilities have been recognized in the consoli-dated balance sheets at March 31, 2011 and 2010 with respect to the differences between financial reporting and the tax bases of the assets and liabilities, and are measured using the enacted tax rates and laws which will be in effect when the differences are expected to reverse.
(n) Research and development expensesResearch and development expenses are charged to income when incurred.
(o) Revenue and cost recognitionRevenues are generally recognized on sales of products at the time of shipment. Effective April 1, 2009, revenues and costs, of which the percent-age of completion can be reliably estimated, are recognized by the percentage-of-completion method. The percentage of completion is calculated at the cost incurred as a percentage of the estimated total cost. The completed-contract method continues to be applied to contracts for which the percentage of completion cannot be reliably estimated. For construction contracts effective from the year ended March 31, 2010, the Company and its domestic subsidiaries apply the “Accounting Standard for Construction Contracts” (ASBJ Statement No. 15, December 27, 2007) and the “Implementation Guidance of
Accounting Standard for Construction Contracts” (ASBJ Guidance No. 18, December 27, 2007). Construction for which the percentage of completion can be reliably estimated is recognized by the percentage-of-completion method, and all other construction is recognized by the completed-contract method. The effects of this change on operating income, income before income taxes and minority interests were not material for the year ended March 31, 2010.
(p) Derivative financial instrumentsDerivative financial instruments are carried at fair value. Gain or loss on derivatives designated as hedging instruments is deferred as a compo-nent of net assets until the loss or gain on the underlying hedged items is recognized. Foreign currency receivables and payables are translated at the applicable forward foreign exchange rates if certain conditions are met. In addition, the related interest differential paid or received under interest-rate swaps utilized as hedging instruments is recognized over the terms of the swap agreements as an adjustment to the interest expense of the underlying hedged items if certain conditions are met.
(q) Consumption taxAccounting treatment of consumption tax is the tax exclusion method.
(r) Provision for directors’ bonusesProvision for directors’ bonuses is provided based on estimated amounts to be paid in the subsequent period applicable to the current period.
(s) Provision for directors’ retirement benefitsProvision for directors’ retirement benefits is provided based on estimated amounts determined by internal rules.
(t) Adoption of accounting standard for asset retirement obligations
Effective the year ended March 31, 2011, the Company and its domestic consolidated subsidiaries adopted the “Accounting Standard for Asset Retirement Obligations” (ASBJ Statement No. 18, March 31, 2008) and the “Implementation Guidance of Accounting Standard for Asset Retirement Obligations” (ASBJ Guidance No. 21, March 31, 2008). Operating income decreased by ¥33 million ($397 thousand) and income before income taxes and minority interests decreased by ¥269 million ($3,235 thousand) as a result of the adoption of this standard.
(u) Changes in presentationEffective from fiscal year 2011, “Accounting Standard for Consolidated Financial Statements” (ASBJ Statement No. 22 issued on December 26, 2008) and “Cabinet Office Ordinance for Partial Amendment of the Regulation for Terminology, Forms and Preparation of Consolidated Financial Statements” (Cabinet Office Ordinance No. 5 issued on March 24, 2009) have been applied. As a consequence, a new line item has been presented on the consolidated statements of income as “income before minority interests.”
3. U.S. Dollar AmountsThe translation of yen amounts into U.S. dollars is included solely for convenience, as a matter of arithmetic computation only, at ¥83.15 = U.S.$1.00, the approximate rate of exchange prevailing on March 31, 2011. This translation should not be construed as a representation that all amounts shown could be converted into U.S. dollars at such rate.

30
4. InventoriesInventories at March 31, 2011 and 2010 consisted of the following:
Millions of YenThousands of U.S. Dollars
2011 2010 2011
Real estate held for sale ........... ¥ 21 ¥ 33 $ 253Finished products .................... 1,161 1,370 13,963Work in process ...................... 75,008 62,187 902,081Raw materials and supplies ..... 6,050 6,036 72,760 Total ................................... ¥82,241 ¥69,627 $989,068
Work in process related to construction contracts of which a loss is anticipated to be incurred was offset with a provision for loss on construction contracts of ¥1,257 million ($15,117 thousand) at March 31, 2011 and ¥353 million at March 31, 2010.
5. DepreciationDepreciation expense on property, plant and equipment for the years ended March 31, 2011 and 2010 was as follows:
Millions of YenThousands of U.S. Dollars
2011 2010 2011
Depreciation expense .............. ¥20,003 ¥14,422 $240,565
6. Advanced DepreciationAccumulated advanced depreciation related to government grants received has been deducted directly from the acquisition costs of certain tangible fixed assets (plant, machinery and equipment). Such accumulated depreciation at March 31, 2011 and 2010 is summarized as follows:
Millions of YenThousands of U.S. Dollars
2011 2010 2011
Accumulated advanced depreciation expense ............. ¥1,301 ¥951 $15,646
7. Contingent LiabilitiesContingent liabilities at March 31, 2011 and 2010 consisted of the following:
Millions of YenThousands of U.S. Dollars
2011 2010 2011
As endorsers of trade notes receivable: Endorsed to other ................. ¥ 78 ¥ 72 $ 938As guarantors of loans: Muroran Environmental Plant
Service Co., Ltd. ................ 588 591 7,072 Gotsu Wind Power Co., Ltd. . .. 1,757 1,881 21,130 Meiko Co., Ltd. ..................... 1 4 12 Uncollected receivables in
leasing companies ............... 32 64 385 Medical Corporation Bokoi .... — 1,500 — Employees and other............. 498 633 5,989 Total ................................... ¥2,956 ¥4,746 $35,550
8. Short-Term Borrowings and Long-Term DebtAll short-term borrowings, with interest at annual rates ranging from 0.64% to 1.975% at March 31, 2011 and 0.63% to 4.625% at March 31, 2010, were unsecured. Long-term debt at March 31, 2011 and 2010 was as follows:
Millions of YenThousands of U.S. Dollars
2011 2010 2011
Loans from banks and insurance companies with interest at annual rates ranging from 0.22% to 2.26% ............. ¥38,170 ¥28,837 $459,050Less those maturing within one year ................................. (635) (667) (7,637)Lease obligations ...................... 4,396 5,882 52,868Less those maturing within one year ................................. (1,800) (2,026) (21,648)0.92% straight bonds, due 2010 ................................ — 10,000 —Less those maturing within one year ................................. — (10,000) —0.48% straight bonds, due 2015 ................................ 10,000 — 120,265Long-term indebtedness reflected in the consolidated balance sheets ....................... ¥50,130 ¥32,025 $602,886
The aggregate annual maturities of long-term debt and lease obligations subsequent to March 31, 2011 are summarized as follows:
Long-term debt Lease obligations
Year ending March 31, Millions of
YenThousands of U.S. Dollars
Millions of Yen
Thousands of U.S. Dollars
2012.................................... ¥ 635 $ 7,637 ¥1,800 $21,6482013.................................... 13,670 164,402 1,384 16,6452014.................................... 10,370 124,714 645 7,7572015.................................... 2,550 30,667 345 4,1492016.................................... 10,830 130,247 145 1,7442017 and thereafter ............. 115 1,383 74 890
The assets pledged as collateral for long-term debt at March 31, 2011 and 2010 were as follows:
Millions of YenThousands of U.S. Dollars
2011 2010 2011
Cash on hand and in banks ...... ¥ 28 ¥ 206 $ 337Notes receivable-trade ............. — 102 —Property, plant and equipment, at net book value .................... 2,563 4,533 30,824
9. Liquidation of Accounts ReceivableAccounts receivable transferred to others for liquidation at March 31, 2011 and 2010 are summarized as follows:
Millions of YenThousands of U.S. Dollars
2011 2010 2011
Accounts receivable ................. ¥6,017 ¥5,933 $72,363

31
10. Research and Development ExpensesResearch and development expenses included in manufacturing costs, and selling, general and administrative expenses for the years ended March 31, 2011 and 2010 were as follows:
Millions of YenThousands of U.S. Dollars
2011 2010 2011
Research and development expenses ................................ ¥4,487 ¥4,141 $53,963
11. Other Income (Expenses) — Other, NetThe details of “Other, net” in “Other income (expenses)” for the years ended March 31, 2011 and 2010 were as follows:
Millions of YenThousands of U.S. Dollars
2011 2010 2011
Gain on sales of raw materials and supplies ............ ¥ 308 ¥ 214 $ 3,704Gain on contract cancellation ... 1,073 — 12,904Amortization of negative goodwill .................................. 71 — 854Bond issuance expenses .......... (50) — (601)Amortization of net retirement benefit obligation at transition ................................ — (693) —Foreign exchange losses .......... (308) — (3,704)Provision for warranties for completed construction .......... (620) (338) (7,456)Gain on sales of property, plant and equipment ............... 16 12 192Loss on sales or disposal of property, plant and equipment .............................. (482) (847) (5,797)Loss on write-downs of investment securities .............. (340) (105) (4,089)Impairment loss ........................ (197) — (2,369)Loss on abandonment of investments ............................ — (680) —Loss on adjustment for change in accounting principal for asset retirement obligations .... (236) — (2,838)Other, net ................................. 448 105 5,388 Total ................................... ¥ (316) ¥(2,333) $ (3,800)
12. Loss on Impairment of Fixed AssetsLoss on impairment of fixed assets recognized by the Company and a certain consolidated subsidiary for the year ended March 31, 2011 was as follows:
Location Use Classification
Chofu-shi, Tokyo prefecture and other
Idle AssetsBuildings, Structures, Land and other
Yokohama-shi, Kanagawa prefecture and other (a subsidiary engaged in the Industrial Machinery Products)
Operating Assets
Buildings and Land
The Company and its consolidated subsidiaries group their assets by classifying them into the smallest independent cash flow generating units possible on the basis of managerial accounting, whereas idle assets are grouped on an individual basis. Regarding the above assets, the Companies marked down the book value of asset groups where there had been a significant decline in profitability and market price to the recoverable amount.
The resulting impairment loss for the year ended March 31, 2011 was as follows:
Classification Millions of YenThousands of U.S. Dollars
Buildings .................................. ¥146 $1,756Structures ................................. 0 0Equipment ................................ 0 0Land ......................................... 50 601 Total ................................... ¥197 $2,369
With respect to operating assets, the Companies principally use value in use for calculating the recoverable amount, whereas idle assets are recorded at net realizable value. The discount rate used for computing the value in use was mainly 6.6% for the year ended March 31, 2011.
13. Other Comprehensive IncomeThe following table presents components of other comprehensive income for the year ended March 31, 2010:
Year ended March 31, 2010
Millions of YenThousands of U.S. Dollars
Unrealized holding gain (loss) on securities ........................... ¥ 6,818 $ 81,996Unrealized gain (loss) from hedging instruments ............... 165 1,984Translation adjustments ............ 11 132Total other comprehensive income ................................... ¥ 6,995 $ 84,125Total comprehensive income attributable to: Shareholders of The Japan
Steel Works, Ltd. ............ ¥24,522 $294,913 Minority interests ................ 23 277
(Additional Information)Effective the year ended March 31, 2011, the Company and its domestic consolidated subsidiaries adopted the “Accounting Standard for Presentation of Comprehensive Income” (ASBJ Statement No. 25, June 30, 2010). However, the amounts of accumulated other comprehensive income and total accumulated other comprehensive income in the accompanying balance sheet at March 31, 2010 correspond to the amounts for valuation and translation adjustments and total valuation and translation adjustments, respectively.
32
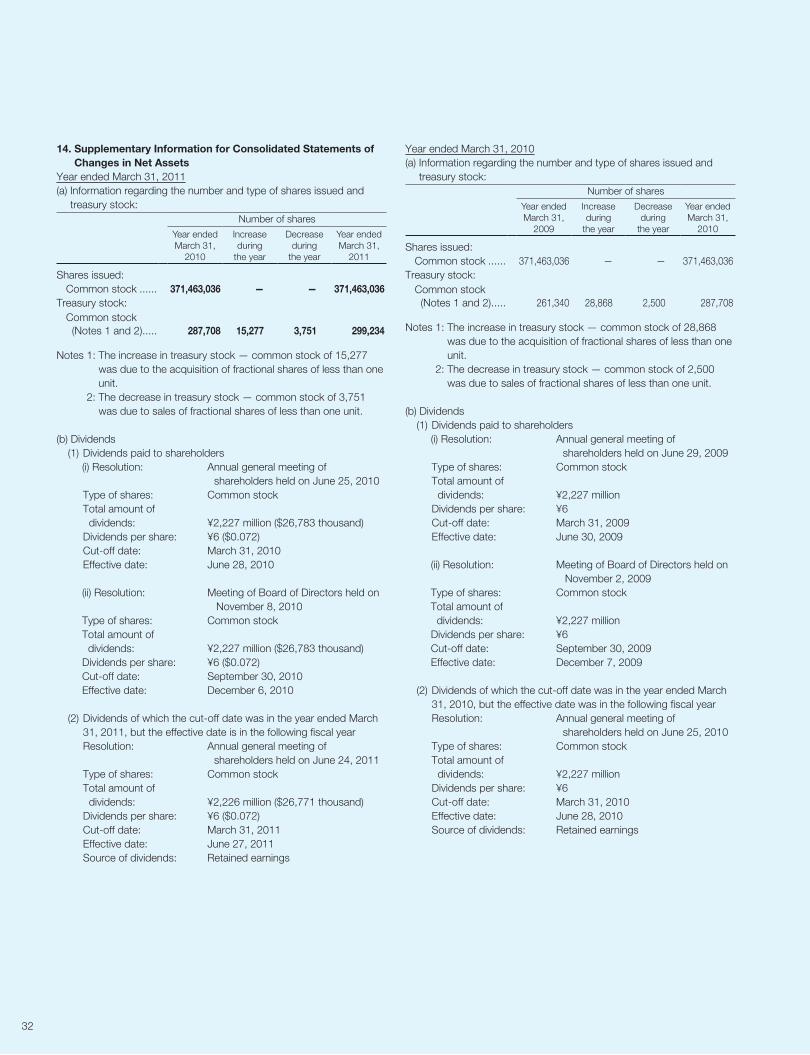
14. Supplementary Information for Consolidated Statements of Changes in Net Assets
Year ended March 31, 2011(a) Information regarding the number and type of shares issued and
treasury stock:Number of shares
Year ended March 31,
2010
Increase during
the year
Decrease during
the year
Year ended March 31,
2011
Shares issued: Common stock ...... 371,463,036 — — 371,463,036Treasury stock: Common stock
(Notes 1 and 2) ..... 287,708 15,277 3,751 299,234
Notes 1: The increase in treasury stock — common stock of 15,277 was due to the acquisition of fractional shares of less than one unit.
2: The decrease in treasury stock — common stock of 3,751 was due to sales of fractional shares of less than one unit.
(b) Dividends (1) Dividends paid to shareholders (i) Resolution: A nnual general meeting of
shareholders held on June 25, 2010 Type of shares: Common stock Total amount of
dividends: ¥2,227 million ($26,783 thousand) Dividends per share: ¥6 ($0.072) Cut-off date: March 31, 2010 Effective date: June 28, 2010
(ii) Resolution: M eeting of Board of Directors held on November 8, 2010
Type of shares: Common stock Total amount of
dividends: ¥2,227 million ($26,783 thousand) Dividends per share: ¥6 ($0.072) Cut-off date: September 30, 2010 Effective date: December 6, 2010
(2) Dividends of which the cut-off date was in the year ended March 31, 2011, but the effective date is in the following fiscal year
Resolution: A nnual general meeting of shareholders held on June 24, 2011
Type of shares: Common stock T otal amount of
dividends: ¥2,226 million ($26,771 thousand) Dividends per share: ¥6 ($0.072) Cut-off date: March 31, 2011 Effective date: June 27, 2011 Source of dividends: Retained earnings
Year ended March 31, 2010(a) Information regarding the number and type of shares issued and
treasury stock:Number of shares
Year ended March 31,
2009
Increase during
the year
Decrease during
the year
Year ended March 31,
2010
Shares issued: Common stock ...... 371,463,036 — — 371,463,036Treasury stock: Common stock
(Notes 1 and 2) ..... 261,340 28,868 2,500 287,708
Notes 1: The increase in treasury stock — common stock of 28,868 was due to the acquisition of fractional shares of less than one unit.
2: The decrease in treasury stock — common stock of 2,500 was due to sales of fractional shares of less than one unit.
(b) Dividends (1) Dividends paid to shareholders (i) Resolution: A nnual general meeting of
shareholders held on June 29, 2009 Type of shares: Common stock Total amount of
dividends: ¥2,227 million Dividends per share: ¥6 Cut-off date: March 31, 2009 Effective date: June 30, 2009
(ii) Resolution: M eeting of Board of Directors held on November 2, 2009
Type of shares: Common stock Total amount of
dividends: ¥2,227 million Dividends per share: ¥6 Cut-off date: September 30, 2009 Effective date: December 7, 2009
(2) Dividends of which the cut-off date was in the year ended March 31, 2010, but the effective date was in the following fiscal year
Resolution: A nnual general meeting of shareholders held on June 25, 2010
Type of shares: Common stock T otal amount of
dividends: ¥2,227 million Dividends per share: ¥6 Cut-off date: March 31, 2010 Effective date: June 28, 2010 Source of dividends: Retained earnings

33
15. Cash Flow Information(a) Cash and cash equivalents The reconciliation between cash and cash equivalents in the accompa-nying consolidated statements of cash flows and cash on hand and in banks in the accompanying consolidated balance sheets at March 31, 2011 and 2010 are summarized as follows:
Millions of YenThousands of U.S. Dollars
2011 2010 2011
Cash on hand and in banks in the consolidated balance sheets ....................... ¥41,187 ¥45,646 $495,334Investment with a maturity of three months or less from the date of acquisition .................. 44 50 529Time deposits with maturities of more than three months ......... (116) (93) (1,395)Cash and cash equivalents in the consolidated statements of cash flow ................................ ¥41,116 ¥45,603 $494,480
(b) Significant transactions without cash flowsAssets and liabilities regarding finance lease transactions and asset retirement obligations that have been recorded by the Company and its domestic consolidated subsidiaries at March 31, 2011 and 2010 were as follows:
Millions of YenThousands of U.S. Dollars
2011 2010 2011
Lease assets ............................ ¥ 590 ¥1,088 $ 7,096
Lease obligations ...................... 621 1,145 7,468
Buildings and structures ........... 863 — 10,379
Machinery and equipment ........ 14 — 168
Asset retirement obligations ...... 1,132 — 13,614
(c) Summary of assets acquired and liabilities assumed through the acquisition of shares of Meiki Co., Ltd. for the year ended March 31, 2010, acquisition costs and net disbursement
Millions of Yen
Current assets .......................... ¥4,364Noncurrent assets .................... 2,175Current liabilities ....................... (3,223)Noncurrent liabilities .................. (1,340)Negative goodwill ..................... (358)Minority interests ...................... (968)Company’s interest prior to the date of acquisition ............ (122)Acquisition costs of Meiki Co., Ltd. ........................ 527Cash and cash equivalents (Meiki Co., Ltd.) ...................... (1,281)Net proceeds from acquisition of Meiki Co., Ltd. .................... ¥ 754
16. LeasesYear ended March 31, 2011Future minimum lease payments subsequent to March 31, 2011 under non-cancelable operating leases are summarized as follows:
Year ending March 31, Millions of YenThousands of U.S. Dollars
2012......................................... ¥2,403 $ 28,9002013 and thereafter .................. 7,145 85,929 Total ................................... ¥9,548 $114,829
Year ended March 31, 2010Future minimum lease payments subsequent to March 31, 2010 under non-cancelable operating leases are summarized as follows:
Year ending March 31, Millions of Yen
2011......................................... ¥1,0272012 and thereafter .................. 2,138 Total ................................... ¥3,166
17. Financial InstrumentsOverview
Year ended March 31, 2011(a) Policy for financial instrumentsIn consideration of plans for capital investment, the Company and its consolidated subsidiaries (collectively, the “Group”) invest funds provided by operating cash flows. The Group uses bond issuances and bank borrowings in order to raise additional funds, if needed. The Company manages temporary cash surpluses through low-risk financial assets. The Company uses derivatives for the purpose of reducing risks and does not enter into derivatives for speculative or trading purposes.(b) Types of financial instruments and related riskTrade receivables — trade notes and accounts receivable — are exposed to credit risk in relation to customers. In addition, the Company is exposed to foreign currency exchange risk arising from receivables denominated in foreign currencies. The foreign currency exchange risks deriving from the trade receivables denominated in foreign currencies are hedged by forward foreign exchange contracts, if needed. Investment securities are exposed to market risk. Those securities are composed of mainly the shares of common stock of companies with which the Company has business relationships. Trade payables — trade notes and accounts payable — have payment due dates within one year. Although the Company is exposed to foreign currency exchange risk arising from those payables denomi-nated in foreign currencies, forward foreign exchange contracts are arranged to reduce the risk, if needed. Loans payables and bonds are used to raise funds mainly in con-nection with capital investments. The repayment dates of the long-term debts extend up to six years from the balance sheet date. Long-term debt with variable interest rates is exposed to interest rate fluctuation risk. However, to reduce such risk and fix interest expense for long-term debt with variable rates, the Company utilizes interest rate swap transactions as a hedging instrument. Regarding derivatives, the Company enters into forward foreign exchange contracts to reduce the foreign currency exchange risk arising from the receivables and payables denominated in foreign currencies. The Company also enters into interest rate swap transactions to reduce the fluctuation risk of interest payable for long-term debt with variable rates. Information regarding the method of hedge accounting, hedging instruments and hedged items, hedging policy, and the assessment of the effectiveness of hedging activities is found in Note 2 (p).

34
(c) Risk management for financial instruments (i) Monitoring of credit risk (the risk that customers or counterparties
may default)In accordance with the internal policies of the Company for managing credit risk arising from receivables, each related division monitors credit worthiness of their main customers periodically, and monitors due dates and outstanding balances by individual customer. In addition, the Company is making efforts to identify and mitigate risks of bad debts from customers who are having financial difficulties. The consolidated subsidiaries also manage credit risk using the Company’s internal policies and methods. The Company also believes that the credit risk of derivatives is insignificant as it enters into derivative transactions only with financial institutions which have a high credit-rating.
(ii) Monitoring of market risk (the risk arising from fluctuations in foreign exchange rates, interest rates and others)For trade receivables and payables denominated in foreign currencies, the Company identifies the foreign currency exchange risk for each currency on a monthly basis and enters into forward foreign exchange contracts to hedge such risk. In order to mitigate the interest rate risk for loans payable bearing interest at variable rates, the Company may also enter into interest rate swap transactions. For investment securities, the Company periodically reviews the fair values of such financial instruments and the financial position of the issuers. In addition, the Company continuously evaluates whether securities other than those classified as held-to-maturity should be maintained taking into account their fair values and relationships with the issuers. In conducting derivative transactions, the division in charge of each derivative transaction follows the internal policies, which set forth delegation of authority. Monthly reports including actual transaction data are submitted to top management for their review. The consolidated subsidiaries also conduct derivative transactions using the Company’s internal policies.
(iii) Monitoring of liquidity risk (the risk that the Company may not be able to meet its obligations on scheduled due dates)Based on the report from each division, the Company prepares and updates its cash flow plans in a timely basis to manage liquid-ity risk. The consolidated subsidiaries manage the liquidity risk using cash flow plans and report to the Company periodically.
(d) Supplementary explanation of the estimated fair value of financial instruments
The fair value of financial instruments is based on their quoted market price, if available. When there is no available quoted market price avail-able, fair value is reasonably estimated. Since various assumptions and factors are reflected in estimating the fair value, different assumptions and factors could result in different fair value. In addition, the notional amounts of derivatives in Note 19 Derivative Transactions-Supplemental Explanation on Quantitative Information are not necessarily indicative of the actual market risk involved in derivative transactions.
Estimated Fair Value of Financial InstrumentsCarrying value of financial instruments on the consolidated balance sheet as of March 31, 2011 and estimated fair value are shown in the following table. The following table does not include financial instru-ments for which it is extremely difficult to determine the fair value (Please refer to Note (ii) below).
Year ended March 31, 2011
Millions of Yen
Carrying amount
Estimated fair value Difference
Assets Cash on hand and in banks ..... ¥ 41,187 ¥ 41,187 ¥ — Trade notes and accounts
receivable .............................. 45,197 45,189 (8) Securities: Other securities with
maturity .............................. 44 44 — Other securities .................... 25,977 25,977 —Total assets ................................ ¥112,407 ¥112,399 ¥ (8)Liabilities Trade notes and accounts
payable ................................. ¥ 45,013 ¥ 45,013 ¥ — Short-term borrowings ............ 13,120 13,120 — Current portion of long-term
debt ...................................... 635 636 1 Bonds ..................................... 10,000 9,865 (134) Long-term debt ....................... 37,535 37,515 (19)Total liabilities ............................. ¥106,303 ¥106,151 ¥(151)Derivatives (*) .............................. ¥ (171) ¥ (171) ¥ —
Thousands of U.S. Dollars
Carrying amount
Estimated fair value Difference
Assets Cash on hand and in banks ..... $ 495,334 $ 495,334 $ — Trade notes and accounts
receivable .............................. 543,560 543,464 (96) Securities: Other securities with
maturity .............................. 529 529 — Other securities .................... 312,411 312,411 —Total assets ................................ $1,351,858 $1,351,762 $ (96)Liabilities Trade notes and accounts
payable ................................. $ 541,347 $ 541,347 $ — Short-term borrowings ............ 157,787 157,787 — Current portion of long-term
debt ...................................... 7,637 7,649 12 Bonds ..................................... 120,265 118,641 (1,612) Long-term debt ....................... 451,413 451,173 (229)Total liabilities ............................. $1,278,449 $1,276,621 $(1,816)Derivatives (*) .............................. $ (2,057) $ (2,057) $ —
(*) The value of assets and liabilities arising from derivatives is shown at net value, and with the amount in parentheses representing net liability position.
(i) Method to determine the estimated fair value of financial instruments and other matters related to securities and derivative transactions.
AssetsCash on hand and in banksThe carrying amount is used for bank deposits without maturities, because the fair value approximates the carrying value. The fair value

35
of time deposits in banks with maturities is calculated based on the present value of the total principal and interest discounted at a rate supposing a newly made deposit.Trade notes and accounts receivables These fair values are calculated by categories of the remaining periods of the receivables based on the present value using discount rates determined by the period to maturity and credit risk.SecuritiesThe carrying amount is used for other securities with maturities, because the fair value approximates the carrying amount. Quoted market price is used for other securities.
LiabilitiesTrade notes and accounts payable and short-term borrowingsThe carrying amount is used for these items because the fair value approximates the carrying amount.Current portion of long-term debt, bonds and long-term debtThese fair values are calculated by applying a discount rate, based on the assumed interest rate if similar new debt is issued, to the total of the principal and interest. The current portion of long-term debt and long-term debt with variable interest rates are subject to the special treatment of interest rate swaps and is calculated by applying a discount rate, based on the assumed interest rate if similar new debt is issued, to the total of the principal and interest including that of the interest rate swap.Derivative TransactionsPlease refer to Note 19, Derivative Transactions, of these notes to the consolidated financial statements.
(ii) Financial instruments for which it is extremely difficult to determine the fair value
2011
Millions of YenThousands of U.S.
Dollars
Unlisted stocks ......................... ¥2,257 $27,144
Because the fair values of these financial instruments are extremely difficult to determine, given that they do not have quoted market prices and future cash flows cannot be estimated, they are not included in “Securities” in the preceding table.
(iii) Redemption schedule for receivables and securities with maturities at March 31, 2011.
Year ended March 31, 2011
Millions of Yen
Due in one year or less
Due after one year
through five years
Due after five years
Cash on hand and in banks ........ ¥41,187 ¥ — ¥—Trade notes and accounts receivable ................................. 44,358 839 —Securities: Other securities with
maturities .............................. 44 — —Total ........................................... ¥85,590 ¥839 ¥—
Thousands of U.S. Dollars
Due in one year or less
Due after one year
through five years
Due after five years
Cash on hand and in banks ........ $ 495,334 $ — $—Trade notes and accounts receivable ................................. 533,470 10,090 —Securities: Other securities with
maturities .............................. 529 — —Total ........................................... $1,029,345 $10,090 $—
(iv) The redemption schedule for long-term debtYear ended March 31, 2011
Millions of Yen
BondsLong-term
loansLease
obligations
Due in 1 year or less ................... ¥ — ¥ 635 ¥1,800Due after 1 year through 2 years ..................................... — 13,670 1,384Due after 2 years through 3 years ..................................... — 10,370 645Due after 3 years through 4 years ..................................... — 2,550 345 Due after 4 years through 5 years ..................................... 10,000 10,830 145Due after 5 years ........................ — 115 74
Thousands of U.S. Dollars
BondsLong-term
loansLease
obligations
Due in 1 year or less ................... $ — $ 7,637 $21,648Due after 1 year through 2 years ..................................... — 164,402 16,645Due after 2 years through 3 years ..................................... — 124,714 7,757Due after 3 years through 4 years ..................................... — 30,667 4,149 Due after 4 years through 5 years ..................................... 120,265 130,247 1,744Due after 5 years ........................ — 1,383 890
OverviewYear ended March 31, 2010(a) Policy for financial instrumentsIn consideration of plans for capital investment, the Company and its consolidated subsidiaries invests funds provided by operating cash flows. The Group uses bond issuances and bank borrowings in order to raise additional funds, if needed. The Company manages temporary cash surpluses through low-risk financial assets. The Company uses derivatives for the purpose of reducing risk and does not enter into derivatives for speculative or trading purposes.(b) Types of financial instruments and related riskTrade receivables — trade notes and accounts receivable — are exposed to credit risk in relation to customers. In addition, the Company is exposed to foreign currency exchange risk arising from receivables denominated in foreign currencies. The foreign currency exchange risks deriving from the trade receivables denominated in foreign currencies are hedged by forward foreign exchange contracts, if needed.

36
Investment securities are exposed to market risk. Those securities are composed of mainly the shares of common stock of companies with which the Company has business relationships. Trade payables — trade notes and accounts payable — have payment due dates within one year. Although the Company is exposed to foreign currency exchange risk arising from those payables denomi-nated in foreign currencies, forward foreign exchange contracts are arranged to reduce the risk, if needed. Loans payables and bonds are used to raise funs mainly in con-nection with capital investments. The repayment dates of the long-term debt extend up to five years from the balance sheet date. Long-term debt with variable interest rates is exposed to interest rate fluctuation risk. However, to reduce such risk and fix interest expense for long-term debt with variable rates, the Company utilizes interest rate swap transactions as a hedging instrument. Regarding derivatives, the Company enters into forward foreign exchange contracts to reduce the foreign currency exchange risk arising from the receivables and payables denominated in foreign currencies. The Company also enters into interest rate swap transactions to reduce the fluctuation risk of interest payable for long-term debt with variable rates. Information regarding the method of hedge accounting, hedging instruments and hedged items, hedging policy, and the assessment of the effectiveness of hedging activities is found in Note 2 (p).
(c) Risk management for financial instruments (i) Monitoring of credit risk (the risk that customers or counterparties
may default)In accordance with the internal policies of the Company for managing credit risk arising from receivables, each related division monitors credit worthiness of their main customers periodically, and monitors due dates and outstanding balances by individual customer. In addition, the Company is making efforts to identify and mitigate risks of bad debts from customers who are having financial difficulties. The consolidated subsidiaries also manage credit risk using the Company’s internal policies and methods. The Company also believes that the credit risk of derivatives is insignificant as it enters into derivative transactions only with financial institutions which have a high credit-rating.
(ii) Monitoring of market risk (the risk arising from fluctuations in foreign exchange rates, interest rates and others)For trade receivables and payables denominated in foreign currencies, the Company identifies the foreign currency exchange risk for each currency on a monthly basis and enters into forward foreign exchange contracts to hedge such risk. In order to mitigate the interest rate risk for loans payable bearing interest at variable rates, the Company may also enter into interest rate swap transactions. For investment securities, the Company periodically reviews the fair values of such financial instruments and the financial position of the issuers. In addition, the Company continuously evaluates whether securities other than those classified as held-to-maturity should be maintained taking into account their fair values and relationships with the issuers. In conducting derivative transactions, the division in charge of each derivative transaction follows the internal policies, which set forth delegation of authority. Monthly reports including actual transaction data are submitted to top management for their review. The consolidated subsidiaries also conduct derivative transactions using the Company’s internal policies.
(iii) Monitoring of liquidity risk (the risk that the Company may not be able to meet its obligations on scheduled due dates)Based on the report from each division, the Company prepares and updates its cash flow plans in a timely basis to manage liquid-ity risk. The consolidated subsidiaries manage the liquidity risk using cash flow plans and report to the Company periodically.
(d) Supplementary explanation of the estimated fair value of financial instruments
The fair value of financial instruments is based on their quoted market price, if available. When there is no available quoted market price avail-able, fair value is reasonably estimated. Since various assumptions and factors are reflected in estimating the fair value, different assumptions and factors could result in different fair value. In addition, the notional amounts of derivatives in Note 19 Derivative Transactions-Supplemental Explanation on Quantitative Information are not necessarily indicative of the actual market risk involved in derivative transactions.
Estimated Fair Value of Financial InstrumentsCarrying value of financial instruments on the consolidated balance sheet as of March 31, 2010 and estimated fair value are shown in the following table. The following table does not include financial instru-ments for which it is extremely difficult to determine the fair value (Please refer to Note (ii) below).
Year ended March 31, 2010
Millions of Yen
Carrying amount
Estimated fair value Difference
Assets Cash on hand and in banks ..... ¥ 45,646 ¥ 45,646 ¥ — Trade notes and accounts
receivable .............................. 42,431 42,424 (6) Securities: Other securities with
maturity .............................. 50 50 — Other securities .................... 30,148 30,148 —Total assets ................................ ¥118,276 ¥118,269 ¥ (6)Liabilities Trade notes and accounts
payable ................................. ¥ 36,232 ¥ 36,232 ¥ — Short-term borrowings ............ 13,722 13,722 — Current portion of long-term
debt ...................................... 667 669 1 Bonds with maturity within
one year ................................ 10,000 10,012 12 Long-term debt ....................... 28,170 28,609 439Total liabilities ............................. ¥ 88,792 ¥ 89,246 ¥453Derivatives (*) .............................. ¥ (358) ¥ (358) ¥ —
(*) The value of assets and liabilities arising from derivatives is shown at net value, and with the amount in parentheses representing net liability position.
(i) Method to determine the estimated fair value of financial instruments and other matters related to securities and derivative transactions
AssetsCash on hand and in banksThe carrying amount is used for bank deposits without maturities, because the fair value approximates the carrying value. The fair value of time deposits in banks with maturities is calculated based on the present value of the total principal and interest discounted at a rate

37
supposing a newly made deposit.Trade notes and accounts receivables These fair values are calculated by categories of the remaining periods of the receivables based on the present value using discount rates determined by the period to maturity and credit risk.SecuritiesThe carrying amount is used for other securities with maturities, because the fair value approximates the carrying amount. Quoted market price is used for other securities.
LiabilitiesTrade notes and accounts payable and short-term borrowingsThe carrying amount is used for these items because the fair value approximates the carrying amount.Current portion of long-term debt, bonds with maturity within one year and long-term debtThese fair values are calculated by applying a discount rate, based on the assumed interest rate if similar new debt is issued, to the total of the principal and interest. The current portion of long-term debt and long-term debt with variable interest rates are subject to the special treatment of interest rate swaps and is calculated by applying a discount rate, based on the assumed interest rate if similar new debt is issued, to the total of the principal and interest including that of the interest rate swap. Derivative TransactionsPlease refer to Note 19, Derivative Transactions, of these notes to the consolidated financial statements.
(ii) Financial instruments for which it is extremely difficult to determine the fair value
Millions of Yen2010
Unlisted stocks ......................... ¥2,217
Because the fair values of these financial instruments are extremely difficult to determine, given that they do not have quoted market prices and future cash flows cannot be estimated, they are not included in “Securities” in the preceding table.
(iii) Redemption schedule for receivables and securities with maturities at March 31, 2010.
Year ended March 31, 2010
Millions of Yen
Due in one year or less
Due after one year
through five years
Due after five years
Cash on hand and in banks ........ ¥45,646 ¥ — ¥—Trade notes and accounts receivable ................................. 41,849 582 —Securities: Other securities with
maturities .............................. 50 — —Total ........................................... ¥87,546 ¥582 ¥—
(iv) The redemption schedule for long-term debtYear ended March 31, 2010
Millions of Yen
BondsLong-term
loansLease
obligations
Due in 1 year or less ................... ¥10,000 ¥ 667 ¥2,026Due after 1 year through 2 years ..................................... — 635 1,674Due after 2 years through 3 years ..................................... — 13,670 1,258Due after 3 years through 4 years ..................................... — 10,370 525 Due after 4 years through 5 years ..................................... — 2,550 247Due after 5 years ........................ — 945 149
Effective the year ended March 31, 2010, the Company and its domes-tic consolidated subsidiaries adopted the “Accounting Standard for Financial Instruments” (ASBJ Statement No. 10, March 10, 2008) and the “Implementation Guidance on Accounting Standard for Financial Instruments” (ASBJ Guidance, No. 19, March 10, 2008).
18. SecuritiesWhen their fair values have declined by 50% or more, impairment losses are recorded on those securities. When their fair values have declined by 30% up to 50%, impairment losses are recorded on those securities on individual basis to the values are considered to be recoverable individually.
March 31, 2011(a) Held-to-maturity securities:
Millions of Yen
Fair valueCarrying amount
Unrealizedgain (loss)
Fair value does not exceed carrying amount: Other ....................................... ¥44 ¥44 ¥— Total .............................. ¥44 ¥44 ¥—
Thousands of U.S. Dollars
Fair valueCarrying amount
Unrealizedgain (loss)
Fair value does not exceed carrying amount: Other ....................................... $529 $529 $— Total .............................. $529 $529 $—
(b) Other securities:Millions of Yen
Acquisitioncost
Carryingamount
Unrealizedgain (loss)
Carrying amount exceeds acquisition cost: Stocks ..................................... ¥10,043 ¥14,629 ¥4,586Carrying amount does not exceed acquisition cost: Stocks ..................................... 14,156 10,726 (3,430) Total .............................. ¥24,199 ¥25,356 ¥1,156

38
Thousands of U.S. Dollars
Acquisitioncost
Carryingamount
Unrealizedgain (loss)
Carrying amount exceeds acquisition cost: Stocks ..................................... $120,782 $175,935 $55,153Carrying amount does not exceed acquisition cost: Stocks ..................................... 170,247 128,996 (41,251) Total .............................. $291,028 $304,943 $13,903
March 31, 2010(a) Held-to-maturity securities:
Millions of Yen
Fair valueCarrying amount
Unrealizedgain (loss)
Fair value does not exceed carrying amount: Other ....................................... ¥50 ¥50 ¥— Total .............................. ¥50 ¥50 ¥—
(b) Other securities:Millions of Yen
Acquisitioncost
Carryingamount
Unrealizedgain (loss)
Carrying amount exceeds acquisition cost: Stocks ..................................... ¥15,699 ¥21,910 ¥6,211Carrying amount does not exceed acquisition cost: Stocks ..................................... 8,832 7,582 (1,250) Total .............................. ¥24,532 ¥29,492 ¥4,960
19. Derivative Transactions
Year ended March 31, 2011(a) Derivatives not subject to hedge accountingNone applicable(b) Derivatives subject to hedge accountingThe contract amounts or the amount corresponding to principal as specified by the contract as of the date of the closing of the consolidated accounts is shown below by type of hedge accounting method. (i) Currency-related transactions
Millions of YenHedge accounting method Type of derivative Principal items hedged Contract amount Fair value
Allocation method Foreign exchange forward contracts Notes and accounts receivable Over one yearSell:
U.S. dollars ....................................................................................... ¥ 3,641 ¥197 ¥151Euros................................................................................................ 341 29 (14)
Foreign exchange forward contracts Notes and accounts payableBuy:
U.S. dollars ....................................................................................... ¥10,163 ¥ 49 ¥ (2)Euros................................................................................................ 1,045 — 29Sterling pound .................................................................................. 283 — 7
Thousands of U.S. DollarsHedge accounting method Type of derivative Principal items hedged Contract amount Fair value
Allocation method Foreign exchange forward contracts Notes and accounts receivable Over one yearSell:
U.S. dollars ....................................................................................... $ 43,788 $2,369 $1,816Euros................................................................................................ 4,101 349 (168)
Foreign exchange forward contracts Notes and accounts payableBuy:
U.S. dollars ....................................................................................... $122,225 $ 589 $ (24)Euros................................................................................................ 12,568 — 349Sterling pound .................................................................................. 3,403 — (84)
Note: Calculation of fair value is based on the forward exchange rate.

39
(ii) Interest-related transactionsMillions of Yen
Hedge accounting method Type of derivative Principal items hedged Contract amount Fair value
Special treatment for interest rate swaps Receive/floating and pay/fixed Over one year
Current portion of long-term borrowingsLong-term borrowings ............... ¥23,180 ¥23,000 (*)
Thousands of U.S. DollarsHedge accounting method Type of derivative Principal items hedged Contract amount Fair value
Special treatment for interest rate swaps Receive/floating and pay/fixed Over one year
Current portion of long-term borrowingsLong-term borrowings ............... $278,773 $276,609 (*)
(*) Since interest rate swap contracts accounted for by the special treatment for interest rate swaps are treated together with the long-term bor-rowings subject to hedging, the estimated fair value of such interest rate swap contract is included in the estimated fair value of the corre-sponding long-term borrowings.
Note: Calculation of fair value is based on the stated price by financial institutions.
Year ended March 31, 2010(a) Derivatives not subject to hedge accountingNone applicable(b) Derivatives subject to hedge accountingThe contract amounts or the amount corresponding to principal as specified by the contract as of the date of the closing of the consolidated accounts is shown below by type of hedge accounting method. (i) Currency-related transactions
Millions of YenHedge accounting method Type of derivative Principal items hedged Contract amount Fair value
Allocation method Foreign exchange forward contracts Notes and accounts receivable Over one yearSell:
U.S. dollars ....................................................................................... ¥6,087 ¥1,396 ¥ (41)Euros................................................................................................ 129 — 5
Foreign exchange forward contracts Notes and accounts payableBuy:
U.S. dollars ....................................................................................... ¥ 117 ¥ — ¥ 0Euros................................................................................................ 4,042 1 (315)Sterling pound .................................................................................. 139 — (7)
Note: Calculation of fair value is based on the forward exchange rate.
(ii) Interest-related transactionsMillions of Yen
Hedge accounting method Type of derivative Principal items hedged Contract amount Fair value
Special treatment for interest rate swaps Receive/floating and pay/fixed Over one year
Current portion of long-term borrowingsLong-term borrowings ............... ¥23,540 ¥23,360 (*)
(*) Since interest rate swap contracts accounted for by the special treatment for interest rate swaps are treated together with the long-term bor-rowings subject to hedging, the estimated fair value of such interest rate swap contract is included in the estimated fair value of the corre-sponding long-term borrowings.
Note: Calculation of fair value is based on the stated price by financial institutions.

40
20. Employees’ Retirement Benefit PlansThe following table sets forth the funded and accrued status of the plans, and the amounts recognized in the accompanying consolidated balance sheets at March 31, 2011 and 2010 for the Company’s and the consolidated subsidiaries’ defined benefit pension plans:
Millions of YenThousands of U.S. Dollars
2011 2010 2011
Retirement benefit obligation .... ¥(28,507) ¥(28,685) $(342,838)Plan assets at fair value ............ 14,902 15,332 179,218Unfunded retirement benefit obligation ................................ (13,604) (13,352) (163,608)Unrecognized net retirement benefit obligation at transition .... — — —Unrecognized actuarial loss ...... 5,980 6,219 71,918Unrecognized prior service cost ........................................ 554 694 6,663Net retirement benefit obligation ................................ (7,069) (6,438) (85,015)Accrued retirement benefits ...... (9,339) (8,520) (112,315)Prepaid pension cost ................ ¥ 2,270 ¥ 2,082 $ 27,300
The components of retirement benefit expenses for the years ended March 31, 2011 and 2010 are outlined as follows:
Millions of YenThousands of U.S. Dollars
2011 2010 2011
Service cost .............................. ¥1,759 ¥1,653 $21,155Interest cost ............................. 324 319 3,897 Expected return on plan assets ............................ (213) (190) (2,562)
Amortization of net retirement benefit obligation at transition ............................. — 765 —Amortization of actuarial loss .... 1,425 1,479 17,138 Amortization of prior service cost .................... 140 140 1,684Retirement benefit expenses..... ¥3,436 ¥4,166 $41,323
The assumptions used in accounting for the above plans were as follows:
2011 2010
Discount rate .......................................... 1.50% 1.50%Expected rate of return on plan assets.... 1.50% 1.50%
21. Income TaxesThe Company has omitted the reconciliation between the statutory tax rate and the effective tax rates for financial statement purposes for the years ended March 31, 2011 and 2010 because the difference between these rates was less than 5%. The significant components of the Company’s deferred tax assets and liabilities at March 31, 2011 and 2010 were as follows:
Millions of YenThousands of U.S. Dollars
2011 2010 2011
Deferred tax assets: Accrued enterprise taxes ....... ¥ 610 ¥ 506 $ 7,336 Accrued bonuses .................. 1,410 1,402 16,957 Unrealized gain on
intercompany transactions ... 816 677 9,814 Accrued retirement benefits
for employees ...................... 4,994 4,032 60,060 Accrued retirement benefits
for directors and corporate auditors ............................... 131 128 1,575
Loss on revaluation of inventory items .................... 748 501 8,996
Loss on revaluation of financial instruments ............ 282 289 3,391
Impairment loss ..................... 138 — 1,660 Depreciation .......................... 1,158 1,144 13,927 Amortization of deferred
assets ................................. 151 211 1,816 Provision for warranties for
completed construction ....... 693 502 8,334 Provision for loss on
construction contracts ......... 2,076 737 24,967 Asset retirement obligations ... 555 — 6,675 The percentage-of-
completion method ............. 727 — 8,743 PCB disposal expenses ......... — 162 — Tax loss carry forwards ......... 2,640 2,306 31,750 Deferred loss on hedges........ 21 199 253 Unrealized loss on
investment securities ........... 1,386 505 16,669 Other ..................................... 298 319 3,584Gross deferred tax assets ......... 18,843 13,626 226,615 Valuation allowance ............... (3,747) (3,363) (45,063)Total deferred tax assets .......... 15,095 10,262 181,539
Deferred tax liabilities: Reserve for advanced
depreciation ........................ 2,299 2,411 27,649 Reserve for special
depreciation ........................ 2,360 1,480 28,382 Prepaid pension cost ............. 919 246 11,052 Disposal cost with asset
retirement obligations .......... 349 — 4,197 Unrealized gain on
investment securities ........... 1,855 2,514 22,309 Deferred gain on hedges ....... 91 54 1,094 Reversal of allowance for
doubtful accounts ............... — 48 — Other ..................................... 13 29 156Total deferred tax liabilities ........ 7,887 6,784 94,853Net deferred tax assets............. ¥ 7,207 ¥ 3,478 $ 86,675

41
22. Asset Retirement ObligationsYear ended March 31, 2011The following table presents the changes in asset retirement obligations for the year ended March 31, 2011:
Millions of YenThousands of U.S. Dollars
Balance at April 1, 2010 ........... ¥1,338 $16,091Liabilities incurred due to the acquisition of property, plant and equipment ....................... 14 168Accretion expense .................... 18 216Balance at March 31, 2011 ...... ¥1,371 $16,488
23. Investment and Rental PropertiesEffective the year ended March 31, 2010, the Company and its domestic consolidated subsidiaries adopted the “Accounting Standard for Investment and Rental Properties” (ASBJ Statement No. 20, November 28, 2008) and the “Implementation Guidance on Accounting Standard for Investment and Rental Properties” (ASBJ Guidance, No. 23, November 28, 2008). The Company has omitted the disclosure of Investment and Rental Properties due to immateriality for the years ended March 31, 2011 and 2010.
24. Segment InformationEffective the fiscal year ended March 31, 2011, the Company has adopted the new accounting standards for disclosures about segments of an enterprise and related information. Segment information for the year ended March 31, 2010 has been restated in accordance with such accounting standards for comparative purposes. The reportable segments of the Group are components for which discrete financial information is available and whose operating results are regularly reviewed by the Executive Committee to make decisions about resource allocation and to assess performance. The Steel and Energy Products segment includes steel castings and forgings, steel plates, pressure vessels and steel structures. The Industrial Machinery Products segment includes injection molding machines, film and sheet machinery, blow molding machines, magnesium injection molding machines, waste treatment equipment and manufacturing equipment for electronic products. The Real Estate and Other Businesses segment includes regional development.
Millions of YenReportable segments
Total
Adjustmentsand
eliminations ConsolidatedYear ended March 31, 2011
Steel and Energy
Products
Industrial Machinery Products
Real Estate and Other
Businesses
Sales and operating income: Sales to third parties .................................................... ¥112,915 ¥ 97,664 ¥ 2,349 ¥212,929 ¥ — ¥212,929 Intra-segment sales and transfers ................................ 2,853 5,331 3,075 11,260 (11,260) —Total sales ......................................................................... 115,769 102,996 5,425 224,190 (11,260) 212,929Operating income ............................................................. ¥ 25,059 ¥ 3,253 ¥ 715 ¥ 29,027 ¥ (532) ¥ 28,495
Assets, depreciation, and capital expenditures: Total assets ................................................................. ¥167,573 ¥ 89,477 ¥13,610 ¥270,661 ¥68,602 ¥339,263 Depreciation and amortization....................................... 16,492 3,042 301 19,837 165 20,003 Capital expenditures .................................................... 25,217 1,309 73 26,600 121 26,722
Thousands of U.S. DollarsReportable segments
Total
Adjustmentsand
eliminations ConsolidatedYear ended March 31, 2011
Steel and Energy
Products
Industrial Machinery Products
Real Estate and Other
Businesses
Sales and operating income: Sales to third parties .................................................... $1,357,968 $1,174,552 $ 28,250 $2,560,782 $ — $2,560,782 Intra-segment sales and transfers ................................ 34,311 64,113 36,981 135,418 (135,418) —Total sales ......................................................................... 1,392,291 1,238,677 65,244 2,696,212 (135,418) 2,560,782Operating income ............................................................. $ 301,371 $ 39,122 $ 8,599 $ 349,092 $ (6,398) $ 342,694
Assets, depreciation, and capital expenditures: Total assets ................................................................. $2,015,310 $1,076,091 $163,680 $3,255,093 $825,039 $4,080,132 Depreciation and amortization....................................... 198,340 36,584 3,620 238,569 1,984 240,565 Capital expenditures .................................................... 303,271 15,743 878 319,904 1,455 321,371
Notes 1: Adjustments and eliminations for segment profit of ¥532 million ($6,398 thousand) include elimination of inter-segment profit on inventories and corporate general administration expense which are not allocable to a reportable segment.
2: Adjustments and eliminations for segment assets of ¥68,602 million ($825,039 thousand) include offset of inter-segment debt and credit, and corporate assets which are not allocable to a reportable segment.
3: Adjustments and eliminations for depreciation and amortization of ¥165 million ($1,984 thousand) include depreciation and amortization for corporate assets.
Adjustments and eliminations for capital expenditures of ¥121 million ($1,455 thousand) include capital expenditures for corporate assets.

42
Millions of YenReportable segments
Total
Adjustmentsand
eliminations ConsolidatedYear ended March 31, 2010
Steel and Energy
Products
Industrial Machinery Products
Real Estate and Other
Businesses
Sales and operating income: Sales to third parties .................................................... ¥121,921 ¥77,356 ¥ 2,402 ¥201,680 ¥ — ¥201,680 Intra-segment sales and transfers ................................ 3,170 4,496 2,826 10,493 (10,493) —Total sales ......................................................................... 125,091 81,852 5,229 212,174 (10,493) 201,680Operating income ............................................................. ¥ 30,187 ¥ 1,308 ¥ 740 ¥ 32,235 ¥ (50) ¥ 32,185
Assets, depreciation, and capital expenditures: Total assets ................................................................. ¥148,024 ¥84,571 ¥13,640 ¥246,237 ¥764,748 ¥322,986 Depreciation and amortization....................................... 10,772 3,107 324 14,203 218 14,422 Capital expenditures .................................................... 30,256 1,169 47 31,472 391 31,864
Notes 1: Adjustments and eliminations for segment profit of ¥50 million include elimination of inter-segment profit on inventories and corporate gen-eral administration expense, which are not allocable to a reportable segment.
2: Adjustments and eliminations for segment assets of ¥76,748 million include offset of inter-segment debt and credit, and corporate assets which are not allocable to a reportable segment.
3: Adjustments and eliminations for depreciation and amortization of ¥218 million include depreciation and amortization for corporate assets. Adjustments and eliminations for capital expenditures of ¥391 million include capital expenditures for corporate assets.
(Additional Information)Effective the year ended March 31, 2011, the Company adopted the “Accounting Standard for Disclosures about Segments of an Enterprise and Related Information” (ASBJ Statement No. 17, March 27, 2009) and the “Implementation Guidance on Accounting Standard for Disclosures about Segments of an Enterprise and Related Information” (ASBJ Guidance, No. 20, March 21, 2008).
(a) Product and service informationYear ended March 31, 2011
Millions of Yen
Steel and Energy
Products
Industrial Machinery Products
Real Estate and Other
Businesses Total
Sales to third parties ... ¥112,915 ¥97,664 ¥2,349 ¥212,929
Thousands of U.S. Dollars
Steel and Energy
Products
Industrial Machinery Products
Real Estate and Other
Businesses Total
Sales to third parties ... $1,357,968 $1,174,552 $28,250 $2,560,782
(b) Geographical information (i) Sales
Year ended March 31, 2011
Millions of Yen
Japan China KoreaNorth
America Other Total
¥99,070 ¥29,836 ¥21,810 ¥10,248 ¥51,963 ¥212,929
Year ended March 31, 2011
Thousands of U.S. Dollars
Japan China KoreaNorth
America Other Total
$1,191,461 $358,821 $262,297 $123,247 $624,931 $2,560,782
(ii) Tangible assetsThe Company has omitted the disclosure of tangible assets by country or region as of March 31, 2011 because the amount of tangible assets in Japan accounted for more than 90% of the carrying amount in the Consolidated Balance Sheet.
(c) Significant customer informationThe Company has omitted the disclosure of significant customer information for the year ended March 31, 2011 because no individual customer accounted for more than 10% of net sales in the Consolidated Statement of Income.
(d) Information on loss on impairment of fixed assetsYear ended March 31, 2011Impairment loss on fixed assets by reportable segment for the year ended March 31, 2011 is summarized as follows:
Millions of Yen
Steel and Energy
Products
Industrial Machinery Products
Real Estate and Other
Businesses
Adjustments and
eliminations Total
Impairment loss ......... ¥0 ¥101 — ¥95 ¥197
Thousands of U.S. Dollars
Steel and Energy
Products
Industrial Machinery Products
Real Estate and Other
Businesses
Adjustments and
eliminations Total
Impairment loss ......... $0 $1,215 — $1,143 $2,369
(e) Amortization and balance of goodwillThe following table presents the amortization and balance of goodwill as of and for the year ended March 31, 2011 by reportable segment:
Year ended March 31, 2011
Millions of Yen
Steel and Energy
Products
Industrial Machinery Products
Real Estate and Other
Businesses
Adjustments and
eliminations Total
Amortization .............. ¥— ¥90 ¥— ¥— ¥90Balance as of March 31 ................. — 64 — — 64

43
Thousands of U.S. Dollars
Steel and Energy
Products
Industrial Machinery Products
Real Estate and Other
Businesses
Adjustments and
eliminations Total
Amortization .............. $— $1,082 $— $— $1,082Balance as of March 31 ................. — 770 — — 770
The following table presents the amortization and balance of negative goodwill arising from business combinations on or prior to March 31, 2010 as of and for the year ended March 31, 2011 by reportable segment:
Millions of Yen
Steel and Energy
Products
Industrial Machinery Products
Real Estate and Other
Businesses
Adjustments and
eliminations Total
Amortization .............. ¥— ¥ 71 ¥— ¥— ¥ 71Balance as of March 31 ................. — 286 — — 286
Thousands of U.S. Dollars
Steel and Energy
Products
Industrial Machinery Products
Real Estate and Other
Businesses
Adjustments and
eliminations Total
Amortization .............. $— $ 854 $— $— $ 854Balance as of March 31 ................. — 3,440 — — 3,440
(f) Information on gain on negative goodwillNone applicable
Year ended March 31, 2010(a) Business segment informationThe Company and its consolidated subsidiaries operate in the following three business segments:
• Operations in the steel products segment include steel castings and forgings, steel plates, pressure vessels and steel structures.• Operations in the machinery products segment include injection molding machines, film and sheet machinery, blow molding machines, magne-
sium injection molding machines, waste treatment equipment and manufacturing equipment for electronic products.• Operations in the regional development segment include the Fuchu Intelligent Park Project and the leasing of real estate.
Millions of Yen
Year ended March 31, 2010Steel
ProductsMachinery Products
Regional Development Total
Eliminations and corporate Consolidated
Sales and operating income: Sales to third parties .................................................... ¥101,736 ¥98,164 ¥ 1,779 ¥201,680 ¥ — ¥201,680 Intra-segment sales and transfers ................................ 1,653 1,210 6 2,870 (2,870) — Net sales ..................................................................... 103,390 99,375 1,785 204,551 (2,870) 201,680 Operating expenses ..................................................... 71,749 92,839 1,052 165,641 3,853 169,494 Operating income ........................................................ ¥ 31,640 ¥ 6,535 ¥ 733 ¥ 38,909 ¥ (6,723) ¥ 32,185Total assets, depreciation expense, loss on impairment of goodwill and capital expenditures: Total assets ................................................................. ¥145,635 ¥85,943 ¥12,711 ¥244,290 ¥78,696 ¥322,986 Depreciation expense .................................................. 10,564 3,329 305 14,199 223 14,422 Loss on impairment of goodwill .................................... — — — — — — Capital expenditures .................................................... 30,251 1,178 42 31,472 391 31,864
(b) Geographical segment informationThe Company has omitted the disclosure of geographical segment information for the year ended March 31, 2010 because net sales and total assets in Japan accounted for more than 90% of those of all segments.
(c) Overseas sales informationOverseas sales, which include export sales of the Company and its domestic consolidated subsidiaries, and sales (other than exports to Japan) of its overseas consolidated subsidiaries, for the year ended March 31, 2010 is summarized as follows:
Millions of Yen
East AsiaNorth
America Other Total
Overseas sales .................. ¥45,013 ¥20,256 ¥28,633 ¥ 93,903Consolidated net sales ...... ¥201,680Overseas sales as a percentage of consolidated net sales (%) ..................... 22.3 10.0 14.2 46.6

44
25. Shareholders’ EquityThe Corporation Law of Japan provides that an amount equal to 10% of the amount to be disbursed as distributions of capital surplus (other than the capital reserve) and retained earnings (other than the legal reserve) be transferred to the capital reserve and the legal reserve, respectively, until the sum of the capital reserve and the legal reserve equals 25% of the capital stock account. Such distributions can be made at any time by resolution of the meeting of shareholders, or by the Board of Directors if certain conditions are met.
26. Amounts per ShareNet income per share is calculated based on the net income available for distribution to shareholders of common stock and the weighted-average number of shares of common stock outstanding during the year. Net assets per share are calculated based on the number of shares of common stock outstanding at year end. Amounts per share at March 31, 2011 and 2010 and for the years then ended were as follows:
Yen U.S. Dollars2011 2010 2011
Net income ............................... ¥ 44.54 ¥ 47.22 $0.54Net assets ................................ 322.98 296.13 3.88

45
Report of Independent Auditors