Embed Size (px)
Citation preview

The Involvement of Aquaporins in
Ammonia/Ammonium
Transport Across Root Cell Membranes
of Barley (Hordeum vulgare L.)
by
Alexander Becker
A thesis submitted in conformity with the requirements
for the degree of Master of Science
Ecology and Evolutionary Ecology
University of Toronto
© Copyright by Alexander Becker 2011

ii abstract
The Involvement of Aquaporins in Ammonia/Ammonium
Transport Across Root Cell Membranes of Barley
(Hordeum vulgare L.)
Alexander Becker
Master of Science
Ecology and Evolutionary Biology
University of Toronto
2011
Abstract
Using the short-lived radiotracer 13
N, we examined the hypothesis that toxic, futile
ammonia/ammonium (NH3/NH4+) fluxes at high external concentrations are mediated by
ammonia-transporting aquaporins in roots of intact barley (Hordeum vulgare L.) plants.
Effects of the aquaporin inhibitors zinc, copper, mercury, gold, silver, hydrogen peroxide,
propionic acid, and nitrogen gas supported this hypothesis. Further tests with these
inhibitors showed that changes in plant water potential and water content could be linked to
NH3/NH4+ fluxes. An increase in external pH, causing an increase of NH3 in the nutrient
solution, resulted in large increases of 13
N influx, which can only be explained in energetic
terms if the transported solute is neutrally charged. Taken together, the evidence here
strongly supports the proposed hypothesis.

iii acknowledgments
Acknowledgments
I would like to sincerely thank everybody who was there for me on the way to the Master‘s
thesis. In particular, my thanks go to my supervisor Dr. Herbert J. Kronzucker, research
associate Dr. Dev T. Britto, and my secret lab assistant Lasse Schulze, who were always
helpful to solve any problems that I had. Research in the laboratory was a great new
experience in my life, which resulted in a lot of new and good impressions.
Of course, many thanks also go to Devrim Coskun, Mena Abdel-Nour, Imtiaz Kabir, Iman
Hussain, and Manni Singh, and to my other lab members for their assistance in
experiments.
In particular my thanks go to Geoffrey Ryan Lui for editing my thesis, baking cookies, and
listening to my problems. I am very sorry for any troubles that I made, but it is always
really enjoyable with you and I am happy having you around me.
Finally, I don‘t want to forget my friends and family. Every time they have been there for
me and have believed in me.
A thousand thank to my friends and family members for the spiritual, moral, and financial
support. ―Großen Dank an meine Freunde und Familienangehörigen für die seelische,
moralische und finanzielle Unterstützung.―

iv table of contents
Table of Contents
Abstract ii
Acknowledgements iii
Table of contents iv-v
List of figures vi-vii
1. Introduction 1
1.1. Worldwide cereals situation 1
1.2. The role of nitrogen 1
1.3. Possible ways in which nitrogen may pass 3
through the root cell membrane
1.4. The importance of aquaporins 6
1.5. Involvement of aquaporins in nitrogen transport 7
2. Materials and methods 9
2.1. Germination and growth conditions 9
2.2. Tissue Potassium analyses 10
2.3. Direct influx 10
2.3.1. Metals which bind to the extracellular side of the membrane 11
2.3.2. Inhibitors which bind to the cytosolic side of the membrane 11
2.3.3. pH changes and concentration changes of NH4+ and NH3 12
2.3.4. Harvesting of the plants 12
2.4. Measuring of root and leaf water potential with a pressure bomb 12
(Scholander bomb)
2.5. Water content of barley plants 13
2.6. Statistical analyses 13

v table of contents
3. Results and short discussion 14
3.1. Tissue potassium analyses 14
3.2. Metals which bind to the extracellular side of the membrane 17
3.3. Inhibitors which bind to the cytosolic side of the membrane 23
3.4. pH changes and concentration changes in NH4+ and NH3 concentration 25
3.5. Measuring of root and leaf water potential with a pressure bomb 28
(Scholander bomb)
3.6. Water content of barley plants 30
4. Discussion 32
4.1 How K+ increases the biomass and its relation to aquaporins 32
4.2. Metals which bind to the extracellular side of aquaporins 33
4.2.1. The metals mercury, copper, zinc, calcium, and lanthanum 33
4.2.2. Gold, silver, and mercury as aquaporin inhibitors 34
4.3. Inhibitors which bind to the cytosolic side of aquaporins 35
4.4. Who is the winner: NH4+ or NH3? 37
4.5. The linkage of NH3/NH4+ transport with water transport 43
4.6. Influence of K+ on NH3/NH4
+ fluxes 45
4.7. Conclusion 46
4.8. Future role and issues 47
5. References 48

vi list of figures
List of Figures
Figure 1 Potassium content in roots and shoots of barley plants (Hordeum vulgare L.)
grown in nutrient solution with 10 mM of NH3/NH4+. (page 15)
Figure 2 Growth of barley plants under 0.0225, 0.1125, and 5 mM K+. (page 16)
Figure 3 Influence of 1 mM cupper (Cu2+
), 10 mM calcium (Ca2+
), 10 mM mercury
(Hg2+
), 10 mM zinc (Zn2+
) or 10 mM lanthanum (La 3+
) on the influx of 13
N-
labeled NH3/NH4+ in barley roots. (page 18)
Figure 4 Influence of additional pharmacological treatments on the influx of 13
N-labeled
NH3/NH4+ into intact barley roots. (page 20)
Figure 5 Influence of additional pharmacological treatments on the influx of 13
N-labeled
NH3/NH4+ into intact barley roots when transferred from 5 mM K
+ growth
solution to 0.0225 mM K+ nutrient test solution (page 22)
Figure 6 Influence of pharmacological treatments (nitrogen gas, 20 mM propionic acid,
and 2 mM hydrogen peroxide as applied to the hydroponic rooting medium) on
the influx of 13
N-labeled NH3/NH4+ into intact barley roots. (page 24)
Figure 7 Influence of pH gradients on the influx of 13
N-labeled NH3/NH4+ into intact
barley roots. (page 26)
Figure 8 Influence of pH gradients on the influx of 13
N-labeled NH3/NH4+ into intact
barley roots (page 27)
Figure 9 Influence of pharmacological treatments (500 µM gold, 500 µM mercury,
500 µM silver) on the water potential (in MPa) in root xylem of intact barley
roots. (page 29)
Figure 10 Change of water content in leaves and roots of barley plants grown in a nutrient
solution contained 10 mM of NH3/NH4+. (page 31)
Figure 11 Illustration of an aquaporin in the plasmalemma. (page 38)

vii list of figures
Figure 12 Illustration of the molecular structures of NH3, NH4+, water, and hydronium.
(page 41)
Figure 13 Illustration of a plant cell in a barley root. (page 42)
Figure 14 Illustration of barley root tips. (page 44)

1 introduction
1. Introduction
1.1. Worldwide cereals situation
Cereals are the most important staple foods for the world population. Each year, farmers
produce over two million tons of cereals worldwide (GRABOWSKI and ROLFE, 2006).
Canada is the world leader in barley production with an annual production of about
27 000 hectogram per hectare (FAO, 2009). However, critical problems such as over-
fertilization of agricultural land and the worldwide shortage of water are decreasing crop
yields all over the world (CARVAJAL et al., 1999). It is evident that more efficient uses of
fertilizer and water in agriculture will be required in order to feed the world.
1.2. The role of nitrogen
Nitrogen is an important constituent in many molecules. For instance it can be found in
amino acids, amides, proteins, nucleic acids, nucleotides, coenzymes, alkaloids, and
chlorophyll (TAIZ and ZEIGER (2007). Thus, an optimal supply and use of nitrogen is
essential for optimal plant growth. Over the last two centuries, the importance of nitrogen
has been recognized with the discovery of nitrogen fixation and the use of nitrogen as a
fertilizer. Growing crops and cereals without any nitrogen fertilization would substantially
reduce worldwide agricultural production. Standards of modern life were reached by a
higher fertilization of crops with nitrogen and other nutrients. A present problem with the
higher fertilization is the increasing anthropogenic influence on global material cycles like
the nitrogen cycle (GRUBER and GALLOWAY, 2008). Today, anthropogenic fixation is about
20 to 30 % higher than natural biological nitrogen fixation (GALLOWAY and COWLING,
2002). Consequences of the interference with global material cycles include the salinization
of fields (SQUIRES, 1994), the eluviations of NO3- (nitrate) in soils, and the eutrophication
of lakes and rivers. These factors have to lead to a need for optimization of nitrogen
fertilization in agriculture.

2 introduction
Of the many forms of nitrogen that are applied to fields as fertilizer, the most important
forms are NO3- and NH4
+ (MARSCHNER, 1995). As mentioned, NO3
- is readily washed out
of soil. This is not, however, the only problem with nitrogen fertilization strategies that are
based solely on nitrate. The uptake and assimilation of NO3- into the plant requires more
energy and NO3- is generally taken up at lower rates than NH3/NH4
+ (MARSCHNER, 1995).
Another advantage of NH3/NH4+ fertilization is the better constancy in time and space in
soil than for NO3- (LOQUE and VON WIREN, 2004).
Numerous publications (ASLAM et al.,
1996; KRONZUCKER et al. 1999; REISENAUER, 1966) have found that NH3/NH4+ inhibits
NO3- uptake. This represents a problem for plants growing on fields that are over salted
with NH3/NH4+. A combination of both forms results in higher vegetative growth.
It is known that a lack of nitrogen can stunt plant growth. On the other hand, an excess of
nitrogen can cause nitrogen toxicity and decreased water-use efficiency. In the cultivation
of cereals, either extreme can severely limit crop yield (BRITTO and KRONZUCKER, 2002).
Nitrogen toxicity can occur in many plant species when the nitrogen source is NH3/NH4+
(BRITTO and KRONZUCKER 2002). In previous studies, it was demonstrated that toxic fluxes
of NH4+ into barley and rice plants can be greatly reduced by an increase of the potassium
(K+) availability to the plant (BALKOS et al. 2010; SZCZERBA et al. 2008). However, a better
understanding of why this is, and of NH4+ toxicity itself, is contingent upon the
identification of the primary transport mechanism(s) by which NH3/NH4+ enters the cell.
Water, which is also crucial to plant growth, is also limited. As mentioned before, an excess
of nitrogen can cause nitrogen toxicity and decreased water-use efficiency. With an
investigation of the mechanism(s) that are responsible for the water and nitrogen fluxes in
plants and an investigation of the conditions under which these fluxes are optimal for plant
growth, the biomass of many crop and cereal plants might be increased. Investigating the
mechanisms would not be as involved and expensive or as potentially hazardous as genetic
modifications or the hit-and-miss method of breeding new cultivars. With a better
understanding of the mechanisms behind nutrient transport through the plant it is easier to
optimize nutrient fertilization. This could result in an increase of biomass and a reduction
of water and nitrogen application to the environment. In this study I want to show that a
regular agricultural procedure can be optimized and can have the potential to reduce the
anthropogenic influence on the global environment.
3 introduction
1.3. Possible ways in which nitrogen may pass through the root cell membrane
The route by which nitrogen enters plant cells is of interest because nitrogen supply is the
soil factor that, after water, most strongly limits plant productivity. There are several
mechanisms by which nitrogen may be transported into the plant cell.
The five important means by which NH3/NH4+ has been proposed to be transported are
(a) simple osmotic diffusion, (b) a high-affinity ammonium transporter (AMT),
(c) potassium channels, (d) nonselective cation channels (NSCCs), and (e) aquaporins.
Before explaining in more detail the different means of NH3/NH4+
transport, it is important
to understand that NH3/NH4+ influx shows different patterns while the concentration of the
nutrient increases.
At concentrations lower than 0.5 to 1 mM NH3/NH4+, NH3/NH4
+ will be transported under
a high-affinity transport system (HATS or mechanism 1) (BLOOM and CHAPIN, 1981;
WANG et al., 1993). While increasing the concentration of nitrogen, the fluxes increase
according to Michaelis–Menten kinetics. This means at higher nitrogen concentrations the
influx does not change as strongly with increases in concentration (EPSTEIN et al., 1963).
At concentrations over 0.5 to 1 mM NH3/NH4+, another system, named the low-affinity
transport system (LATS or mechanism 2), occurs. In a study by KRONZUCKER et al. (1996),
it was shown that one of the characteristics of LATS conditions is a linear increase of the
fluxes with the increasing concentration of ions.

4 introduction
Transport via simple osmotic diffusion (a) is the semi-selective diffusion of water and ions
through gaps or spaces in the cell membrane or passage of hydrophobic materials through
the lipid bilayer. This is thought to be possible because of the movement of the cell
membrane or because of the lipid solubility of the substrate. For a complex system such as
a plant, simple osmotic diffusion cannot account for the transport of all of the required
water and ions into plant cells. It is too slow and not very selective. Amounts that could
penetrate the cell membrane by this pathway are too small to explain measured fluxes of
NH3/NH4+ through the cell membrane (NOBEL, 2009.
In the case of AMT (b), active NH4+ transport occurs under high-affinity transport
conditions (HATS) (CAMAÑES et al., 2007; KAISER et al., 2002). AMT genes have been
identified that contain the information required to express AMTs in the cell membrane
(NINNEMANN et al., 1994) and show an involvement in NH4+ transport at low NH4
+
concentrations.
Another important type of transporter acting in the HATS and LATS range
(BRITTO and KRONZUCKER, 2008; ICHIDA et al., 1994; SANTA-MARÍA et al., 2000;
SZCZERBA et al., 2008) generally transports potassium, but has some NH4+-transport
activity (c). Potassium transporters can be separated into two major groups, KUP/HAK/KT
(K+ uptake permease/high-affinity K
+ transporter/K
+ transporter) and AKT (the Arabidopsis
K+ channel). HIRSCH et al. (1998) describe a gene (AKT1) that expresses AKT potassium
channels in Arabidopsis thaliana. Furthermore, SANTA-MARÍA et al. (1997) found a gene
(HAK1) that expresses potassium channels from the KUP/HAK/KT family in barley roots.
With the identification of transporter genes, mutant plants were created or the genes were
transferred (for instance to yeast cells) to test the transport of several ions (KIM et al., 1998;
RUBIO et al. 2000; SCHACHTMANN and SCHROEDER, 1994). NH4+ and K
+ are both
monovalent cations which have similar hydrated atomic radii (KIELLAND, 1937), and it may
be that NH4+ and K
+ have similar affinities for permeation through potassium channels like
AKT1 (NIELSEN and SCHJOERRING, 1998; SZCZERBA et al., 2008; WANG et al., 1996).
5 introduction
The third important group of transporters is made up of NSCCs (nonselective cation
channels) (d). NSCCs can be separated into three main classes related to their response to
the electrical potentials of cell membranes (KRONZUCKER and BRITTO, 2011):
(1) hyperpolarization-activated NSCCs (HA-NSCCs), (2) depolarization-activated NSCCs
(DA-NSCCs), and (3) voltage-insensitive NSCCs (VI-NSCCs). There are other classes of
NSCCs (DEMIDCHIK and MAATHUIS, 2007) that are not relevant to NH4+ transport. From
the three previously mentioned NSCCs groups, it is argued that VI-NSCCs are able to
transport monovalent cations such as Na+ and NH4
+ (DEMIDCHIK and MAATHUIS, 2007;
DEMIDCHIK et al., 2002). The transport of NH4+ through these channels is described
to function under high NH3/NH4+ concentrations (DEMIDCHICK et al., 2002;
WHITE et al., 1996) and thus under LATS conditions. It is also described that the
―nonselective‖ cation channels have a permeability order. In wheat root cells, for instance,
NH4+ should be more easily transported through NSCCs than rubidium or potassium
(DAVENPORT and TESTER, 2000). The question is whether or not it makes sense that NH4+
is allowed to freely permeate the cell membrane. Under this condition NH4+ could penetrate
the cell membrane, nonselectively, as the preferred ion. Unfortunately, unlike AMTs and
potassium channels, the evidence for the existence of NSCCs on the genetic level is still
absent (ZHANG et al., 2010). Data collected from investigations based on
electrophysiological studies have many scientists believing in and arguing for the existence
of NSCCs. Most of the data is based on patch-clamp analysis, where results obtained using
isolated protoplasts or artificial lipid bilayers are used to make assumptions regarding
whole tissue or even the whole plant behaviour. Other analyses such as tissue content
measurements, radiotracer experiments, or knock-out mutants should be helpful in further
investigating NSCCs.
In addition to these previously mentioned means of transport, there is a new possible
explanation for the transport of NH3/NH4+ under low-affinity conditions: aquaporins (e).
Studies show that NH3/NH4+, urea, and NO3
- can penetrate the cell membrane through
aquaporins. (GASPAR et al., 2003; LOQUÉ et al., 2005; MAUREL et al., 2008). Because of
possible relationship between water and NH3/NH4+ transport via aquaporins
(CARVAJAL et al., 1999), this big group of channels was investigated in this study.
6 introduction
Here, unidirectional nitrogen fluxes (influx and efflux) were always investigated under
conditions of high NH3/NH4+ concentration (10 mM), i.e. under low affinity transport
(LATS or Mechanism 2) conditions (EPSTEIN et al,. 1963). NH3/NH4+ transport systems
that function under HATS condition, such as AMTs, should be down regulated at high
external NH3/NH4+
1.4. The importance of aquaporins
At the beginning of the last decade, the discovery of aquaporins (AGRE et al., 1993) was an
important milestone in the field of cell physiology. It was later discovered that plants have
more genes that are responsible for the expression of aquaporins in their cell membranes
than any other group of organisms (KALDENHOFF et al., 2007).
MAUREL et al. (2008) define aquaporins as channel proteins present in the plasma and
intracellular membranes of plant cells that facilitate the transport of water and/or small
neutral solutes (water, urea, boric acid, silicic acid) or gases (ammonia, carbon dioxide). In
the literature, plant aquaporins are identified as being a part of a group of transmembrane
protein channels named MIPs: major intrinsic proteins. MIPs are classified under four
different groupings, depending on their locations in different membranes. The groups are
PIPs (plasma membrane intrinsic proteins), TIPs (tonoplast intrinsic proteins), NIPs
(nodulin-26-like intrinsic proteins), and SIPs (small basic intrinsic proteins). The idea that
different aquaporins are only located where they were originally found, however, is now
debated. For instance, in a study done by BARKLA et al. (1999), PIPs were also found in the
tonoplast membrane.

7 introduction
Different techniques have been used to investigate water and nitrogen flow in plants in
previous studies. Most of the investigations have focused on water potential measurements
of the xylem, hydraulic water conductivity of cells, or transpiration. Water potentials have
mostly been measured with a pressure chamber (Scholander bomb) or a cell pressure probe
sensor (BRAMLEY et al., 2009; STEUDLE, 2002). Water conductivity measurements
have also been measured with a cell pressure probe (EHLERT et al., 2009;
KNIPFER and FRICKE, 2010; STEUDLE and PETERSON, 1998). Transpiration measurements
have been conducted with a potometer or gravimetrically (BARROWCLOUGH et al., 2000;
BRAMLEY et al., 2009). All the mentioned studies have used inhibitors of aquaporins to
demonstrate an involvement of aquaporins in water transport (BRAMLEY et al., 2009;
CARVAJAL et al., 1999; EHLERT et al., 2009; JAVOT and MAUREL, 2002; VOLKOV et al.,
2007; Zhu et al., 2000). Other studies have been able to demonstrate transport of NH3/NH4+
via aquaporins. These investigations were made in model systems using frog (Xenopus)
oocytes. TIP genes were transferred into the DNA of the frog eggs, and the aquaporins
expressed in the egg-cell membranes were used for experimentation (HOLM et al., 2005;
JAHN et al., 2004; MAUREL et al., 1993; LOGUÉ et al., 2005).
1.5. Involvement of aquaporins in nitrogen transport
Aquaporins as water transport channels are very important for plant growth and, therefore,
for agriculture. In a previous study done by SZCZERBA et al. (2008), it was shown that an
increase of K+ available to a plant can prevent a toxic futile cycle of NH3/NH4
+ into and out
of the plant root, induced by high NH3/NH4+ concentration. If NH3/NH4
+ is transported via
aquaporins, then it follows that K+ may have an influence on aquaporin activity. With this
knowledge, adjustments to nutrient uptake by plants can be made, eventually leading to
nutritional optimization and increased water-use-efficiency in plants. This process could
also serve to save water that is needed elsewhere.

8 introduction
All experiments were carried out under conditions known to modify water transport
through aquaporins. Aquaporin-modifying agents such as mercury(II) chloride (HgCl2) and
channel blockers as well as different pH regimes were used to investigate their effects on
aquaporin activity. Experiments were conducted to find a relationship between water fluxes
and the transportation of NH3/NH4+ across the cell membrane via aquaporins. The
assumption is that if aquaporin blockers can reduce water flow, then they should also
reduce NH3/NH4+ fluxes if NH3/NH4
+ are being transported through aquaporins.
The transport of NH3/NH4+
over potassium channels and NSCCs is described as occurring
mostly in the form of NH4+. As NH4
+ is a positively-charged ion, its transport is always
associated with a loss of energy (BRITTO and KRONZUCKER, 2006). In this study, it is
hypothesized that observed fluxes of NH4+ can be not be adequately explained solely by
transport in form of NH4+ due to the high energy requirement. On the other hand,
aquaporins are mentioned as transporting nitrogen in form of NH3, a non-charged molecule.
For the purposes of this study, we propose that influxes of nitrogen are in the form of NH3,
and that this transport does not require any energy.
In this study, the short-lived radiotracer 13
N (t½ = 9.98 min) was used to investigate the flux
of NH3/NH4+ into and out of plant cells. Experiments measuring water content in plant
tissue and plant water potentials, using a Scholander bomb, were also conducted to
investigate the relationship between a plant‘s water potential and the activity of its
aquaporins. Furthermore, the concentration of K+ in the plant tissue was measured with a
flame-photometer to demonstrate the relationship between plant K+ content, and uptake of
NH3/NH4+ and water.

9 materials and methods
2. Materials and methods
2.1. Germination and growth conditions
Seeds of barley (Hordeum vulgare L., Cultivar ‗Metcalfe‘) were used. To prevent
contamination during growth, seeds were surface sterilized for 15 min in a
1% sodium hypochlorite solution and germinated for 3 days in acid-washed, autoclaved
sand. Germination and growth took place under an irradiation of circa
200 μmol photons m-2
s-1
(lights: Philips Econ-o-watt, F96T12) at plant height for
16 h per day. The temperature was 20 °C during the daytime and 15 °C during the
nighttime. The relative humidity was set to 60%. After germination, plants were grown
hydroponically in a 1/4 strength Johnson‘s nutrient solution (as described in JOHNSON,
1980, with modifications as described below) at pH 6.3 to 6.5 for an additional
4 days.
Plants were grown in nutrient solutions with the following K+ concentrations: 0.0225 mM,
0.1 mM, 1 mM, 5 mM, 10 mM, or 40 mM. Potassium (K+) was applied as K2SO4. Also, a
high NH3/NH4+ concentration of 10 mM (total) was applied to all nutrient solutions as
(NH4)2SO4. To make sure that the plants remained at a nutritional steady state, the growth
solutions were exchanged frequently.
Plants were grown in a walk-in growth chamber. One day before the experiments were to
take place, plants were arranged into bundles held together by plastic rings. After bundling,
the plants were returned to the growth solution for the final day of growth. For experiments
with the radioisotope 13
N, plants were transferred to an experimental radiotracer facility,
with similar irradiation and temperature conditions as the growth chamber, one day before
the experiment.

10 materials and methods
2.2. Tissue Potassium analyses
Plants were grown in 0.0225 mM K+ and 5 mM K
+ growth solutions. Before harvesting, the
plants were transferred to a 10 mM CaSO4 solution to remove potassium from the
apoplastic spaces. The fresh weights (FW) of the plant roots and shoots were measured.
Plant components were then dried in an oven at 100 °C for 3 days. The dry weights (DW)
of the plant roots and shoots were measured at this point. Next, the plant components were
homogenized and placed in vials topped off with 10 ml of 30 % nitric acid. The vials were
placed on a shaker for 3 days. After shaking, 1 ml of each mixed solution was transferred to
a 1.5 ml polyethylene vial and centrifuged for 3 min at a maximum speed of 13,000 rpm
(VWR® Micro 1814, Microcentrifuges). After centrifuging, 0.5 ml of the supernatant from
the root and 0.1 ml of the supernatant from the shoot were each diluted with distilled water
in a 10 ml polyethylene plastic vial to lower the concentration for measurement. The
potassium concentrations of all samples were measured with a flame photometer
(Cole-Parmer® Single-Channel Flame Photometer).
2.3. Direct influx
Direct influx measurements can be a helpful tool in the investigation transport into plant
cells. Over a specific time a radiotracer is applied (in the form of spiked nutrient solution)
to a plant part (usually the root). After this step, the amount of radiotracer which was
transported into the plant cell can be measured with a gamma counter to determine the
influx (normalized for time and tissue weight). Here experiments were conducted with a
short-term labeling method involving the radiotracer 13
N (t½ = 9.98 min). The radiotracer
came in the form of liquid NH3/NH4+ which was applied at the same concentration as in the
growth solution.
Bundles of plants were transferred into a series of vessels containing nutrient solution, with
one vessel also containing a small amount of radiotracer. Between experiments, different
modifications (―conditions‖) were applied to the nutrient solution.

11 materials and methods
2.3.1. Metals which bind to the extracellular side of the membrane
For each condition, all vessels contained nutrient solution with the same composition as
was used for growth (0.0225 mM K+ or 5 mM K
+), and contained one metal (500 µM Hg
2+
as HgCl2, 10 mM La3+
as LaCl3, 1 mM Cu2+
as C4H4CuO6 (copper(II)-tartrate),
500 µM Ag3+
as AgNO3,10 mM Ca2+
as CaSO4 or 10 mM Zn2+
as ZnSO4). As a first step,
bundles of 3 plants each were first placed into a vessel containing the ―pre-load solution‖
(growth condition plus changed condition and no radiotracer) for 10 min, during which the
plants adjusted to the changed condition. In a second step bundles were then placed into the
―load solution‖ (growth condition plus changed condition plus radiotracer) for 5 min to
label them with radiotracer. After labeling, plants were rinsed as the third step in the ―dip
solution‖ (growth condition plus changed condition and no radiotracer) for 5 s to remove as
much radiotracer as possible from the surface of the roots. Finally, the plants were placed
as the fifth step into the ―desorption solution‖ (growth condition plus changed condition
and no radiotracer) for 5 min to desorb radiotracer from the other extracellular spaces.
In one experiment, plants that were grown in a 5 mM K+ growth solution were tested using
vessels containing 0.0225 mM K+ growth solution. To remove most of the potassium ions
from the roots, plants were first dipped for 5 s in 0.0225 mM K+ growth solution before
they were brought into the pre-load solution. This was to prevent transferring excess K+ to
the pre-load solution.
2.3.2. Inhibitors which bind to the cytosolic side of the membrane
For each condition, all vessels contained nutrient solution of the same composition as was
used for growth (0.0225 mM K+ or 5 mM K
+), and contained one inhibitor (N2 as gas
bubbling, 2 mM H2O2, or 20 mM C3H6O2 (propionic acid) at pH 5.25 and pH 6.25).
Bundles of 3 plants were first placed for 2 h into a pre-load solution (growth condition plus
the changed condition). The bundles were then transferred to a load (labeling) solution
(same conditions as pre-load solution plus tracer) for 5 minutes. After labeling, plants were
transferred to a non-radioactive nutrient solution for 5 seconds. As a last step the plants
were dipped into a desorbing solution for 5 minutes.

12 materials and methods
2.3.3. pH changes and concentration changes of NH3 and NH4+
All vessels contained the same nutrient composition as for growth (0.0225 mM K+ or 5 mM
K+), contained the same or different concentration of NH3/NH4
+ (0.1 mM, 1 mM, 10 mM or
100 mM), and were adjusted to different pH (4.25, 6.25, 7.25, 8.25, or 9.25). The pre-
loading, loading, dip and desorption steps were conducted as described in section 2.3.1.
2.3.4. Harvesting of the plants
After the labeling procedure, the plants were harvested. The roots were separated from the
rest of the plant and spun in a centrifuge for 30 seconds at low speed. The fresh weights
were determined and the radioactivity remaining in the roots was measured using a gamma
counter (Wallac 1480 WIZARD 3‖ – PerkinElmer).
2.4. Measuring of root and leaf water potential with a pressure bomb
(Scholander bomb)
Plants were grown in 0.0225 mM K+ and 5 mM K
+ growth solution and were transferred
into nutrient solutions with different metals (500 µM Hg2+ as HgCl2, 500 µM Ag
+ as
AgNO3, Au3+ as HAuCl4 (chlorauric acid)). Additionally, plants grown with 0.0225 mM K
+
were transferred into 5 mM K+ nutrient solution and plants grown with 5 mM K
+ into with
0.0225 mM K+ nutrient solution . Plants were cut with a sharp razorblade at the hypocotyl
region and brought into the pressure bomb (PMS - Model 1000 Pressure Chamber
Instrument) to measure the water potential as per the method described in SCHOLANDER et
al. (1965). Measurements were conducted in between 11 a.m. and 1 p.m. before plant
transpiration had reached its maximum. The temperature, light, and humidity during the
measurement were the same as applied under the growth conditions.

13 materials and methods
2.5. Water content of barley plants
Plants were grown in 0.0225 mM K+, 0.1 mM K
+, 1 mM K
+, 5 mM K, 10 mM K
+ and
40 mM K+ growth solutions. Before harvesting, the plants were transferred to a 10 mM
CaSO4 solution to remove potassium from the apoplastic spaces. The fresh weights (FW) of
the plant roots and shoots were measured. Plant components were then dried in an oven at
100 °C for 3 days. The dry weights (DW) of the plant roots and shoots were measured at
this point. Plant water content was calculated by subtracting DW from FW.
2.6. Statistical analyses
The estimation of the data was first conducted with a one-factorial analysis of variance
(ANOVA, F-test) in a randomized system. The test helped to identify an existence of
significant differences between means. In case of a significant difference a second F-test
with residuals was conducted. The second test led to the assumption of variance
homogeneity. A third test of the residuals for normal distribution (skewness and kurtosis)
was the base to test significance with the multiple-comparisons Tukey-test.
The data from the experiments and their significances are shown in diagrams. To calculate
significances, means, and standard errors, the computer software STATGRAPHICS
Centurion XV Version 15.2.06, Graphpad Prism Version 5.00, and Microsoft Office Excel
2007 were used.

14 results
3. Results
3.1. Tissue potassium analyses
Potassium concentrations in plant tissues were measured for plants grown under two
potassium conditions (0.0225 mM K+ and 5 mM K
+) (Figure 1). Plants that were grown
under 5 mM K+ solution were found to have 70 to 80 % more potassium in their root and
shoot tissues than the plants that were grown in solution with 0.0225 mM K+. The effect of
potassium also manifested itself in plant growth, as shown in Figure 2. Plants grown in the
solution with 5 mM K+ appeared much healthier and greener than those grown
0.0225 mM K+ in the nutrient solution.

15 results
Figure 1 Potassium content in roots and shoots of barley plants (Hordeum vulgare L.) grown in nutrient
solution with 10 mM of NH3/NH4+
. Blue columns present plants which were grown with 0.0225 mM K+.
Green columns present plants which were grown with 5 mM K+. Means of 10 replicates ± SE are shown.
70 to 80 % more potassium was found in tissue of plants grown in the higher potassium treatment.
Measurements were conducted with a flame-photometer.

16 results
Figure 2 Growth of barley plants under 0.0225, 0.1125, and 5 mM K+ (left to right). Growth solution
contained 10 mM of NH3/NH4+. After 7 days there is an obvious difference in biomass production. Barley
plants which were grown with 5 mM K+ appeared much healthier and greener.

17 results
3.2. Metals which bind to the extracellular side of the membrane
The data shown in Figure 3 corresponds to radiotracer experiments investigating the
inhibition of aquaporin activity by metals and other inhibitors that bind extracellularly, and
were applied to plants grown in a nutrient solution contained 10 mM NH3/NH4+ at
pH 6.25. Furthermore the nutrient solutions included 0.0225 mM K+ or 5 mM K
+. All
treatments resulted in significantly decreased influxes of NH3/NH4+ in the LATS range.
Lanthanum and zinc showed over 50 % inhibition—the strongest effect for both nutrient
solution compositions (no data available for zinc in the 5 mM K+ nutrient solution).
Copper, calcium, and mercury also showed significant levels of inhibition but were not as
effective as zinc or lanthanum. At a higher potassium concentration (5 mM), NH3/NH4+
influx was reduced by over 35 % compared to the influxes of plants tested at a low
potassium concentration (0.0225 mM). So far it have not been demonstrated that the
putative transport inhibitors Ca2+
and La3+
can block aquaporin. In our experiments the
application Ca2+
and La3+
resulted in significantly decreased influxes in both potassium
concentrations (0.0225 and 5 mM).
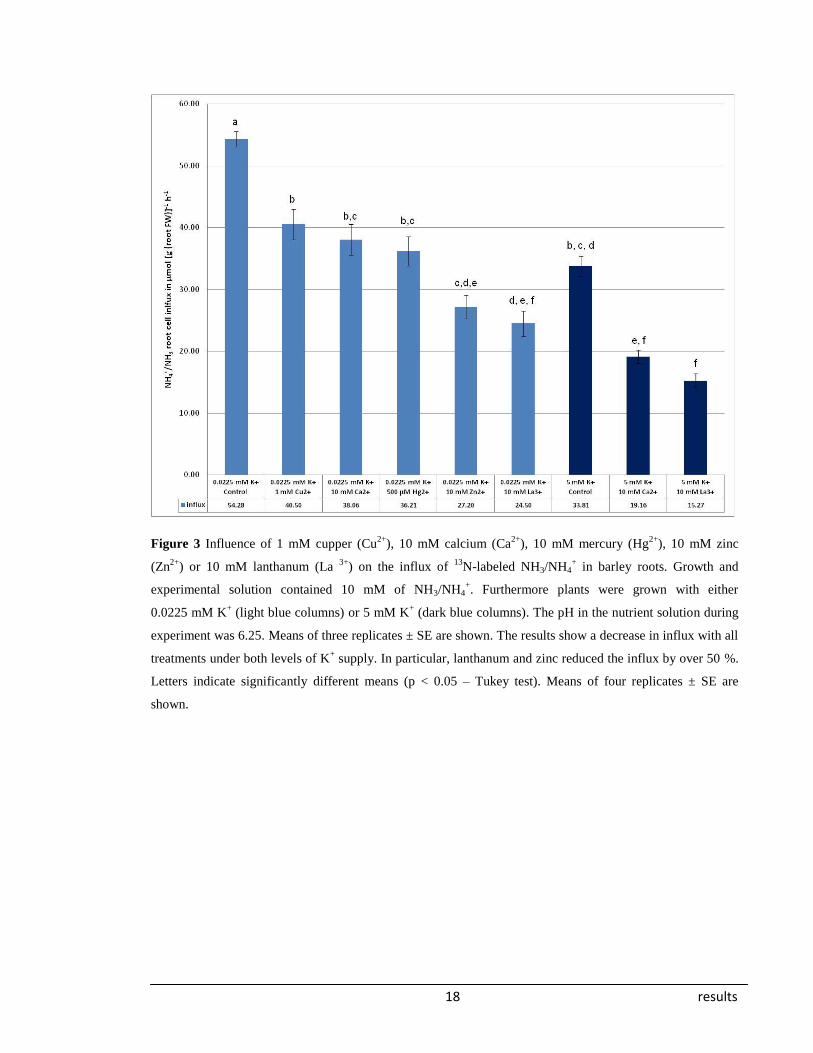
18 results
Figure 3 Influence of 1 mM cupper (Cu2+
), 10 mM calcium (Ca2+
), 10 mM mercury (Hg2+
), 10 mM zinc
(Zn2+
) or 10 mM lanthanum (La 3+
) on the influx of 13
N-labeled NH3/NH4+ in barley roots. Growth and
experimental solution contained 10 mM of NH3/NH4+. Furthermore plants were grown with either
0.0225 mM K+ (light blue columns) or 5 mM K
+ (dark blue columns). The pH in the nutrient solution during
experiment was 6.25. Means of three replicates ± SE are shown. The results show a decrease in influx with all
treatments under both levels of K+ supply. In particular, lanthanum and zinc reduced the influx by over 50 %.
Letters indicate significantly different means (p < 0.05 – Tukey test). Means of four replicates ± SE are
shown.

19 results
Figure 4 presents data from another radiotracer experiment with the established aquaporin
inhibitors silver (Niemitz and Tyermann, 2002) and mercury (BRAMLEY et al., 2009;
CARVAJAL et al., 1998; JAVOT and MAUREL, 2002; VOLKOV et al., 2007). During the
experiment the plants were placed into nutrient solutions with a pH of 5.25 to prevent
precipitation of silver or mercury. The data obtained show a large decrease in NH3/NH4+
influx in the presence of silver nitrate (AgNO3) in plants grown in a nutrient solution with
0.0225 mM K+. NH3/NH4
+ influx decreased to approximately one-third of controls.
Mercury showed a smaller but still significant inhibitory effect.
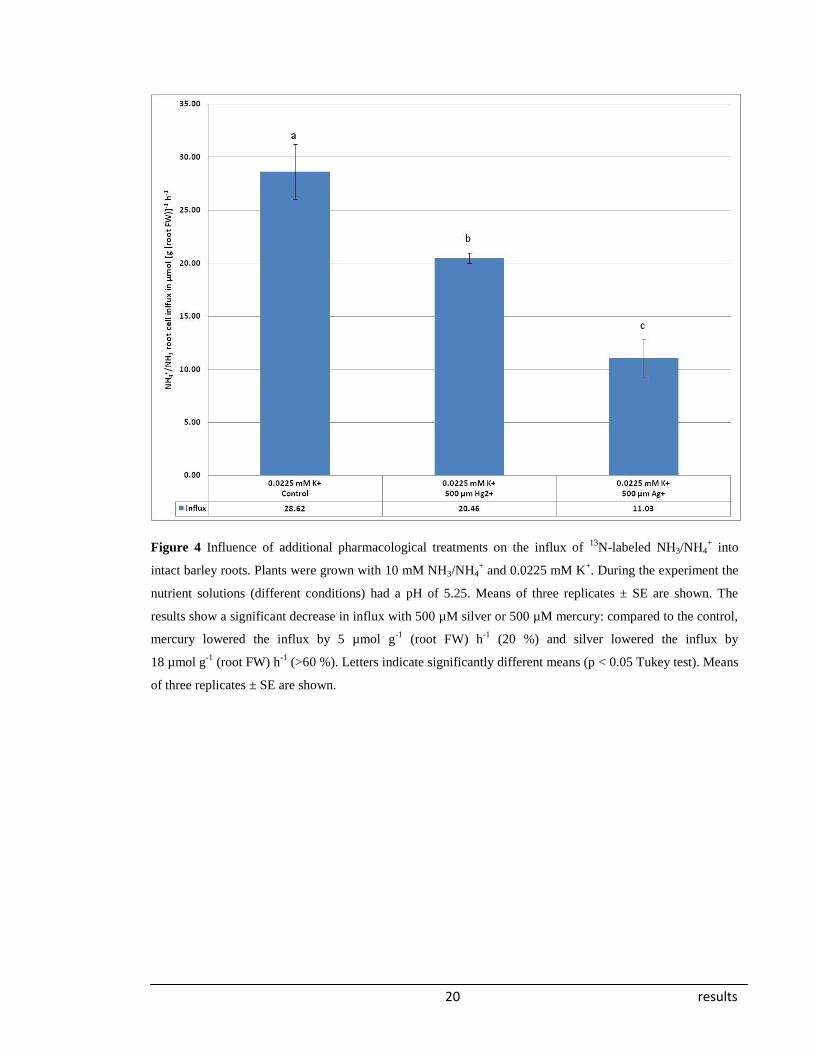
20 results
Figure 4 Influence of additional pharmacological treatments on the influx of 13
N-labeled NH3/NH4+ into
intact barley roots. Plants were grown with 10 mM NH3/NH4+ and 0.0225 mM K
+. During the experiment the
nutrient solutions (different conditions) had a pH of 5.25. Means of three replicates ± SE are shown. The
results show a significant decrease in influx with 500 µM silver or 500 µM mercury: compared to the control,
mercury lowered the influx by 5 µmol g-1
(root FW) h-1
(20 %) and silver lowered the influx by
18 µmol g-1
(root FW) h-1
(>60 %). Letters indicate significantly different means (p < 0.05 Tukey test). Means
of three replicates ± SE are shown.

21 results
Data in Figure 5 were obtained in direct-influx radiotracer experiments in which plants
grown in 5 mM K+ nutrient solution were transferred to 0.0225 mM K
+ solution adjusted to
pH 5.25. In two of the three trials, silver or mercury were applied to see if they had the
same effect on aquaporin activity as before, or if aquaporin activity was inhibited (at least
in part) by a different phenomenon. The influxes of the transferred plants were inhibited by
silver or mercury and thus it appeared that these inhibitors could prevent toxic futile
transport of NH3/NH4+ into the root cells. At the same time, the plants that were transferred
from a nutrient solution with 5 mM K+ to a solution with 0.0225 mM K
+ showed higher
influxes than the control with 5 mM K+ in the nutrient solution. Influxes for plants that
were grown with 5 mM K+ and then transferred to a nutrient solution with 0.0225 mM K
+
recovered by 50 % as compared to influxes for plants grown in 0.0225 mM K+.

22 results
Figure 5 Influence of additional pharmacological treatments on the influx of 13
N-labeled NH3/NH4+ into
intact barley roots when transferred from 5 mM K+ growth solution to 0.0225 mM K
+ nutrient test solution
(conditions 1 to 4, from left). Growth and experimental solution contained 10 mM of NH3/NH4+. The pH in
the nutrient solution during experiment was 5.25 for all conditions. Means of four replicates ± SE are shown
for conditions 1 to 4. Condition 5 was grown with 10 mM NH3/NH4+ and 0.0225 mM K
+ growth solution and
means of four replicates ± SE are shown. The results show a significant inhibition in influx with silver but not
for mercury. Compared to the control, the treatment with mercury was less effective (not significantly
different from plants transferred from 5 mM K+ to 0.0225 mM K
+). Different letters indicate significantly
different means (p < 0.05 Tukey test).

23 results
3.3. Inhibitors which bind to the cytosolic side of the membrane
Results of radiotracer experiments with inhibitors that bind to the cytosolic side of the
membrane are shown in Figure 6. Nitrogen gas only showed significant differences in
plants that were grown with 0.0225 mM K+, but these differences were not as strong as
with other inhibitors. Hydrogen peroxide decreased the influx of NH3/NH4+ in plants grown
at 0.0225 mM K+ by about 20 µmol [g(root FW)]
-1 h
-1. Under high potassium
(5 mM), the NH3/NH4+ fluxes were reduced by 8 µmol [g(root FW)]
-1 h
-1 compared to their
control. The strongest effect on NH3/NH4+ influxes was observed when propionic acid was
used as the inhibitor, at both low and high potassium concentrations. At pH 6.25 and high
potassium (5 mM) the NH3/NH4+ influx was reduced by roughly one third as compared to
the control. With low potassium (0.0225 mM), the influx was decreased by over 50 %.
More significant results were obtained at pH 5.25 with propionic acid. At low [K+], the
NH3/NH4+ influx was eight times lower than the control, while at high [K
+], propionic acid
brought influx down to the same inhibited influx as it was for the low potassium
background. Compared to the control, however, the NH3/NH4+ influx was only two thirds
smaller.

24 results
Figure 6 Influence of pharmacological treatments (nitrogen gas, 20 mM propionic acid, and 2 mM hydrogen
peroxide as applied to the hydroponic rooting medium) on the influx of 13
N-labeled NH3/NH4+ into intact
barley roots. Growth and experimental solution contained 10 mM of NH3/NH4+. Furthermore plants were
grown in 0.0225 mM K+ (light blue columns) and 5 mM K
+ (dark blue columns). Unless mentioned, the pH of
the nutrient solution during the experiment was 6.25. Means of three replicates ±SE are shown. Propionic acid
shows a significant lowering of the influx at 0.0225 mM K+ and 5 mM K
+. Minor but also significant is the
influence of hydrogen peroxide (at 0.0225 mM K+ and 5 mM K
+) and nitrogen gas (at 0.0225 mM K
+).
Different lower case letters indicate significantly different means between all treatments. Uppercase letters
indicate significantly different means between plants grown and tested with a background of 5 mM K+
(p < 0.05 – Tukey test). Means of four replicates ± SE are shown.

25 results
3.4. pH changes and concentration changes in NH4+ and NH3 concentration
Another consequence of lowering or raising the pH is the change in NH4+ and NH3
concentrations in the nutrient solution. Raising the pH results in more NH3 being available
in solution for the plant. Figures 7 and 8 show a marked increase of NH3/NH4+ flux into the
plant cell with increasing pH, up to pH 9.25. At pH 4.25, the influx was a third of the
control (pH 6.25) and at pH 8.25 it was 3 times larger. This effect was observed at both low
(0.0225 mM) and high (5 mM) potassium concentrations. When going up to
pH 9.25 at 0.0225 mM K+, NH3/NH4
+ influx increased to a very high value of
223.90 µmol [g(root FW)]-1
h-1
. Figure 6 shows the concentration change of NH4+ and NH3
and the influx of NH3/NH4+ as pH was changed. At pH 9.25 the concentration of NH3 is
equal to that of NH4+ due the fact that the pKA of NH4
+ is circa 9.25. The concentration of
NH3 and the influx of NH3/NH4+ follow an exponential pattern. In contrast the
concentration of NH4+ decreases as the pH increases.

26 results
Figure 7 Influence of pH gradients on the influx of 13
N-labeled NH3/NH4+ into intact barley roots. Growth
and experimental solution contained 10 mM of NH3/NH4+. Furthermore plants were grown with either
0.0225 mM K+
(light blue columns) or 5 mM K+ (dark blue columns). Means of three replicates ± SE are
shown. Changing external pH resulted in dramatic alterations of nitrogen influx. A pH of 8.25 increased
NH3/NH4+ influx to more than three times that of controls (pH 6.25), at both K
+ concentrations, while
lowering pH to 4.25 reduced NH3/NH4+ influx by more than 50 %. Letters indicate significantly different
means (p < 0.05 – Tukey test).

27 results
Figure 8 Influence of pH gradients on the influx of 13
N-labeled NH3/NH4+ into intact barley roots. Plants
were grown with in growth solution with 10 mM of NH3/NH4+ and 0.0225 mM K
+. The influx shows an
exponential trend, as does the concentration of NH3, when pH is increased. Means of three replicates ± SE are
shown. Changing external pH resulted in dramatic alterations of NH3/NH4+ influx. Also shown is the
increasing/decreasing of NH4+ and NH3 concentration in the nutrient solutions while pH changes. Means of
three replicates ± SE are shown.

28 results
3.5. Measuring of root and leaf water potential with a pressure bomb (Scholander
bomb)
As previously shown, silver and other inhibitors had significant influences on nitrogen
fluxes. In an attempt to demonstrate stronger evidence for a relationship between aquaporin
activity and nitrogen fluxes, root-xylem water potentials were investigated. Many studies
have used pressure measurement methods to demonstrate that aquaporins are involved in
water uptake and transport (BRAMLEY et al., 2009; EHLERT et al. 2008; STEUDLE and
PETERSON; 1998). Figure 9 shows the results from experiments in which the effects on
water potential of different potential aquaporin inhibitors were measured. When plants were
grown with 0.0225 mM K+, silver showed the highest significant change of water potential.
Plants which were grown with 5 mM K+ showed the highest significant change of water
potential with silver and with gold (highest chance). Mercury only had a strong influence
on plants grown with 0.0225 mM K+. A switch from 0.0225 mM to 5 mM K
+ or vice versa
showed a change in water potential. These results support the idea that potassium affects
nitrogen flux through aquaporins.

29 results
Figure 9 Influence of pharmacological treatments (500 µM gold, 500 µM mercury, 500 µM silver) on the
water potential (in MPa) in root xylem of intact barley roots. Growth and experimental solution contained
10 mM of NH3/NH4+. Furthermore plants were also switched from either a low potassium concentration
(0.0225 mM) to a high concentration (5 mM) or from a high potassium concentration (5 mM) to a low
concentration (0.0225 mM). Plants were grown in nutrient solution with either 0.0225 mM K+ (light blue
columns) or 5 mM K+ (dark blue columns) Means of a minimum of four replicates ±SE are shown. Lower
case letters indicate significantly different means of plants grown with 0.0225 mM K+. Upper case letters
indicate significantly different means of plants grown with 5 mM K+ (p < 0.05 – Tukey test).

30 results
3.6. Water content of barley plants
Figure 10 shows water contents of plants grown under different potassium concentrations.
Starting with the low concentration of 0.0225 mM K+, water content in root and shoot was
significantly higher compared to plants grown under much higher potassium
concentrations. At a concentration of 40 mM K+, the water content was lower by
circa 3.7 % in shoots and circa 4.4 % in roots. In general, a higher potassium concentration
resulted in higher biomass but lower water content.

31 results
Figure 10 Change of water content in leaves and roots of barley plants grown in a nutrient solution contained
10 mM of NH3/NH4+. Furthermore plants were grown under different potassium concentrations
(0.0225, 0.1, 1, 5, 10 and 40 mM). Water content is shown as a %age of the fresh weight (100 %). Means of
six replicates ± SE are shown. Lower case letters indicate significantly different means between water content
of the roots. Upper case letters indicate significantly different means between water content of the leaves
(p < 0.05 – Tukey test).

32 discussion
4. Discussion
4.1 How K+ increases the biomass and its relation to aquaporins
In previous studies done by BALKOS et al. (2010) and SZCZERBA et al. (2008), it was shown
that an increase of K+ in the nutrient medium prevents the toxic futile cycling of NH3/NH4
+
in rice and barley plants. Furthermore, BALKOS et al. (2010) showed that the activities of
important enzymes such as glutamate synthetase (GS) and PEP carboxylase were the
highest with a concentration of 5 mM K+
in the nutrient medium. GS is an important
enzyme for incorporation of inorganic NH4+ into the organic-N metabolism of the plant. It
was shown that at 5 mM K+ in the nutrient medium the biomass production was also the
highest (also shown in figure 2 of the present work). The increase of biomass is explained
by the up-regulation of GS and other enzymes that are essential to NH4+ assimilation
(BALKOS et al., 2010), in combination with the control of NH3/NH4+ concentrations inside
the cell by the K+ present in the nutrient solution. In the following chapter, the relationship
between K+
concentration in the growth medium and NH3/NH4+ influxes via aquaporins
will be explained.

33 discussion
4.2. Metals which bind to the extracellular side of aquaporins
4.2.1. The metals mercury, copper, zinc, calcium, and lanthanum
Many different methods for investigating aquaporin involvement in water transport have
used metals as inhibitors (JAIN et al., 2008; NIEMITZ and TYERMANN, 2002;
VANDER WILLIGEN et al., 2006; ZELENINA et al. 2004; ZHANG et al., 1999). Mercury is the
most commonly applied inhibitor for aquaporins (BRAMLEY et al., 2009; CARVAJAL et al.,
1998; JAVOT and MAUREL, 2002; VOLKOV et al., 2007). It has been found that aquaporins,
as intracellular proteins, are extremely sensitive to metals (MAUREL et al., 2008). The
amino acids that make up the aquaporin protein structure have many free charged positions
that readily bind metals. The binding of the metal to the surfaces of an aquaporin changes
the spatial structure of the whole aquaporin and can cause the aquaporin to become more
open or more closed (TÖRNROTH-HORSEFIELD et al., 2006). Mercury, as a sulphydryl
reagent, can bind to the cysteine groups of the aquaporin and cause the aquaporin to close
(PRESTON et al., 1992). This effect is reversible with dithiothreitol (DDT), in which the
thiol group can bind to the mercury and remove it from the aquaporin. As described in the
Introduction, the functions of aquaporins have mostly been investigated in their capacity as
water channels in cell membranes. If NH3/NH4+ are also transported via aquaporins, then
blocking of aquaporins by mercury should also lower the influx of NH3/NH4+ into the plant.
In the current study, mercury showed a significant lowering of the NH3/NH4+ influxes
(Figure 3 and Figure 4), which may be evidence for the involvement of aquaporins in
NH3/NH4+ transport. It should be noted that mercury can also have many side effects, such
as allosteric inhibition of enzymes. Additionally, it has been shown that certain aquaporins
are not sensitive to mercury (BERTL and KALDENHOFF, 2007; LU and NEUMANN, 1999).
The spatial position of the amino acids in the aquaporin seems to have an influence on the
sensitivity of the aquaporin to mercury or other metals (NÉMETH-CAHALAN et al., 2004,
TÖRNROTH-HORSEFIELD et al., 2006).

34 discussion
In the present study, calcium and lanthanum also showed a significant lowering of the
NH3/NH4+ influxes (Figure 4). While calcium and lanthanum are thought to block NSCCs
(DEMIDCHICK et al., 2002), it is nevertheless possible that they inhibit aquaporins as well.
On the other hand, mercury, zinc, and copper have been shown to be aquaporin inhibitors
(CARVAJAL et al., 1998; JAIN et al., 2008; JAVOT and MAUREL, 2002;
ZELININA et al., 2004), and these elements significantly decreased NH3/NH4+ influx in this
study (Figure 4 and Figure 5). This provides further evidence for the involvement of
aquaporins in NH3/NH4+ transport through cell membrane. In general, it seems that cations
carrying a positive charge of up to 3+ may particularly influence aquaporin activity.
4.2.2. Gold, silver, and mercury as aquaporin inhibitors
In a study conducted by NIEMITZ and TYERMANN (2002), silver and gold were used to
successfully block water transport through aquaporins. In the current study, gold, silver,
and mercury also showed effects that could be related to the function of aquaporins
(Figure 3, Figure 4, Figure 5 and Figure 9). In Figure 4, a treatment of 500 µM silver at
pH 5.25 reduced the flux of NH3/NH4+ to a third of the original flux. Mercury was not as
effective as silver, but it still influenced the fluxes significantly. In a reverse experiment
described in section 2.3.1, plants grown at 5 mM K+ were transferred for the duration of the
radiotracer experiment into a nutrient solution with a lower potassium concentration
(0.0225 mM K+) to investigate whether fluxes of NH3/NH4
+ would rebound to toxic levels.
The results show an increase in NH3/NH4+ flux of about 50 % (Figure 5). These results led
to the question of whether or not silver and mercury could also inhibit this increase. Indeed,
the silver and mercury stemmed the influx of NH3/NH4+ as compared to results obtained
without using any inhibitor, and showed more evidence for the involvement of aquaporins
in NH3/NH4+ transport.

35 discussion
4.3. Inhibitors which bind to the cytosolic side of aquaporins
Previous studies have shown that inhibitors that permeate to the inside of the cell
membrane—such as gases, hydrogen peroxide, and propionic acid—can also inhibit water
transport via aquaporins (EHLERT et al, 2009, MAUREL et al, 2008,
TOURNAIRE-ROUX et al., 2003). In the current study, it was found that the inhibitors
nitrogen gas, hydrogen peroxide, and propionic acid decreased NH3/NH4+ fluxes in barley
plants (Figure 6).
In the case of the low potassium concentration (0.0225 mM K+), all treatments were
significantly different. Plants grown with 5 mM K+ showed reduced (but still significant)
difference between treatments. For example, between the control and nitrogen gas
treatment, no significant difference was observed. This could be explained by the already
large influence of K+ on aquaporins and the fluxes of NH3/NH4
+ through them.
Two studies (KATSUHARA and HANBA, 2008; WANG et al., 2007) have shown that gases
can penetrate the plant cell membrane via aquaporins. Therefore, NH3/NH4+ may be in
competition with nitrogen gas to enter the cell via aquaporins. The favored transport of
NH3/NH4+ instead of nitrogen gas through aquaporins could mean a smaller influence of
nitrogen gas on aquaporin activity. The question is whether the aquaporin favors the
transport of NH3/NH4+ over N2 or vice versa. Nitrogen gas is also thought to inhibit
aquaporin activity by passing through the aquaporin and creating a low-oxygen condition in
the cytosol. This may lead to anoxia-induced cytosolic acidification, which can cause a
protonation of the histidine residue on the cytosolic side of the aquaporin, thereby
inhibiting it (TOURNAIRE-ROUX et al., 2003; TÖRNROTH-HORSEFIELD et al., 2006).

36 discussion
In a study conducted by BIENERT et al. (2007), it was posited that hydrogen peroxide is able
to penetrate aquaporins. If this is the case, then hydrogen peroxide would be in competition
with NH3/NH4+ to enter the cell via aquaporins, and the observed flux of NH3/NH4
+ could
decrease.
Finally, the effects of propionic acid and hydrogen peroxide on aquaporin activity could
also be explained by the known pH-driven closure of aquaporins via the protonation of a
histidine residue (FISCHER and KALDENHOFF, 2008; TÖRNROTH-HORSEFIELD et al., 2006).
With the investigation of the previously mentioned aquaporin inhibitors, there is additional
evidence for the involvement of aquaporins in NH3/NH4+ transport. The strong effect of
propionic acid on the NH3/NH4+ fluxes could be explained by the closing of aquaporins that
can be caused by the protonation of the histidine residue. An increasing of the pH can open
the aquaporins (TÖRNROTH-HORSEFIELD et al., 2006), but it also increases the concentration
of NH3/NH4+ in the nutrient solution. This prompted the testing of NH3/NH4
+ influxes
under different pH conditions.

37 discussion
4.4. Who is the winner: NH4+ or NH3?
An aquaporin is thought to be constructed like an hourglass (Figure 11) (JUNG et al., 1994).
Because of the dipolar characteristic of water molecules, they are able to move through the
narrowest part (0.2 nm) of the protein structure of an aquaporin. It is thought that the
negatively-charged oxygen binds to the positively-charged ends of the protein and then
―flips‖ its positively-charged hydrogen ions to the other side of the hourglass, after which
the oxygen is released and the water molecule has penetrated the cell membrane
(AGRE, 2006).

38 discussion
Figure 11 Illustration of an aquaporin (yellow sections) in the plasmalemma (blue sections). Water molecules
(made up of an oxygen atom—shown in red—bonded with two hydrogen atoms—shown in white) move
through the aquaporin by the binding of the negatively-charged oxygen to the positively-charged residues on
the protein. A flipping over of the hydrogen ions lets the water molecule move into the plant cell.

39 discussion
When compared, NH3 and water do have similar characteristics: they are both uncharged
molecules, they both have dipoles, and their sizes are similar. In addition, both are capable
of forming hydrogen bonds with other atoms or molecules. On the other hand, the NH4+
molecule is more similar to the K+ ion. Both carry the same charge and have similar atomic
or molecular radii (Figure 12). All of these facts lead to the assumption that NH3 is the
chemical form of nitrogen that is the most likely to penetrate via aquaporins. In fact, studies
done by of JAHN et al. (2004) and HOLM et al. (2005) have already shown that NH3 is the
form of nitrogen which penetrates aquaporins in frog embryos. The results of the current
study support the possibility that the same is true for plant cells. In Figure 7, increasing pH
levels increased the total amount of NH3 in the nutrient solutions, which resulted in an
immensely larger influx of NH3/NH4+ into the plant cells. At pH 9.25, an average influx of
223.90 µmol NH3/NH4+ [g(root FW)]
-1 h
-1 was measured. This extremely high influx
cannot be energetically explained by a transport mechanism that is required for a positive
charged cation like NH4+(BRITTO and KRONZUCKER, 2009). NH3, on the other hand, is a
neutral molecule that does not disturb thermodynamic equilibrium as much as NH4+ does.
BRITTO et al. (2001) were able to determine that the net flux of NH3/NH4+ in barley plants
at a concentration of 10 mM NH3/NH4+ is smaller than that observed under lower
concentrations of NH3/NH4+. After measuring the membrane potential, they were able to
use the Nernst equation to predict the concentrations of NH3/NH4+ in the cytosol. But
measured concentrations were lower than those predicted by the Nernst equation. This led
BRITTO et al. (2001) to make the assumption that a transport of NH4+ must be supported by
an energy consuming transport, and this was supported by a higher respiration in the barley
plants.
A main problem with NH4+ flux is the relatively high amount of energy required to drive
the transport of a large amount of NH4+ across the cell membrane (BRITTO and
KRONZUCKER, 2006). Under the assumption that NH4+ is transported via uniport, one
hydrogen proton is pumped out of the cell while consuming one ATP (BRISKIN and
RENOYLDS-NIEMAN, 1991). Furthermore, one molecule of O2 is consumed in respiration to
produce five molecule of ATP (POORTER et al., 1991). POORTER et al. (1991) also
determined that the maximum root respiration was not higher than approximately
30 µmol O2 [g (root FW)]
-1 h
-1 in a series of different plants. When considering the high

40 discussion
average influx of 223.90 µmol NH3/NH4+ [g(root FW)]
-1 h
-1 into plant roots observed in the
current study, the 45 µmol O2 molecules [g (root FW)]
-1 h
-1 required in order to facilitate
that influx exceeds the maximum root respiration rates stated by POORTER et al. (1991) by
15 µmol O2 [g (root FW)]
-1 h
-1. This does not yet take into consideration the O2 that is
needed for other processes in the cell (e.g. synthesis of organic molecules), but does
effectively illustrate that NH4+ is most likely not the main form of nitrogen that is being
transported into the plant cell. Additionally, the uniport transport of NH4+ would result in
acidification of the apoplastic space and could close aquaporins, as previously described.
An influx of 223.90 µmol NH3/NH4+ [g(root FW)]
-1 h
-1 into plant cells, therefore, suggests
that NH3 might be the preferred molecule, and aquaporin the preferred pathway.
Another argument for a transport of NH3 instead of NH4+
is that under LATS conditions the
majority of transmembrane transport has been demonstrated to occur as thermodynamically
passive transport (GLASS et al., 1997). Due to the fact that not enough energy is present to
conduct transport of NH4+ at such high levels, an electrogenic uniport is less reasonable. It
is more likely that NH3 gets transported via aquaporins passively without a loss of energy.
In Figure 13, a possible model of NH3 transport is shown. The nutrient solution in the
extracellular space is adjusted to a pH of 6.25. When circa 10 mM NH4+ (exact: 9.99) is
applied to the extracellular space it can be calculated with the Henderson–Hasselbalch
equation that concentration of NH3 must be 10 µM. In the relatively small cytosol we have
a pH of circa 7.00 (ROBERTS and PANG, 1992), which means that in case of an
equilibrium concentration of 10 µM NH3, we should have a concentration of circa
1 mM NH4+ in the cytosol. In the vacuole, the pH can fluctuate in between 5 and 6
(ROBERTS and PANG, 1992). In the case of an influx/efflux of 10 µM NH3, the concentration
of NH4+ in the vacuole should therefore be between 10-100 mM. Miller et al. (2001)
investigated that in non-stressed plants the concentration of NH4+
in the vacuole can be
between 2 to 45 mM, in agreement with the presented model (Figure 13). It is known that
the vacuole typically makes up over 90 % of the whole plant cell on a volume basis. Thus,
and because of the low concentration of NH3/NH4+ in the cytosol (here 1 mM), the cytosol
is negligible as compared to the rest of the plant cell.

41 discussion
Figure 12 Illustration of the molecular structures of NH3 (top left), NH4+ (top right), water (bottom left) and
hydronium (bottom right). NH3 and water show similar charge and structure.

42 discussion
Figure 13 Illustration of a plant cell in a barley root. The blue line represents the cell membrane, the yellow
line is the vacuole membrane, and the red arrows represent NH3 flux via aquaporins. Through different pHs
which exist between the vacuole, the cytosol and extracellular space, the concentrations of NH4+ are changing
while the concentrations of NH3 stay constant.

43 discussion
4.5. The linkage of NH3/NH4+ transport with water transport
The effects on NH3/NH4+
fluxes of metals and other putative aquaporin inhibitors provide
strong evidence that aquaporins are involved in NH3/NH4+ fluxes through plant cells. To
show a stronger correlation of the data with aquaporins, metals that were used for the
radiotracer experiments were tested with a Scholander bomb. The results supported the
hypothesis that aquaporins are involved in water uptake as well as NH3/NH4+ fluxes. The
application of silver and gold resulted in significantly large changes in the water potentials
in root xylem. From these results it can be inferred that silver and gold have an influence
on aquaporins. In an unpublished electrophysiological experiment, it was shown that silver
has a strong effect on cell membrane potential. In the same experiment, it was found that
the application of silver caused shrinking of the root cells or even destroyed the cell
membrane altogether. Figure 14 is an illustration of how this effect may occur. The active
procedure of loading ions and water into the xylem causes a constant negative pressure that
moves water molecules and ions in the direction of the xylem. If a blocking of aquaporins
or even destroying of cells happens at the tip of the roots, this movement will be
interrupted. At this point, loading of ions and water still occurs into the xylem, resulting in
higher pressure in the whole system. This is what was measured in Figure 9 and is further
evidence for the involvement of aquaporins in NH3/NH4+ and
water transport. The fact that radial water transport and therewith NH3/NH4+
transport are taking place mostly as an symplastic transport in barley roots
(KNIPFER and FRICKE, 2010) would support the lower NH3/NH4+ influx and the higher
negative pressure of the water potentials if the transport occurs via aquaporins.

44 discussion
Figure 14 Illustration of barley root tips. Grey circles represent applied silver ions, blue thinner lines
represent the cell membranes, the blue thicker lines the rhizodermis and the light yellow areas the interior of
the root cells. In the representation the root tip is cut at the right side. At this region the blue arrow represents
the negative pressure that is responsible for the water and ions which move through the root. A The relatively
small arrow indicates a normal water potential (lower negative pressure) under steady state condition. B The
relatively big arrow indicates a more negative water potential (lower negative pressure) after applying silver
to the nutrient solution. When silver inhibits the aquaporins, the cells shrink.

45 discussion
4.6. Influence of K+ on NH3/NH4
+ fluxes
Plants which have higher water concentration in their tissue show higher (less negative)
water potentials (STEUDLE, 2002; STRASBURGER, 2008). Increasing the K+ in the growth
solution resulted in lower water content and this results in a decrease of the water potential
(Figure 10). It follows that a change in K+ gives a plant a powerful osmotic tool with which
to regulate osmotic fluxes. Considering the fact that the cytoplasm can reach concentrations
of 100 to 120 mM K+ (STRASBURGER, 2008), it seems reasonable that a plant with more
potassium could build up lower water potentials. The effect of potassium is the same as
effect that was observed with all tested metals and inhibitors. An inhibition of the water and
nutrient flux into and out of the cell and through whole root cell tissue can cause a lowering
of the water potential as well.

46 discussion
4.7. Conclusion
The goal of this study was it to show an involvement of aquaporins in NH3/NH4+ transport.
A better understanding of the mechanism for NH3/NH4+ transport will provide information
to adjust and optimize the fertilization of cereals. It is essential to increase the biomass and
to lower the water use of cereal plants with the lowest effort. In Figures 3, 4, and 6, toxic
futile transmembrane NH3/NH4+ transport could be inhibited. Increasing K
+, which may
influence the activity of aquaporins by inhibiting them, resulted in an increase of biomass
(BALKOS et al., 2010). Also, plants that are grown under higher potassium concentrations
showed more biomass production and used less water (Figure 10). The plants also appeared
healthier and greener (Figure 2). The fact that NH3 and not NH4+ gets transported through
the aquaporins and that the influx of it can be controlled by the pH gives agriculture another
useful tool. Farmers could optimize the supply of NH3/NH4+ by adjusting the pH of the soil.
This is not as expensive or as complicated as the genetic manipulation of plants. Expanding
on aquaporin research that has been done in vitro and in vivo, this investigation shows that
aquaporins are very likely to be responsible for nitrogen uptake in whole plants.
47 discussion
4.8. Future role and issues
The importance of aquaporins to human medicine is of unequalled and immense
importance. For instance, there are many aquaporins to be found in kidney tissue
membranes which are thought to maintain body salt and water balance (LEE et al., 1997). In
agriculture, the consideration of aquaporins as water gating proteins will change modern
farming as water becomes more scarce in arid climates (such as in Israel). What this means
is that the mechanisms behind aquaporin activity must be better understood.
In this study, data are presented that show strong evidence for an involvement of
aquaporins in NH3/NH4+ transport. This presents the opportunity to improve the biomass
and water-use efficiency of plants. Nevertheless, more investigations have to be conducted
to better understand the mechanisms behind aquaporin function. Some examples of possible
future experiments which could contribute greatly to the scientific community‘s
understanding of aquaporins are:
A) Test of other pharmacological treatments such as original antiepileptic medicaments
(e.g. acetazolamide, bumetanide) (YOOL et al., 2009).
B) Radiotracer experiments with mutants where the genes responsible for aquaporin
expression are knocked out. (DA INES et al., 2010, KALDENHOFF and FISCHER, 2006;
SCHÜSSLER et al., 2008)
C) Testing the investigated levels of nutrients (5 mM K+ and 10 mM NH4
+) in the field.
Does the increase of biomass also result in a good seed production? Are the plants resistant
against abiotic and biotic factors?
D) How are other channels (potassium channels and NSCCs) involved in nitrogen
transport? An identification of the genes that expresses NSCCs in the cell membrane,
radiotracer experiments, tissue analyses, or respiratory experiments could be helpful.
E) Identification of genes that express aquaporins and a correlation of the roles of
aquaporins. Then, a localization of the aquaporins in the plant cells in order to set up an
identification system for plant aquaporins. Exploring different aquaporins which have
special tasks and only appear in specific plant species.

48 references
5. References
Agre P. (2006) The aquaporin water channels. Proceedings of the American Thoracic
Society 3, 5-13.
Agre P., Sasaki S., and Chrispeels M.J. (1993) Aquaporins - a family of water channel
proteins. American Journal of Physiology 265, F461.
Aslam M., Travis R.L., Rains D.W., and Huffaker R.C. (1996) Effect of ammonium on
the regulation of nitrate and nitrite transport systems in roots of intact barley
(Hordeum vulgare L.) seedlings. Planta 200, 58-63.
Balkos K.D., Britto D.T., and Kronzucker H.J. (2010) Optimization of ammonium
acquisition and metabolism by potassium in rice (Oryza sativa L. cv. IR-72). Plant,
Cell and Environment 33, 23-34.
Barkla B.J., Vera-Estrella R., Pantoja O., Kirch H.H., and Bohnert H.J. (1999)
Aquaporin localization - how valid are the TIP and PIP labels? Trends in Plant
Science 4, 86-88.
Barrowclough D.E., Peterson C.A., and Steudle E. (2000) Radial hydraulic conductivity
along developing onion roots. Journal of Experimental Botany 51, 547-557.
Bertl A. and Kaldenhoff R. (2007) Function of a separate NH3-pore in Aquaporin TIP2;2
from wheat. FEBS Letters 581, 5413-5417.
Bienert G.P., Moller A.L.B., Kristiansen K.A., Schulz A., Moller I.M., Schjoerring
J.K., and Jahn T.P. (2007) Specific aquaporins facilitate the diffusion of hydrogen
peroxide across membranes. Journal of Biological Chemistry, 282, 1183-1192.
Bloom A.J. and Chapin F.S. (1981) Differences in steady-state net ammonium and nitrate
influx by cold-adapted and warm-adapted barley varieties. Plant Physiology 68,
1064-1067.

49 references
Bramley H., Turner N.C., Turner D.W., and Tyerman S.D. (2009) Roles of
morphology, anatomy, and aquaporins in determining contrasting hydraulic
behavior of roots. Plant Physiology 150, 348-364.
Briskin D.P. and Reynoldsniesman I. (1991) Determination of H+/ATP stoichiometry for
the plasma-membrane H+-ATPase from red beet (Beta Vulgaris L.) Storage Tissue.
Plant Physiology 95, 242-250.
Britto D.T. and Kronzucker H.J. (2009). Ussing's conundrum and the search for transport
mechanisms in plants. New Phytologist 183, 243-246.
Britto D.T. & Kronzucker H.J. (2008) Cellular mechanisms of potassium transport in
plants. Physiologia Plantarum, 133, 637-650.
Britto D.T. and Kronzucker H.J. (2006) Futile cycling at the plasma membrane: a
hallmark of low-affinity nutrient transport. Trends in Plant Science 11, 529-534.
Britto, D.T. and Kronzucker, H.J. (2005) Plant nitrogen transport and its regulation in
changing soil environments. Journal of Crop Improvement 15, 1-23.
Britto D.T. and Kronzucker H.J. (2002) NH4+ toxicity in higher plants: a critical review.
Journal of Plant Physiology 159, 567-584.
Britto D.T., Siddiqi M.Y., Glass A.D.M., and Kronzucker H.J. (2001) Futile
transmembrane NH4+ cycling: A cellular hypothesis to explain ammonium toxicity
in plants. Proceedings of the National Academy of Sciences of the United States of
America 98, 4255-4258.
Camañes G., Cerezo M., Primo-Millo E., Gojon A., and Garcia-Agustin P. (2007)
Ammonium transport and CitAMT1 expression are regulated by light and sucrose in
Citrus plants. Journal of Experimental Botany 58, 2811-2825.
Carvajal M., Martinez V., and Alcaraz C.F. (1999) Physiological function of water
channels as affected by salinity in roots of paprika pepper. Physiologia Plantarum
105, 95-101.

50 references
Da Ines O., Graf W., Franck K.I., Albert A., Winkler J.B., Scherb H., Stichler W., and
Schaffner A.R. (2010) Kinetic analyses of plant water relocation using deuterium
as tracer - reduced water flux of Arabidopsis PIP2 aquaporin knockout mutants.
Plant Biology, 12, 129-139.
Davenport R.J. and Tester M. (2000) A weakly voltage-dependent, nonselective cation
channel mediates toxic sodium influx in wheat. Plant Physiology 122, 823-834.
Demidchik V. and Maathuis F.J.M. (2007) Physiological roles of nonselective cation
channels in plants: from salt stress to signaling and development. New Phytologist
175, 387-404.
Demidchik V., Davenport R.J., and Tester M. (2002) Nonselective cation channels in
plants. Annual Review of Plant Biology 53, 67-107.
Epstein E., Elzam O.E., and Rains D.W. (1963) Resolution of dual mechanisms of
potassium absorption by barley roots. Proceedings of the National Academy of
Sciences of the United States of America 49, 684-692.
Ehlert, C., Maurel, C., Tardieu, F., and Simonneau, T. (2009) Aquaporin-mediated
reduction in maize root hydraulic conductivity impacts cell turgor and leaf
elongation even without changing transpiration. Plant Physiology 150, 1093-1104.
FAO (2009) Food and agriculture organization of the United Nations. (access Sep. 18th,
2009) (http://faostat.fao.org/site/567/DesktopDefault.aspx?PageID=567#ancor)
Fischer M. and Kaldenhoff R. (2008) On the pH regulation of plant aquaporins. Journal
of Biological Chemistry 283, 33889-33892.
Galloway J.N. and Cowling E.B. (2002) Reactive nitrogen and the world: 200 years of
change. AMBIO 31, 64-71.
Gaspar M., Bousser, A., Sissoeff I., Roche O., Hoarau J., and Mahe A. (2003). Cloning
and characterization of ZmPIP1-5b, an aquaporin transporting water and urea. Plant
Science 165, 21-31.

51 references
Glass A.D.M., Erner Y., Kronzucker H.J., Schjoerring J.K., Siddiqi M.Y., and Wang
M.Y. (1997) Ammonium fluxes into plant roots: Energetics, kinetics and regulation.
Zeitschrift für Pflanzenernährung und Bodenkunde 160, 261-268.
Grabowski H. and Rolfe B. (2006). Taschenbuch für Lebensmittelchemiker (Vol. 2),
Springer, Berlin Heidelberg.
Gruber N. and Galloway J.N. (2008) An earth-system perspective of the global nitrogen
cycle. Nature, 451, 293-296.
Hirsch R.E., Lewis B.D., Spalding E.P., and Sussman M.R. (1998) A role for the AKT1
potassium channel in plant nutrition. Science 280, 918-921.
Holm L.M., Jahn T.P., Moller A.L.B., Schjoerring J.K., Ferri D., Klaerke D.A., and
Zeuthen T. (2005) NH3 and NH4+ permeability in aquaporin-expressing Xenopus
oocytes. Pflugers Archiv-European Journal of Physiology 450, 415-428.
Ichida A.M., Schachtman D.P. and Schroeder J.I. (1994) Structure-function studies of
low-affinity K+ uptake channels and a high-affinity K
+ uptake transporter. Plant
Physiology (Rockville) 105, 39-40.
Jahn T.P., Moller A.L.B., Zeuthen T., Holm L.M., Klaerke D.A., Mohsin B.,
Kuhlbrandt W., and Schjoerring J.K. (2004) Aquaporin homologues in plants
transport ammonia with high capacity. Acta Physiologiae Plantarum 26, 112-112.
Jain N., Ascough G.D., and Van Staden J. (2008) A smoke-derived butenolide alleviates
HgCl2 and ZnCl2 inhibition of water uptake during germination and subsequent
growth of tomato - Possible involvement of aquaporins. Journal of Plant
Physiology 165, 1422-1427.
Javot H. and Maurel C. (2002) The role of aquaporins in root water uptake. Annals of
Botany, 90, 301-313.
Johnson, H. (1980) Hydroponics: a guide to soilless culture systems. Division of
Agricultural Sciences. University of California. Leaflet 2947

52 references
Jung J.S., Preston G.M., Smith B.L., Guggino W.B. and Agre P. (1994) Molecular-
structure of the water channel through aquaporin chip - the hourglass model.
Journal of Biological Chemistry 269, 14648-14654.
Kaiser B.N., Rawat S.R., Siddiqi M.Y., Masle J., and Glass A.D.M. (2002) Functional
analysis of an Arabidopsis T-DNA "knockout" of the high-affinity NH4+ transporter
AtAMT1;1. Plant Physiology 130, 1263-1275.
Kaldenhoff R., Bertl A., Otto B., Moshelion M., and Uehlein N. (2007) Characterization
of plant aquaporins. In: Osmosensing and Osmosignaling, pp. 505-531. Elsevier
Academic Press Inc, San Diego.
Kaldenhoff R. & Fischer M. (2006) Aquaporins in plants. Acta Physiologica, 187, 169-
176.
Katsuhara M. and Hanba Y.T. (2008) Barley plasma membrane intrinsic proteins (PIP
aquaporins) as water and CO2 transporters. Pflugers Archiv-European Journal of
Physiology 456, 687-691.
Kielland J. (1937) Individual activity coefficients of ions in aqueous solutions. Journal of
the American Chemical Society 59, 1675-1678.
Kim E.J., Kwak J.M., Uozumi N. a Schroeder J.I. (1998) AtKUP1: An Arabidopsis gene
encoding high-affinity potassium transport activity. Plant Cell 10, 51-62.
Knipfer T. and Fricke W. (2010) Root pressure and a solute reflection coefficient close to
unity exclude a purely apoplastic pathway of radial water transport in barley
(Hordeum vulgare L.). New Phytologist 187, 159-170.
Kronzucker, H.J. and Britto, D.T. (2011). Sodium transport in plants: A critical review.
New Phytologist 189, 54-81.
Kronzucker H.J., Glass A.D.M., and Siddiqi M.Y. (1999). Inhibition of nitrate uptake by
ammonium in barley: Analysis of component fluxes. Plant Physiology 120, 283-
292.

53 references
Kronzucker H.J., Siddiqi M.Y., and Glass A.D.M. (1996) Kinetics of NH4+ influx in
spruce. Plant Physiology 110, 773-779.
Lee M.D., King L.S. and Agre P. (1997) The aquaporin family of water channel proteins
in clinical medicine. Medicine, 76, 141-156.
Loqué D., Ludewig, U., Yuan, L.X., and von Wiren, N. (2005) Tonoplast intrinsic
proteins AtTIP2;1 and AtTIP2;3 facilitate NH3 transport into the vacuole. Plant
Physiology 137, 671-680.
Loqué D. and von Wiren N. (2004) Regulatory levels for the transport of ammonium in
plant roots. Journal of Experimental Botany 55, 1293-1305.
Lu Z.J., and Neumann, P.M. (1999). Water stress inhibits hydraulic conductance and leaf
growth in rice seedlings but not the transport of water via mercury-sensitive water
channels in the root. Plant Physiology 120, 143-151.
Marschner H. (1995) Mineral nutrition of higher plants, Second edition (vol. 2).
Academic Press Inc. San Diego.
Maurel C., Verdoucq, L., Luu D.T., and Santoni V. (2008) Plant aquaporins: Membrane
channels with multiple integrated functions. Annual Review of Plant Biology 59,
595-624.
Maurel C., Reizer J., Schroeder J.I., and Chrispeels M.J. (1993) The vacuolar
membrane-protein gamma-tip creates water specific channels in Xenopus oocytes.
EMBO Journal 12, 2241-2247.
Miller A.J., Cookson S.J., Smith S.J. and Wells D.M. (2001) The use of microelectrodes
to investigate compartmentation and the transport of metabolized inorganic ions in
plants. Journal of Experimental Botany 52, 541-549.
Németh-Cahalan K.L., Kalman K., and Hall J.E. (2004) Molecular basis of pH and Ca2+
regulation of aquaporin water permeability. Journal of General Physiology 123,
573-580.

54 references
Nielsen K.H. and Schjoerring J.K. (1998) Regulation of apoplastic NH4+ concentration in
leaves of oilseed rape. Plant Physiology 118, 1361-1368.
Niemietz C.M. and Tyerman S.D. (2002) New potent inhibitors of aquaporins: silver and
gold compounds inhibit aquaporins of plant and human origin. FEBS Letters 531,
443-447.
Ninnemann O., Jauniaux J.C., and Frommer W.B. (1994) Identification of a high-
affinity NH4+ transporter from plants. EMBO Journal 13, 3464-3471.
Nobel P., S. (2009) Plant physiology (Physicochemical and environmental plant
physiology) (vol. 4). Academic Press Inc. Oxford.
Poorter H., Vanderwerf A., Atkin O.K., and Lambers H. (1991) Respiratory energy-
requirements of roots vary with the potential growth-rate of a plant-species.
Physiologia Plantarum 83, 469-475.
Preston G.M., Carroll T.P., Guggino W.B., and Agre P. (1992) Appearance of water
channels in Xenopus oocytes expressing red-cell Chip28 protein. Science 256, 385-
387.
Reisenauer H.M. (1966) Mineral nutrients in soil solution. In P. L. Altman and D. S.
Ditter [eds.], Federation of American Societies for Experimental Biology, 507–508.
Bethesda, Maryland, USA.
Roberts J.K.M. and Pang M.K.I. (1992) Estimation of ammonium ion distribution
between cytoplasm and vacuole using nuclear-magnetic-resonance spectroscopy.
Plant Physiology 100, 1571-1574.
Rubio F., Santa-Maria G.E., and Rodriguez-Navarro A. (2000) Cloning of Arabidopsis
and barley cDNAs encoding HAK potassium transporters in root and shoot cells.
Physiologia Plantarum 109, 34-43.
Santa-María G.E., Danna C.H., and Czibener C. (2000) High-affinity potassium
transport in barley roots. Ammonium-sensitive and -insensitive pathways. Plant
Physiology 123, 297-306.

55 references
Santa-María G.E., Rubio F., Dubcovsky J., and Rodriguez-Navarro A. (1997) The
HAK1 gene of barley is a member of a large gene family and encodes a high-
affinity potassium transporter. Plant Cell 9, 2281-2289.
Schachtman D.P. and Schroeder J.I. (1994) Structure and Transport Mechanism of a
High-Affinity Potassium Uptake Transporter from Higher-Plants. Nature 370, 655-
658.
Scholander .P. F., Hammel H.T., Bradstreet E.D., and Hemmingsen .E. A. (1965) Sap
pressure in vascular plants - negative hydrostatic pressure can be measured in
plants. Science 148, 339-343.
Schüssler M.D., Alexandersson E., Bienert G.P., Kichey T., Laursen K.H., Johanson
U., Kjellbom P., Schjoerring J.K., and Jahn T.P. (2008) The effects of the loss of
TIP1;1 and TIP1;2 aquaporins in Arabidopsis thaliana. Plant Journal 56, 756-767.
Squires V. (1994) Overcoming salinity with salt-water - saltbushes as a useful crop. Search
25, 9-12.
Steudle E. (2002) Aufnahme und Transport des Wassers in Pflanzen. Nova Acta
Leopoldina NF 8 323, 251-278.
Steudle E. and Peterson C.A. (1998) How does water get through roots? Journal of
Experimental Botany 49, 775-788.
Strasburger E., Noll F., Schenck H., and Schimper A.F.W.(2008) Strasburger Lehrbuch
der Botanik (vol. 36). Spektrum Akademischer Verlag, Heidelberg.
Szczerba M.W., Britto D.T., Balkos K.D., and Kronzucker, H.J. (2008) Alleviation of
rapid, futile ammonium cycling at the plasma membrane by potassium reveals K+-
sensitive and -insensitive components of NH4+ transport. Journal of Experimental
Botany 59, 303-313.
Taiz L. and Zeiger E. (2007) Plant physiology - Das Originial mit Übersetzungshilfen
(vol. 4). Springer (Spektrum Akademischer Verlag), Berlin Heidelberg.

56 references
Tournaire-Roux C., Sutka M., Javot H., Gout E., Gerbeau P., Luu D.T., Bligny R.,
and Maurel C. (2003) Cytosolic pH regulates root water transport during anoxic
stress through gating of aquaporins. Nature 425, 393-397.
Törnroth-Horsefield S., Wang Y., Hedfalk K., Johanson U., Karlsson M., Tajkhorshid
E., Neutze R., and Kjellbom P. (2006) Structural mechanism of plant aquaporin
gating. Nature 439, 688-694.
Vander Willigen C., Postaire O., Tournaire-Roux C., Boursiac Y., and Maurel C.
(2006) Expression and inhibition of aquaporins in germinating Arabidopsis seeds.
Plant and Cell Physiology 47, 1241-1250.
Volkov V., Hachez C., Moshelion M., Draye X., Chaumont F., and Fricke W. (2007)
Water permeability differs between growing and non-growing barley leaf tissues.
Journal of Experimental Botany 58, 377-390.
Wang Y., Cohen J., Boron W.F., Schulten K., and Tajkhorshid E. (2007) Exploring gas
permeability of cellular membranes and membrane channels with molecular
dynamics. Journal of Structural Biology 157, 534-544.
Wang M.Y., Siddiqi M.Y., and Glass A.D.M. (1996) Interactions between K+ and NH4
+:
Effects on ion uptake by rice roots. Plant Cell and Environment 19, 1037-1046.
Wang M.Y., Siddiqi M.Y., Ruth T.J., and Glass A.D.M. (1993) Ammonium uptake by
rice roots - II. Kinetics of 13
NH4+ influx across the plasmalemma. Plant Physiology
103, 1259-1267.
White P.J. (1996) The permeation of ammonium through a voltage-independent K+
channel in the plasma membrane of rye roots. Journal of Membrane Biology 152,
89-99.
Yool A.J., Brown E.A., and Flynn G.A. (2009) Roles for novel pharmacological blockers
of aquaporins in the treatment of brain oedema and cancer. Clinical and
Experimental Pharmacology and Physiology 37, 403-409.

57 references
Zelenina M., Tritto S., Bondar A.A., Zelenin S., and Aperia A. (2004) Copper inhibits
the water and glycerol permeability of aquaporin-3. Journal of Biological Chemistry
279, 51939-51943.
Zhang J.L., Flowers T.J., and Wang S.M. (2010) Mechanisms of sodium uptake by roots
of higher plants. Plant and Soil 326, 45-60.
Zhang W.H. and Tyerman S.D. (1999) Inhibition of water channels by HgCl2 in intact
wheat root cells. Plant Physiology 120, 849-857.
Zhu M.J., Wang X.C., and Chen J. (2000). Identification and role of plasma membrane
aquaporin in maize root. Chinese Science Bulletin 45, 1493-1496.