Embed Size (px)
Citation preview

DECEMBER 2017 EDITION
by: PROVEN Investments Limited
THE INVES TMENTM A G A Z I N E
PROVEN INVESTMENTS LIMITED REPORTS UNAUDITED CONSOLIDATED FINANCIAL RESULTS
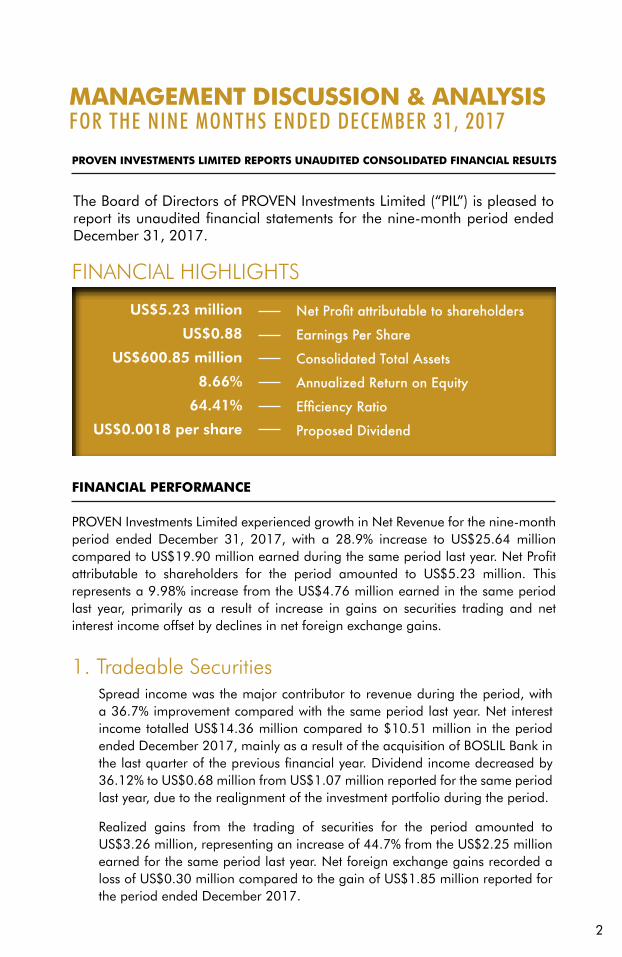
The Board of Directors of PROVEN Investments Limited (“PIL”) is pleased to report its unaudited financial statements for the nine-month period ended December 31, 2017.
FINANCIAL PERFORMANCE
PROVEN Investments Limited experienced growth in Net Revenue for the nine-month period ended December 31, 2017, with a 28.9% increase to US$25.64 million compared to US$19.90 million earned during the same period last year. Net Profit attributable to shareholders for the period amounted to US$5.23 million. This represents a 9.98% increase from the US$4.76 million earned in the same period last year, primarily as a result of increase in gains on securities trading and net interest income offset by declines in net foreign exchange gains.
US$5.23 million
US$0.88
US$600.85 million
8.66%
64.41%
US$0.0018 per share
Net Profit attributable to shareholders
Earnings Per Share
Consolidated Total Assets
Annualized Return on Equity
Efficiency Ratio
Proposed Dividend
MANAGEMENT DISCUSSION & ANALYSISFor the NINe moNths eNded deCember 31, 2017
FINANCIAL HIGHLIGHTS
2
1. Tradeable SecuritiesSpread income was the major contributor to revenue during the period, with a 36.7% improvement compared with the same period last year. Net interest income totalled US$14.36 million compared to $10.51 million in the period ended December 2017, mainly as a result of the acquisition of BOSLIL Bank in the last quarter of the previous financial year. Dividend income decreased by 36.12% to US$0.68 million from US$1.07 million reported for the same period last year, due to the realignment of the investment portfolio during the period.
Realized gains from the trading of securities for the period amounted to US$3.26 million, representing an increase of 44.7% from the US$2.25 million earned for the same period last year. Net foreign exchange gains recorded a loss of US$0.30 million compared to the gain of US$1.85 million reported for the period ended December 2017.

2. Private EquityPrivate equity investments that fit our risk to reward objectives continue to be a strong area of focus as we explore vast opportunities throughout the region. Our current private equity holdings continue to boost our bottom-line:
PROVEN Wealth LimitedPROVEN Wealth Limited (“PWL”) net income totalled US$2.18 million for the period. The firm continues its strategy to offer innovative investment products to clients, and reduce the issue of repurchase agreements. The balance sheet experienced an overall 20.86% contraction compared to the same period last year. Total Assets for the company as at December 31, 2017 stood at US$132.04 million.
PROVEN Fund Managers LimitedPROVEN Fund Management Limited continues to be a formidable player in the Asset and Pension Fund Management and administration business. During the last quarter, the company launched its flagship Unit Trust suite of products dubbed “PROVEN Select”, which offers clients direct participation in a diversified professionally managed portfolio of investments. Profitability declined marginally compared to the same period last year, as Net profit for the period ended December 2017 was US$0.37 million compared to US$0.39 million for the period ended December 2016.
Access Financial Services LimitedAccess Financial Services Limited contributed considerably to the results of the Group during the quarter, producing net profits of US$4.48 million for the period ended December 31, 2017, representing an increase of 14.92%
MANAGEMENT DISCUSSION & ANALYSISFor the NINe moNths eNded deCember 31, 2017
3
This decline occurred as a result of the revaluation of 3.00% experienced in the Jamaican dollar during the period compared to a 5.15% devaluation for the period ended December 2016.
We continue to monitor the investment arena and strategically adjust our positioning to take advantage of opportunities that fit our risk-reward criteria diversifying our portfolio across fixed income sectors and non-bond sources of income with varied risk exposures to lower volatility, while enhancing our expected risk-adjusted returns.

Head Office:26 Belmont RoadKingston 5Tel: 876.908.3800-1
Mandeville Branch:Unit #5Cobblestone Professional CentreTel: 876.625.0845-6
Montego Bay Branch:Unit #11Fairview II Shopping CentreTel: 876.908.3800-1
W E A L T Hprovenwealth.com
A member of the Jamaica Stock Exchange.A Securities Dealer licensed by the Financial Services Commission of Jamaica
“The only source of knowledge is experience.” Albert Einstein

Private Equity - Continuedcompared to the same period last year. Access Financials’ loan portfolio was US$23.05 million as at December 31, 2017, representing an 11.14% increase compared to the same period last year.
BOSLIL Bank LimitedPROVEN Investments Limited acquired 82.82% of the common equity of BOSLIL Bank Limited, (previously named Bank of St. Lucia International renamed) from Eastern Caribbean Financial Holding Company Limited in March 2017. We are proud to report that BOSLIL experienced a successful period, as Net Profits totalled US$3.26 million and Total Assets for the company as at December 31, 2017 stood at US$272.45 million.
MANAGEMENT DISCUSSION & ANALYSISFor the NINe moNths eNded deCember 31, 2017
5
3. Real EstatePROVEN REIT Limited is now a wholly owned subsidiary of PROVEN Investments Limited. Having successfully completed and sold its second residential development on Sullivan Avenue, Kingston 8. The third development in the pipeline is on Millsborough Avenue in Kingston 6 and the company continues to closely monitor the local and international real estate markets for new opportunities.
4. Operating ExpensesFor the period ended December 31, 2017, consolidated operating expenses increased by 40.45% to US$16.52 million from US$11.76 million in the same period last year. This increase was mainly due to the inclusion of the operations of BOSLIL bank in this year’s results and increase in loan loss provisions over the period. As a result, the Efficiency Ratio increased to 64.41% compared to 59.10% for the same period last year (including all income and expense items). Expense management and consolidation has been a key focus of management as we seek to reduce our efficiency ratio closer to the established target of 50%.
Net Profit attributable to shareholders totalled US$5.23 million or 88 cents per share versus US$4.76 million or 86 cents per share in the period ended December 2016. This represents an annualized Return on Equity of 8.66% for the period ended December 31, 2017.
5. Net Profit

UN-AUDITED FINANCIAL STATEMENTS
6. Balance SheetTotal Assets amounted to US$346.9 million as at December 2014, up from US$146.4 million as at December 2013, as a result of the acquisition and consolidation of the PWLTL and additional investments in Associate Companies - Access Financial Services and Knutsford Express Limited. Total Liabilities increased to US$304.5 million as at December 31, 2014 from US$114.1 million as at December 31, 2013, as Securities sold under Repurchase Agreements were particularly higher at US$183.7 million compared to US$42.0 million as at December 31, 2013. Repurchase Agreements from PWLTL accounted for US$147.8 million of this quarter’s figure. Notes Payable almost doubled to US$93 million from US$53 million the same time last year.
7. Shareholder’s EquityShareholder’s Equity increased by 32% from US$32.1 million as at December 31, 2013 to US$42.4 million as at December 31, 2014, in line with a US$10.3 million increase in Share Capital from the Rights Issue in June 2014, as well as a 32% increase in retained earnings.
8. Dividend PaymentThe Board of Directors has approved a dividend payment of US$0.0020 per share to all ordinary shareholders on record as at February 25, 2015 to be paid on March 11, 2015. This payment will bring the total dividend for the financial year to date to US$0.0073 per share, representing an annualized tax-free dividend yield of 5.5% based on the average share price of US$0.177 for the nine months ended December 31, 2014.
AccessFS_HardworkPress_Nurse6.5x10in(mag).ai 1 11/16/15 2:09 PM

MANAGEMENT DISCUSSION & ANALYSISFor the NINe moNths eNded deCember 31, 2017
Total assets amounted to US$600.85 million as of December 31, 2017, a 67.85% increase from US$357.97 million as at December 31, 2016. Total liabilities increased to US$491.27 million as at December 31, 2017 from US$277.11 million for the same period last year, primarily as a result of the acquisition of US$250.75 million in customer bank deposits subsequent to the purchase of BOSLIL.
6. Balance Sheet
7
Shareholders’ Equity attributable to the owners of the company increased by 25.22% to US$90.07 million as of December 31, 2017 from US$66.92 million as of December 31, 2016 in line with an increase in Retained Earnings and a positive change in the Investment Revaluation Reserve during the period, following a slight recovery in the bond market and additional capital raised in the Rights Issue in July 2017.
7. Shareholder’s Equity
The Board of Directors has approved an interim dividend payment of US$0.0018 per share to all ordinary shareholders on record as February 20, 2018 and be paid on March 6, 2018. This will bring the total dividend for the financial year to date to US$0.0058 per share, representing an annualized tax-free dividend yield of 3.22% based on the average share price of US$0.25 for the period ended December 31, 2017.
PROVEN Investments Limited takes this opportunity to thank all of our stakeholders for your support and trust. Our continued success is as a result of the dedication of our Directors, Management and Staff and we thank them for their loyalty and commitment.
8. Dividend Payment


MANAGEMENT DISCUSSION & ANALYSISFor the NINe moNths eNded deCember 31, 2017
OPERATING ENVIRONMENT
Global growth is estimated at 3.6 percent in 2017/18 and is projected to strengthen further to 3.7 percent in 2018/19. A recovery in industrial activity has coincided with a pickup in global trade, after two years of marked weakness. Over the nine-month period, global stocks advanced amid accelerating economic growth in the U.S. and Europe, coupled with signs of diminishing political risk in the euro zone. Investor sentiment improved markedly as political newcomer Emmanuel Macron defeated Marine Le Pen in the French presidential election, largely erasing concerns that France may attempt to leave the European Union.
The bull market run observed post the November 2016 U.S election, fuelled by an anticipation of fiscal stimuli, continued into the second quarter of 2017 and continued its upward climb as stocks recorded solid gains in the third quarter, bringing returns for most of the major benchmarks into double digits for the year-to-date period. The advance also brought all the major indices to record highs by the end of the quarter. Also, as had been widely anticipated, the US Federal Reserve (Fed) lifted interest rates by 25 basis points (bps) in December. The Fed also raised its growth forecasts for 2018 to 2.5% from 2.1%.
The fed hike of short-term interest rates by 75 basis points over the course of the year and strong demand persisting for longer dated Treasuries partly resulted in the flattening of the Treasury curve, as shorter-term rates rose and longer-term rates fell. Both the European Central Bank and the Bank of Japan left interest rates unchanged, despite signs of improving economic growth and higher inflation and the U.S. dollar fell against the euro, the yen and most other currencies.
Political events helped to propel markets higher in the final quarter of the year as investors cheered the highly anticipated $1.5 trillion tax cut in the U.S. and the re-election of Prime Minister Shinzo Abe in Japan. Financial markets have again proven resilient to geopolitical shocks in 2017. With growth robust, inflation moderate and liquidity ample, interest rates should slowly rise. In 2018, equities are expected to make further gains and the main risk will be upside surprises to inflation.
10


MANAGEMENT DISCUSSION & ANALYSISFor the NINe moNths eNded deCember 31, 2017
At the regional level, Caribbean issuers benefited as the market assessed the impact of a slow process of normalization in rates around the world, and expectations of higher inflation in the US still tamed. Investors’ search for yield continues to benefit countries in the region with improving fiscal balances and/or with government policy moving towards that direction. There was further deterioration in the aggregate credit quality of the region following the downgrade of Barbados’ credit rating.
Jamaica and Dominican Republic continued a positive path with both issuers tapping the international capital markets within the period. In the upcoming quarter the effects of the devastation caused by Hurricanes Harvey, Maria and Irma will begin to show up in GDP numbers; though, rebuilding activity will boost GDP in the short to medium term, the long-term impact on economic growth and development is likely to be credit negative.
Global economic growth should remain strong in 2018, as both advanced and emerging economies enjoy a synchronized upturn. Corporate capital expenditure should also become a more prominent growth driver. With inflation levels unlikely to rise significantly, central banks will reduce liquidity and raise interest rates in response to better growth. Also, Fed rate increases are expected to continue at a pace similar to that of 2017.
12

MANAGEMENT DISCUSSION & ANALYSISFor the NINe moNths eNded deCember 31, 2017
13
Quarter ended Quarter ended 9 Months ended 9 Months ended Audited December 2017 December 2016 December 2017 December 2016 March 2017
US$ US$ US$ US$ US$INCOMEInterest Income 7,328,566 6,128,070 21,094,053 18,725,367 24,149,636 Interest expense (2,165,409) (2,698,067) (6,735,054) (8,218,163) (9,646,474) Net Interest income 5,163,157 3,430,003 14,358,999 10,507,204 14,503,162
Other incomeGains on securities trading 781,173 266,586 3,255,300 2,249,945 1,719,742 Dividend Income 217,772 344,047 683,425 1,069,882 1,356,988 Pension Management Income 628,449 567,863 1,715,334 1,442,284 1,966,478 Fees & Commissions 1,466,526 695,854 4,149,685 1,832,869 2,368,195 Foreign exchange translation gains/(losses) (825,898) (24,698) (297,268) 1,852,590 1,901,699 Other Income/(Loss) 615,425 349,723 1,774,539 942,368 443,088
2,883,447 2,199,375 11,281,015 9,389,938 9,756,190
NET REVENUE 8,046,604 5,629,378 25,640,014 19,897,142 24,259,352
OPERATING EXPENSESPreference dividend 205,393 87,860 962,459 1,051,711 2,184,273 Depreciation and Ammortization of Intangibles 422,702 266,367 1,279,341 799,101 1,343,600 Impairment of Investment - - - - (920,616) Administrative and General Expenses 4,873,477 3,661,866 14,274,203 9,908,692 14,019,228
5,501,572 4,016,093 16,516,004 11,759,505 16,626,485
OPERATING PROFIT 2,545,032 1,613,285 9,124,010 8,137,637 7,632,866
Extra Ordinary ActivitiesGain on purchase of subsidiary - - - - 8,030,111 Extra ordinary Share based payment - - - - (3,243,680)
- - - - 4,786,431
Profit before income tax 2,545,032 1,613,285 9,124,010 8,137,637 12,419,297
Income tax (221,177) (238,711) (1,356,040) (1,414,767) (956,318)
NET PROFIT AFTER TAX 2,323,855 1,374,574 7,767,970 6,722,870 11,462,979
Less income attributable to non-controlling interest (844,919) (554,426) (2,534,908) (1,964,715) (2,741,672)
Profit attributable to owners of the company 1,478,936 820,148 5,233,062 4,758,155 8,721,307
EARNINGS PER STOCK UNIT - US cents 0.25 0.15 0.88 0.86 1.58
Quarter ended Quarter ended 9 Months ended 9 Months ended AuditedDecember 2017 December 2016 December 2017 December 2016 March 2017
US$ US$ US$ US$ US$
NET PROFIT 2,323,855 1,374,574 7,767,970 6,722,870 11,462,979
OTHER COMPREHENSIVE INCOMEItems that are or may be reclassified to profit or loss: Unrealised Gain/(loss) on available-for-sale investments (969,909) (3,167,319) 354,253 7,702,151 8,892,357 Foreign exchange translation reserve 1,467,659 (10,895) 1,191,491 (1,655,604) (1,755,267)
Total Comprehensive income 2,821,605 (1,803,640) 9,313,714 12,769,417 18,600,069
Efficiency ratio(with pref share ) 68% 71% 64% 59% 69%Efficiency ratio(without pref share )
66% 70% 61% 54% 60%
UN-AUDITED CONSOLIDATED STATEMENT OF INCOMEFOR THE PERIOD ENDED DECEMBER 31, 2017
UN-AUDITED CONSOLIDATED STATEMENT OF COMPREHENSIVE INCOMEFOR THE PERIOD ENDED DECEMBER 31, 2017

MANAGEMENT DISCUSSION & ANALYSISFor the NINe moNths eNded deCember 31, 2017
14
December December March2017 2016 2017US$ US$ US$
ASSETSCash and cash equivalents 114,160,200 7,540,563 151,313,632 Available-for-sale investments 397,773,978 276,416,072 400,757,783 Loans Receivable 38,786,837 35,808,159 39,421,035 Other Receivables 10,167,611 10,904,045 10,764,181 Property Development In Progress 1,083,151 1,211,252 1,652,665 Investment Property 17,553,020 6,315,523 6,348,277 Intangible Assets 20,453,422 19,167,774 21,190,094 Property, plant and equipment 875,948 606,157 966,008 Total Assets 600,854,167 357,969,545 632,413,675
LIABILITIESClient liabilities 102,930,660 151,899,174 142,998,901 Related company 300,643 3,555,052 949,419 Notes Payable 105,393,391 98,879,518 94,434,537 Preference shares 16,533,468 8,383,383 15,976,954 Other liabilities 15,361,577 14,394,930 19,059,363 Due to Customers 250,747,632 - 270,054,879 Total Liabilities 491,267,371 277,112,057 543,474,053
SHARE HOLDERS' EQUITYShare capital 86,716,754 69,248,762 69,248,762 Investment revaluation reserve (3,943,147) (5,487,606) (4,297,400) Foreign exchange translation (6,372,780) (7,464,608) (7,564,271) Retained earnings 13,668,916 10,625,074 13,693,002 Total Shareholder's Equity 90,069,743 66,921,622 71,080,093
Minority Interest 19,517,053 13,935,866 17,859,529
Total Shareholder's Equity and Liabilities 600,854,167 357,969,545 632,413,675
Approved for Issued by the Board of Directors and sign on its behalf by
Director
UN-AUDITED CONSOLIDATED STATEMENT OF FINANCIAL POSITIONDECEMBER 31, 2017

MANAGEMENT DISCUSSION & ANALYSISFor the NINe moNths eNded deCember 31, 2017
15
9 Months ended 9 Months ended Audited December 2017 December 2016 March 2017
US$ US$ US$CASH FLOWS FROM OPERATING ACTIVITIES:Net profit 5,233,062 4,758,154 8,721,307
Foreign Exchange Translation 1,191,491 (1,655,604) (1,755,267) Depreciation and Ammortization 1,279,341 981,013 1,343,600 Income Tax Charge 1,356,040 1,414,767 956,318 Operating cashflow before movements in working capital 9,059,934 5,498,330 9,265,958
Changes in operating assets and liabilities Receivables (437,398) (4,176,417) 574,557 Client Liabilities 3,731,987 12,063,469 270,324,149 Payables (44,416,146) (17,010,549) (16,795,350) Related company (648,776) 2,634,047 1,287,419 Net cash provided by operating activities (32,710,399) (991,120) 264,656,733
CASH FLOWS FROM INVESTING ACTIVITIES: Loans 634,198 (12,255,806) (14,427,682) Investments in subsidary - - (68,006) Purchase of property ,plant and equipment 116,904 (794,337) (4,596,507) Investments (30,577,872) 3,520,044 (120,218,715) Cash used in investing activities (29,826,770) (9,530,099) (139,310,910)
CASH FLOWS FROM FINANCING ACTIVITIES: Notes payable 10,958,854 7,088,935 3,409,952 Issue of Preference Shares 556,514 405,700 7,999,271 Minority Interest 1,657,524 1,273,866 5,197,529 Dividend Paid (5,257,149) (3,532,427) (4,359,651) Issue of Ordinary Shares 17,467,992 - - Net cash provided by/ (used in) financing activities 25,383,735 5,236,074 12,247,101 NET INCREASE (DECREASE) IN CASH AND CASH EQUIVALENTS (37,153,433) (5,285,145) 137,592,924 Cash and cash equivalents at beginning of period 151,313,632 12,825,709 13,720,709 CASH AND CASH EQUIVALENTS AT END OF PERIOD 114,160,199 7,540,563 151,313,632
UN-AUDITED CONSOLIDATED STATEMENT OF CASH FLOWSFOR THE PERIOD ENDED DECEMBER 31 2017
MANAGEMENT DISCUSSION & ANALYSISFor the NINe moNths eNded deCember 31, 2017
16
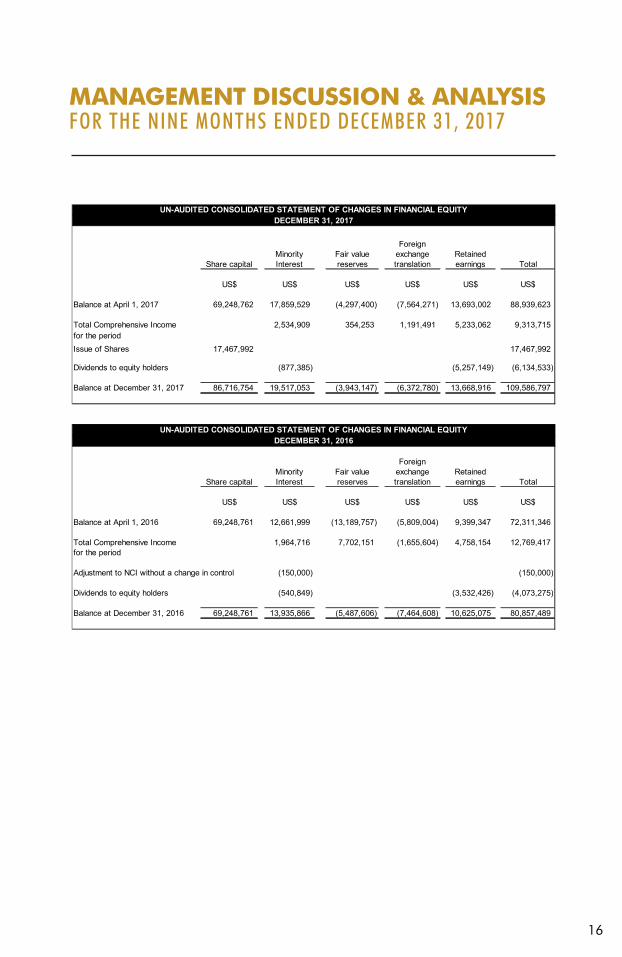
Share capitalMinority Interest
Fair value reserves
Foreign exchange translation
Retained earnings Total
US$ US$ US$ US$ US$ US$
Balance at April 1, 2017 69,248,762 17,859,529 (4,297,400) (7,564,271) 13,693,002 88,939,623
Total Comprehensive Income 2,534,909 354,253 1,191,491 5,233,062 9,313,715 for the periodIssue of Shares 17,467,992 17,467,992
Dividends to equity holders (877,385) (5,257,149) (6,134,533)
Balance at December 31, 2017 86,716,754 19,517,053 (3,943,147) (6,372,780) 13,668,916 109,586,797
Share capitalMinority Interest
Fair value reserves
Foreign exchange translation
Retained earnings Total
US$ US$ US$ US$ US$ US$
Balance at April 1, 2016 69,248,761 12,661,999 (13,189,757) (5,809,004) 9,399,347 72,311,346
Total Comprehensive Income 1,964,716 7,702,151 (1,655,604) 4,758,154 12,769,417 for the period
Adjustment to NCI without a change in control (150,000) (150,000)
Dividends to equity holders (540,849) (3,532,426) (4,073,275)
Balance at December 31, 2016 69,248,761 13,935,866 (5,487,606) (7,464,608) 10,625,075 80,857,489
UN-AUDITED CONSOLIDATED STATEMENT OF CHANGES IN FINANCIAL EQUITYDECEMBER 31, 2017
UN-AUDITED CONSOLIDATED STATEMENT OF CHANGES IN FINANCIAL EQUITYDECEMBER 31, 2016

MANAGEMENT DISCUSSION & ANALYSISFor the NINe moNths eNded deCember 31, 2017
NOTES TO FINANCIAL STATEMENTS
December 2017
1. Identification
PROVEN Investments Limited (“the Company”) is incorporated in Saint Lucia under the International Business Companies Act. The Company is domiciled in Saint Lucia, with registered office at 20 Micoud Street, Castries, Saint Lucia.
The primary activities of the Company are the holding of tradable securities for investment purposes and holding other investments.
subsidiaries Country of incorporation Nature of business
Percentage ownership
2017 2016
ProVeN Wealth Limited Jamaica Fund management, investment advisory services, and money market and equity trading
100 100
ProVeN reIt Limited and its wholly-owned subsidiary: ProVeN Kingsway Limited
saint Lucia real estate investment 100 100
Asset management Company Limited
Jamaica hire purchase financing 100 100
ProVeN Fund managers Limited Jamaica Pension funds management 100 100
Access Financial services Limited Jamaica retail lending 49.72 49.72
bosLIL bank Limited saint Lucia Private banking 82.82 -
17

MANAGEMENT DISCUSSION & ANALYSISFor the NINe moNths eNded deCember 31, 2017
2. Statement of compliance and basis of preparation
Interim financial reporting
The condensed consolidated interim financial statements for the nine months ended December 31, 2017 have been prepared in accordance with IAS 34, ’Interim financial reporting‘. The condensed consolidated interim financial statements should be read in conjunction with the annual financial statements for the year ended March 31, 2017, which have been prepared in accordance with International Financial Reporting Standards (IFRS).
There have been no changes in accounting policies since the most recent audited accounts as at March 31, 2017.
Certain new, revised and amended standards and interpretations came into effect during the current financial year. The Group has adopted the following new standards and amendments to standards, including any consequential amendments to other standards, applicable to its operations. The nature and effects of the changes are as follows:• Amendment to IAS 1, Presentation of Financial Statements, entitled “IAS
1, Presentation of Financial Statements: Presentation of Items of Other Comprehensive Income”, which led to the following changes in the financial statements:
• Items of other comprehensive income (OCI) that may be reclassified to profit or loss in the future are presented separately from those that would never be reclassified to profit or loss.
Basis of measurement:The financial statements are prepared on the historical cost basis, except for the inclusion at fair value of available–for–sale securities and financial assets at fair value through profit or loss.
Functional and presentation currency:The financial statements are presented in United States dollars (US$), which is the functional currency of the Company, unless otherwise indicated. The financial statements of the subsidiaries, which has the Jamaica dollar as its functional currency, are translated into US$. All financial information has been rounded to the nearest thousand.
Accounting estimates and judgements:The preparation of the financial statements in conformity with IFRS requires management to make estimates and assumptions that affect the reported amounts
18

MANAGEMENT DISCUSSION & ANALYSISFor the NINe moNths eNded deCember 31, 2017
19
of, and disclosures relating to, assets, liabilities, contingent assets and contingent liabilities at the reporting date and the income and expenses for the period then ended. Actual amounts could differ from those estimates. The estimates and underlying assumptions are reviewed on an on-going basis. Revisions to accounting estimates are recognised in the period in which the estimate is revised if the revision affects only that period or in the period of the revision and future periods if the revision affects both current and future periods.
Significant accounting policies
3. Basis of consolidation:The consolidated financial statements combine the financial position, results of operations and cash flows of the Company and its subsidiaries (note 1), subject to the eliminations described at note 3(b).
3(a). Subsidiaries:Subsidiaries are all entities controlled by the Group. Control exists when the Group has the power, directly or indirectly, to govern the financial and operating policies of an entity so as to obtain benefits from its activities. In assessing control, potential voting rights that presently are exercisable, or exercisable after conversion of convertible instruments, are taken into account. The financial statements of subsidiaries are included in the consolidated financial statements from the date that control commences until the date that control ceases.
3(b). Transactions eliminated on consolidation:Intra-Group balances and any unrealised gains and losses and income and expenses arising from intra-group transactions are eliminated in preparing the consolidated financial statements. Unrealised losses are eliminated in the same way as unrealised gains, but only to the extent that there is no evidence of impairment of the Group’s interest.
4. Investments:
Available-for-sale financial assets:The Group’s investments in equity securities and certain debt securities are classified as available-for-sale and are carried at fair value except for unquoted equity securities whose fair value cannot be reliably measured, which are carried at cost. Changes therein, other than impairment losses, and foreign exchange gains and losses on

MANAGEMENT DISCUSSION & ANALYSISFor the NINe moNths eNded deCember 31, 2017
20
available-for-sale monetary items, are recognised directly in other comprehensive income. When an investment is derecognised, the cumulative gain or loss in equity is transferred to profit or loss.
Investments at fair value through profit or loss:The Group carries some investment securities at fair value through profit or loss if they are held for trading or designated as such upon initial recognition. Financial instruments are designated at fair value through profit or loss if the Group manages such investments and makes purchase and sale decisions based on their fair value. Upon initial recognition, attributable transaction costs are recognised in profit or loss when incurred. Financial instruments at fair value through profit or loss are measured at fair value and changes therein are recognised in profit or loss.
Loans and receivables:Loans and receivables are non-derivative financial assets with fixed or determinable payments, that are not quoted in an active market, and that the Group does not intend to sell immediately or in the near term. Loans and receivables are measured at amortized cost using the effective interest method, except when the Group chooses to designate the loans and receivables at fair value through profit or loss.
5. Resale agreementsThe company purchases government and corporate securities and agrees to resell them at a specified date at a specified price. On making payment the company takes delivery of the securities from the vendor although title is not transferred unless the company does not resell the securities on the specified date or other conditions are not honoured. Resale agreements result in credit exposure, in that the counterparty to the transaction may be unable to fulfil its contractual obligations.
6. Interest income:Interest income is recognised in profit or loss for all interest-earning instruments on the accrual basis using the effective interest method. The effective interest rate is the rate that exactly discounts the estimated future cash receipts over the expected life of the financial asset to its carrying amount. The effective interest rate is established on initial recognition of the financial asset and is not revised subsequently. Interest income includes coupons earned on fixed income investments, accretion of discount on treasury bills and other discounted instruments, and amortisation of premium on instruments bought at a premium.

MANAGEMENT DISCUSSION & ANALYSISFor the NINe moNths eNded deCember 31, 2017
21
7. Interest expense:Interest expense is recognised in profit or loss on the accrual basis using the effective interest method. The effective interest rate is the rate that exactly discounts the estimated future cash payments through the expected life of the financial liability to its carrying amount. The effective interest rate is established on initial recognition of the financial liability and not revised subsequently. Interest expense includes coupons paid on fixed rate liabilities and accretion of discount or amortization of premium on instruments issued at other than par.
8. Share capital:The Group classifies capital instruments as financial liabilities or equity instruments in accordance with the substance of the contractual terms of the instrument. In the case of its preference share capital, it is classified as:i. equity if it is non-redeemable, or redeemable only at the Group’s option, and
any dividends are discretionary; in such a case, dividends thereon are recognised as distributions within equity;
ii. liability if it is redeemable on a specific date or at the option of the stockholders, or if dividends are not discretionary; in such a case dividends thereon are recognised as interest in profit or loss.
The Group’s preference shares bear contractual entitlements to dividends that are cumulative, and not at the discretion of the directors. Accordingly, they are presented as a financial liability.
Incremental costs directly attributable to the issue of an equity instrument are deducted from the initial measurement of the equity instruments.
9. Earnings per Stock UnitPROVEN Investments Limited’s Earning per Stock Unit “EPS” is computed by dividing the profit attributable to stockholders of the parent of US$5,233,062 by the weighted average number of ordinary stock units in issue during the reporting period numbering 592,546,991 shares.

Investments Limited
We would like to take this opportunity to thank all of our stakeholders for your support and trust.
Our continued success is as a result of the dedication of our Directors, Management and Staff and we thank them for their loyalty and commitment.
22

20 Micoud Street, Castries, St. Lucia • E-mail: [email protected]
Listed on the Jamaica Stock Exchange

ww
w.w
ea
re
pr
ov
en
.co
m
Design + Layout: simplyjimdandy.com