Embed Size (px)
Citation preview

Jeffrey D. Karrenbrock
Jeffrey 0. Karrenbrock is an economist at the Federal ReserveBank of St. Louis. David H. Kelly provided research assistance.
The Internationalization ofthe Beer Brewing Industry
I. HE BEER BREWING INDUSTRY has beenundergoing a process of internationalization forthe past 25 years. This article examines the rolesthat three types of international transactions —
merchandise trade, licensing agreements andforeign direct investment — have played in thisinternationalization. As in other industries, afew general economic factors explain much ofthe increase in international brewing activity.What makes beer brewing a particularly inter-esting case study is that it provides an oppor-tunity to demonstrate how certain economicfactors, such as economies of scale and tradebarriers, can affect the internationalization ofan industry.
rf}[r: •IN1’EHNA’I’ION.~%I.JZA]L.ft1 (IF
TH.II BH.I.IVV.ING i~~~i)Fr~Fv
~ •TradcAs with most other goods, world merchandise
trade in beer has expanded rapidly over thepast 25 years (see figure 1). Much of the in-crease in world beer trade — and in worldtrade in general — can be attributed to suchfactors as lower trade barriers, more efficientcommunication and transportation technology,and growth in real personal incomes. The valueof world beer trade increased from $149 millionin 1965 to $2.08 billion in 1987, a 14-fold in-crease; at the same time, world trade in all
‘The FAQ Trade Yearbook indicates that Mexico was theworld’s third-largest exporter of beer in 1987.
goods increased to more than 12.5 times its1965 value. In more recent years, between 1980and 1987, world trade in beer expanded 83.8percent, while total world trade grew only 23.4percent. Despite its rapid growth, trade in beerin 1987 accounted for less than one-tenth ofone percent of total world merchandise trade.
On a volume basis, world trade in beer hasnearly tripled since 1965, growing at an averageannual rate of 6.5 percent between 1965 and1987. The largest exporters of beer in thisgrowing market, ranked by volume, are theNetherlands, West Germany, Czechoslovakia,Belgium and Canada (see table 1).’ The largestimporters are the United States, the UnitedKingdom, France, Italy and West Germany.
Beer imports as a percent of total consumption(IPC) and exports as a percent of production(EPP) are larger for some of the smaller exportersand importers than they are for some of thelarger exporting and importing countries. Astable 1 shows, among 25 importers, beer IPCranges from a low of 0.2 percent in Norway to16.4 percent in Italy. The percent of beer con-sumption accounted for by imports in the largestbeer importing country, the United States, isabout 5 percent.
Similarly, among exporters, figures for EPPrange from 0.4 percent in the United States to
N09939399/09039099$, 19913

Figure 1World Merchandise Trade
2000
1500
1000
500
41.6 percent in Ireland. The export numbers asa percent of production for such countries asthe Netherlands and Luxembourg, however, arequestionable as these countries do a significantamount of re-exporting to other countries (thatis, much of the beer reported as exports maysimply be imported and then re-exported forconsumption elsewhere).2
Few of the countries listed in table 1 arestrictly importers or exporters of beer. Most ofthe countries that export beer also import somebeer and vice-versa. This pattern of trade isknown as intra.industry trade. An examinationof the IPC and EPP statistics in table I show
20t1 (1988) notes that the Netherlands has a long history ofre-exporting imported goods.
3Ott (1988) notes that re-exported goods from theNetherlands are not included in the country’s importfigures.
that intra-industry trade in beer is more impor-tant to some countries than others. The largestexporter of beer, the Netherlands, imported on-ly 4.3 percent of the beer it consumed in 1987.~Similarly, the two largest importers of beer, theUnited States and the United Kingdom, exportedonly 0.4 percent and 1.9 percent of their beerproduction in 1987. Ireland, on the other hand,exported nearly 42 percent of its production,while importing more than 12 percent of itsbeer consumption.
The degree of intra-industry trade for a coun-try can be measured using a simple index, cal-culated for a given product as the absolute value
Billions of dollars iflailons of dollars2500 2000
2000
1500
1000
can
01966 68 70 72 74 76 78 80 82 84 1986
SOURCES: FAQ Trade Yearbook and International Financial Statistics Yearbook.
C

table ISelected 1987 Brewing Industry Statistics
Average Annual ~rowthRate, 1915 to 1987
xports lntpotts Inks Industry xports imports Per ImportsExports Imports A Percent at As Percent at trade Index As Percent of As Percent of Capita Per1000 HL 1000 IlL Production Consumption 1915 1901 Production Consumption Consumption Capita
Australia 7283 70.0 39% 04% 83 82 150% 17.0% —1.7% 147%Austna 3610 2850 40 3~2 33 12 1.4 —0.1 10 0,2Belgium 2537.0 5655 181 47 23 .64 24 53 0.5 57Canada 24158 448.0 lOS 21 63 .69 138 520 0.4 50,7Czechoslovakia 2898.0 0.0 12 I 00 1 00 1 00 59 0.0 0.7 0.0Denmark 19340 208 28 03 .95 .98 03 0.2W Germany 5706.0 13016 62 16 54 63 82 83 0.2 8.1Finland 228 139 01 04 .60 24 537 1711 19 1846France 8720 24459 34 113 56 57 2.4 24 11 13S Germany N/A N/A N/A N/A .26 N/A N/A N/A 1.6 N/AHungary 00 12900 0.0 126 N/A 100 00 286 2,5 —083Ireland 20860 4150 41.8 12$ 98 .67 21 39.0 20 35.9Italy 731 2162.8 0,7 164 .85 .93 205 5.7 69 12.9Japan 29~3 224.0 05 04 13 13 IS 196 20 22.6Luxembourg 2703 422 409 96 79 73 07 05 08 0.3Netherlands 5725 2 349 32.6 4 3 89 83 6.2 2.4 0 8 2 8Newzealand 832 705 20 11 88 08 72 367 0,1 33.9Norway 19,2 4050 09 02 89 .62 —12.2 226 11 26.6Poland 3271 106.2 28 09 14 .51 123 1.5 107Portugal 74.5 34.3 1 5 07 97 .37 10 9 N/A 3.7 N/ASpain 121.0 7350 08 28 58 .72 14,5 19.3 2.7 2 4Sweden 449 3444 11 19 .91 71 720 84 —i.2 7.0Switzerland 36.7 485.9 0.9 105 75 86 28 6.4 03 8 1USSR N/A 9000 N/A 11 N/A NIA 00 88 14 70United Kingdom 11400 40931 19 65 54 56 31 34 0.4 2.9USA 9197 109911 04 50 80 85 221 137 0.8 147
SOURCE- Derived from information in the Brewers Association of Canada InternatIonal Survey Alcoholic Beverage Taxation and Control Policies.
1 HL 100 liters 26 4 gallons
Denmark s beer Imports were generally small and declining throughout the period However a few relatively large Increa e in import in later years aused imports ac apercent of consumption and imports per capita to grow at average annual rates of 218 and 2,146 4 respectivelyAverage annual rate of growth for 1978 1986

of the difference between exports and importsdivided by the sum of exports and imports.~Ifthe index is close to zero, the degree of intra-industry trade is substantial. An index value ofone indicates that there is no intra-industrytrade. This index, labeled the “Intra-IndustryTrade Index” and shown in table 1, was calcu-lated for beer trade in 1975 and 1987.
Of the 23 countries for which the index couldbe calculated for both years, nine countries’ in-dexes rose over the period, indicating less intra-industry beer trade. In 12 countries, the indexesdeclined, indicating that intra-industry beer tradehad increased. Only five countries in table I hadan intra-industry index value of less than 0.5 in1987. The majority (70 percent) had an indexvalue of more than 0.5 in 1987, which indicatesthat intra-industry trade plays a minor role inthe brewing industry in general, although it hasbecome more prevalent during the past 15 years.
The growth rates of IPC and EPP provide fur-ther evidence of the increasing importance ofintra-industry trade to the brewing industry. Ofthe 20 countries in table I reporting increasedEPP between 1975 and 1987, 16 also reportedincreased IPC. Similarly, of the 19 countriesreporting increased IPC, 16 reported increasedEPP, In sum, merchandise trade in beer has ex-panded rapidly during the past 25 years, withintra-industry trade playing a small, but growing,role in beer trade.
.Licensing •/ih’rt~~111e1sts
Brewers also use licensing agreements to maketheir products available to foreign consumers. Atypical license agreement allows a brewer inone country to brew and market the beer of aforeign brewer. One example is Anheuser-Busch’s (A-B) licensing agreement with the Cana-dian brewery John Labatt Ltd. This agreementallows Labatt to brew and market some A-Bbeers, such as Budweiser and Michelob, in Cana-da. In return, Labatt pays a royalty fee to A-B.Of course, the licensing brewers insist that theconsistent quality of their products be main-tained. In essence, the licenser is selling its
know-how in brewing a specific beer, the rightto use a trademark and the name recognition ithas buih for that trademark in exchange for aroyalty payment from the licensee. There wereat least 30 licensing agreements among variousbrewers around the world in 1987 (see table 2).
Several factors that are not mutually exclusivepromote the use of licensing agreements. First,some firms use licensing agreements to circum-vent trade barriers. For example, U.S. beersthat are brewed in Canada under license agree-ment are not subject to either the Canadianfederal tariff or the discriminatory mark-upsthat other imported beers face at the provincialgovernment outlets.~Second, the physical quali-ties of beer promote the use of licensing agree-ments. Beer is about 90 percent water, so trans-portation costs can be reduced through localproduction. In addition, beer has a shelf-life ofabout three to four months, of which two tothree weeks could be taken up by overseasshipment. Also, when companies enter newmarkets, they often find it more profitable tolicense existing plants and distribution systemsto handle their products rather than build theirown plants and establish their own distributionsystems.
The import and export figures discussed previ-ously did not include consumption of foreign-held brand names that are brewed domesticallyunder a licensing agreement. Thus, the degreeof internationalization is understated when onlymerchandise trade is analyzed. Information onthe amount of beer brewed under licensingagreements is usually closely held by the com-panies involved, and not much data are publiclyavailable. The Conference Board of Canada,however, has estimated the impact of licensedbrewed beer in the Canadian beer market andits findings serve to demonstrate how importantlicensed production can be.
In the Canadian market, three U.S. brewers,Anheuser-Busch, Coors and Miller, had licensingagreements with the three largest Canadianbrewers— John Labatt, Molson and CarlingO’Keefe— respectively, in 1986.G The Conference
4See Gray (1987), pp. 243-49.5The U.S-Canada Free Trade Agreement eliminates thefederal tariffs on beer between these countries, but doesnot alter the pricing practices of the provincial liquoroutlets. See Carter, et al (1989) for a more detaileddescription of Canadian barriers to beer trade.
6Molson and Caning O’Keefe agreed to merge theirbreweries in 1989. The new company is called MolsonBreweries and will continue to brew for Coors and Millerunder license.

C) C)
C,

Board estimates that brands produced in Canadaunder license with U.S. brewers in 1986 mayhave accounted for as much as 15 percent ofbeer sales in Canada.’ This amounts to approx-imately 2.7 million barrels of U.S. brands pro-duced and sold under license agreements inCanada in 1986. If these estimates are correct)the volume of licensed production of U.S. beersin Canada was more than 17 times the amountof beer exported directly to Canada in 1986 andmore than four times the amount of total U.S.beer exports to all countries (exclusive of ship-ments to U.S. military bases and Puerto Rico).8In terms of Canadian consumption, the licensedbrewed beer might have accounted for 15 per-cent of Canadian beer consumption comparedwith the 2.1 percent of domestic consumptionaccounted for by imports.
The numerous licensing agreements withbreweries in Japan and the United Kingdommight indicate that beer produced under licenserepresents a significant part of the foreign beerconsumed in these countries. At least in somecountries, beer produced under license clearlyaccounts for a much larger portion of foreignbeer consumption than does imported beer.
.Fo.reiqn IJirect .Invesftnent
In addition to merchandise trade and licensingagreements, the internationalization of the brew-ing industry has been characterized by the in-creasing production of beer by foreign-owned”firms. This production reflects the increasingfrequency of foreign direct investment (FDI), inwhich one brewer purchases an existing firm orinvests in a new or existing facility in a foreigncountry. Like licensing agreements, FDI is asubstitute for merchandise trade. Firms may beprompted to use FDI for the same reasons theyuse licensing agreements. In addition) such fac-tors as lower labor and energy costs and lessgovernment regulation may also encourage theuse of FDI.
Several brewers have invested capital inbreweries outside their home countries. TwoAustralian brewers, Elders IXL and Bond) have
used this method of globalization extensively.Elders purchased Courage Ltd. of England in1986, then purchased Carling O’Keefe breweriesof Canada in 1987, Early in 1989, Britain’s De-partment of Trade and Industry blocked theproposed takeover of Scottish & NewcastleBreweries PLC by Elders IXL Ltd.°In 1990, EldersIXL announced that its United Kingdom Couragebreweries would purchase Grand I\.etropolitan’sU.K. brewing and brands interests and its beerdistribution and wholesaling activities. Further-more, Courage’s 4,900 pubs will merge withGrand Met’s 3,570 pubs in a joint venture underthe name Inntrepreneur Estates.1°Bond haspurchased two U.S. breweries, Pittsburgh Brew-ing and G. Heileman.
Japanese brewers also have actively investedin foreign brewery operations. In 1989, Tat-suuma-Honke Brewing Co. announced plans tobuild a sake brewery on the grounds of theCoors brewery in Colorado. In 1990, AsahiBreweries Ltd. announced plans to invest $70million to open a brewery near Denver, Colorado,where it will produce a dry beer.” Finally, theCanadian brewing company John Labatt Ltd.purchased Latrobe Brewing Co. of the UnitedStates in 1987.
THE ECONOMICS OF •INTFHNCTIONALIZATION
Underlying the preceding description of theinternationalization of the brewing industry at-csome economic factors. The next section outlinesthe reasons why demand for foreign beer canexist in a country that already produces somedomestic brands and discusses how changingrelative prices and rising income can expandthe demand for foreign beer. ‘I’he second sec-tion analyzes the basic economic factors thatdetermine the type of international transactiona brewery will use to put its products in thehands of foreign consumers. A more technicalpresentation of the economics discussed in thesetwo sections is provided in appendixes to thisarticle.
‘Conference Board of Canada (1989), p. 9.°Datafor U.S. beer exports to Canada and total U.S. beerexports, exclusive of shipments to military bases, PuertoRico and the territories, were provided courtesy of R.S.Weinberg & Associates.
°Carrington(1989).
“See Thornhill and Harris (1990), Harris (1990) andSherwell (1990).
““Japan’s Asahi Plans Brewery in U.S.” (1990).
,,,,c,,,,,n,)r ~ ~ flr C,t fl~

Foreign Demand: Abe Attributes the low-calorie beer the rest of the time.
.Appruaeb
P ~ ije,nnnd for .t’ore& a Eser tTan ExistOne reason why people consume foreign beer isthat they can buy it at a price at which theywant more beer than domestic brewers want toproduce. That is, the quantity of beer demand-ed is larger than the quantity of beer supplieddomestically at the price of foreign beer) andtherefore, some foreign beer is imported tomeet the excess demand. Another reason whypeople consume foreign beer is that at leastsome consumers prefer the attributes, or char-acteristics, of the foreign beer over domesticbrands. This second possibility is discussed inthis section.
In general, consumers purchase beer for theservices” that the~’feel it can provide.” Con-
sumet’s have a wide variety of beer brands tochoose from and, subject to pr’ice and incomelimitations, will choose those brands that havethe attributes that most closely niatch their de-sired services from drinking beer. Many attri~butes, such as taste, caloric content, alcoholcontent and packaging, distinguish one brandfrom another, and each combination of charac-teristics offers a distinctl different package ofservices.
Brewers differentiate their products on thebasis of attributes and price. Consumers com-pare the package of services provided by a par-ticular beer and its price to the services andprices of other brands. If consumers prefer theservices of foreign beer over domestic beer, atgiven market prices, then demand for foreignbeer will exist in a country.
Of course consumers do not necessarily con-sume only one domestic beer or foreign beer.Consumet- satisfaction may be maxinuzed bypurchasing a combination of domestic and for-eign beers. Suppose a consumer prefers thetaste of a high-calorie foreign beer over all otherdomestic brands, but needs to watch his caloricintake and finds the taste of a particular brandof light beer to be acceptable. This consumermight purchase both the foreign and domesticbeers, drinking the foreign beer in limitedamounts, say, on special occasions, and drinking
(;.,~ffi in the ,tJsn,nnit tSr 1’orsinEssr-~
The demand of foreign beer can expand if itsprice falls relative to the price of domestic beer.If a consumer had been purchasing domesticbeer, the relative fall in the price of the foreignbeer may be enough to compensate him for anyperceived loss in services due to switching fromthe domestic to the foreign brand. In this case,the quantity demanded of the foreign beer willincrease. The decline in the relative price of theforeign beer may also encourage people whoalready consume it to purchase more. Unfor-tunately, data on imported beer prices arescarce, and thus the role that changing relativeforeign beer prices has played in the globaliza-tion of the industry is uncertain.
Increases in consumer incomes can also spurthe demand for foreign products. When con-sumers’ incomes increase, they are able to pur-chase more of all of the products they desire. Ingeneral, however, the quantities purchased ofsome goods, like flour, decline as incomes rise,while quantities of other goods purchased, likefurniture, increase as incomes rise. The statisticalevidence relating beer consumption to incomegrowth is mixed.” Some studies have shownthat the quantity of beer consumed increases asincome increases, while others have shown theopposite.
Although little work has been done to estimatethe relationship between foreign beer consump-tion and income in general, there is some datato suggest that the demand for foreign beermight be positively influenced by increases inincome. All 21 OECD countries in table 1 thatprovided import data on beer had positive percapita gross domestic product growth between1975 and 1986; 16 of these reported a positiveaverage annual rate of growth of beer importsper capita and imports as a percent of consump-tion. In addition, the maiket for imported beersgrew much more rapidly than most domesticbeer markets during the late 1970s and early1980s, a period of income growth for mostcountries. These figures roughly suggest thatper capita income growth has contributed tothe internationalization of the brewing industry.
“Much of the information in this section on the attributesmodel is taken from Douglas (1987).
“For a review of beer demand estimates, see Ornstein(1980). Also see Heien and Pompelli (1988). The estimated
income elasticity of beer in these studies ranged from-0.46 to 0.79.
NOVEMBER/DECEMBER 1990

Li bert:: to ..Ftuu’ueeBt/.er: St.nnetCCtflltIitfltCS
Once a firm determines that foreign demandfor its products exists, it must determine thelowest-cost method of supplying these productsto the foreign market. Should the firm use directexports, a licensing agreement or direct foreigninvestment to enter the target market? Theanswer is relatively simple, in theory, and isbased on the principle of profit maximization.
A brewery’s total cost of supplying a foreignmarket is equal to the beer’s cost of productionplus transportation and distribution costs, mar-keting costs and overhead. A brewery’s cost ofproducing beer is a function of its productiontechnology and the cost of its inputs, such aslabor, agricultural ingredients and packagingmaterials. Research has shown that the averagecost of producing beer declines as productionexpands.” That is, economies of scale exist inthe brewing industry. Economies of scale en-courage direct exporting when the quantitydemanded of foreign beer is relatively small andencourage foreign production either throughlicensing or foreign direct investment when thequantity demanded is relatively large.
Suppose a U.S. brewer and a Japanese brewerhave identical production functions exhibitingeconomies of scale and that the firms pay thesame price for their inputs. That is, their averagecost of production curves are equal and areshaped as shown in figure 2. (For simplicity,assume that the U.S-Japan exchange rate is fixedthroughout and, given this exchange rate, Japa-nese prices are stated in U.S. dollars.) As thebrewers expand production, the average cost ofproducing a unit of the product falls up to apoint, after which average costs no longer de-cline but stabilize. Assume that Japanese de-mand exists for a beer—called Colony—producedby the U.S. firm. The U.S. firm must determinewhether it can supply the Japanese marketcheaper by producing Colony domestically andexporting or by producing it in Japan, eitherunder license or by FDI.
Now suppose that supply and demand condi-tions and price in the U.S. are such that
American consumers consume Q,,, units of Col-ony, as shown in figure 2. (Note that the supplyand demand curves are not shown in figure 2and the quantity Qm is simply given.) This sub-stantial amount of consumption allows the U.S.firm to achieve significant economies of scale,producing Q0~units of Colony at an averagecost of C, per unit. Also assume that marketconditions are such that a relatively small quan-tity of Colony, Q,, , is demanded in Japan. Sincethe U.S. brewer is already producing some Col-ony for domestic consumption, expanding pro-duction to meet the extra demand of Colony inJapan would allow the U.S. brewer to movedown its average cost-of-production curve frompoint A to point B, where it could produce Col-ony for C.”
The alternative to producing the beer in theUnited States and exporting it is to produce Col-ony in Japan. Since Colony is currently not be-ing produced in Japan, the Japanese firm orbranch brewery built by the U.S. firm wouldhave to brew the relatively small amount of Col-ony, Q,, , at a high average cost of production,C,. In other %vords, the relatively small quantityof production will not allow the Japanese plantsto achieve significant economies of scale. Thus,producing Colony in the United States for ex-port would save the brewer C, —C, per unit ofColony. If the cost of transporting Colony toJapan and distributing Colony in Japan is lessthan the difference between C, and C,, then theU.S. brewer would maximize pt’ofits by exportingColony to Japan. If the quantity demanded ofColony in Japan were larger, it might be moreprofitable for the brewer to use a licensingagreement or foreign direct investment.
Suppose that the quantity of Colony sold inJapan grows to Q,2 as shown in figure 3, whilesales of Colony in the United States remain at
Q~-Since the U.S. brewer has exhausted itseconomies of scale, it cannot produce Q0~+Q,,at a lower per unit cost than that for Q0~+Q,1.The Japanese brewery, however, by increasingproduction from Q,, to Q,, could now matchthe U.S. brewer’s cost of production because ithas also achieved the lowest possible averagecost of production. Thus, given equal average
‘4Elzinga (1973), Fuss and Gupta (1981), Keithman (1978)and Scherer (1973) all provide evidence that economies ofscale exist in the brewing industry. See Thompson (1985)or any micro-economic text for a discussion of the reasonswhy economies or diseconomies of scale can exist at theplant level.
“For simplicity, we have ignored any quantity response,stemming from lower prices, that might occur in the U.S.market as a result of the expanded output.

Figure 2Average Cost of Production: US. Plant AchievesEconomies of Scale
C)
V
‘N
Qj-i Otis 0us + Qji
Average totalcost ofproduction
Quantityof output
Figure 3Average Cost of Production: U.S. and JapanesePlants Achieve Economies of Scale$Cost
Quantityof output
$Cost
C3’
C2C1
C1
Avera.oe totalccst ofSi, ~%ofl,,t,,C,) ~
QJ1 QUS Otis + Oji 0J2 QUS + 0J2

production costs, the U.S. firm will now preferto either negotiate a licensing agreement withthe Japanese brewer or use FDI, thereby savingthe additional export-related expenses of ship-ping Colony overseas and distributing it withinJapan.
Like transportation costs, trade barriers alsooffset production cost advantages. If a targetcountry has high tariffs or distribution systemsfor imported goods that are relatively costly,production cost advantages in the home countrymay be offset and licensing and foreign directinvestment become the only feasible methods ofentering the target market. As shown below,trade barriers have had a significant effect onthe choice of licensing agreements and foreigndirect investment in the internationalization ofthe brewing industry.
In Japan, two types of barriers inhibit foreignbeer from entering the country. The mostsignificant of these is the Japanese distributionsystem. The Japanese have a complex multi-tiered system, comparable to the U.S. beerdistribution system, in which beer moves fromproducer to wholesaler to consumer.’6 In addi-tion, Japan has little warehouse space, whichmeans shipments are smaller and more frequentthan in the United States. Both aspects of theJapanese distribution system raise the cost ofdistributing beer in Japan, relative to less com-plex systems. Japan also charges a small customsduty on imported beer. These factors raise thecost of exporting beer to Japan and make licens-ing agreements or foreign direct investmentrelatively more attractive methods of sellingbeer in Japan.
A GATT panel ruled in 1988 that specificpractices of the Canadian provincial govern-ments discriminated against imported beer.”Canadian trade barriers include discriminatorymark-ups at provincial liquor outlets and dif-ferent marketing techniques for foreign beer,
such as smaller packages and warm foreignbeer sales at the governmental outlets. Thesenon-tariff barriers have prompted U.S. brewersto use licensing agreements in Canada eventhough several brewers have U.S. plants thatare located quite close to the Canadian border.The Australian brewer Elders IXL has chosen touse foreign direct investment to enter the Cana-dian market. This creates an interesting situa-tion in which a U.S. beer is being made underlicense in a Canadian brewery that is partiallyowned by an Australian brewer.
As in Japan, distribution practices are themain barriers to trade in the United Kingdom.Most beer consumed in the United Kingdom isdraft beer, and most of this is sold in pubs.Many pubs are owned outright by breweries,managed by the breweries or leased to in-dividuals who enter into exclusive supply agree-ments with the breweries. This system was thesubject of eight investigations between 1966 and1986, that focused chiefly on pricing and supplycompetition.’~Given the relationship betweenthe pubs and the domestic breweries, foreignlabel brewers have problems getting localbrewers to carry their products in British pubs.Thus, many foreign brewers have chosen to uselicensing agreements with domestic firms topenetrate the U.K. beer market. Foreign directinvestment has also been used to enter thismarket.
The brewing industry has evolved from an in-dustry that concentrated on domestic marketsto one that views itself as part of a global mar-ket. This internationalization has occurred viathe use of merchandise trade, licensing agree-ments and foreign direct investment. Merchan-dise trade in beer has developed in an intra-industry pattern, whereas international transac-tions in licensing agreements and foreign directinvestment have not developed, in general, in abilateral pattern. Licensed production and pro-duction at foreign-owned breweries likely ac-count for an unknown, but probably large, partof foreign beer consumption in some countries.
“See VandeWater and Curiey (1990).“G. Heileman Brewing Co. filed a Section 301 trade action
against Canada over unfair pricing and distribution prac-
tices of provincial governments. See Daily Report for Ex-ecutives (1990).“Brewers Association of Canada (1989), pp. 387-88.

Two conditions must hold for trade in similar Gray, H, Peter. International Economic Problems andgoods, such as beer, to occur. First, the foreign Policies (St. Martin’s Press, Inc., 1987).
product must offer a combination of desired at- Harris, Clay. “Time for Takeovers, Gentlemen Please,”Financial Times, March 14, 1990, London, England.tributes that are not available to domestic con-sumers from domestic products. Second, it must Heien, Dale, and Greg Pompelh. “The Demand for AlcoholicBeverages: Economic and Demographic Effects,” Southernhe profitable to produce the product for the Economic Journal (January 1989), pp. 759-70.foreign market. Which type of international Horstmann, Ignatius. and James R. Markusen. “Licensing
transaction will be used to supply a foreign mar- Versus Direct Investment: A Model of Internationalization byket with heei is i-elated to the existence of eco- the Multinational Enterprise,” Canadian Journal ofEconomics (August 1987), pp. 464-81,nomies of scale, distribution costs and tradeharriers. International Monetary Fund. International Financial
Statistics Yearbook (1989). pp. 122-23.
“Japan’s Asahi Plans Brewery in U.&” St. Louis Post-Hii:FUHiYL(;F:S Dispatch, January 3, 1990.
Keithman, Charles. The Brewing Industry, Staff Report of theBrewers Association of Canada. International Survey: Bureau of Economics, U.S. Federal Trade CommissionAlcoholic Beverage Taxation and Control Policies, 7th ed, (1978)(Ottawa, Canada, June 1989).
Carrington, Tim. “Britain Blocks Elders Takeover of Big Lancaster, K. “A New Approach to Consumer Theory,” Jour-nal of Political Economy (April 1966), pp. 132-57.Brewer; Government Urges Reforms in Reflecting Firm’sOffer for Scottish & Newcastle,” The Wa/I Street Journal, _______- Consumer Demand: A New Approach (ColumbiaMarch 22, 1989. University Press, 1971).
Carter, Cohn A., Jeffrey Karrenbrock and William W. Wilson. Ornstein, Stanley I, “Control of Alcohol Consumption“Freer Trade In the North American Beer and Flour Through Price Increases[ Journal of Studies on AlcoholMarkets;’ in Andrew Schmitz, ed., Free Trade and (September 1980), pp. 807-18.Agricultural Diversification: Canada and the United States,(Westview Press, 1989). Ott, Mack. “Have U.S. Exports Been Larger Than
Reported?” this Review (SeptemberlOctober 1988), pp.The Conference Board of Canada. The Canadian Brewing In- 3-23.
dustry: Historical Evolution and Competitive Structure, (Ot-tawa, Canada, February 1989), Scherer, EW. “The Determinants of Industrial Plant Sizes in
Six Nations,” Review of Economics and Statistics (MayDaily Report tor Executives. (The Bureau of National Affairs, 19Th), ~ 135-45.
Inc., Washington D.C., May 18, 1990), p. A-aDouglas, Evan J. Managerial Economics: Analysis and Sherwell, Chris. “Foster’s Brewing Sees Global Sales of
Strategy 3rd ed, (Prentice-Hall, Inc., 1987). ~. 86-103. A$9bn,” Financial Times, March 14, 1990, London, England.Elzinga. Kenneth G. “The Restructuring of the U.S. Brewing Thompson, Arthur A. Economics of the Firm: Theory and
Industry,” Industrial Organization Review (Vol. I, 1973), pp. Practice, 4th ed. (Prentice-Hall, Inc. 1985).101-14. Thornhihl, John, and Clay Harris. “GrandMet and Elders Un-
Finnegan, Tern. “International Licensing Pacts on the Rise,” veil Swap Details;’ Financial Times, March 14, 1990, Lon-Modern Brewery Age (July 13, 1987). don, England.
Food and Agricultural Organization of the United Nations, VandeWater, Judith, and John Curley. “Beer BarrelsFAO Trade Yearbook various issues. Eastward;’ St. Louis Post-Dispatch, June 11, 1990,
Fuss, Melvyn A., and Vinod K. Gupta. “A Cost Function Ap- Weinberg, R.S. & Associates. “Tax Free Removals, Destina-proach to the Estimation of Minimum Efficient Scale, tion of Exports and Consumed on Brewery Premises,Returns to Scale, and Suboptimal Capacity,” European 1947-1988” (Brewing Industry Research Program, St. Louis,Economic Review (February 1981), pp. 123-35. Missouri).
‘~r),n)n,

Appendix Aire.,,I.~t,zi IIft.fl~tP~flfIIOIF Beer: I’I1,3 Altritintee ]%‘iodid
The attributes model, introduced by Lancaster(1966, 1971), can he used to show how demandfor foreign beer can exist in a country in whichdomestic brands are already produced.’ Supposea consumer chooses between two brands ofbeer so that, subject to income limitations, hissatisfaction from the services provided by thebeer is maximized. For simplicity, assume theconsumer values only two attributes of beer:taste and low calories. The two types of beerprovide these attributes in differing proportionsand at different prices.
After’ sampling both products, the consumerrates each brand on a scale of I to 3, 3 beingbest, for both taste and calorie content, as shownin table Al. Brand F is a foreign beer that tastesgreat, but is high in calories (thus receiving alow rating on caloric content) giving it a rela-tively high ratio of taste-to-calorie appeal. BrandD, a domestic beer, does not taste quite asgood, hut is very low in calories. This beer thenhas a relatively low taste-to-calorie appeal ratio.
Table AlAttribute Ratings and Prices of ThreeBeers
Ratio ofAttribute Rating taste to Bar price Bottles
Brand Calories Taste calories perbottle per $12
D 3 t 113 6
F 1 3 3 53 4
‘l’he amount of each beer the consumer canpurchase is determined by his income andthe price of the products. Assume that theconsumer has decided to spend 512 on beerduring a visit to a local bar and the cost ofeach kind of beer is as shown in table Al - Ifhe spends the entire $12 on only one pro-duct, he could buy at most six bottles of D orfour bottles of F. Four bottles of F wouldprovide 4 units (4 bottles X I unit of caloric
Figure AlMaximization of Utility by ConsumingOnly Domestic BeerTaste
appeal per bottle) of the caloric attribute andunits (4 X 3) of the taste attribute.
The two products are depicted in figure Al inan attribute space as rays from the origin. Theslope of each ray is determined by the ratio oftaste to calorie appeal. If the consumer drinkshr-and F, then he moves out along ray F, absorb-ing the two attributes in a ratio of 3:1. Points Aand B represent the maximum amount of thetwo attributes that can he obtained by consum-ing beers F and D, respectively, given the ~spend-ing constraint of $12.
Joining points A and B provides the consumer’sefficiency frontier. The efficiency fr-ontier is theouter boundary of the attainable combination ofthe two attributes, given the budget constraintof $12. It is called efficient because a utility-maxinizing consumer will get more utility bybeing on the frontier rather than within thefrontier, even though these interior points areattainable.
1Much of the information in this appendix follows thediscussion of the attributes model as presented byDouglas (1987), pp. 86-102.
F
D
12

Figure A2Maximization of Utility by ConsumingOnly Foreign BeerTaste
Figure A3Maximization of Utility by ConsumingBoth Domestic and Foreign Beer
Flow do we know which beer, or combinationof beers, the consumer will choose? In the at-tributes model, consumer’ preferences betweenattributes can be expressed using indifferencecurves. Like indifference curves used to expressthe marginal rate of substitution (MRS) betweentwo products, the attribute indifference curvesexpress the MRS between attributes, and higherindifference curves represent higher levels ofutility. The beer consumer’s assumed attributeindifference curves I, and 11 have been superim-posed on the attribute space in figure Al. As-suming that a consumer wishes to maximize hissatisfaction from taste and caloric content, hewould choose to be on the highest attainable in-difference curve, which occurs at point B infigur-e Al.
The position and slope of the indifferencecurves will determine the brand or brands ofbeer chosen. This particular consumer has anindifference curve that is relatively steep indi-cating that, compared with a consumer with aflat indifference curve, he is willing to give up alot of taste to get a few less calories.
Now suppose that a different consumer, whogives the beers the same attribute ratings, iswilling to consume a lot more calor’ies to gain abit better taste. The shape of this consumer’s in-difference curve would be more flat, and asshown in figure AZ, this person would choose
the foreign brand F, at point A. Thus, in a socie-ty where some consumers prefer the attributesof foreign beers over domestic beers, a demandfor foreign beer will exist.
Figure A3 shows an example of a consumer’who would purchase both foreign and somedomestic beer. Neither of the beers provides theattributes exactly in the ratio represented bypoint N. The consumer could reach this point,however, by consuming some of both products.By consuming L units of the domestic brand,the consumer would obtain Y, units of taste andX, units of caloric appeal. By spending the restof his budget on brand F, the consumer wouldtravel along the path LN, which has the sameslope as ray F, to obtain the X,—X units of calo-rie appeal and the Y2—Y units of taste neededto reach his maximum level of utility at point N.Alternatively, the consumer could have startedby consuming M units of brand F and then con-sumed L units of brand 13 to reach point N.
Grnni:h in IT’&j,:nflpn,nnd
The demand for foreign beer can increase ifthe relative price of the foreign beer falls. Asshown in figure A4, when the price of the for-eign beer falls, the maximum amount of theforeign brand that can he purchased increases,
F
V2
Low in calories
Vi
x, x2

16
Figure A4 Figure A5The Price Effect Shown by the AttributeApproach
Taste
The Income Effect Shown by the AttributeApproach
shifting out the efficiency frontier from AB toBC. In this example, the consumer goes frombuying some of both brands at point X to onlybuying the foreign brand at point C.
Expanding incomes can also explain increasedconsumer demand for foreign beer. In figureAS, the consumer’s increase in income has ledto a shift from buying only the domestic beer tobuying some of both beers. Initially the con-sumer’s efficiency frontier is AB, the highest in-difference curve attainable is I, and the con-sumer purchases only the domestic product 13.When the consumer’s income increases, the effi-ciency frontier shifts out in a parallel fashion toA’B’, because prices and attributes are fixed andonly income is changing. For the given pricesand attributes, the increased income allows more
consumption of each beer. To maximize utility,the consumer shifts to point C on the higher in-difference curve I,, where he consumes some ofboth brands of beer. Thus, a higher level of in-come has induced the consumer to purchasemore of the foreign brand of beer.
Of course, the example could have been con-structed to show how a shift in the consumer’sincome could have led to a reduction in theamount of foreign beer purchased. Several re-searchers have estimated the demand for beer,but no conclusive evidence has been providedas to whether beer consumption expands as aconsumer’s income expands. Some data, as dis-cussed in the text, however, suggest that the de-mand for foreign beer might be positively in-fluenced by increases in income.
‘F
1—
Low In calories Low in calories
S ..i U C .Ui Ut. .615 .61
/ / / , 5’ // / / ‘‘‘a //
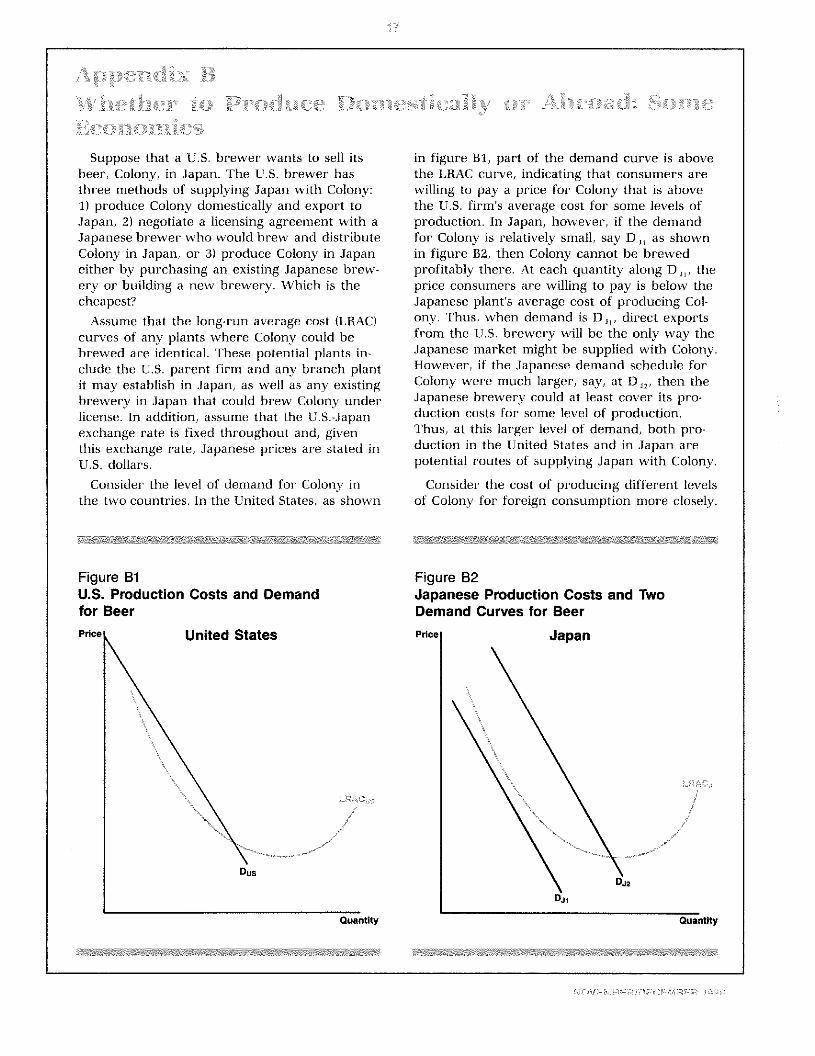
Suppose that a U.S. brewer wants to sell itsbeer, Colony) in Japan. The U.S. brewer hasthree methods of supplying Japan with Colony:I) produce Colony domestically and export toJapan, 2) negotiate a licensing agreement with aJapanese brewer who would brew and distributeColony in Japan, or 3) produce Colony in Japaneither by purchasing an existing Japanese brew-ery or building a new brewery. Which is thecheapest?
Assume that the long-run average cost (LBAC)curves of any plants where Colony could bebrewed are identical. These potential plants in-clude the U.S. parent firm and any branch plantit may establish in Japan, as well as any existingbrewery in Japan that could brew Colony underlicense. In addition, assume that the U.S--Japanexchange rate is fixed throughout and, giventhis exchange rate, Japanese prices are stated inU.S. dollars.
Consider the level of demand for Colony inthe two countries. In the United States, as shown
in figure BI, part of the demand curve is abovethe LRAC cur’ve, indicating that consumers arewilling to pay a price for Colony that is abovethe U.S. firm’s average cost for some levels ofproduction. In Japan, however, if the demandfor Colony is relatively small, say 13, as shownin figure B2, then Colony cannot be brewedprofitably there. At each quantity along 13 ,,, theprice consumers are willing to pay is below theJapanese plant’s average cost of producing Col-ony. Thus, when demand is 13 ~, direct exportsfrom the U.S. brewery will be the only way theJapanese market might be supplied with Colony.However, if the Japanese demand schedule forColony were much larger, say, at 13,,, then theJapanese brewery could at least cover its pro-duction costs for some level of production.Thus, at this larger level of demand, both pro-duction in the United States and in Japan arepotential routes of supplying Japan with Colony.
Consider the cost of producing different levelsof Colony for foreign consumption more closely.
Figure B2Japanese Production Costs and TwoDemand Curves for BeerPrice Japan
Figure 81U.S. Production Costs and Demandfor Beer
United States
Quantity Quantity

Figure 83U.S. Plant’s Production Costs
$Cost
C4
C3
C1
United States
-
- 1~
,,/7
Cm “~y~-
—IQus’—~-2Qus+Qji
0us +°J2 Quantity
The goal is to determine which type of interna-tional transaction allows the firm to provideColony to the Japanese market at the lowestcost. First, consider the U.S. brewer’s cost ofproducing and exporting Colony to Japan. As-sume for a given market price, the quantity ofColony demanded in the United States is Q~,asshown in figure B3. The U.S. brewer producesthis amount at an average cost of C, per unit.
Now suppose that for a given price, the quan-tity demanded of Colony in Japan is Q,,, asshown in Figures B3 and B4. Since the U.S.brewer already produces some Colony for do-mestic consumption, by expanding productionto Q~+Q, to meet the export demand, the U.S.brewery could move down its LRAC curve frompoint A to B in figure B3, lowering its averagecost of producing Colony from C, to C,.’ If thequantity demanded of Colony in Japan waslarger, at Q,,, the U.S. brewery’s average costof pr’oducing it would fall even further to C, atpoint C. By doing a similar analysis for otherquantities of U.S. exports, we can develop the
QJ2
Figure B4Japanese Plant’s Production CostsCompared to U.S. Plant’s Cost ofExporting
Figure B4 allows a straightforward com-parison of the production costs of exports toJapan, LRAC~,5,with the production of thesequantities in Japan, LRAC,. It shows that theaverage cost faced by the U.S. brewer produc-ing a given amount of Colony for export is lowerthan the Japanese br’ewer’s average cost, LRAC,,up to the quantity Q,,, but higher for all subse-quent levels. This is possible, even when costcur’ves are identical across countries, becausethe U.S. plant was already producing Colony fordomestic consumption and that by expandingproduction to meet export demand, the averagecost of producing Colony fell. The Japaneseplant curr’ently is not producing any Colony; ifit were to start brewing Colony for Japaneseconsumption, it would have to start at a highercost on its long-run average cost curve.Economies of scale, however, do not continueindefinitely. Consequently, the cost of producing
‘For simplicity, the analysis ignores any potential salesprice decline in the United States that may stem from thebrewer achieving greater economies of scale. Thus, the
quantity demanded in the United States, after productionis increased to meet export demand, is assumed to remainat the same level as before export production occurred.
$Cost Japan
Qj’ Q~Qj2
Qj3 Quantity
U.S. brewer’s cost of producing differentamounts of Colony for expor’t to Japan, shownby the line LRAC~~in figure 84.

Colony eventually starts to rise and the Japaneseplant can produce Colony cheaper than the U.S.plant after point Q,,.
Thus far, the discussion has focused solely onthe cost of producing Colony. Transportationand distribution costs are likely to influencewhere production is located. Assume that itcosts the same per unit to ship and distribute asmall amount of Colony as it does a large amountof Colony. Since the U.S. plant has to ship Colonyoverseas, it is reasonable to assume that itstransportation and distribution costs will be sig-nificantly higher than a Japanese plant’s wouldbe if Colony were produced there. Adding theseaverage per unit transportation and distributioncosts to the plant’s respective long-run averagecost of production curves gives the two dashedlines, LRAC~5+t~,and LRAC,+t,, shown infigure B4. The U.S. plant can produce, transpor’tand distribute Colony to the Japanese market ata lower cost than the Japanese brewery can upto the quantity Q. Notice that the additionalcosts of transportation and distribution havelowered the quantity at which the U.S. brewerycan compete from Q,, to Q’. At quantitiesbeyond Q’, the Japanese firm can produce anddistribute Colony for less than C,, giving it acost advantage over the U.S. brewer.’
Because of the cost advantage, for any givenquantity of Colony demanded in Japan up to Q,the U.S. firm would prefer to produce Colonydomestically and export the product to Japan. Ifthe quantity of Colony demanded in Japan weregreater than Q’, the U.S. firni would either at-tempt to negotiate a licensing agreement withthe Japanese brewer or purchase or build aJapanese brewery for production of Colony.
Whether the U.S. brewer would choose tolicense production or open a branch brewery inJapan would depend on several factors. Horst-mann and Markusen (1987) note that if the Ii-
censee and the plant to be built or purchasedare equally efficient, then the need to give thelicensee the incentive to maintain the reputationof the licenser’s product will result in FDIalways dominating the use of licensing. Theyalso conclude, however, that if the licensee andbranch plant are not equally efficient—that is, iftheir LRAC curves are not identical—then otherfactor-s such as the size of the market, the ex-istence of close substitutes in the target marketand the level of interest rates in the two coun-tries will determine whether licensing agree-ments or FDI will be used.
In addition to production and distribution costs,brewers also face tariff and non-tar’iff trade bar-riers, which raise the cost of supplying a coun-try with beer. In terms of figure B4, it is con-ceivable that the U.S. brewery could have anaverage cost of production considerably belowbr’eweries in Japan, but that trade barriers inJapan are so high that licensing agreements orforeign direct investment become the preferr’edmethod of supplying the foreign country at alllevels of demand. Here, the LRAC~~+t0,curvecan be used to incorpor’ate this idea. Let the t,,~
variable now stand for transportation anddistm’ibution as well as costs associated withtrade barriers, such as tariffs. The existence oftrade barr’iers simply shifts the U.S. brewer’sexport cost curve upward, pushing Q’ closer tothe origin.
Other realistic problems associated with inter-national transactions have been ignored in thisexample. Some of the other factors that wouldaffect how a firm supplies a foreign market in-clude differences in production technology andinput costs, government restrictions on foreigninvestment, costs of negotiating and monitoringlicensing agreements, exchange-rate movementsand the role other products being produced atthe breweries might have on the plant’s cost ofproduction.
20f course, the Japanese firm will eventually reach itspoints of diseconomies of scale and its average cost ofproduction will rise above C,,
Nins n FC FM 14~RI SC