Embed Size (px)
Citation preview

The Institutional Factors Impact on Foreign Direct Investment (FDI) On
Indian Economic Growth.
Dr. R S Ch Murthy Chodisetty
Faculty of Management, Sreenidhi Institute of Science and Technology, Hyderabad
ABSTRACT
The study covers several aspects of FDI in the country, ranging from FDI patterns and FDI
drivers to FDI relations, growth and exports, taking into account several factors such as the
formation of raw equities, macroeconomic stability, institutional capital and human capital.
In recent years, the FDI has increased so greatly that it has surpassed all other metrics of
economic transactions. Countries are bidding for the highest levels of FDI, as they are the
cheapest foreign funding. The FDI rate has increased to the developed countries in the last
two decades, compared to the previous trend. There may have been a surprising rise of Asia
as big FDI recipients. In the 2014 industry review, the highest FDI for the service sector was
found. In the fields of training, accounting, infrastructure and telecoms, most of the FDI
inflows are generated. The self-employed industries authorize government investments in
chemical, metallurgical, automobile, Pharmaceutical and tourism sectors. The main recipient
is FDI, but FDI flows are subject to policy constraints. Despite the lack of restrictions on
FDI inflows in metallurgical, chemical, automotive, pharmaceutical and tourism industries,
FDI growth in those sectors was much lower than in the FDI markets for utilities and
telecoms.The study focuses on the impact of institutional influences on Indian foreign direct
investment.
Keywords:Foreign Direct Investment, Institutional Factors, Economic Growth.
JEL Codes:G1, F21, F43, O43, O47.
1. INTRODUCTION:
In several countries, including India, FDI's position for economic growth has been a hot
topic of debate. FDI is a key part of the world economy's global efforts. Economic and
technological forces are driving growth of international production. The continuing
liberalization of FDI and trade policies is also behind it. One feature of the world today is
the circulation of private capital flows in developing countries, particularly since the
1990s, in the form of foreign direct investment (FDI). Since the 1980s, MNCs have
emerged as major actors in the sense of globalization. In this sense, globalization gives
developing countries such as India a parallel opportunity to achieve rapid economic
growth through trade and investment. International trade expanded more rapidly than the
FDI in the 1970s, so far the major economic activities in international cooperation were
international trade. With the growth of marketing and global supply networks for
Manufacturing and Distribution in the mid-1980s, FDI has therefore begun to rise rapidly,
and has fundamentally changed.FDI flows include capital provided by foreign investors to
enterprises in another economy directly or indirectly, with an anticipation that they will
make better profit and participate in the management of the company in which they invest.
In proportion to their equity portfolios, foreign investors accumulate capital in host-
country companies Prachi Arora (2013)1. The previous Indian FDI definition differs from
High Technology Letters
Volume 27, Issue 1, 2021
ISSN NO : 1006-6748
http://www.gjstx-e.cn/226

that of the IMF as well as the UNCTAD WIR definition; the IMF definition comprises
ECBs. FDI inflows will preferably reflect the formation of capital, the formation of new
businesses in one factory, the increase in foreign equity held in existing firms, M&As in
existing companies and others.This is the empirical definition used by many countries to
distinguish between FDI and portfolio streams. FDI was defined as the' investment to
gather a lasting interest in a company which operates in the economy other than the
investor's by the International Monetary Fund (IMF),' the object of which is that of an
investor to have an effective corporate management voice (IMF, 1977). FDI is the process
through which residents of one country (source country) are acquired by assets in order to
monitor a business in another country (host country)'s production, distribution and other
productive activities.
2. REVIEW OF LITERATURE
Samina Sabir, Anum Rafique and Kamran Abbas (2018): This study investigates
the impact of institutional quality on Foreign Direct Investment (FDI) inflows using
panel data. The empirical results confirm that institutional quality has a positive
impact on FDI in Asian of countries. These countries sample period of 1996–2017
using the system Generalized Method of Moments (GMM) for analysis. The
magnitude of the coefficients of control of corruption, government effectiveness,
political stability, regulatory quality, rule of law, and voice and accountability for FDI
inflows are greater in developed countries than in developing countries. We conclude
that institutional quality is a more important determinant of FDI in developed
countries than in developed countries.
ZuhalKurul and A. Yasemin Yalta (2017)145
: In this paper, we revisit the relation
between institutional factors and foreign direct investment (FDI) inflows in
developing countries by employing a dynamic panel methodology, which enables us
to deal with the persistency of FDI flows and endogeneity issues. We also contribute
to the literature by using various measures of institutions to identify which aspects of
institutional quality affect FDI in the developing world. Our empirical findings based
on 113 developing countries over the period 2002–2012 show evidence that some
institutional factors matter more than others in attracting more FDI flows. We also
found that the financial crisis in 2008 and 2009 had a negative impact on FDI flows.
Viral Upendrabhai Pandya (2017)146
: This paper examines foreign direct
investment (FDI) inflows and its impact on economic growth in Australia. FDI
inflows are considered to be a vital source of economic growth or development for
any economy and it plays big role in growth in gross domestic product (GDP),
improvement in infrastructure, employment creation, export and trade performance.
This paper examines the relationship between FDI and economic growth of Australia
through regression analysis between FDI and different measures of economic growth.
Pradip Baija1(2017)144
: - The research paper titled, “FDI Inflows Road to India’s
Rapid Development”, recorded the Market Survey and the findings of survey
conducted by the federation of Indian chamber of commerce and industry
(FICCI),that 70 per cent of foreign investors surveyed were making profits from
their Indian operations. The survey noted that as manufacturing foreign investors
High Technology Letters
Volume 27, Issue 1, 2021
ISSN NO : 1006-6748
http://www.gjstx-e.cn/227

were mostly dissatisfied with the infrastructure situation of the country, 42 per cent
rating the quality of parts and power facilities and 54 per cent of the companies rating
the condition of roads and highways.
Rao and Singh(2017)143
: - The study pointed out that "the regional concentration of
FDI is less of a concern if labor mobility is sufficient to ensure that workers can go
where new jobs are created." However, Top level points out that Indian labor mobility
is relatively low, "less than 0.5 percent of the population in rural and 4 percent of the
population in urban areas moved for reasons of economic consideration (or
employment).
3. Statement of the Problem:
In recent years emerging countries are attracting significant FDI inflows. The economic,
social development appear to the growing economies considerable making effects to
attract FDIs by focusing prospective sectors, institutional settings, policy changes.
Regulatory liberalization, investor guarantees, incentives and concessions etc.… but India
lagging behind in attracting the sizable amount of FDI. Over the past decade china doubled
its FDI and India over all FDI inflows show a significant growth trend. Despite the
dynamism of the country with enormous potential and increasing importance for FDI but
being the amount world’s top fastest growing countries (BRICS) failed to achieve the
expected FDI inflows compound with other sizable economic oriented countries. Indian
FDI Flows are growing year on year its observes the data from 2000 to till date. But the
Indian FDI growth is not as per the growth of global FDI growth. Many research scholars
have done research in this area but institutional factors role has not been studied, in the
progressive of FDI flows sector wise. All the sectors are not able to attract FDI flows
strongly due to bottlenecks in the form of Indian economic factors influence along with the
institutional factors.
4. Objectives of the Study:
1. To examine the institutional factors impact on Foreign Direct investment (FDI) flows in
to India.
5. Hypotheses of the Study:
H0: There is no institutional factors impact on Foreign Direct investment flows in to India.
H1: There isinstitutional factors impact on Foreign Direct investment flows in to India
6. Research Methodology:
6.1. Sources of Data:The secondary data were obtained from the annual reports of the ten public
sector banks. Additional data for analysis and verification were sourced from ww.moneycontrol.com.
The data were subjected to certain fundamental mathematical operations such as computing the ratios,
before being used for the analysis.
6.2. Period of the Study:
The study period is 15 years, between 2004 and 2018. Therefore, the trend in Indian FDI
influences for the period 2004 to 2018 is very necessary to look back and evaluate its
High Technology Letters
Volume 27, Issue 1, 2021
ISSN NO : 1006-6748
http://www.gjstx-e.cn/228

potential factors that determine FDI attraction and thus provide a clear picture of India's
competitive status in FDI attraction.
6.3. Tools used in the Study:
Unit Root Test: The study has applied the unit root test for the stationary of the time
series data to remove the seasonality effect. The following are the statistical tests were
applied.
• Augmented Dicky Fuller test
• Phillip-perron test
ARDL: The Auto regressive distributed log methodology has been applied to know the
association between the independent variables and the dependent variable. The study
has considered the institutional factors (independent variables) association with the
Indian FDI (dependent Variable.
Ordinary least Square: The ordinary least square method has been applied to know
the selected economic factors influence on the dependent variable (FDI).
7.LIMITATIONS OF THE STUDY:
The present research focused only on secondary data and the required data from reputed
sources were not consistent and therefore the results based on the statistical analysis
may not be correct. For example, analyzing the significance of possible determinants of
FDI at national level is a highly complex task. And it was difficult to use the raw data
for business environmental considerations such as business regulations, government
efficiency, technological readiness, etc.,
Data from different sources such as FDI inflows from RBIs in India, which do not
exactly match UNCTAD FDI data, and similarly for IMF, world economic
perspectives, and UNCTAD economic indicators, also differed.
8. SCOPE FOR FURTHER RESEARCH:
The study has been emphasized on the foreign direct investments of India. The study
mainly focused on the Indian economic growth with contribution of sectoral investments.
The study has considered the FDI investments from the 2004 to 2015. The study made an
attempt to examine the sectors, economic factors and institutional dimensions were
considered in the study. The sectors were selected based on the higher FDI flows from the
period of 2004 onwards continuously.
In the study the following Institutional indicators included
• Control of Corruption
• Government Effectiveness
• Political Stability
• Rule of Law
• Regulatory Quality
• Voice and Accountability
High Technology Letters
Volume 27, Issue 1, 2021
ISSN NO : 1006-6748
http://www.gjstx-e.cn/229

9. DATA ANALYSIS:
In the study IConsider Five types of Institutional Indicators from the Government website
for the analysis. The Factors are given below.
Control of Corruption
Government Effectiveness
Political Right Index
Regulatory Quality
Rule of Law
Voice &Accountability
Table – 1.0
Unit Root test with Augmented Dickey Fuller
Institutional Indicators Level 1st Difference 2
nd Difference
Control of Corruption 0.0013* - -
Government Effectiveness 0.0000* - -
Political Right Index 0.0000* - -
Regulatory Quality 0.0030* - -
Rule of Law 0.0682 0.0000* -
Voice &Accountability 0.0010* - -
*Significant at 5% level
Source: compiled on secondary data through E-views
The table stated the unit root test result under the Augmented Dickey Fuller test for the
institutional indicators of FDI are observed significant at the 5% level. The Control of
corruption, government effectiveness, political right index, regulatory quality and voice &
accountability are found to be significant at normal level and they are stationary. The rule of
law is observed to be non-significant at normal level but it is observed to be stationary in 1st
difference.
In this study following Institutions indicators include are Control of Corruption, Government
Effectiveness, Political Stability, Regulatory Quality, Rule of Law, and Voice and
Accountability. The unbundling of institutions allow us to examine which of these different
dimensions matter for FDI flows in developing countries.
1. Control of Corruption:
High Technology Letters
Volume 27, Issue 1, 2021
ISSN NO : 1006-6748
http://www.gjstx-e.cn/230
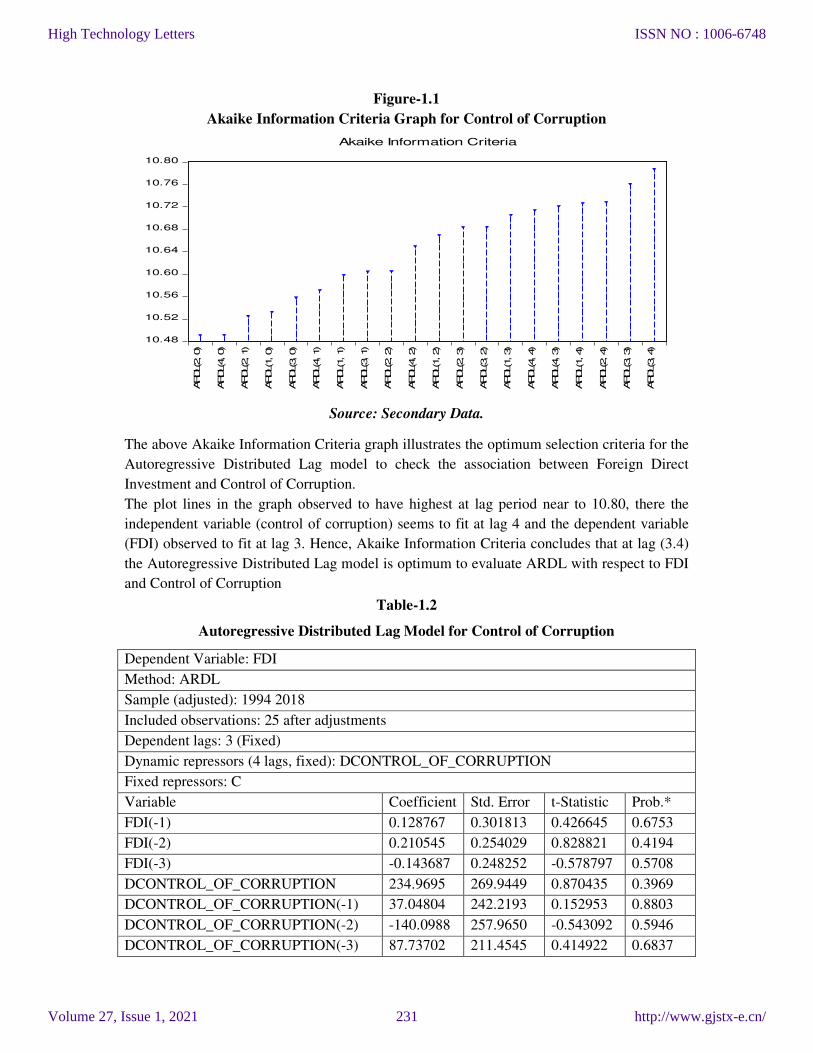
Figure-1.1
Akaike Information Criteria Graph for Control of Corruption
10.48
10.52
10.56
10.60
10.64
10.68
10.72
10.76
10.80
ARDL(2, 0)
ARDL(4, 0)
ARDL(2, 1)
ARDL(1, 0)
ARDL(3, 0)
ARDL(4, 1)
ARDL(1, 1)
ARDL(3, 1)
ARDL(2, 2)
ARDL(4, 2)
ARDL(1, 2)
ARDL(2, 3)
ARDL(3, 2)
ARDL(1, 3)
ARDL(4, 4)
ARDL(4, 3)
ARDL(1, 4)
ARDL(2, 4)
ARDL(3, 3)
ARDL(3, 4)
Akaike Information Criteria
Source: Secondary Data.
The above Akaike Information Criteria graph illustrates the optimum selection criteria for the
Autoregressive Distributed Lag model to check the association between Foreign Direct
Investment and Control of Corruption.
The plot lines in the graph observed to have highest at lag period near to 10.80, there the
independent variable (control of corruption) seems to fit at lag 4 and the dependent variable
(FDI) observed to fit at lag 3. Hence, Akaike Information Criteria concludes that at lag (3.4)
the Autoregressive Distributed Lag model is optimum to evaluate ARDL with respect to FDI
and Control of Corruption
Table-1.2
Autoregressive Distributed Lag Model for Control of Corruption
Dependent Variable: FDI
Method: ARDL
Sample (adjusted): 1994 2018
Included observations: 25 after adjustments
Dependent lags: 3 (Fixed)
Dynamic repressors (4 lags, fixed): DCONTROL_OF_CORRUPTION
Fixed repressors: C
Variable Coefficient Std. Error t-Statistic Prob.*
FDI(-1) 0.128767 0.301813 0.426645 0.6753
FDI(-2) 0.210545 0.254029 0.828821 0.4194
FDI(-3) -0.143687 0.248252 -0.578797 0.5708
DCONTROL_OF_CORRUPTION 234.9695 269.9449 0.870435 0.3969
DCONTROL_OF_CORRUPTION(-1) 37.04804 242.2193 0.152953 0.8803
DCONTROL_OF_CORRUPTION(-2) -140.0988 257.9650 -0.543092 0.5946
DCONTROL_OF_CORRUPTION(-3) 87.73702 211.4545 0.414922 0.6837
High Technology Letters
Volume 27, Issue 1, 2021
ISSN NO : 1006-6748
http://www.gjstx-e.cn/231

DCONTROL_OF_CORRUPTION(-4) 179.8736 192.4069 0.934860 0.3638
C 7.384580 17.97113 0.410914 0.6866
R-squared 0.637422 Mean dependent var 18.18908
Adjusted R-squared 0.643867 S.D. dependent var 43.41617
S.E. of regression 46.43434 Akaike info criterion 10.78767
Sum squared resid 34498.37 Schwarz criterion 11.22646
Log likelihood 125.8459 Hannan-Quinn criter. 10.90937
F-statistic 0.622682 Durbin-Watson stat 2.136874
Prob(F-statistic) 0.047304
*Note: p-values and any subsequent tests do not account for model selection.
Source: Secondary Data.
The above table illustrates the results of Autoregressive Distributed Lag model which
describes the direction of the depended variable with independent variable. The independent
variable coefficient (Control of Corruption) values for most of the lag are found to be
positive, indicating that an important strategy for increasing FDI inflows will be increase with
the improvement of quality of institutions and control corruption.R-square of the model is
0.63 that is above the recommended level (<0.60), implies model is strongly fit and Durbin
Watson Statistic value indicates that there is no Autocorrelation in the sample and lies within
the range of 1.5 to 2.5. Hence, concluded that the model is strongly fit and significant.
Pesaran Bound Test for Control of Corruption
F-Bounds Test Null Hypothesis: No levels relationship
Test Statistic Value Signif. I(0) I(1)
Asymptotic:
n=1000
F-statistic 2.143278 10% 3.02 3.51
K 1 5% 3.62 4.16
2.5% 4.18 4.79
1% 4.94 5.58
Actual Sample Size 25 Finite Sample:
n=30
10% 3.303 3.797
5% 4.09 4.663
1% 6.027 6.76
Source: Secondary Data
The above table represents Pesaran Bound test/ Wald Test for long run and short run
association between Foreign Direct Investment and Control of Corruption. Here, the F-
Statistic value is observed to be less than Pesaran critical value for bound test and falling in
the lower bound i.e. (2.143< 3.62) at 5% level of significance that means rejection of
alternative hypothesis and signifies there is Short run association between FDI and Control of
Corruption.
2. Government Effectiveness :
High Technology Letters
Volume 27, Issue 1, 2021
ISSN NO : 1006-6748
http://www.gjstx-e.cn/232

Figure-1.2
Akaike Information Criteria Graph for Government Effectiveness
10.4
10.5
10.6
10.7
10.8
10.9
11.0
ARDL(4, 0)
ARDL(4, 1)
ARDL(1, 0)
ARDL(2, 0)
ARDL(1, 1)
ARDL(3, 0)
ARDL(2, 1)
ARDL(4, 2)
ARDL(3, 1)
ARDL(1, 2)
ARDL(4, 3)
ARDL(2, 2)
ARDL(4, 4)
ARDL(3, 2)
ARDL(1, 3)
ARDL(2, 3)
ARDL(3, 3)
ARDL(1, 4)
ARDL(2, 4)
ARDL(3, 4)
Akaike Information Criteria
Source: Secondary Data
The above Akaike Information Criteria graph depicts the optimum selection criteria for the
Autoregressive Distributed Lag model to check the association between Foreign Direct
Investment and Government Effectiveness.
The plot lines in the graph observed to have highest at lag period near to 10.9, there the
independent variable (government effectiveness) seems to fit at lag 4 and the dependent
variable (FDI) observed to fit at lag 3. Hence, Akaike Information Criteria concludes that at
lag (3.4) the Autoregressive Distributed Lag model is optimum to evaluate ARDL with
respect to FDI and Government Effectiveness.
Table-1.3
Autoregressive Distributed Lag Model for Government Effectiveness
Dependent Variable: FDI
Method: ARDL
Sample (adjusted): 1994 2018
Included observations: 25 after adjustments
Dependent lags: 3 (Fixed)
Dynamic repressors (4 lags, fixed): DGOVT_EFFECTIVENESS
Fixed repressors: C
Variable Coefficient Std. Error t-Statistic Prob.*
FDI(-1) 0.076918 0.278767 0.275921 0.0021
FDI(-2) 0.187181 0.209395 0.893914 0.0041
FDI(-3) -0.165670 0.218628 -0.757771 0.0026
High Technology Letters
Volume 27, Issue 1, 2021
ISSN NO : 1006-6748
http://www.gjstx-e.cn/233
DGOVT_EFFECTIVENESS 2.728079 103.4850 0.026362 0.0013
DGOVT_EFFECTIVENESS(-1) 55.36249 94.85106 0.583678 0.0072
DGOVT_EFFECTIVENESS(-2) 6.609537 91.26953 0.072418 0.0232
DGOVT_EFFECTIVENESS(-3) -27.34910 93.46337 -0.292618 0.0336
DGOVT_EFFECTIVENESS(-4) 32.48428 105.8477 0.306896 0.0029
C 15.75698 12.62082 1.248491 0.0098
R-squared 0.738291 Mean dependent var 18.18908
Adjusted R-squared 0.792563 S.D. dependent var 43.41617
S.E. of regression 49.36026 Akaike info criterion 10.90988
Sum squared resid 38982.96 Schwarz criterion 11.34868
Log likelihood -127.3735 Hannan-Quinn criter. 11.03158
F-statistic 0.320969 Durbin-Watson stat 2.143780
Prob(F-statistic) 0.046126
*Note: p-values and any subsequent tests do not account for model selection.
Source: Secondary Data
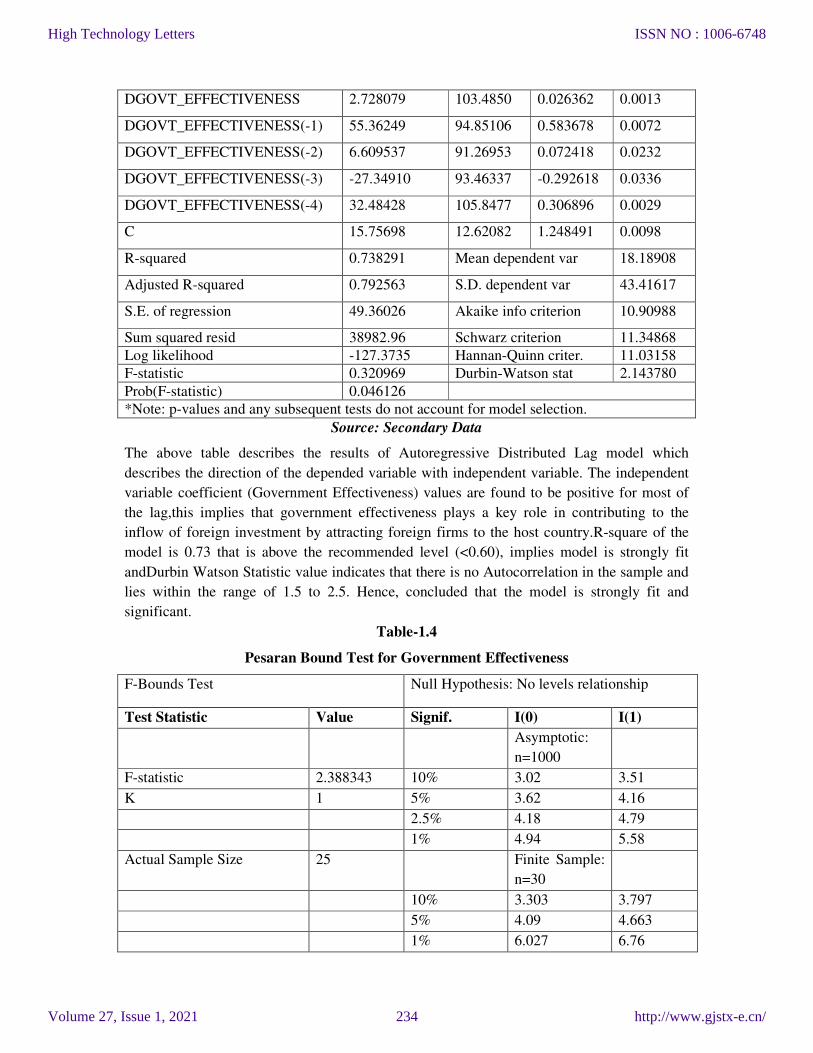
The above table describes the results of Autoregressive Distributed Lag model which
describes the direction of the depended variable with independent variable. The independent
variable coefficient (Government Effectiveness) values are found to be positive for most of
the lag,this implies that government effectiveness plays a key role in contributing to the
inflow of foreign investment by attracting foreign firms to the host country.R-square of the
model is 0.73 that is above the recommended level (<0.60), implies model is strongly fit
andDurbin Watson Statistic value indicates that there is no Autocorrelation in the sample and
lies within the range of 1.5 to 2.5. Hence, concluded that the model is strongly fit and
significant.
Table-1.4
Pesaran Bound Test for Government Effectiveness
F-Bounds Test Null Hypothesis: No levels relationship
Test Statistic Value Signif. I(0) I(1)
Asymptotic:
n=1000
F-statistic 2.388343 10% 3.02 3.51
K 1 5% 3.62 4.16
2.5% 4.18 4.79
1% 4.94 5.58
Actual Sample Size 25 Finite Sample:
n=30
10% 3.303 3.797
5% 4.09 4.663
1% 6.027 6.76
High Technology Letters
Volume 27, Issue 1, 2021
ISSN NO : 1006-6748
http://www.gjstx-e.cn/234

Source: Secondary Data
The above table represents Pesaran Bound test/ Wald Test for long run and short run
association between Foreign Direct Investment and Government Effectiveness. Here, the F-
Statistic value is observed to be less than Pesaran critical value for bound test and falling in
the lower bound i.e. (2.388< 3.62) at 5% level of significance that means rejection of
alternative hypothesis and signifies there is Short run association between FDI and
Government Effectiveness.
3. Political Stability :
Figure-1.4
Akaike Information Criteria Graph for Political Right Index
10.3
10.4
10.5
10.6
10.7
10.8
ARDL(4
, 4)
ARDL(4
, 0)
ARDL(4
, 1)
ARDL(4
, 2)
ARDL(1
, 4)
ARDL(2
, 4)
ARDL(1
, 0)
ARDL(2
, 0)
ARDL(3
, 0)
ARDL(1
, 1)
ARDL(4
, 3)
ARDL(3
, 1)
ARDL(3
, 4)
ARDL(2
, 1)
ARDL(1
, 2)
ARDL(3
, 2)
ARDL(2
, 2)
ARDL(1
, 3)
ARDL(3
, 3)
ARDL(2
, 3)
Akaike Information Criteria
Source: Secondary Data
The above Akaike Information Criteria graph portrays the optimum selection criteria for the
Autoregressive Distributed Lag model to check the association between Foreign Direct
Investment and Political Right Index.
The plot lines in the graph observed to have highest at lag period near to 10.80, there the
independent variable (political right index) seems to fit at lag 3 and the dependent variable
(FDI) observed to fit at lag 2. Hence, Akaike Information Criteria concludes that at lag (2, 3)
the Autoregressive Distributed Lag model is optimum to evaluate ARDL with respect to FDI
and Political Right Index.
High Technology Letters
Volume 27, Issue 1, 2021
ISSN NO : 1006-6748
http://www.gjstx-e.cn/235
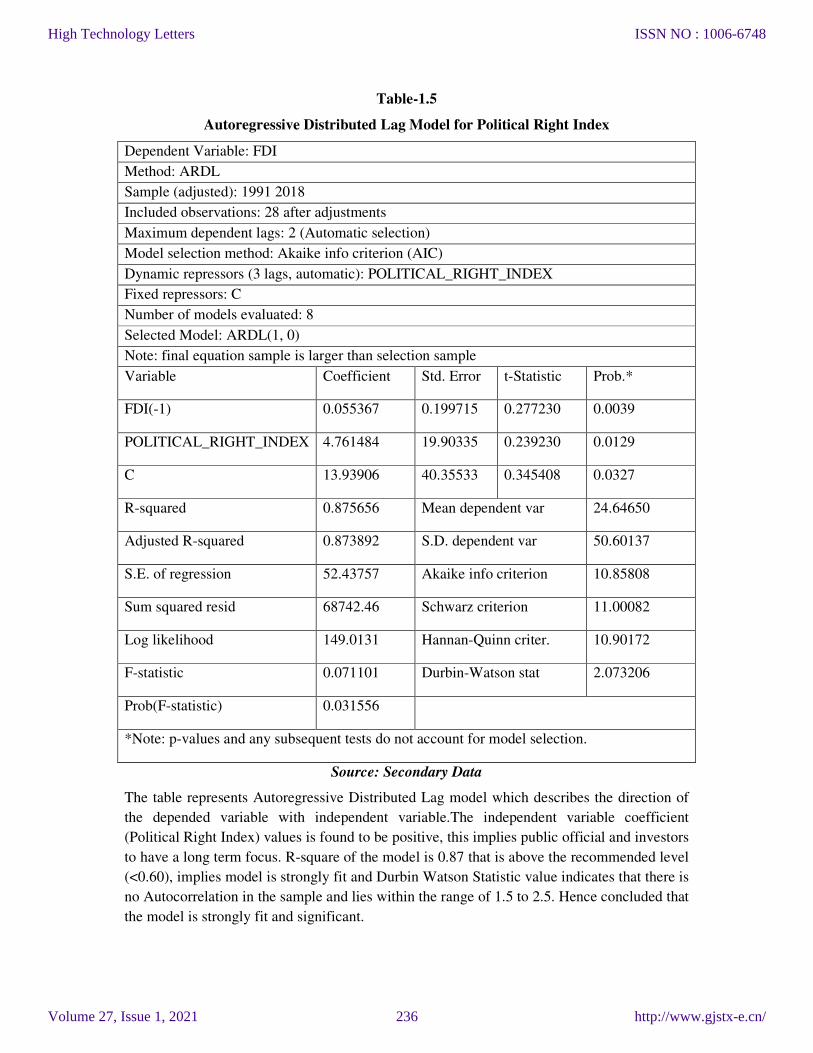
Table-1.5
Autoregressive Distributed Lag Model for Political Right Index
Dependent Variable: FDI
Method: ARDL
Sample (adjusted): 1991 2018
Included observations: 28 after adjustments
Maximum dependent lags: 2 (Automatic selection)
Model selection method: Akaike info criterion (AIC)
Dynamic repressors (3 lags, automatic): POLITICAL_RIGHT_INDEX
Fixed repressors: C
Number of models evaluated: 8
Selected Model: ARDL(1, 0)
Note: final equation sample is larger than selection sample
Variable Coefficient Std. Error t-Statistic Prob.*
FDI(-1) 0.055367 0.199715 0.277230 0.0039
POLITICAL_RIGHT_INDEX 4.761484 19.90335 0.239230 0.0129
C 13.93906 40.35533 0.345408 0.0327
R-squared 0.875656 Mean dependent var 24.64650
Adjusted R-squared 0.873892 S.D. dependent var 50.60137
S.E. of regression 52.43757 Akaike info criterion 10.85808
Sum squared resid 68742.46 Schwarz criterion 11.00082
Log likelihood 149.0131 Hannan-Quinn criter. 10.90172
F-statistic 0.071101 Durbin-Watson stat 2.073206
Prob(F-statistic) 0.031556
*Note: p-values and any subsequent tests do not account for model selection.
Source: Secondary Data
The table represents Autoregressive Distributed Lag model which describes the direction of
the depended variable with independent variable.The independent variable coefficient
(Political Right Index) values is found to be positive, this implies public official and investors
to have a long term focus. R-square of the model is 0.87 that is above the recommended level
(<0.60), implies model is strongly fit and Durbin Watson Statistic value indicates that there is
no Autocorrelation in the sample and lies within the range of 1.5 to 2.5. Hence concluded that
the model is strongly fit and significant.
High Technology Letters
Volume 27, Issue 1, 2021
ISSN NO : 1006-6748
http://www.gjstx-e.cn/236

Table-1.6
Pesaran Bound Test for Political Right Index
F-Bounds Test Null Hypothesis: No levels relationship
Test Statistic Value Signif. I(0) I(1)
Asymptotic:
n=1000
F-statistic 7.457843 10% 3.02 3.51
k 1 5% 3.62 4.16
2.5% 4.18 4.79
1% 4.94 5.58
Actual Sample Size 28 Finite Sample:
n=35
10% 3.223 3.757
5% 3.957 4.53
1% 5.763 6.48
Finite Sample:
n=30
10% 3.303 3.797
5% 4.09 4.663
1% 6.027 6.76
Source: Secondary Data
The above table represents Pesaran Bound test/ Wald Test for long run and short run
association between Foreign Direct Investment and Political Right Index. Here, the F-
Statistic value is observed to be less than Pesaran critical value for bound test and raising in
the greater bound i.e. (7.457< 3.62) at 5% level of significance that means acceptation of
alternative hypothesis and signifies there is Long run association between FDI and Political
Right Index.
4. Regulatory Quality:
Figure-1.7
Akaike Information Criteria Graph for Regulatory Quality
9.4
9.6
9.8
10.0
10.2
10.4
10.6
10.8
ARDL(4, 2)
ARDL(4, 4)
ARDL(4, 3)
ARDL(3, 2)
ARDL(1, 2)
ARDL(2, 2)
ARDL(3, 3)
ARDL(3, 4)
ARDL(1, 3)
ARDL(1, 4)
ARDL(2, 3)
ARDL(2, 4)
ARDL(4, 0)
ARDL(4, 1)
ARDL(1, 0)
ARDL(2, 0)
ARDL(3, 0)
ARDL(1, 1)
ARDL(2, 1)
ARDL(3, 1)
Akaike Information Criteria
High Technology Letters
Volume 27, Issue 1, 2021
ISSN NO : 1006-6748
http://www.gjstx-e.cn/237

Source: Secondary Data
Table-1.7
Autoregressive Distributed Lag Model for Regulatory Quality
Dependent Variable: FDI
Method: ARDL
Sample (adjusted): 1991 2018
Included observations: 28 after adjustments
Maximum dependent lags: 3 (Automatic selection)
Model selection method: Akaike info criterion (AIC)
Dynamic repressors (1 lag, automatic): REGULATORY_QUALITY
Fixed repressors: C
Number of models evaluated: 6
Selected Model: ARDL(1, 0)
Note: final equation sample is larger than selection sample
Variable Coefficient Std. Error t-Statistic Prob.*
FDI(-1) 0.064254 0.198724 0.323332 0.0491
Regulatory_Quality 28.75564 52.21495 0.550717 0.0067
C 32.11204 19.52542 1.644627 0.0126
R-squared 0.415325 Mean dependent var 24.64650
Adjusted R-squared 0.463449 S.D. dependent var 50.60137
S.E. of regression 52.18199 Akaike info criterion 10.84831
Sum squared resid 68073.99 Schwarz criterion 10.99104
Log likelihood -148.8763 Hannan-Quinn criter. 10.89194
F-statistic 0.194547 Durbin-Watson stat 2.038557
Prob(F-statistic) 0.024442
*Note: p-values and any subsequent tests do not account for modelSelection.
Source: Secondary Data
The above table depicts the results of Autoregressive Distributed Lag model which describes
the direction of the depended variable with independent variable. The independent variable
coefficient (Regulatory Quality) values is found to be positive, this implies increase the flow
of FDI and attract foreign investors and minimize the inefficient institutions associated with
corruption and mismanagement.R-square of the model is 0.41 that is below the recommended
level (<0.60) but acceptable andDurbin Watson Statistic value indicates that there is no
Autocorrelation in the sample and lies within the range of 1.5 to 2.5. Hence concluded that
the model is moderately fit and significant.
High Technology Letters
Volume 27, Issue 1, 2021
ISSN NO : 1006-6748
http://www.gjstx-e.cn/238

Table-5.1.8
Pesaran Bound Testfor Regulatory Quality
F-Bounds Test Null Hypothesis: No levels relationship
Test Statistic Value Signif. I(0) I(1)
Asymptotic: n=1000
F-statistic 7.612909 10% 3.02 3.51
K 1 5% 3.62 4.16
2.5% 4.18 4.79
1% 4.94 5.58
Actual Sample Size 28 Finite Sample: n=35
10% 3.223 3.757
5% 3.957 4.53
1% 5.763 6.48
Finite Sample: n=30
10% 3.303 3.797
5% 4.09 4.663
1% 6.027 6.76
Source: Secondary Data
The above table showsPesaran Bound test/ Wald Test for long run and short run association
between Foreign Direct Investment and Regulatory Quality. Here, the F-Statistic value is
observed to be less than Pesaran critical value for bound test and raising in the greater bound
i.e. (7.612< 3.62) at 5% level of significance that means acceptation of alternative hypothesis
and signifies there is Long run association between FDI and Regulatory Quality.
5. Rule of Law:
Figure-5.1.4
Akaike Information Criteria Graph for Rule of Law
9.0
9.2
9.4
9.6
9.8
10.0
10.2
ARDL(4, 1)
ARDL(4, 2)
ARDL(4, 3)
ARDL(4, 4)
ARDL(1, 3)
ARDL(1, 4)
ARDL(2, 3)
ARDL(2, 4)
ARDL(4, 0)
ARDL(1, 2)
ARDL(3, 3)
ARDL(3, 4)
ARDL(2, 2)
ARDL(3, 2)
ARDL(3, 1)
ARDL(1, 0)
ARDL(3, 0)
ARDL(2, 0)
ARDL(1, 1)
ARDL(2, 1)
Akaike Information Criteria
High Technology Letters
Volume 27, Issue 1, 2021
ISSN NO : 1006-6748
http://www.gjstx-e.cn/239

Source: Secondary Data
The above Akaike Information Criteria graph depicts the optimum selection criteria for the
Autoregressive Distributed Lag model to check the association between Foreign Direct
Investment and Rule of Law.
The plot lines in the graph observed to have highest at lag period near to 10.2, there the
independent variable (Rule of Law) seems to fit at lag 1 and the dependent variable (FDI)
observed to fit at lag 2. Hence, Akaike Information Criteria concludes that at lag (2, 1) the
Autoregressive Distributed Lag model is optimum to evaluate ARDL with respect to FDI and
Rule of Law.
Table-5.1.9
Autoregressive Distributed Lag Model for Rule of Law
Dependent Variable: FDI
Method: ARDL
Sample (adjusted): 1991 2018
Included observations: 28 after adjustments
Maximum dependent lags: 2 (Automatic selection)
Model selection method: Akaike info criterion (AIC)
Dynamic repressors (1 lag, automatic): RULE_OF_LAW
Fixed repressors: C
Number of models evaluated: 4
Selected Model: ARDL(1, 0)
Note: final equation sample is larger than selection sample
Variable Coefficient Std. Error t-Statistic Prob.*
FDI(-1) 0.429110 0.174181 -2.463582 0.0210
Rule_of_law 491.1988 100.5659 4.884349 0.0001
C 35.31990 8.288585 4.261271 0.0003
R-squared 0.690031 Mean dependent var 24.64650
AdjustedR-squared 0.649233 S.D. dependent var 50.60137
S.E. of regression 37.55314 Akaike info criterion 10.19035
Sum squared resid 35255.96 Schwarz criterion 10.33308
Log likelihood -139.6649 Hannan-Quinn criter. 10.23398
F-statistic 12.01127 Durbin-Watson stat 2.127121
Prob(F-statistic) 0.000221
*Note: p-values and any subsequent tests do not account for model Selection.
High Technology Letters
Volume 27, Issue 1, 2021
ISSN NO : 1006-6748
http://www.gjstx-e.cn/240
Source: Secondary Data
The above table illustrates the results of Autoregressive Distributed Lag model which
describes the direction of the depended variable with independent variable. The independent
variable coefficient (Rule of Law) values is found to be positive, this indicator gives a clear
idea on the enforcement of contracts, enforcement of law by the courts, police and other law
enforcement agencies which will have an impact of the level of violence and crimes. R-
square of the model is 0.69 that is above the recommended level (<0.60), implies model is
strongly fit and Durbin Watson Statistic value indicates that there is no Autocorrelation in the
sample and lies within the range of 1.5 to 2.5. Hence concluded that the model is strongly fit
and significant.
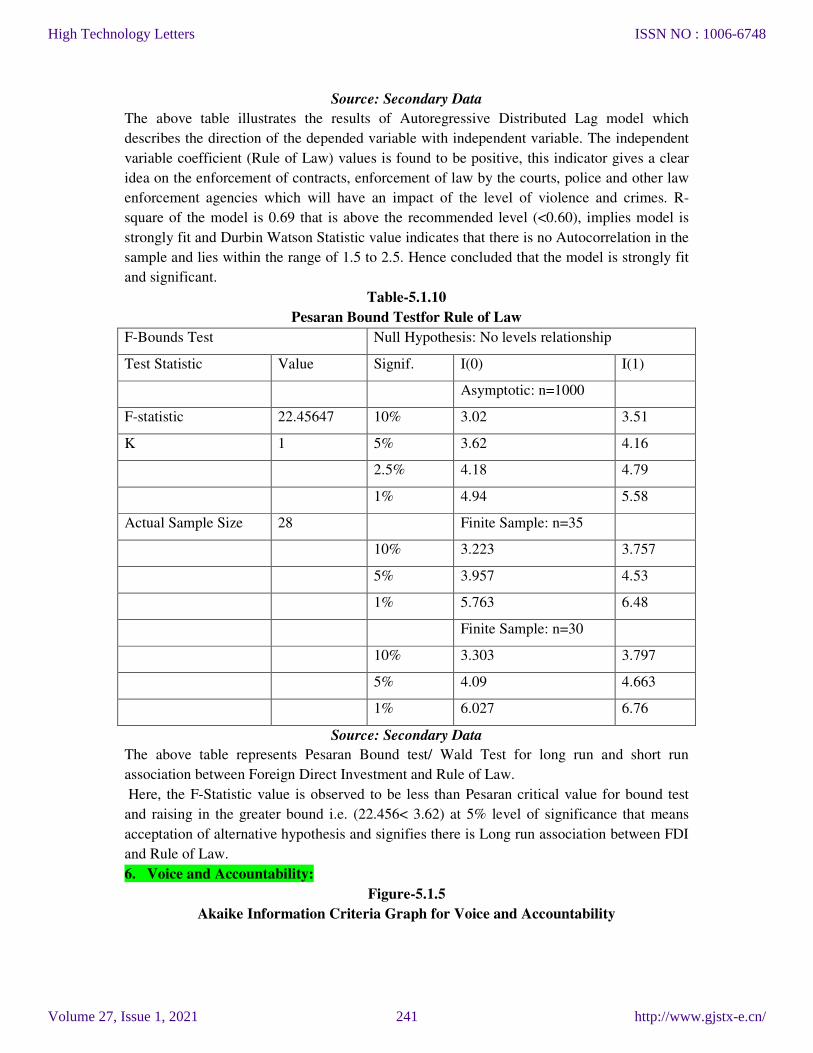
Table-5.1.10
Pesaran Bound Testfor Rule of Law
F-Bounds Test Null Hypothesis: No levels relationship
Test Statistic Value Signif. I(0) I(1)
Asymptotic: n=1000
F-statistic 22.45647 10% 3.02 3.51
K 1 5% 3.62 4.16
2.5% 4.18 4.79
1% 4.94 5.58
Actual Sample Size 28 Finite Sample: n=35
10% 3.223 3.757
5% 3.957 4.53
1% 5.763 6.48
Finite Sample: n=30
10% 3.303 3.797
5% 4.09 4.663
1% 6.027 6.76
Source: Secondary Data
The above table represents Pesaran Bound test/ Wald Test for long run and short run
association between Foreign Direct Investment and Rule of Law.
Here, the F-Statistic value is observed to be less than Pesaran critical value for bound test
and raising in the greater bound i.e. (22.456< 3.62) at 5% level of significance that means
acceptation of alternative hypothesis and signifies there is Long run association between FDI
and Rule of Law.
6. Voice and Accountability:
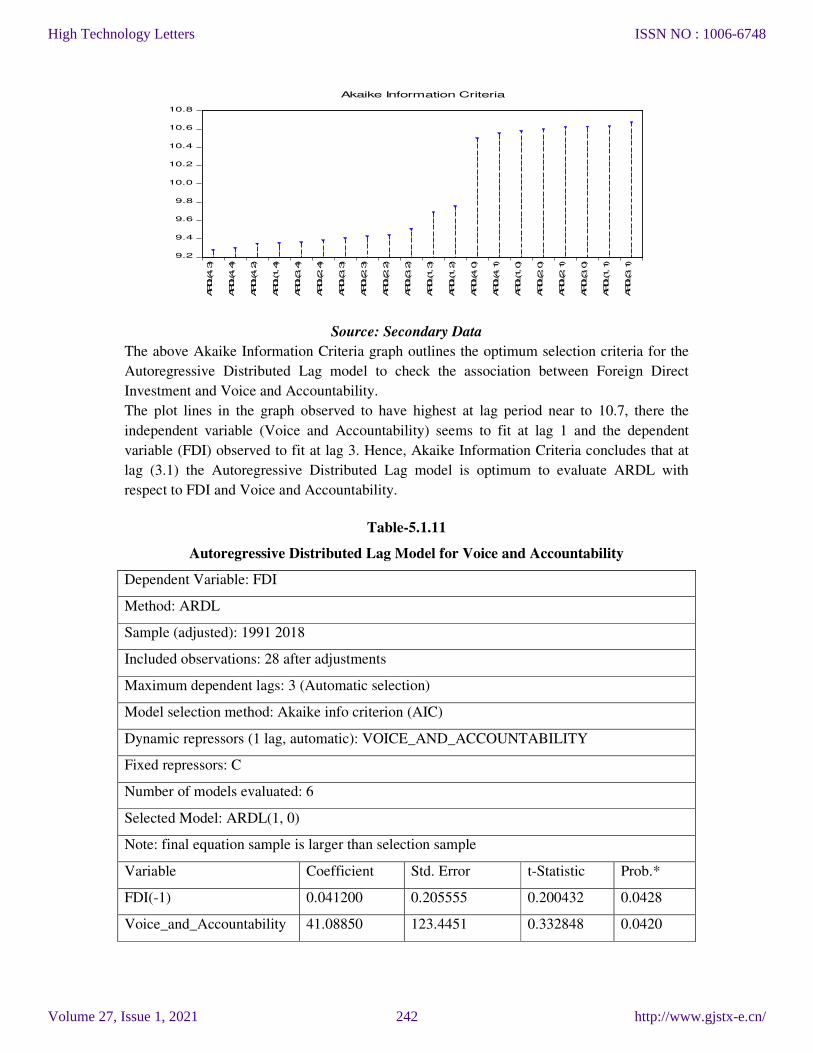
Figure-5.1.5
Akaike Information Criteria Graph for Voice and Accountability
High Technology Letters
Volume 27, Issue 1, 2021
ISSN NO : 1006-6748
http://www.gjstx-e.cn/241
9.2
9.4
9.6
9.8
10.0
10.2
10.4
10.6
10.8
ARDL(4, 3)
ARDL(4, 4)
ARDL(4, 2)
ARDL(1, 4)
ARDL(3, 4)
ARDL(2, 4)
ARDL(3, 3)
ARDL(2, 3)
ARDL(2, 2)
ARDL(3, 2)
ARDL(1, 3)
ARDL(1, 2)
ARDL(4, 0)
ARDL(4, 1)
ARDL(1, 0)
ARDL(2, 0)
ARDL(2, 1)
ARDL(3, 0)
ARDL(1, 1)
ARDL(3, 1)
Akaike Information Criteria
Source: Secondary Data
The above Akaike Information Criteria graph outlines the optimum selection criteria for the
Autoregressive Distributed Lag model to check the association between Foreign Direct
Investment and Voice and Accountability.
The plot lines in the graph observed to have highest at lag period near to 10.7, there the
independent variable (Voice and Accountability) seems to fit at lag 1 and the dependent
variable (FDI) observed to fit at lag 3. Hence, Akaike Information Criteria concludes that at
lag (3.1) the Autoregressive Distributed Lag model is optimum to evaluate ARDL with
respect to FDI and Voice and Accountability.
Table-5.1.11
Autoregressive Distributed Lag Model for Voice and Accountability
Dependent Variable: FDI
Method: ARDL
Sample (adjusted): 1991 2018
Included observations: 28 after adjustments
Maximum dependent lags: 3 (Automatic selection)
Model selection method: Akaike info criterion (AIC)
Dynamic repressors (1 lag, automatic): VOICE_AND_ACCOUNTABILITY
Fixed repressors: C
Number of models evaluated: 6
Selected Model: ARDL(1, 0)
Note: final equation sample is larger than selection sample
Variable Coefficient Std. Error t-Statistic Prob.*
FDI(-1) 0.041200 0.205555 0.200432 0.0428
Voice_and_Accountability 41.08850 123.4451 0.332848 0.0420
High Technology Letters
Volume 27, Issue 1, 2021
ISSN NO : 1006-6748
http://www.gjstx-e.cn/242
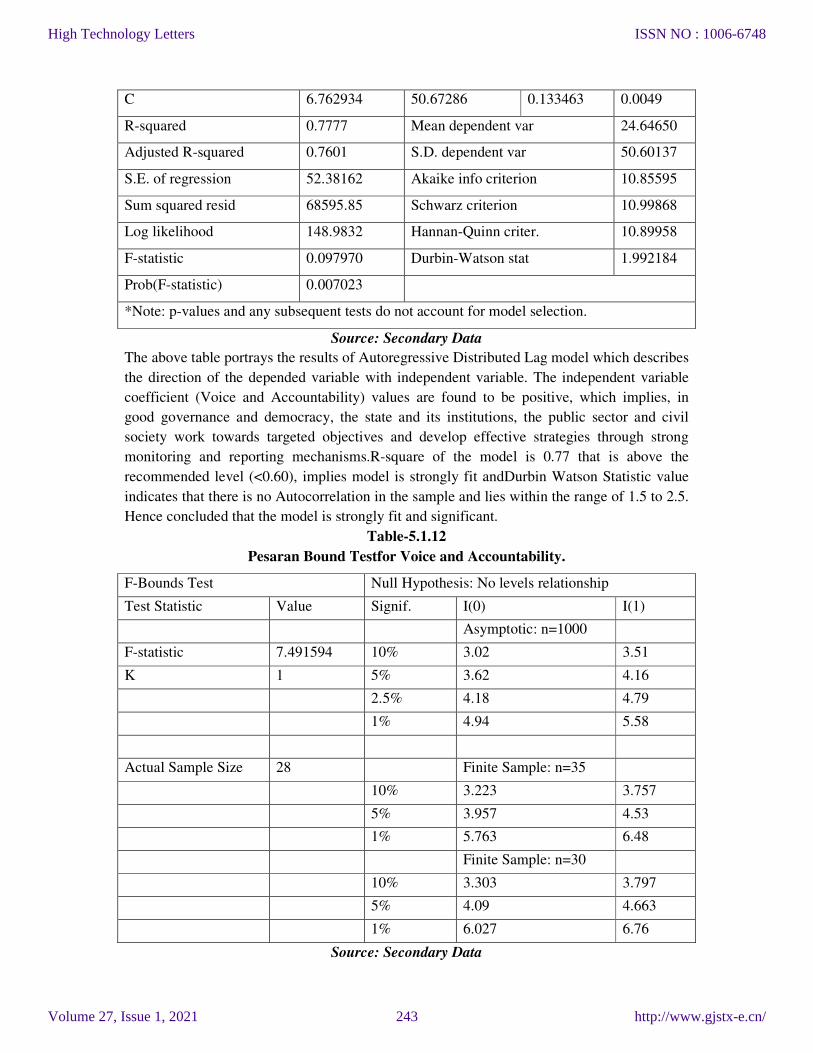
C 6.762934 50.67286 0.133463 0.0049
R-squared 0.7777 Mean dependent var 24.64650
Adjusted R-squared 0.7601 S.D. dependent var 50.60137
S.E. of regression 52.38162 Akaike info criterion 10.85595
Sum squared resid 68595.85 Schwarz criterion 10.99868
Log likelihood 148.9832 Hannan-Quinn criter. 10.89958
F-statistic 0.097970 Durbin-Watson stat 1.992184
Prob(F-statistic) 0.007023
*Note: p-values and any subsequent tests do not account for model selection.
Source: Secondary Data
The above table portrays the results of Autoregressive Distributed Lag model which describes
the direction of the depended variable with independent variable. The independent variable
coefficient (Voice and Accountability) values are found to be positive, which implies, in
good governance and democracy, the state and its institutions, the public sector and civil
society work towards targeted objectives and develop effective strategies through strong
monitoring and reporting mechanisms.R-square of the model is 0.77 that is above the
recommended level (<0.60), implies model is strongly fit andDurbin Watson Statistic value
indicates that there is no Autocorrelation in the sample and lies within the range of 1.5 to 2.5.
Hence concluded that the model is strongly fit and significant.
Table-5.1.12
Pesaran Bound Testfor Voice and Accountability.
F-Bounds Test Null Hypothesis: No levels relationship
Test Statistic Value Signif. I(0) I(1)
Asymptotic: n=1000
F-statistic 7.491594 10% 3.02 3.51
K 1 5% 3.62 4.16
2.5% 4.18 4.79
1% 4.94 5.58
Actual Sample Size 28 Finite Sample: n=35
10% 3.223 3.757
5% 3.957 4.53
1% 5.763 6.48
Finite Sample: n=30
10% 3.303 3.797
5% 4.09 4.663
1% 6.027 6.76
Source: Secondary Data
High Technology Letters
Volume 27, Issue 1, 2021
ISSN NO : 1006-6748
http://www.gjstx-e.cn/243
The above table represents Pesaran Bound test/ Wald Test for long run and short run
association between Foreign Direct Investment and Voice and Accountability. Here, the F-
Statistic value is observed to be less than Pesaran critical value for bound test and raising in
the greater bound i.e. (7.491< 3.62) at 5% level of significance that means acceptation of
alternative hypothesis and signifies there is Long run association between FDI and Voice and
Accountability.
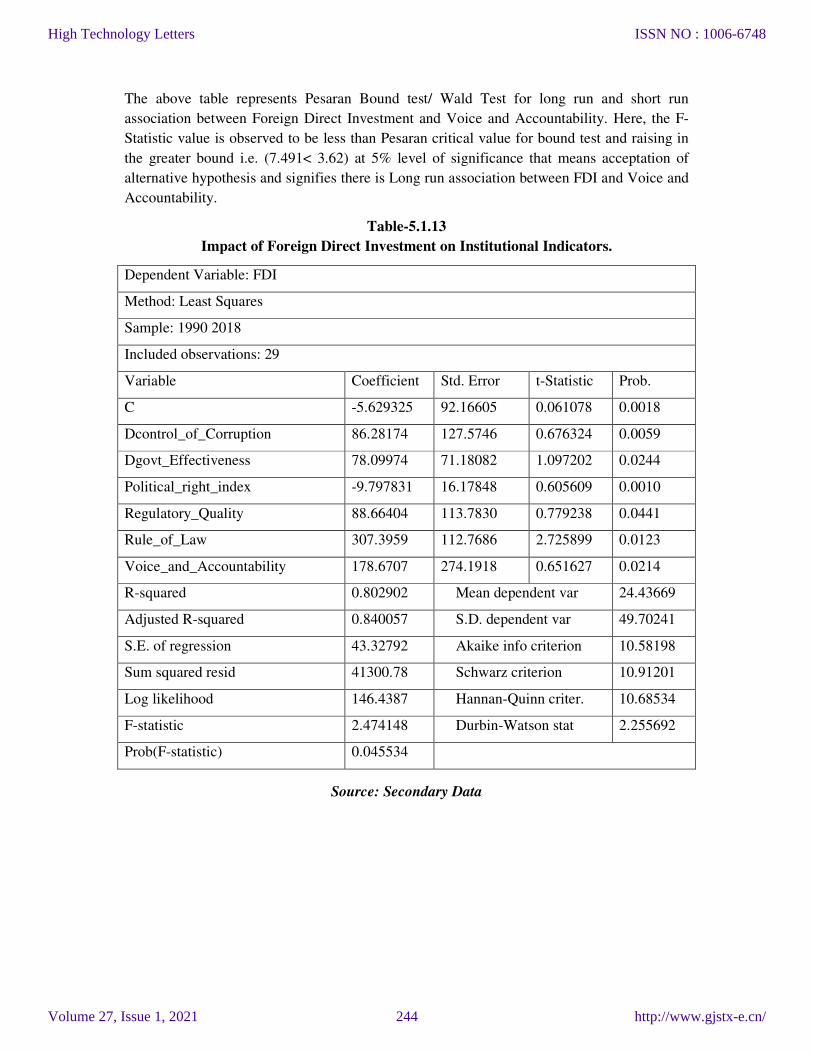
Table-5.1.13
Impact of Foreign Direct Investment on Institutional Indicators.
Dependent Variable: FDI
Method: Least Squares
Sample: 1990 2018
Included observations: 29
Variable Coefficient Std. Error t-Statistic Prob.
C -5.629325 92.16605 0.061078 0.0018
Dcontrol_of_Corruption 86.28174 127.5746 0.676324 0.0059
Dgovt_Effectiveness 78.09974 71.18082 1.097202 0.0244
Political_right_index -9.797831 16.17848 0.605609 0.0010
Regulatory_Quality 88.66404 113.7830 0.779238 0.0441
Rule_of_Law 307.3959 112.7686 2.725899 0.0123
Voice_and_Accountability 178.6707 274.1918 0.651627 0.0214
R-squared 0.802902 Mean dependent var 24.43669
Adjusted R-squared 0.840057 S.D. dependent var 49.70241
S.E. of regression 43.32792 Akaike info criterion 10.58198
Sum squared resid 41300.78 Schwarz criterion 10.91201
Log likelihood 146.4387 Hannan-Quinn criter. 10.68534
F-statistic 2.474148 Durbin-Watson stat 2.255692
Prob(F-statistic) 0.045534
Source: Secondary Data
High Technology Letters
Volume 27, Issue 1, 2021
ISSN NO : 1006-6748
http://www.gjstx-e.cn/244

10. FINDINGS OF THE STUDY
1. The study found with the help of ARDL model that the Institutional indicators had are
having the positive coefficient value and stated that Control of corruption and Govt.
effectiveness are institution indicators which shown short run association with FDI flows.
2. The study examined that Political stability f-statistic value is falling above the upper
peasant table (i.e., 7.4578 > 4.16) which states political stability has a long run
association with FDI flows.
3. Institutional Indicators such as Rule of law, Regulatory Quality and Voice &
accountability had a long run association with FDI flows.
4. Political stability is the institutional indicator shown negatively influenced on FDI flows
with -9.797 and states rise in political stability index will decrease the FDI growth with -
9.797 units.
5. Institutional indicators such as Rule of law (307.39) and Voice & Accountability (178.67)
had influenced high on FDI flows.
11. SUGGESTIONS OF THE STUDY
1. The study suggested that policymakers should ensure that funding is used optimally
and that projects are implemented in a timely manner. To attract more FDI inflows to
India, the government needs to retain investor confidence through strict controls on
inefficient bureaucracy, red-tapism, and rampant corruption. Finally, the government
must ensure quality FDI inflows rather than its magnitude. Policymakers must ensure
transparency and consistency in policy making, as well as an integrated long-term
development strategy.
2. The study also suggested that the government should take faster action to improve the
country's infrastructure to further diversify its businesses.
12. CONCLUSION OF THE STUDY
The results of the empirical analysis of the sector show that FDI creates sectoral growth,
while growth affects human capital and FDI inflows institutional quality. The study
observed that the high FDI inflows in the services, telecommunications, and automotive
sectors, corresponding to strong growth in the Indian economy. The metallurgical
industry continues to grow strongly, but with low FDI inflows. The main focus of the
study is on the overall impact and cause of FDI in the primary, secondary and tertiary
sectors. Another issue is the availability of data for all parameters before 2004. Therefore,
it is important to analyze sector-specific trends and impacts of FDI so that economic
growth can be accelerated to open up export-oriented areas through the growth of these
sectors. Thus, it can be concluded that India needs FDI to keep the economy growing and
developing. Expansion and development of the manufacturing industry, export-oriented
units, financial infrastructure and stability, and human capital development require FDI
13. REFERENCES:
1. Prachi Arora (2013), “Relation Between Inflow Of FDI and The Development Of
India's Economy”, International Journal of Trends in Economics Management &
Technology IJTEMT ISSN: 2321-5518; Vol. II, Issue III
2. Chandra, Nirmal (1991): "Growth of foreign capital and importance in Indian
manufacturing”', economic and political weekly, Volume 26, pp: 11-12.
High Technology Letters
Volume 27, Issue 1, 2021
ISSN NO : 1006-6748
http://www.gjstx-e.cn/245

3. Chauhan Karuna and Kumar Surendra, 'Foreign Direct Investment and India's
Economic Growth, Prabandhiki, Volume 3, No. 1&2, 2009.
4. Khan, M.Y. (2003): “Indian Financial System”, Tata McGraw-Hill Publishing
Company Ltd, pp: 28-33.
5. Hsiu-Yun Lee a, Kenneth S. Lin b, Hsiao-ChienTsu (2009) “Home country effects of
foreign direct investment: From a small economy to a large economy”, ELSEVIER
Publications, Volume 26, Issue 5.
High Technology Letters
Volume 27, Issue 1, 2021
ISSN NO : 1006-6748
http://www.gjstx-e.cn/246