Embed Size (px)
Citation preview
Delta Cost Project
at American Institutes for Research
September 2012
Re
Se
aR
ch
Pa
Pe
R
the Institutional costs of Student Attrition

This material is based on research funded by the Bill & Melinda Gates Foundation. The findings and
conclusions contained within are those of the authors and do not necessarily reflect positions or
policies of the Bill & Melinda Gates Foundation.
The Institutional Costs of Student Attrition
September 2012
Nate Johnson, Postsecondary Analytics LLC
1000 Thomas Jefferson Street, NWWashington, DC 20007-3835202-403-5000 • 800-356-2735


CoNTeNTSoverview and objectives . . . . . . . . . . . . . . . . . . . . . . . . . . . . . . . . . . . . . . . . . . . . . . . . . . . . . . 1
What Do We Mean by Attrition and How Big Is the Problem? . . . . . . . . . . . . . . . . . . . . . . . . . . 2
Defining and Measuring Attrition. . . . . . . . . . . . . . . . . . . . . . . . . . . . . . . . . . . . . . . . . . . . . . . . . 3
Measuring the Institutional Costs of Attrition . . . . . . . . . . . . . . . . . . . . . . . . . . . . . . . . . . . . . . . . 4
Measuring Attrition Using the Beginning Postsecondary Students Longitudinal Study . . . . . . . . 5
A Simple Taxonomy of Attrition . . . . . . . . . . . . . . . . . . . . . . . . . . . . . . . . . . . . . . . . . . . . . . . . . 11
estimating Attrition Costs Using State-Level Data . . . . . . . . . . . . . . . . . . . . . . . . . . . . . . . . . . . 13
State-Level or Institution-Level Analysis: Details of Proposed Methodology . . . . . . . . . . . . . . . 14
Consultations With States . . . . . . . . . . . . . . . . . . . . . . . . . . . . . . . . . . . . . . . . . . . . . . . . . . . . 17
Methodology—Comments and Concerns . . . . . . . . . . . . . . . . . . . . . . . . . . . . . . . . . . . . . . . 17
Politics and the Use of Attrition Analysis—Comments and Concerns . . . . . . . . . . . . . . . . . . . 17
State-Specific Data Availability . . . . . . . . . . . . . . . . . . . . . . . . . . . . . . . . . . . . . . . . . . . . . . . . . 18
Washington State: Testing the Attrition Methodology . . . . . . . . . . . . . . . . . . . . . . . . . . . . . . 18
Appendix . . . . . . . . . . . . . . . . . . . . . . . . . . . . . . . . . . . . . . . . . . . . . . . . . . . . . . . . . . . . . . . . 20
Beginning Postsecondary Students/Integrated Postsecondary education Data System Analysis: Definitions and Methodology . . . . . . . . . . . . . . . . . . . . . . . 20
Project Participants . . . . . . . . . . . . . . . . . . . . . . . . . . . . . . . . . . . . . . . . . . . . . . . . . . . . . . . . . 22
Delta Cost Project Staff and Consultants. . . . . . . . . . . . . . . . . . . . . . . . . . . . . . . . . . . . . . . 22
Steering Committee. . . . . . . . . . . . . . . . . . . . . . . . . . . . . . . . . . . . . . . . . . . . . . . . . . . . . . 22
North Carolina. . . . . . . . . . . . . . . . . . . . . . . . . . . . . . . . . . . . . . . . . . . . . . . . . . . . . . . . . . 23
Texas . . . . . . . . . . . . . . . . . . . . . . . . . . . . . . . . . . . . . . . . . . . . . . . . . . . . . . . . . . . . . . . . 23
ohio . . . . . . . . . . . . . . . . . . . . . . . . . . . . . . . . . . . . . . . . . . . . . . . . . . . . . . . . . . . . . . . . . 23
Washington . . . . . . . . . . . . . . . . . . . . . . . . . . . . . . . . . . . . . . . . . . . . . . . . . . . . . . . . . . . . 23
References . . . . . . . . . . . . . . . . . . . . . . . . . . . . . . . . . . . . . . . . . . . . . . . . . . . . . . . . . . . . . . 24


The Institutional Costs of Student Attrition | 1
oveRvIeW AND oBJeCTIveSone-third of students who enter postsecondary education expecting to earn a degree leave without one. A
few leave better off than they started, well employed and content with their accomplishment. But for many,
especially for students from lower income backgrounds, leaving prior to completing a degree or credential
is a missed opportunity and a lost investment. Students have devoted both time and money to their
unsuccessful effort. The public has contributed as well, through state appropriations to postsecondary
institutions and state and federal financial aid. Moreover, institutions have devoted resources to classes
and support services that never attach to a degree.
Previous research on attrition has focused on the economic consequences of low graduation rates in
terms of costs to students and families (from tuition and fees that do not culminate in a credential), lost
time, and income and tax losses from low educational attainment in the workforce. However, no systematic
attention has been given to another critical aspect of the cost of attrition, which is the cost to institutions
(and to their financial supporters) from the “lost” credits that do not lead to degrees or certificates.
Attrition clearly adds to the expense of producing college degrees, thus reducing it is crucial to enhancing
productivity and increasing educational attainment.
How big is this lost investment, and what do these “unfinished degrees” from student attrition look like?
Just as completed degrees come in different shapes and sizes, unfinished degrees vary widely from
student to student, although there has not been a common language to talk about them nor a method to
analyze their costs. The development of a simple definition of attrition, as well as a methodology that can
be used with existing data to assign costs to it, is the focus of this effort. Guided by advice from a group
of postsecondary education policy and data experts, this work sets forth the following:
¡ A clear definition of attrition that can be used by institutions and policymakers to develop
benchmarks and measure performance
¡ A methodology for assigning institutional production costs to attrition, both for national data sets
and for states that wish to pursue a similar analysis
¡ Identification of benchmarks that can serve as the basis for setting goals and measuring
performance in reducing attrition
¡ Suggestions of ways to use data on attrition and its costs to inform state- and system-level policy
choices and budgets, including performance funding
¡ Dissemination of the project’s findings to leaders and decision makers around the country
This report should be of special interest to institutional leaders and state policy audiences, including
system heads, presidents and provosts, governors and their staffs, legislators, state budget officers and
legislative fiscal analysts, and statewide coordinating and governing boards. These audiences are best
positioned to advance attainment goals by setting a clear agenda for reducing attrition and incorporating
reductions in attrition into future accountability and financing strategies.
2 | Delta Cost Project
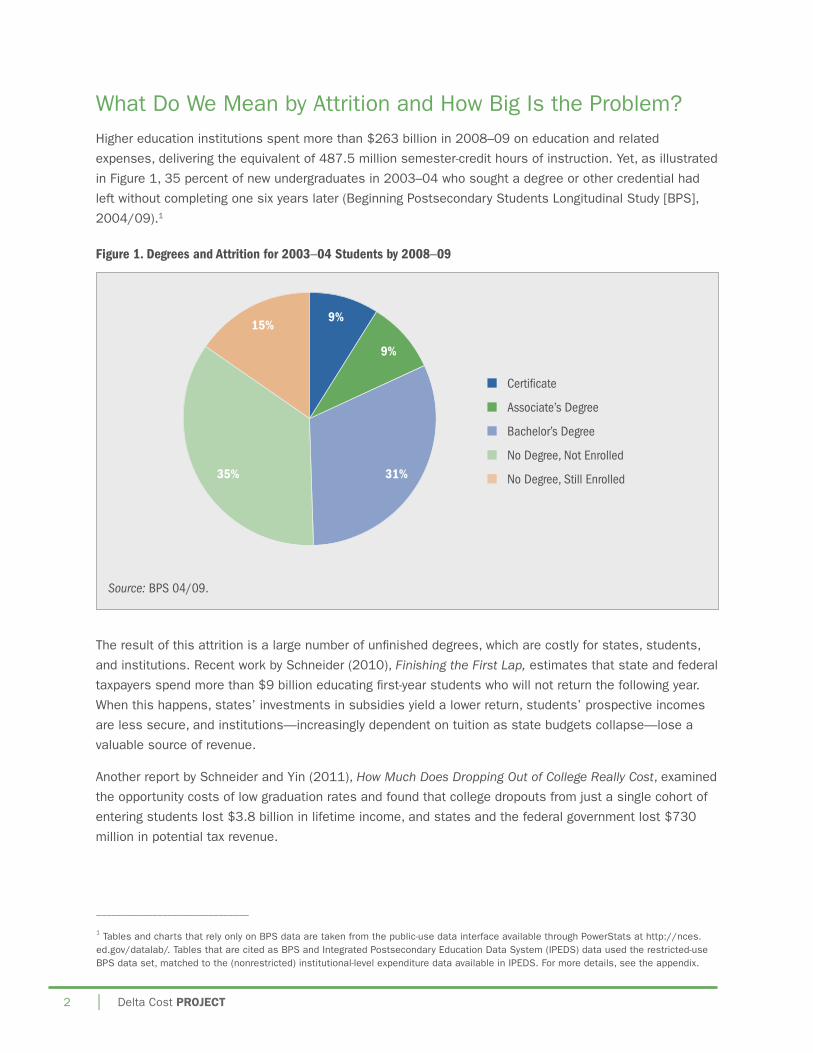
What Do We Mean by Attrition and How Big Is the Problem?Higher education institutions spent more than $263 billion in 2008–09 on education and related
expenses, delivering the equivalent of 487.5 million semester-credit hours of instruction. Yet, as illustrated
in Figure 1, 35 percent of new undergraduates in 2003–04 who sought a degree or other credential had
left without completing one six years later (Beginning Postsecondary Students Longitudinal Study [BPS],
2004/09).1
Figure 1. Degrees and Attrition for 2003–04 Students by 2008–09
The result of this attrition is a large number of unfinished degrees, which are costly for states, students,
and institutions. Recent work by Schneider (2010), Finishing the First Lap, estimates that state and federal
taxpayers spend more than $9 billion educating first-year students who will not return the following year.
When this happens, states’ investments in subsidies yield a lower return, students’ prospective incomes
are less secure, and institutions—increasingly dependent on tuition as state budgets collapse—lose a
valuable source of revenue.
Another report by Schneider and Yin (2011), How Much Does Dropping Out of College Really Cost, examined
the opportunity costs of low graduation rates and found that college dropouts from just a single cohort of
entering students lost $3.8 billion in lifetime income, and states and the federal government lost $730
million in potential tax revenue.
■ Certi�cate
■ Associate’s Degree
■ Bachelor’s Degree
■ No Degree, Not Enrolled
■ No Degree, Still Enrolled
9%
9%
31%35%
15%
Source: BPS 04/09.
______________________________
1 Tables and charts that rely only on BPS data are taken from the public-use data interface available through PowerStats at http://nces.ed.gov/datalab/. Tables that are cited as BPS and Integrated Postsecondary education Data System (IPeDS) data used the restricted-use BPS data set, matched to the (nonrestricted) institutional-level expenditure data available in IPeDS. For more details, see the appendix.

The Institutional Costs of Student Attrition | 3
The analysis and methodology developed here, however, focus more narrowly on the definition of attrition
and its associated institutional production costs, the different types of attrition that can be usefully
distinguished, and ways to use data about attrition costs and patterns to reduce the costs of producing
degrees through an increase in educational throughput. Despite considerable attention to the importance
of the college completion agenda, a surprising paucity of language or measures exists to get at attrition.
Most institutional, state, and national data systems currently used by policymakers are set up to provide
information about students who complete degrees: graduation rates, award levels, race/ethnicity, gender,
detailed major, and so on. The systems do not, however, provide a similar level of detail about students
who fail to complete degrees. As a result, conversations about the causes, costs, and consequences of
attrition tend to rely heavily on anecdotes or assumptions.
DeFINING AND MeASURING ATTRITIoNWe define attrition as departure from all forms of higher education prior to completion of a degree or other
credential. Attrition can involve a high school graduate who drops out before receiving an associate’s
degree, or an associate’s degree or certificate completer graduate who continues to take courses but does
not finish an additional credential.2
This definition of attrition is intentionally conservative. It establishes a lower limit to the number of unfinished
degrees that can be identified and allows this analysis to focus on the clearest cases. To the extent it is
possible to make the distinction, students who leave one institution for another or who take a long time
to finish a degree are not included in the definition of attrition. extended time-to-degree and unplanned
transfers have their own costs, causes, and consequences, some of which (although not all) are related
to attrition. But the definition used here avoids them to keep the analysis as focused as possible.
In practice, states and institutions are limited in the extent to which they are able to separate students
who are dropping out of higher education altogether from those who are leaving one institution, system, or
state and enrolling and finishing elsewhere. States with comprehensive postsecondary databases and low
rates of interstate mobility are better able to capture data on these students than individual institutions or
systems in states with high rates of interstate mobility. The National Student Clearinghouse is a resource
for states and institutions to identify some of their missing transfers-out, although it is costly to use and
does not capture everyone.
Another limitation many states and institutions face in estimating their total attrition rates (or long-term
graduation rates) is establishing a cohort that reaches far enough back in time to include those students
who take a long time to finish their degrees. even the standard six-year graduation rate calculation
mandated by Congress as a national accountability measure requires data stretching back seven years
from the time it is finally calculated. Ten to 12 years would capture a much larger proportion of eventual
completers, especially among transfer students, who take considerably longer.
______________________________
2 Although the focus here is on undergraduate attrition, in principle this would extend to graduate education as well, with attrition taking place between bachelor’s and master’s or first-professional degrees, and between master’s and doctoral degrees.

4 | Delta Cost Project
However, this presents two problems for many systems and states: first, many state data systems were
only recently established and do not have the history required for a reasonable calculation. Second, and
more importantly, attrition or graduation rates based on a cohort that started 6 to 12 years ago would
have little credible link to policies or people currently in place.
The method developed by this project avoids both of these constraints by estimating long-term attrition
rates based on just two or three years of data. each year, different attrition (or persistence) rates can be
calculated for first to second year, second to third year, third to fourth year, and so on. These rates can
then be used to project the number of currently enrolled students who will persist or drop out in future
years. A key advantage of using current attrition/persistence rates is that the derived long-term estimates
are based on current students, context, policies, and practices, rather than those that were in place
many years ago.
Despite the practical difficulties, the conservative approach proposed here establishes a general framework
that states and institutions can adapt as their data systems permit, while clearly stating any limitations
that are likely to result in understatements or overstatements of true attrition in their student populations.
Because they are not institutionally precise, the measures are best used to set beginning benchmarks and
measure progress over time, rather than as “accountability” metrics for individual institutions.
MeASURING THe INSTITUTIoNAL CoSTS oF ATTRITIoNThe idea of “cost” used in this analysis specifically zeroes in on the institutional costs associated with
attrition, measured by education and related spending per student on credits that do not attach to a degree
or certificate from any institution within six years of initial enrollment.3 This is not intended to discourage
other ways of looking at the issue. More elaborate measures are possible and would be analytically “correct,”
such as including the recruitment and enrollment costs for students who drop out, along with “lost”
financial aid, and developing more fine-tuned cost estimates by level of instruction and discipline. Fuller cost
estimates also could include the student opportunity costs from enrollment in college (rather than working
full time) against lifetime changes in earnings associated with degree attainment.
The data requirements for these more precise measures would not, in our opinion, improve the essential
accuracy of the average cost/credit-based measure. We also believe it appropriate to focus on the
spending measures that are most controllable by institutions or policymakers, and that can be assigned
back to budgets and the resource allocation decisions within institutions.
______________________________
3 For more information on calculation of education and related expenses, see the Delta Cost Project, Metrics for Improving Cost Accountability, available at http://www.deltacostproject.org/resources/pdf/issuebrief_02.pdf

The Institutional Costs of Student Attrition | 5
Measuring Attrition Using the Beginning Postsecondary Students Longitudinal StudyTo get a general idea of the scope and associated institutional costs of undergraduate attrition nationally,
we combined data from the BPS survey, which has information on students’ persistence and attainment
levels after six years—no matter whether or how many times they transferred among institutions, sectors,
and states—with institutionally reported financial data from the Integrated Postsecondary education Data
System (IPeDS).
By linking the records of students in the BPS survey to the institutions they attended, and by using data on
months of full-time and part-time enrollment from the survey, we were able to estimate total instructional
and related expenditures for 95 percent of both dropouts and completers in the survey.
A key finding is that although 35 percent of students left without finishing, these students accounted for
19 percent of total instructional and related spending. This is primarily because students who left higher
education spent less time enrolled, on average, than students who completed. Also, students who
dropped out were more likely to be attending less expensive institutions, such as community colleges,
than students who completed and spent more time in less expensive, lower level classes. The average
(mean) estimated expenditure per completed degree was $43,000, while the average expenditure per
unfinished degree (measured as credits taken that will not be ultimately assigned to a degree) was
$18,000 (Table 1).
The BPS survey is intended to embrace a nationally representative sample of postsecondary students;
each student is assigned a “weight” that reflects the number of students he or she represents nationally.
Using these weights, along with institutional cost data, we can estimate the approximate share of costs
that each group of students represents.
Table 1. Education and Related Costs per Student in BPS Cohort, 2003–09, by Persistence and Attainment Status
Status Percentage of all costsaverage (Mean) cost per Student
Median education and Related cost per Student
certificate 4.6% $ 16,127 $ 12,777
associate's 9.6% $ 33,856 $ 31,400
Bachelor's 51.3% $ 53,781 $ 45,461
any credential 65.4% $ 43,035 $ 38,467
No degree, not enrolled 19.5% $ 18,125 $ 13,772
No degree, still enrolled 15.1% $ 32,455 $ 30,222
Total 100.0% $ 32,684 $ 28,503
Source: BPS 04/09 and IPeDS.

6 | Delta Cost Project
The rates of attrition and the costs of unfinished degrees are broken out for the largest sectors of
postsecondary education in Table 2. (other sectors were too small to have meaningful results.) Attrition
accounted for 33 percent of all estimated expenditures at public two-year institutions, 13 percent at
public four-year institutions, and 9 percent at private four-year institutions. For public two-year institutions
(community colleges), the cost per completed associate’s degree was roughly $32,000 compared with
$15,000 per unfinished degree. At public four-year colleges, on average $47,000 was spent on a
completed bachelor’s degree versus $27,000 on an unfinished degree.
The numbers in Table 2 present a rough guide to the amount of attrition and the attendant costs
in different sectors of undergraduate higher education. There are two reasons, however, why these numbers
likely underestimate the amount of attrition and associated costs, on the one hand, and why they may
overestimate the extent of attrition, on the other hand. First, they underestimate attrition because
some students who complete a credential do reenroll in an attempt to complete another credential
(e.g., associate’s degree graduates who go on for a bachelor’s degree), but ultimately fail to complete it. of
the BPS cohort students who did complete a credential, 11 percent reenrolled after completion but did not
receive another degree. This amounts to about 5 percent of all students. on average, these students
enrolled for 9.4 months after their last completion at an estimated average cost of about $7,000
per student.
A more significant reason that these numbers may underestimate costs is that many students who were
still enrolled after six years will eventually drop out. Thirteen percent of students who were counted as
“no degree, still enrolled” in 2008–09—six years after starting out—said they did not plan to reenroll
the following year, and it is likely that more will drop out in the following years (Table 3). even if the
numbers of students involved are small (13 percent of the 15 percent “still enrolled” is just 2 percent
of all students), the costs per student would be relatively high because of the longer time spent in
higher education.

The Institutional Costs of Student Attrition | 7
Table 2. Education and Related Costs Relative to Persistence/Attainment by Sector of Students’ First Enrollment
Percentage of all costs
average (Mean) cost per Student
Median cost per Student
Percentage of Students
Public Four-Year (Total = 1,095,092)*
certificate 0.9% $25,277 $ 20,272 1.5%
associate's 5.1% $ 42,398 $ 36,966 5.0%
Bachelor's 67.1% $ 46,700 $ 42,231 59.7%
any credential 73.2% $ 45,879 $ 41,523 66.2%
No degree, not enrolled 12.9% $ 26,572 $ 23,306 20.1%
No degree, still enrolled 13.9% $ 42,431 $ 41,162 13.6%
Total 100.0% $ 41,523 $ 39,221 100.0%
Public Two-Year (Total = 1,519,139)*
certificate 8.8% $ 19,364 $ 17,397 10.0%
associate's 19.6% $ 32,196 $ 30,263 13.4%
Bachelor's 14.8% $ 41,621 $ 39,743 7.8%
any credential 43.2% $ 30,443 $ 29,124 31.2%
No degree, not enrolled 32.7% $ 14,730 $ 12,030 48.8%
No degree, still enrolled 24.2% $ 26,563 $ 24,194 20.0%
Total 100.0% $ 21,998 $ 18,638 100.0%
Private Four-Year (Total = 529,821)*
certificate 0.8% $ 26,848 $ 19,960 1.8%
associate's 3.6% $ 42,832 $ 45,518 5.0%
Bachelor's 78.6% $ 71,430 $ 59,944 65.5%
any credential 83.1% $ 68,337 $ 57,243 72.4%
No degree, not enrolled 9.4% $ 32,605 $ 24,610 17.1%
No degree, still enrolled 7.5% $ 42,771 $ 40,026 10.5%
Total 100.0% $ 59,530 $ 50,455 100.0%
*Weighted number of students. Source: BPS 04/09 and IPEDS.

8 | Delta Cost Project
on the other hand, the numbers likely overestimate the extent of attrition and related costs because some
of the students who were not enrolled after six years and did not have a credential do eventually come
back and complete one (Table 3). of the 35 percent of students who dropped out without a degree
by the end of six years, 40 percent said they intended to reenroll in the seventh year, after the end of the
study period.
Table 3. Percentage of 2003–04 BPS Cohort Leavers and Continuing Students Planning to Enroll in Year After End of the Study
Plans for the 2009–10 School Year
NO, Plan to enroll for 2009–10 YeS, Plan to enroll for 2009–10
No degree, not enrolled 60.5% 39.5%
No degree, still enrolled 13.1% 86.9%
Source: BPS 04/09.
Although it is important to be aware of these significant gaps in the analysis, to some extent they cancel
one another out. Some of the “dropouts” will complete and some of those who have persisted will
eventually drop out. A long-term completion rate of about 65 percent to 70 percent (and consequently an
attrition rate of 30 percent to 35 percent) is consistent with other longitudinal studies of postsecondary
attainment (Adelman, 2006). For the purposes of this analysis, which aims to estimate only the general
magnitude of attrition and related costs, these numbers remain a reasonable approximation.
Short-term Versus Long-term Attrition
The costs and consequences of attrition for students who leave higher education soon after first enrolling
are different from those for students who leave after a longer period of enrollment. early attrition is the
larger, more worrisome problem in terms of the nation’s educational attainment because it is so
widespread. Yet for individual students, the lost investment of time and money is smaller when they have
been enrolled for a few months than when they have spent several years pursuing a degree without
completing one. The same is true for those who subsidize higher education—state governments, private
philanthropists, and the federal government.
As Table 4 illustrates, although early dropouts (those with 24 or fewer months of total enrollment)
accounted for 73 percent of all students who departed prematurely, they accounted for only half of the
expenditures on unfinished degrees, or roughly equivalent to spending on the 27 percent of dropouts who
left after more than two years. The students who left after more than 36 months enrolled were just 9
percent of all dropouts but accounted for 22 percent of expenditures. The average amount spent on those
who left early was approximately $12,000 per student, while expenditures amounted to $34,000 per
student for those who left later.

The Institutional Costs of Student Attrition | 9
Table 4. Percentage of Unfinished Degrees and Costs by Detailed Time of Attrition
Years of Postsecondary education
average (Mean) cost per Student Percentage of costs Percentage of Students
One year or less $ 8,830 21.3% 43.8%
1–2 years $ 17,427 28.3% 29.4%
Subtotal: 2 years or less $ 12,285 49.6% 73.2%
2–3 years $ 29,417 28.8% 17.8%
3–4 years $ 42,036 16.8% 7.3%
4+ years $ 47,122 4.8% 1.8%
Subtotal: More than 2 years $ 34,039 50.4% 26.8%
Total $ 18,125 100.0% 100.0%
Source: BPS 04/09 and IPeDS 2008–09.
Academic Failure and other reasons for Dropout
Perhaps surprisingly, the proportion of students who leave higher education because of clear-cut academic
failure—grades in the D and lower range—is relatively small. only 10 percent of dropouts left with a
grade point average (GPA) estimated to be below the “C” range, and if the “C” range is included, that
proportion rises to only 19 percent (Table 5). These students accounted for 15 percent of the
expenditures on unfinished degrees.
Conversely, fully 40 percent of dropouts had estimated GPAs in the A and B range, accounting for
43 percent of the costs. And 17 percent had “Mostly As”—a higher proportion than had Ds and Fs.
Table 5. Percentage of Unfinished Degrees and Costs by Detailed Estimated Cumulative GPA
GPa estimate When Last enrolled Through 2009
average (Mean) cost per Student Percentage of costs Percentage of Students
Mostly as (3.75 and above) $ 17,067 16.3% 17.3%
as and Bs (3.25–3.74) $ 20,365 26.6% 23.7%
Mostly Bs (2.75–3.24) $ 19,105 22.8% 21.6%
Bs and cs (2.25–2.74) $ 19,054 19.1% 18.1%
Mostly cs (1.75–2.24) $ 16,793 8.5% 9.2%
cs and Ds (1.25–1.74) $ 13,115 3.6% 4.9%
Mostly Ds or below (below 1.24) $ 11,196 3.2% 5.2%
average for aLL leaving without degree $18,125 100% 100%
Source: BPS 04/09 and IPeDS 2008–09.

10 | Delta Cost Project
of course, GPA is only one measurement of students’ academic experiences. Students with GPAs in the B
or C range may not perceive themselves as academically successful, or may weigh the trade-offs differently
when deciding whether to stay in college or leave. But, clearly, a large number of students are leaving
college with academic records at least as good as those of students who do graduate.
When asked why they left, the students’ responses were roughly consistent with the distribution of grades
in Table 5. As shown in Table 6, only about 8 percent of students who had dropped out later, by 2006,
cited “academic problems” as one of their reasons for leaving (they could give multiple reasons). A higher
proportion—15 percent—of those who left in their first year (by 2004) cited academic problems as at least
one factor in their departure. Students’ self-reports are not always reliable or useful, and reducing complex
life decisions to multiple-choice questions inevitably leads to oversimplification (Porter, 2011). It is
unknown, for example, what role academics might play in students’ “personal reasons” for leaving
postsecondary education, which were cited by half of those who dropped out. But taken together with the
grade distributions, these responses suggest that nonacademic issues play a bigger role than academic
problems for dropping out.
The fact that so many students are leaving higher education after substantial periods of enrollment, and
that they are often leaving with academic records as good as those of students who do graduate, runs
counter to the idea that attrition rates are high because “not all students are college material.” It also
suggests that more energy could be put into strategies to help potential late-stage dropouts with the
nonacademic issues they worry about most.
Table 6. Reasons Cited for Leaving Higher Education, and Percentage of 2003–04 BPS Students Who had Left Without a Degree by 2008–09
Reason Left early (by 2004) Left Later (by 2006)
academic problems 14.6% 8.4%
Dissatisfied with program 15.5% 13.9%
Family responsibilities 18.4% 15.4%
Financial reasons 29.0% 22.4%
Finished desired classes 2.8% 7.2%
Other reasons 25.6% 22.2%
Personal reasons 57.4% 49.1%
Scheduling problems 7.6% 15.4%
Military service —— 1.9%
Source: BPS 04/09.

The Institutional Costs of Student Attrition | 11
A SIMPLe TAxoNoMY oF ATTRITIoNFigure 2 combines enrollment duration with academic performance to illustrate a summary classification
of attrition into four categories. The percentages represent the proportion of all dropouts who fall into that
category. The largest group—48 percent—is composed of those who leave with less than two years of
postsecondary education but who are in good academic standing. This group is important because it is
so big and students in this category have shown that they can succeed in postsecondary-level work. Major
gains in graduation rates are unlikely without reducing the numbers of students in this group.
The second largest group, at 33 percent of dropouts, consists of students who leave with more than
two years of postsecondary education but who are in good academic standing. Not only have they shown
themselves capable of college-level work, but they have also completed a substantial amount of coursework,
representing a significant investment of time and money. Investments in strategies to help these students
find ways to stay in higher education, or to return once they have left, may yield the highest “return on
investment” in terms of increasing the number of college graduates. Much of their education has already
been paid for. The $47,000 spent on students who leave without a credential after four years (Table 4) is
not much different from the average expenditures on public bachelor’s degree graduates (Table 2). If a few
thousand dollars in additional aid, loan subsidies, or academic support could tip the balance to completion
for these students, the marginal cost of the additional degrees would be much lower than what it takes to
educate a new freshman.
Figure 2. Proportion of all Unfinished Degrees, BPS Cohort Students
60
50
40
30
20
10
0
Percent
48%
15%
33%
Left Early Left Early Left Late Left Late in Good Standing Not in Good Standing in Good Standing Not in Good Standing
5%
Source: BPS 04/09.

12 | Delta Cost Project
This is one reason that a number of states and institutions have actively begun trying to recruit back to
higher education the adult students who have already completed substantial numbers of credit hours.
Institutions such as Western Governors University and empire State College take very few first-time
freshmen, and instead focus on tailoring academic programs for returning students who may have
credits from a number of different institutions to provide them with exactly what they need to complete
their degrees.4
The students who leave early with weak academic records, and who represent what many people might
consider typical college dropouts, constitute a relatively small minority—15 percent. These students may
have found postsecondary work too challenging or difficult to balance with other commitments, or they
may have ended up in the wrong type of institution or program for their needs. When institutions create
programs or interventions to help this group, they should take care to move students into the “completers”
category rather than into the last group in the grid—those who stay in higher education for a prolonged
period before finally dropping out.
The 5 percent of dropouts who attend for a long time but leave with a poor academic record are a small
proportion of the whole. But this group illustrates why “retention” without completion should not be seen
as an end in itself. Not only do these students leave without a degree and good prospects for returning
later to complete one, but also they have spent much longer in the attempt than students in the previous
group. For this group, the best approach could be to improve advising and tracking systems to ensure that
students do not remain too long in programs in which they have not been successful.
______________________________
4 Based on similar logic, the Lumina Foundation for education supports a number of these efforts through its Adult Degree Completion Program, and many states are seeking ways to identify “near-completers” in their populations to help them finish.

The Institutional Costs of Student Attrition | 13
eSTIMATING ATTRITIoN CoSTS USING STATe-LeveL DATAThe earlier analysis provides a broad perspective on attrition and its cost across the entire postsecondary
undergraduate system in the United States. It could also serve as a template for states or institutions
seeking to analyze their own attrition problems and think about the return on investment of different
strategies to increase retention and completion. States and institutions that have the data can reproduce
something similar to the BPS cohort analysis discussed earlier, using their own expenditure data in place
of the IPeDS-derived estimates.
Typically the data available to states, however, do not resemble the BPS data set. With a few exceptions,
statewide data systems are relatively new and may lack sufficient history for a long-term cohort study.
Moreover, an analysis that uses current attrition rates would be more valuable to policymakers and
institutional leaders than one that would be based on rates in effect in 2003, 2004, or earlier.
An alternative for states with younger databases or that need to account for more recent trends is to use
current year-to-year attrition rates to estimate the number of students who will leave over the long term.
This approach approximates the “Markov chain” method that many institutions use to project enrollments
for budgeting and planning purposes (Armacost, Archer, Pet-Armacost, & Grey 2006; Donhardt, 1995).
This methodology is described in more detail in the ensuing section, but the basic steps include
the following:
1. Determine how many of last year’s students who did not receive a degree reenrolled in the
current year.
2. Group those students into first year, second year, and so on, according to their recorded dates
of entry into the system.
3. Calculate persistence/attrition and degree completion rates for each group: first to second year,
second to third year, and so on.
4. Apply those rates several times in succession to estimate how many students will receive
degrees, remain enrolled, or drop out for the next several years (i.e., estimate how many current
first-year students will enroll for a second year and then how many of those second-year students
will persist to a third year).
5. Associate costs to each student based on institutional or systemwide costs per student.

14 | Delta Cost Project
State-Level or Institution-Level Analysis: Details of Proposed MethodologyThis method estimates the proportion of each year’s higher education expenditures that goes to pay for
the instruction of students who never graduate. Unlike cohort studies of graduation and attrition, the
proportion can be estimated with relatively recent data. The spreadsheet, the Steps to Project Long-Term
Attrition in Currently Enrolled Students—a static version of which is presented on the following two pages—
illustrates the sequential steps proposed for this analysis, and the formulas embedded in the spreadsheet
show how each number is calculated.
As a resource to states or institutions that wish to analyze their own attrition patterns and costs, a free SAS
program and manual were produced as a companion to this report. The basic steps are outlined below.
estimating current Attrition (The numbers refer to the steps highlighted in the yellow column headings in the mock data tables.)
Setting up baseline data:
(1) Begin with all undergraduate students who enrolled at any time during the second most recent year of
available data. Academic year 2008–09 is used in this example. Classify students by the number of
chronological years since their initial enrollment in the system.
(2)–(3) For each year’s “cohort,” identify those who graduated with any credential in that same year and
calculate a graduation rate.
(4)–(5) Of the remaining students who did not receive a credential, identify those who reenrolled at any
time during the following year and calculate a retention rate.
(6)–(7) Estimate a returning stop-out adjustment rate by identifying all students in the most recent year
available who are not new students but who also were not enrolled in the prior year. In this example, it
would be 2009–10 students who are not new but who were not enrolled in 2008–09. Calculate a
returning student adjustment by using this number as a proportion of all students enrolled the prior year
(7). NOTE: The groups should be single years for as many years as allowed without cell sizes becoming too
small (e.g., 10th year to 11th year). Rates based on small cell sizes or on the remainder (e.g., 11th year and
above) need to be adjusted to avoid skewing the results.
(8)–(10) Subtract the graduates and retained students from the initial cohort (8) and calculate an
unadjusted attrition rate (9). Use the stop-out adjustment rate to create the adjusted attrition rate
(10). NOTE: The groups should be single years for as many years as allowed without cell sizes becoming too
small (e.g., 10th year to 11th year). Rates based on small cell sizes or on the remainder (e.g., 11th year and
above) need to be adjusted to avoid skewing the results.

The Institutional Costs of Student Attrition | 15
Projecting Future/current Attrition
Projection chains:
(11) Apply the rates derived above to the current year or most recent year’s students to estimate year-to-
year attrition for everyone enrolled.
(12) Advance the current year’s students a year in the projections. Subtract the students projected to
graduate or drop out from the current year’s cohort, and add a year to their classification. Repeat as many
times as needed until attrition numbers become insignificant.
Results:
(13) Add the results together to get estimates of total projected attrition for currently enrolled students.
estimating costs
Costs:
(14) estimate total costs based on the proportion of credit hours taken by students in each group at
each level.
This last step can be made more precise by using more detailed cost data, where available, or by calculating
Steps 1–13 separately for full-time and part-time students.
Steps to Project Long-term Attrition for currently enrolled Students
A static illustration (a spreadsheet) accompanies this report:
Page 1: Sample Baseline Data Page 1: SAMPLE BASELINE DATA
1 2 3 4 5 6 7 8 9 10
YEARS SINCE 1ST ENROLLED
2008-09 STUDENTS ANNUAL
UNDUPLICATED HEADCOUNT
GRADUATED%
GRADUATED
2009-10 # RETAINED ANNUAL
UNDUPLICATED HEADCOUNT
% RETAINED2009-10
RETURNING STUDENTS
RETURN ADJUSTMENT
NON-RETAINED
UNADJUSTED ATTRITION
RATE
ADJUSTED ATTRITION
RATE
1 100 0 0% 80 80% 0 0% 20 20% 20%2 87 0 0% 72 83% 1 1% 15 17% 16%3 81 10 12% 60 74% 2 2% 11 14% 11%4 60 40 67% 15 25% 1 2% 5 8% 7%5 30 12 40% 12 40% 1 3% 6 20% 17%
6+ 60 20 33% 30 50% 1 2% 10 17% 15%418 82 20% 269 64% 6 1% 67 16% 15%

16 | Delta Cost Project
Page 2: Projection Chains
Page 3: Results
Page 4: Costs
Page 2: PROJECTION CHAINS
2010-11 STUDENTS
UNDUPLICATED
HEADCOUNT2011-12
GRADUATES2011-12
ATTRITION
2012-13 REMAINING STUDENTS
2012-13 GRADUATES
2012-13 ATTRITION
2013-14 REMAINING STUDENTS
2013-14 GRADUATES
2013-14 ATTRITION
2014-15 REMAINING STUDENTS
2014-15 GRADUATES
2014-15 ATTRITION
2015-16 REMAINING STUDENTS
2015-16 GRADUATES
2015-16 ATTRITION
2016-17 REMAINING STUDENTS
2016-17 GRADUATES
2016-17 ATTRITION
2017-18 REMAINING STUDENTS
2017-18 GRADUATES
2017-18 ATTRITION
2018-19 REMAINING STUDENTS
2018-19 GRADUATES
2018-19 ATTRITION
YEARS SINCE 1ST ENROLLED
1 110 - 22 2 93 - 15 88 - 14 3 85 10 9 78 10 9 74 9 8 4 70 47 5 65 43 4 60 40 4 57 38 4 5 44 18 7 19 7 3 17 7 3 16 6 3 15 6 3
6+ 80 27 12 19 6 3 8 3 1 8 3 1 7 2 1 7 2 1 6+ 41 14 6 10 3 1 4 1 1 4 1 1 4 1 1 3 1 1 6+ 21 7 3 5 2 1 2 1 0 2 1 0 2 1 0 2 1 0 6+ 11 4 2 3 1 0 1 0 0 1 0 0 1 0 0 6+ 6 2 1 1 0 0 1 0 0 1 0 0 6+ 3 1 0 1 0 0 0 0 0 6+ 2 1 0 0 0 0 6+ 1 0 0
Total 482 101 70 310 81 39 190 69 21 100 53 11 36 13 6 18 6 3 9 3 1 5 2 1
11 12
Repeat Pattern
for severa l
more years unti l
numbers become ins igni fi
cant
Page 3: RESULTS
2010-11 Years since first enrollment
Total Enrolled in 10-11Projected Attrition
Percent Attrition
1 110 52 48%2 93 32 35%3 85 19 22%4 70 10 15%5 44 13 30%
6+ 80 25 31%Total 482 152 31%
13PROJECTED NUMBER OF STUDENTS ENROLLED IN 2010-11 WHO WILL NOT GRADUATE, BASED ON CURRENT RETENTION / GRADUATION
RATES
Page 4: COSTS
ATTRITION COST TOTAL
ATTRITION % OF COSTS
COST ESTIMATES
LOWER DIVISION
UPPER DIVISION
LOWER DIVISION
COSTS
UPPER DIVISION
COSTS
LOWER DIVISION
COSTS
UPPER DIVISION
COSTSTOTAL TOTAL
1 1,420 165 213,000$ 41,250$ 254,250$ 101,451$ 19,647$ 121,098$ 48%2 877 465 131,550$ 116,250$ 247,800$ 45,635$ 40,328$ 85,963$ 35%3 510 680 76,500$ 170,000$ 246,500$ 17,029$ 37,842$ 54,871$ 22%4 160 750 24,000$ 187,500$ 211,500$ 3,511$ 27,430$ 30,941$ 15%5 40 440 6,000$ 110,000$ 116,000$ 1,799$ 32,981$ 34,780$ 30%
6+ 50 720 7,500$ 180,000$ 187,500$ 2,316$ 55,578$ 57,894$ 31%TOTAL 3,057 3,220 458,550$ 805,000$ 1,263,550$ 171,741$ 213,806$ 385,546$ 31%
14
CREDITS COSTSATTRITION COSTS
2010-11
TOTAL COSTS

The Institutional Costs of Student Attrition | 17
CoNSULTATIoNS WITH STATeSTo assess the viability of this approach and identify other methods of analyzing state-level costs of unfinished degrees, we consulted with officials in four states: Washington, ohio, Texas, and North Carolina. one of these, Washington, tested this method on its own data; the results are discussed later. (The appendix includes detailed instructions and the SQL code for other states or institutions that wish to use the approach or a modified version of it.)
The state officials provided constructive feedback regarding both the methodology and politics of
employing this proposed method for analyzing attrition.
Methodology—Comments and Concerns ¡ costs: States are uncomfortable using IPeDS expenditure data, which often does not match
internal budget documents, but they recognize that their own cost data may not be comparable with those of other states.
¡ Student-level data are generally available, but comparability among states will depend on how comprehensive the collections are: single system versus all public institutions; four-year only versus two-year and four-year; access to private college enrollments/completions versus no access.
¡ the National Student clearinghouse (NSc) came up as a resource that states could use to track students into private or out-of-state institutions to ensure the “attrition” they capture within their system does not include students who had graduated or remained enrolled outside of their own collection systems. Yet, NSC has two serious disadvantages. First, although it covers a large proportion of institutions nationally, local gaps remain that could have significant effects on data for individual states or institutions if a major transfer destination is not included in the system.
Second, it can be prohibitively expensive given the limited budgets available to many states.5
Politics and the Use of Attrition Analysis—Comments and Concerns
¡ Misinterpretation: Policymakers might interpret the costs of attrition simply as “waste,” even though there is value to higher education independent of the degree completed. They may also be tempted to compare costs among institutions or across states, even when the students (or data) are very different.
¡ State versus student costs: Some states will have higher public costs or student costs depending on their levels of subsidy to institutions.
¡ Financial aid: The results of the analysis could have implications for state financial aid policy if aid is “front-weighted” to students with high attrition rates in the early stages of their college careers.
¡ transfer students: The method is helpful in explaining attrition to policymakers because it does
not, as much as possible, lump transfer students together with dropouts.
______________________________
5 In fact, we were unable to use NSC for this study because of the estimated costs involved.

18 | Delta Cost Project
STATe-SPeCIFIC DATA AvAILABILITYAs part of the consultation with state officials, we attempted to identify the presence or absence of data
that would be necessary or useful to support an analysis using the methodology developed in this report.
The results of these consultations are summarized in Table 7. All four states had the basic elements
needed to execute the analysis, although ohio and Texas had considerably more data to support the work.
In fact, both states had already performed an analysis of dropout and completion costs using their own
assumptions and methods.
Table 7. State Data Systems for Unfinished Degree Analysis
North carolina Texas Washington Ohio
has state-level system Yes Yes Yes Yes
has least six years of consistent data Yes Yes No Yes
Two-year and four-year data are joined No (but can be) Yes No Yes
access to private institution data No Partial No Partial
has used NSc in past or has subscription
Yes Yes No Yes
has cost analysis ready for usePartial (12-cell budget matrix)a Yes
No (but can infer from budget)
Yes
has conducted degree or dropout cost study using different methodology
No Yesb
No (but agreed to beta test this
approach)Yesc
a University of North carolina (2010).b Unpublished work in progress.c Ohio Board of Regents (2006).
Washington State: Testing the Attrition MethodologyStaff members at the Washington Higher education Coordinating Board generously agreed to apply the
methodology outlined here to data from the four-year colleges in that state. They were able to do so using
two years of data manipulated in a large spreadsheet workbook.
The methodology worked well, with the exception of the calculated returning student rate for long-term
students, which were grouped together as the “6+” year cohort. Many long-term students do leave and
reenroll, so the return rate for all of these students together was very high. The method also is built
around single-year cohorts, so a rate for a cohort that includes multiple years of students requires some
adjustment to avoid skewing the results.
The Institutional Costs of Student Attrition | 19
The methodology outlined was changed to recommend that analysts group students into as many single-
year cohorts as possible (i.e., include separate cohorts for seventh-, eighth-, and ninth-year students)
without resulting in small cell sizes. Where the returning student rates appear unreasonable because of
small cell sizes, they could be adjusted to an annual average for long-term students. Because most
attrition occurs before the sixth year, the method could also simply be stopped after five or six iterations
without unduly distorting the results.
With adjustments for the problem described above, Washington’s attrition rates within the four-year system
were generally consistent with the results from the national BPS analysis, although attrition was somewhat
higher, probably because data from private and out-of-state institutions were not available and the
methodology was tested within the four-year public system only.

20 | Delta Cost Project
APPeNDIx
Beginning Postsecondary Students/Integrated Postsecondary education Data System Analysis: Definitions and MethodologyFor summaries of attrition data without costs, the unrestricted PowerStats interface for the Beginning
Postsecondary Students Longitudinal Study (BPS) 2004/09 was used. Where the analysis involved
institutional expenditure data, the analysis used the restricted-use data set for the BPS survey. The BPS
survey includes students who entered college for the first time in 2003–04 and were followed for six years
through 2008–09.
Students
All students, degree-seeking or not, in the BPS cohort were selected. only those whose enrollments could
be matched to institutions that had expenditure data in the Integrated Postsecondary education Data
System (IPEDS) were used in the final analysis. This amounted to 95 percent of the students, so the
results were not materially different from what they would have been if all students had had matching
expenditure data.
Attrition
To identify “unfinished degrees,” students whose “cumulative persistence and attainment” by 2008–09
was “no degree, not enrolled” were counted as dropouts. This is different from single-institution attrition
because students were only counted as dropouts if they did not reenroll or complete a degree anywhere at all.
Institutions
each student was matched to all institutions they attended throughout the study period.
Full-time enrollment
To calculate the number of full-time enrollment (FTe) years a student was enrolled, the number of cumulative
months of FTe for each student and one-third of the number of cumulative part-time enrollments were added,
and the result divided by 12. An undergraduate FTe in IPeDS is calculated as 30 semester credit hours, so
this calculation assumes that a typical full-time student would attempt 30 credit hours in each 12-month
period and that a part-time student would attempt about 10. These numbers are roughly consistent with
transcript studies and state-level reports on course load levels.
The result for each student was a total estimated cumulative FTe enrollment for the six-year period of
the study.
The Institutional Costs of Student Attrition | 21
education and related expenditures per Fte
each institution’s education and related expenditures were calculated using the Delta Cost Project
methodology, which includes all expenditures for instruction and student services, plus a prorated share
of academic support, institutional support, and plant operations.
Total education and related expenditures expenditures over a three-year period were divided by total
reported FTe enrollment over the same period. Graduate FTe was counted twice, a double-weighting
that reflects the findings of the SHEEO (State Higher Education Executive Officers) Four-State Cost Study
(Conger, Bell, & Stanley, 2010).
Assignment of expenditures to Students
A total cost was assigned to students in the BPS survey based on their estimated FTe enrollment
multiplied by the expenditure per FTe at the institution or institutions they attended. Where students
attended multiple institutions, the expenditure per FTe was averaged across all institutions attended.

22 | Delta Cost Project
PRoJeCT PARTICIPANTS
Delta Cost Project Staff and ConsultantsJane Wellman, executive director
Donna Desrochers, deputy director
Colleen Lenihan, research analyst
Debby Friedman, administrative director
Patricia Steele, Higher ed Insight
Nate Johnson, Postsecondary Analytics
Steering CommitteeTony Carnevale, Georgetown Center on education and the Workforce
Tom Dawson, Bill & Melinda Gates Foundation
Kevin Dougherty, Teachers College, Columbia University
Jennifer engle, education Trust
Peter ewell, National Center for Higher education Management Systems
Aimee Guidera, Data Quality Campaign
Jan Ignash, Washington State Higher education Coordinating Board
Stan Jones, Complete College America
Patrick Kelly, National Center for Higher education Management Systems
Rebecca Martin, University of Wisconsin-System Administration
Kay McClenney, Community College Survey of Student engagement
Raymund Paredes, Texas Higher education Coordinating Board
Rich Petrick, ohio Board of Regents
Nan Poppe, Completion by Design
Mark Schneider, American Institutes for Research

The Institutional Costs of Student Attrition | 23
North CarolinaCherry Callahan, vice chancellor, Student Affairs, University of North Carolina-Greensboro
Lewis Carson, associate director, Institutional Research, North Carolina State University
Karrie Dixon, associate vice president, Academic and Student Affairs, University of North Carolina-General Administration
Diana Haywood, director, Data Administration, University of North Carolina- General Administration
Karen Helm, director, Institutional Research, North Carolina State University
Bruce Mallette, vice president, Academic and Student Affairs, University of North Carolina- General Administration
Cindy Wallace, vice chancellor, Student Development, Appalachian State University
van Wilson, associate vice president, Student Learning and Success, North Carolina Community College System
xiaoyun Yang, director, Policy Analysis and Accountability, University of North Carolina- General Administration
Texas Gary Hanson, consultant, Texas Higher education Coordinating Board
Lee Holcombe, director, Higher education Policy Institute, Texas Higher education Coordinating Board
Jim Pinkard, program director, Finance, Texas Higher education Coordinating Board
ohioDarrell Glenn, director, Data Management & Analysis, ohio Board of Regents
WashingtonMelissa Beard, education Research and Data Center
Rick Heggie, fiscal policy analyst, Higher education Coordinating Board
Jan Ignash, deputy director, Policy, Planning and Research, Higher education Coordinating Board
Jim Reed, policy and planning coordinator, Higher education Coordinating Board
Christy england Siegerdt, associate director, Research, Higher education Coordinating Board

24 | Delta Cost Project
ReFeReNCeS Adelman, C. (2006). The toolbox revisited: Paths to degree completion from high school through college.
Washington, DC: U.S. Department of education. Retrieved from http://www2.ed.gov/rschstat/research/pubs/toolboxrevisit/toolbox.pdf
Armacost, R. L., Archer, S., Pet-Armacost, J., & Grey, J. (2006). Using Markov chains to assess enrollment policies. Presentation given at the annual forum of the Association for Institutional Research, orlando, FL.
Conger, S.B., Bell, A., & Stanley, J. (2010). State Higher Education Executive Officers Four-State Cost Study. Boulder, Co: SHeeo.
Donhardt, G. L. (1995). Tracking student enrollments using the Markov chain comprehensive tool for enrollment management. Journal of College Student Development, 36(5), 457–462.
Ohio Board of Regents. (2006). Costs and consequences of remedial course education. Columbus, oH: Author.
Porter, S. (2011). Do college student surveys have any validity? Review of Higher Education, 35, 45–76.
Schneider, M. (2010). Finishing the first lap: The cost of first-year student attrition in America’s four-year colleges and universities. Washington, DC: American Institutes for Research. Retrieved from http://www.air.org/files/AIR_Schneider_Finishing_the_First_Lap_oct10.pdf
Schneider, M., & Lin, Y. (2011). The high cost of low graduation rates: How much does dropping out of college really cost? Washington, DC: American Institutes for Research. Retrieved from http://www.air.org/focus-area/education/index.cfm?fa=viewContent&content_id=1404
University of North Carolina. (2010). The University of North Carolina credit hour enrollment change funding model [User manual]. Chapel Hill, NC: Author.

Copyright © 2012 American Institutes for Research. All rights reserved. 2582_08/12
1000 Thomas Jefferson Street, NWWashington, DC 20007-3835202.403.5000 | 800.356.2735
About American Institutes for ResearchEstablished in 1946, with headquarters in Washington, D.C., and
offices across the country, American Institutes for Research (AIR) is
an independent, nonpartisan, not-for-profit organization that conducts
behavioral and social science research, and delivers technical assistance
both domestically and internationally in the areas of health, education,
and workforce productivity. As one of the largest behavioral and social
science research organizations in the world, AIR is committed to
empowering communities and institutions with innovative solutions
to the most critical education, health, workforce, and international
development challenges.
AIR currently stands as a national leader in teaching and learning
improvement, providing the research, assessment, evaluation, and
technical assistance to ensure that all students—particularly those
facing historical disadvantages—have access to a high-quality,
effective education. For more information about American Institutes
for Research, visit www.air.org.
About the Delta Cost ProjectThe Delta Cost Project at American Institutes for Research provides
data and tools to help higher education administrators and
policymakers improve college affordability by controlling institutional
costs and increasing productivity. The work is animated by the belief
that college costs can be contained without sacrificing access or
educational quality through better use of data to inform strategic
decision making. For more information about the Delta Cost Project,
visit www.deltacostproject.org.