Embed Size (px)
Citation preview

OECD EMPLOYMENT OUTLOOK – ISBN 92-64-19778-8 – ©2002
Chapter 4
The ins and outs of long-term unemployment
Efforts to reduce the duration of unemployment spells should be a key element instrategies to reduce overall unemployment. There is some evidence that the long-termunemployed are relatively more likely to become very-long-term unemployed in somecountries, while they are more likely to exit the labour force in others. In Europeancountries, the shares of prime-aged males in long-term unemployment and in potentially-avoidable disability and early retirement appear to be similar.
A special analysis of longitudinal data for European countries is used here toexamine the role of recurrent unemployment and explore alternative measures of long-term unemployment. Conventional measures understate the extent of long-termunemployment insofar as many short-term unemployed will go on to accumulate12 months or more of unemployment before their spell ends. Multiple spells ofunemployment are common, but in many of the countries considered secondary spells ofunemployment do not add many unemployment-months to the total experienced over afour-year period.
A second section examines issues of timing in the design of active labour marketpolicies. Should interventions intensify as the duration of unemployment spells increases,or should policy concentrate on preventing long-term unemployment before it arises? Are“profiling” procedures, for the early identification of individuals who need intensiveassistance, effective? Do the minimum contribution and maximum benefit periods inunemployment insurance systems encourage cycling between benefits and short-termemployment? When programmes are targeted on the long-term unemployed, how do theauthorities define long-term unemployment? Can very-long-term unemployment orcycling between benefits and labour market programmes be reduced by creatingpermanent jobs for the most disadvantaged unemployed? References to national practicesand experiences in this chapter illustrate and to some extent answer these questions.
INTRODUCTION......................................................................................................................................... 189
MAIN FINDINGS......................................................................................................................................... 189
1. ANALYSIS ............................................................................................................................................. 191
2. ACTIVE LABOUR MARKET POLICIES AND LONG-TERM UNEMPLOYMENT ....................... 210
CONCLUSIONS ........................................................................................................................................... 226
Annex 4.A. Data for the Main Labour Status variable in Table 4.2............................................................. 232Annex 4.B. Labour market transitions in European Community Household Panel data ............................. 233Annex 4.C. The use of statistical profiling techniques in OECD Member countries .................................. 235
BIBLIOGRAPHY ......................................................................................................................................... 239

OECD EMPLOYMENT OUTLOOK – ISBN 92-64-19778-8 – ©2002
– The ins and outs of long-term unemployment188
List of Boxes
4.1. The change in life satisfaction of the unemployed in a number of different countries...................... 208
List of Tables
4.1. Long-term unemployment and joblessness, European Union, 2000 ................................................. 1954.2. Long-term unemployment and Main Labour Status categories, 2000............................................... 1974.3. The incidence of long-term unemployment and the mean duration
of unemployment spells measured over four alternative reference periods, 1994-97 ....................... 2014.4. Single and multiple spells leading to long-term unemployment in 1994-97, by gender and age...... 2024.5. Distribution of individuals by total months of unemployment, 1994-97, by gender and age ........... 2044.6. Exits from unemployment followed by re-entry to unemployment within a year............................. 2054.7. Labour market status in 1996 and 1997 following long-term unemployment, by gender and age ... 2064.8. Labour market status in 1996 and 1997 following short-term unemployment,
by previous experience of unemployment ......................................................................................... 2074.9. Changes in life satisfaction related to changes in labour force status................................................ 2094.10. Minimum UI contribution periods and entitlement duration ............................................................. 2194.11. Treatment of breaks in unemployment in determining active labour market policy interventions ... 2214.B.1. Relative frequency of end-year starts and terminations of long-term unemployment
spells in ECHP data ........................................................................................................................... 2334.B.2. Average unemployment rate and incidence of long-term unemployment
in ECHP data compared with Labour Force Survey data .................................................................. 2344.C.1. Statistical profiling techniques in Member countries ........................................................................ 235
List of Charts
4.1. Long-term unemployment and unemployment rate, 2000................................................................. 1924.2. Changes in long-term unemployment and unemployment rate, 1990-2000...................................... 1934.3. Transition into long-term unemployment, 1984-2000....................................................................... 1934.4. Long-term unemployment compared with long-term joblessness, 2000........................................... 1944.5. Proportions of long-term unemployed who have been without employment
for two years or more, 2000. .............................................................................................................. 196

OECD EMPLOYMENT OUTLOOK – ISBN 92-64-19778-8 – ©2002
Introduction
A high proportion of long-term unemployment in total unemployment indicates that theburden of unemployment is concentrated on a relatively small number of people, who often areat risk of permanent detachment from the labour market. To the extent that the long-termunemployed are partially detached from the labour market, unemployment becomes a poorindicator of effective labour supply, and macroeconomic adjustment mechanisms – such asdownward pressure on wages and inflation when unemployment is high – will then not operateeffectively to bring unemployment down. The rise in unemployment seen in Europe in recentdecades does not seem to be due primarily to an increase in the numbers of people enteringunemployment, for example after losing a job, but rather to increased difficulties in findingwork once unemployed.1 Such observations suggest that efforts to reduce the duration ofunemployment spells should be a key element in strategies to reduce unemployment.
On average about 30% of unemployed people in OECD countries were long-termunemployed (i.e. had been unemployed for 12 months or more) in 2000. In ten countries,the proportions were over 40%. These are high proportions by historical standards, espe-cially after a long period of expansion. Moreover, this chapter documents that in EU coun-tries a large proportion of people who are classified as short-term unemployed inconventional statistics nevertheless experience 12 months of unemployment in total over atwo- to four-year period. There is also concern that figures would be higher still if hiddenunemployment among those classified as “early retired”, “permanently disabled” or sim-ply “out of the labour market” were taken into account.
The first main section of this chapter reviews the progress made in reducing long-term unemployment during the recent expansion. It compares long-term unemploymentwith specific inactive statuses, including permanent disablement and early retirement, anda broad concept of “long-term joblessness”. A special analysis of average life satisfactiondata shows that the long-term unemployed report very similar life satisfaction to the short-term unemployed, while transitions from unemployment into inactivity increase life sat-isfaction. Longitudinal data for unemployment month by month over a 48-month periodare used to explore alternative measures of the concentration of unemployment amongindividuals, the duration of unemployment spells, repeat unemployment, and relationshipsbetween individual labour market history and later labour market outcomes.
The second main section of the chapter focuses on issues of timing that arise in thedesign of active labour market policy and unemployment benefits. This section includesinformation from special surveys of how Member countries currently use profiling tech-niques and how the duration of unemployment spells is defined administratively for pur-poses of targeting labour market programmes on the long-term unemployed.
Main findings
• In cross-country comparison, the incidence of long-term unemployment – the pro-portion of all people unemployed who have been unemployed for a year or more –is positively correlated with the overall unemployment rate. Repeat unemployment– a situation where unemployed people have often experienced other spells of

OECD EMPLOYMENT OUTLOOK – ISBN 92-64-19778-8 – ©2002
– The ins and outs of long-term unemployment190
unemployment in recent years – may be seen as the second proximate cause of highunemployment: it appears to be particularly common in a few countries whereunemployment is mainly short-term and yet the overall unemployment rate remainsrelatively high.
• Even among prime-age males, in European countries slightly more people are inac-tive than unemployed. The numbers in “potentially-avoidable” disability and earlyretirement are similar to numbers in long-term unemployment on average, but thereis much variation across countries. The pattern of cross-country variation is partlyconsistent with the hypothesis of substitution between disability, early retirementand long-term unemployment statuses.
• An analysis here of longitudinal data for eleven European countries over a four-year period in the mid-1990s shows that although many individuals experiencedonly short-term and non-repeated unemployment, these individuals accounted foronly a relatively small proportion of total months of unemployment. Among thosewho were short-term unemployed at a given point in time (December 1995) accord-ing to the conventional definition of duration, about 40% went on to experience 12 ormore months of unemployment by the time that their current spell had finished.About half of the remainder accumulated 12 months of unemployment in total, whenmonths spent in other spells of unemployment were also taken into account. So in theend, on average, five out of six people who were unemployed in December 1995 inthis sample experienced 12 months of unemployment over a four-year period.
• Very-long-term (four-year) spells of unemployment are relatively rare in many ofthe countries. The availability of very long-term unemployment benefits uninter-rupted by participation in labour market programmes in some countries couldexplain some of the main cross-country patterns seen for older workers, but not foryouth because very-long-term youth unemployment is common in several countriesof Southern Europe where they typically do not receive benefits.
• Some studies using cross-sectional data have found slightly higher life satisfactionamong the long-term unemployed than among the short-term unemployed. How-ever, a longitudinal analysis reported here finds no evidence that life satisfactionamong the long-term unemployed is higher than it was among the same individualsa year earlier. This suggests that the cross-section finding may well arise throughsample selection, in the sense that those who suffer most severely from unemploy-ment tend to leave that state more rapidly.
• Labour market policies can attempt to influence the incidence of long-term unem-ployed through “prevention” or “cure”. The emphasis to be given to each approachin an optimal strategy depends on a number of considerations: the degree to whichthe experience of unemployment in itself reduces the rate of exit from unemploy-ment (state dependence); the importance of individual differences affecting the rateof entry to long-term unemployment (heterogeneity and sorting); the characteristicsof the long-term unemployed (e.g. poor productivity or poor motivation); the phe-nomenon of “lock-in” when short-term unemployed people participate in long-termlabour market programmes; and the behavioural response of beneficiaries to reduc-tions in the replacement rate or programme participation requirements.
• The 1990s saw attempts at improving on some of the above trade-offs through “pro-filing”, which targets assistance on those short-term unemployed who are most at

OECD EMPLOYMENT OUTLOOK – ISBN 92-64-19778-8 – ©2002
The ins and outs of long-term unemployment – 191
risk of long-term unemployment, and strategies such as individual action planswhich make it possible to combine obligations with an individualised treatment ofproblems.
• Benefit systems create some incentives for repeat unemployment, particularly butnot solely when benefit entitlements are limited in duration and can be regainedafter a relatively short time back in work. Seasonal work and temporary layoffswith rehiring by the same employer are often involved in repeat unemployment.Detailed rules within the UI system can be used to limit the benefit coverage ofsuch entries to unemployment, when unemployment no longer has the character ofunpredictable risk.
• European longitudinal data suggest that the short-term unemployed with a substan-tial history of earlier unemployment are as much at risk of additional months ofunemployment as are the long-term unemployed. In many cases, national practicesallow people whose spell of unemployment has recently been briefly interrupted tobe treated as equivalent to the long-term unemployed, in determining eligibility forlabour market programmes. However, these practices are very varied and merit fur-ther research and reflection on the principles to be followed.
• Various “carousel effects” – mechanisms that generate repeated movements in andout of unemployment – have become important at particular times and in particularcountries. If UI entitlement arises automatically after the end of temporary con-tracts, a carousel effect can arise because UI claims are no longer restricted to situa-tions where the firm has an objective economic reason for layoffs. To avoid this, itmay be desirable to tighten UI entitlement rules applying to workers holding tem-porary jobs, or to restrict or tax the use of temporary contracts in situations wherethere is no objective need for them.
• Two others sources of “carousel effects” are the use of labour market programmes torenew entitlement to UI benefit, and the creation by local authorities of temporaryjobs that qualify social assistance beneficiaries for UI benefits. Although cyclingbetween open unemployment and programme participation could be stopped simplyby making one or the other state permanent, this may not in itself be a better outcome.Repeated cycling should be interpreted as a form of long-term unemployment, callingfor interventions that depend on the considerations listed above.
1. Analysis
A. The extent of long-term unemployment
According to the conventional definition of the long-term unemployed as those whohave been continuously unemployed for at least one year, long-term unemployment rep-resented around 30% of total unemployment in OECD countries in 2000. This proportionvaries widely from country to country. In 2000, it was over 50% in Italy, Greece, Belgium,Ireland, the Slovak Republic and Germany, but under 20% in New Zealand, Iceland,Canada, the United States, Norway, Korea and Mexico (Chart 4.1). As pointed out byKarr (1997), these percentages are much lower than the percentages of individuals in thecurrent stock of unemployed whose current spell will last for over a year in total.2 At thesame time, they are higher than the percentage of all entries to unemployment that repre-sent the start of a long-term spell.

OECD EMPLOYMENT OUTLOOK – ISBN 92-64-19778-8 – ©2002
– The ins and outs of long-term unemployment192
Changes in the incidence of long-term unemployment (i.e. long-term unemploymentas a percentage of total unemployment) over the 1990s3 were positively correlated acrosscountries with changes in total unemployment (Chart 4.2). Ireland and Hungary were thetwo main outliers on this scatter diagram, experiencing changes in long-term unemploy-ment that were less favourable than could be expected given the change in total unem-ployment. Although there was almost no fall in the average incidence of long-termunemployment during the 1990s, the average incidence in the 1990s was somewhat lowerthan in the 1980s. Related to this, rates of transition from short-term into long-term unem-ployment have tended to fall since the 1980s (Chart 4.3).
B. Long-term unemployment and long-term joblessness
There has always been concern that unemployment statistics fail to record signif-icant numbers of people who want to work but are excluded from the standard interna-tional definition of unemployment, which generally requires an act of job search within
Chart 4.1. Long-term unemployment and unemployment rate, 2000Percentages
a) OECD: unweighted average of the countries shown.Source: OECD database on labour force and unemployment duration.
0 7010 20 30 40 50 60%
Italy
Greece
Belgium
Ireland
Slovak Republic
Germany
Czech Republic
Hungary
Portugal
Spain
France
Poland
Netherlands
OECDa
Sweden
Switzerland
Austria
United Kingdom
Australia
Japan
Finland
Luxembourg
Turkey
Denmark
New Zealand
Iceland
Canada
United States
Norway
Korea
Mexico
Share of long-term unemployment in total unemployment
Unemployment rate

OECD EMPLOYMENT OUTLOOK – ISBN 92-64-19778-8 – ©2002
The ins and outs of long-term unemployment – 193
the last four weeks. Among the categories not counted as unemployed are those who arenot looking for work because they believe no work is available for them (the so-called“discouraged workers”). One possible broader statistical concept is “long-term jobless-ness”. In this sub-section, the long-term jobless are defined as working-age people who
Chart 4.2. Changes in long-term unemployment and unemployment rate, 1990-2000In percentage points
Source: OECD database on labour force and unemployment duration.
40
-30
30
20
10
0
-10
-20
-12
40
-30
30
20
10
0
-10
-20
-10 -8 -6 -4 -2 0 2 4 6 8
Hungary
Czech Republic
FinlandSwedenSwitzerland
JapanGreece
United Kingdom
GermanyPoland
France
Italy
Portugal
Luxembourg
Belgium
Norway
IcelandAustralia
SpainDenmark
New ZealandUnited States
Canada
Ireland
Netherlands
Turkey
Change in the share of long-term unemployment in total unemployment
Change in unemployment rate
Korea
40
-30
30
20
10
0
-10
-20
-12
40
-30
30
20
10
0
-10
-20
-10 -8 -6 -4 -2 0 2 4 6 8
Hungary
Czech Republic
FinlandSwedenSwitzerland
JapanGreece
United Kingdom
GermanyPoland
France
Italy
Portugal
Luxembourg
Belgium
Norway
IcelandAustralia
SpainDenmark
New ZealandUnited States
Canada
Ireland
Netherlands
Turkey
Change in the share of long-term unemployment in total unemployment
Change in unemployment rate
Korea
Chart 4.3. Transition into long-term unemployment,a 1984-2000Population aged 15 to 64
Percentages
a) The average probability of passing from unemployment of under one year to long-term unemployment. This is measured as the ratio ofpersons unemployed for 12 to 23 months in the year in question to persons who had been unemployed for less than 12 months the yearbeforehand, in per cent.
Source: OECD calculations using data supplied by Eurostat from the European Union Labour Force Survey.
% %
1984 1985 1986 1987 1988 1989 1990 1991 1992 1993 1994 1995 1996 1997 1998 1999 20000
90
80
70
60
50
40
30
20
10
0
90
80
70
60
50
40
30
20
10
GermanyBelgium
Greece
Denmark
Italy
France
United kingdom
% %
1984 1985 1986 1987 1988 1989 1990 1991 1992 1993 1994 1995 1996 1997 1998 1999 20000
90
80
70
60
50
40
30
20
10
0
90
80
70
60
50
40
30
20
10
GermanyBelgium
Greece
Denmark
Italy
France
United kingdom
% %
1984 1985 1986 1987 1988 1989 1990 1991 1992 1993 1994 1995 1996 1997 1998 1999 20000
90
80
70
60
50
40
30
20
10
0
90
80
70
60
50
40
30
20
10
GermanyBelgium
Greece
Denmark
Italy
France
United kingdom

OECD EMPLOYMENT OUTLOOK – ISBN 92-64-19778-8 – ©2002
– The ins and outs of long-term unemployment194
were not in employment at the time of the interview and have not worked within the lastone or two years. Naturally, since many of the “jobless” have not recently sought work,statistics for “joblessness” reflect a variety of factors and not only difficulty in findingwork.
Comparisons between long-term unemployment and long-term joblessness are perhapsmost telling for men aged 25-54, who are generally expected to be in employment unlessthere are special circumstances, such as disablement or extended education. Chart 4.4shows that long-term joblessness, of one and two years’ duration, is a considerably higher
Chart 4.4. Long-term unemployment compared with long-term joblessness, 2000Percentage of men aged 25 to 54
Source: As for Table 4.2, and for Canada advice from national authorities based on the Public Microdata file of the 2000 Labour Force Survey.
0 205 10 15
0 205 10 15
%
%
Unemployed over one year
Unemployed over two years
United KingdomPortugal
Spain
LuxembourgSwitzerland
France
Netherlands
Poland
Austria
Denmark
Italy
Hungary
GreeceGermany
FinlandEuropean Union
Czech Republic
Belgium
Jobless over two years (including never employed)
Luxembourg
Netherlands
United Kingdom
France
Germany
ItalyPoland
BelgiumGreece
Spain
Czech RepublicHungaryFinland
European Union
AustriaPortugal
Switzerland
Denmark
Jobless over one year (including never employed)
Canada
Canada
0 205 10 15
0 205 10 15
%
%
Unemployed over one year
Unemployed over two years
United KingdomPortugal
Spain
LuxembourgSwitzerland
France
Netherlands
Poland
Austria
Denmark
Italy
Hungary
GreeceGermany
FinlandEuropean Union
Czech Republic
Belgium
Jobless over two years (including never employed)
Luxembourg
Netherlands
United Kingdom
France
Germany
ItalyPoland
BelgiumGreece
Spain
Czech RepublicHungaryFinland
European Union
AustriaPortugal
Switzerland
Denmark
Jobless over one year (including never employed)
Canada
Canada

OECD EMPLOYMENT OUTLOOK – ISBN 92-64-19778-8 – ©2002
The ins and outs of long-term unemployment – 195
proportion of the male population aged 25-54 than is long-term unemployment of corre-sponding durations. While there is a positive correlation between the joblessness andunemployment measures, it is by no means close.
Figures for a wider range of population groups are provided in Table 4.1, whichrelates to the European Union as a whole. Men aged 25-54 have the lowest rates of job-lessness as would be expected. They also have the lowest rate of persons unemployed forat least two years. At ages 55 to 59, male non-employment is almost as high as at ages20 to 24 – when a quarter of the population is in education but not in the labour force(see Chapter 1). About 15% of women aged 55 to 59 report that they have never workedand a further 35% have not worked in the last two years.
Information on joblessness can also be used to show the proportion of the long-termunemployed who have no work experience in the last two years and, hence, might beexpected to find it particularly difficult to enter or re-enter employment (Chart 4.5). InAustria, Belgium, Canada,4 Germany and the United Kingdom, the figures are aroundtwo-thirds, or higher. The long-term unemployed are the least likely to have been joblessfor two years or more in Denmark, Norway and Sweden, but this may not indicate easieraccess to unsubsidised jobs. The jobs recorded in these data are not necessarily in the openlabour market and in these Nordic countries the long-term unemployed often enter alabour market programme of a job-creation nature before they have been out of work fortwo years.
Table 4.2 compares the numbers of long-term unemployed with the numbers invarious “non-active” states, defined by Eurostat in the “Main Labour Status” variable ofthe EU Labour Force Survey. The figures are only very roughly comparable internation-ally (see Annex 4.A). Restricting attention to men aged 25 to 54, and on average for thecountries for which the data are available, the long-term unemployed population issmaller than the numbers saying that they are permanently disabled (an average of 2.5%as against 3% of the population). In Nordic countries, the Netherlands and the UnitedKingdom, disability is two or more times as common as long-term unemployment. Inthis age group, the proportion saying that they have retired is relatively small, but is stillover half of the proportion that is in long-term unemployment. The international variation
Table 4.1. Long-term unemployment and joblessness,a European Union, 2000As a percentage of the total population in the age groups shown
a) Joblessness is defined as the absence of employment during the periods shown.Source: OECD calculations based on data supplied by Eurostat from the European Union Labour Force Survey.
Not employed Unemployed
Total
Of which:
Total
Of which:
Have not worked over the past year
Have not worked over the past two years
Unemployed for at least one year
Unemployed for at least two years
Men20-24 39.4 31.1 29.3 10.1 3.4 1.925-54 12.9 9.0 7.6 5.6 2.6 1.655-59 36.6 29.9 24.7 5.6 3.6 2.4
Women20-24 48.9 40.6 38.0 10.0 3.7 2.025-54 34.3 29.2 26.9 6.4 3.1 2.155-59 59.4 53.9 50.3 4.0 2.5 1.8

OECD EMPLOYMENT OUTLOOK – ISBN 92-64-19778-8 – ©2002
– The ins and outs of long-term unemployment196
suggests that effective policies might be able to limit early retirement to 0.5% and dis-ability to 2%, for this population. On this assumption, potentially-avoidable early retire-ment and disability are less frequent than unemployment, but about as frequent as long-term unemployment.
C. Repeat spells of unemployment and alternative measures of long-term unemployment
Recurrent unemployment spells and high rates of re-entry to unemployment amongindividuals who have found work can result in chronic unemployment even among indi-viduals who never become long-term unemployed. In countries such as Canada andFinland where total unemployment is much higher than would be expected on the basis ofthe long-term unemployment figures (see Chart 4.1), the short-term unemployment thatmakes up the bulk of total unemployment arises mostly in repeat spells (see below). Thereis not always a clear definitional distinction between recurrent unemployment and long-term unemployment: a person who is sick for a short time in the middle of a 23-monthspell of unemployment in principle may never have become long-term unemployed, butfew data sources reliably record such breaks in the unemployment spell. This section willlook in detail at alternative measures of unemployment duration, including some whichtake repeat spells into account.
Chart 4.5. Proportions of long-term unemployed who have been without employment for two years or more, 2000
Percentage of men aged 25 to 54
Source: OECD calculations based on data supplied by Eurostat from the European Union Labour Force Survey, and for Canada advice fromnational authorities based on the Public Microdata file of the 2000 Labour Force Survey.
0 8010 20 30 40 50 7060%
Sweden
Denmark
Norway
Czech Republic
Italy
Luxembourg
Spain
Finland
Hungary
Switzerland
France
Portugal
Greece
Netherlands
Poland
Germany
Austria
Belgium
Canada
United Kingdom
0 8010 20 30 40 50 7060%
Sweden
Denmark
Norway
Czech Republic
Italy
Luxembourg
Spain
Finland
Hungary
Switzerland
France
Portugal
Greece
Netherlands
Poland
Germany
Austria
Belgium
Canada
United Kingdom
0 8010 20 30 40 50 7060%
Sweden
Denmark
Norway
Czech Republic
Italy
Luxembourg
Spain
Finland
Hungary
Switzerland
France
Portugal
Greece
Netherlands
Poland
Germany
Austria
Belgium
Canada
United Kingdom

OECD EMPLOYMENT OUTLOOK – ISBN 92-64-19778-8 – ©2002
The ins and outs of long-term unemployment – 197
National studies of repeat spells of unemployment
National studies have used various types of statistics to document the significance ofrecurrent unemployment. Some of the findings are:
• In Canada, only 20% of unemployment insurance (UI) claims initiated in 1989were new claimants: the remaining 80% were made by people who had at least oneother claim since mid-1971. A “standard” male with one claim had a 61% chance ofclaiming again within the next five years, and after a second claim had a 69%chance of claiming again within the next five years (Corak, 1993).5
• Repeated circling between open unemployment and labour market measuresbecame a characteristic feature of the Finnish labour market in the 1990s. Of485 000 people who were unemployed or in measures in 1996, and who hadbecome unemployed for the first time more than two years earlier, 395 000(i.e. 81%) had been in unsubsidised employment for less than 25% of the previoustwo years (based on advice from national authorities).
• In France, in a sample of individuals with a low level of education, individuals whohad experienced unemployment or inactivity one to four years after leaving schoolwere 1.6 times more likely to experience unemployment in later years than thosewho had not experienced unemployment or inactivity in the same year. For thosewho experienced unemployment or inactivity three to six years after leaving school,
Table 4.2. Long-term unemployment and Main Labour Status categories, 2000Percentages of men aged 25 to 54
a) For definitions of the Main Labour Status categories, see Annex 4.A.b) 1999 instead of 2000.Source: OECD calculations based on data supplied by Eurostat from the European Union Labour Force Survey, 2000; and for Switzerland
data supplied by the Swiss Federal Statistical Office on the basis of the Swiss Labour Force Survey, 2000.
Main Labour StatusaLabourforcestatus
Carries out a job or
professionUnemployed
Pupil, student, further training,
unpaid work experience
In retirement or early retirement or has given up
business
Permanently disabled
Fulfilling domestic tasks
Other inactive person
Long-term unemployed
Austria 89.2 5.1 2.0 2.7 0.3 0.3 0.5 1.1Belgium 86.7 5.2 0.9 1.5 3.8 0.3 1.5 2.7Czech Republic 90.0 5.5 0.6 0.2 3.3 0.1 0.2 3.1Denmark 86.3 4.4 3.6 0.4 4.8 0.2 0.3 0.7Finland 83.3 8.1 2.8 0.3 5.0 0.1 0.4 2.4France 87.5 8.1 0.8 0.6 2.1 0.1 0.8 2.9Greece 87.6 7.0 0.8 1.8 2.0 0.0 0.8 3.0Hungary 78.5 9.3 0.6 5.8 3.8 0.3 1.7 2.9Iceland 95.2 0.7 2.0 0.0 1.5 0.0 0.6 0.1b
Ireland 87.7 6.6 1.1 0.6 3.1 0.6 0.5 3.2b
Italy 84.2 8.4 2.9 2.7 1.2 0.0 0.7 3.6Luxembourg 92.8 0.8 1.6 1.2 1.8 0.3 1.7 0.4Netherlands 90.5 1.6 2.0 0.1 3.3 0.8 1.8 0.6Norway 89.3 3.4 1.5 0.2 5.0 0.1 0.6 0.5Poland 77.5 10.8 0.5 1.3 6.8 0.2 2.8 4.8Portugal 89.6 4.4 1.1 2.2 1.1 0.0 1.6 1.2Slovak Republic 79.2 15.3 0.4 4.8 0.0 0.2 0.2 8.5Sweden 83.8 5.9 4.4 0.1 3.5 0.0 2.3 1.5Switzerland 95.2 1.5 1.1 1.2 .. 0.2 0.7 0.5United Kingdomb 87.1 5.0 0.7 0.2 4.8 1.0 1.1 2.0Unweighted average 86.6 6.1 1.6 1.4 3.0 0.2 1.0 2.5

OECD EMPLOYMENT OUTLOOK – ISBN 92-64-19778-8 – ©2002
– The ins and outs of long-term unemployment198
this ratio increased to 3.6. For those who took more than 17 months to find theirfirst job, the risk of experiencing repeat unemployment several years later was atleast twice the average. Allaire et al. (2000) conclude that although unemploymentshortly after leaving school is largely a chance phenomenon, unemployment at theend of the period more often indicates social exclusion and it can partly be pre-dicted from the length of the early spells of unemployment.
• In Italy, over 50% of individuals who claimed ordinary unemployment benefit withreduced requirements (based on a minimum of 78 days of work in the year) claimedthe same benefit one year later, and 25% claimed it five years later (1990-1998data, reported in MLPS, 2000).
• In New Zealand, among individuals who became unemployed in 1993, the “mostfortunate” quarter typically experienced only one spell and a total of nine weeks’unemployment over the period 1988 to 1997. The “least fortunate” quarter of theseindividuals typically experienced three spells and almost two and a half years ofunemployment. About half of male exits from unemployment were followed by thestart of another spell within a year (Gobbi and Rea, 2000).
• In Norway, in the period 1991 to 2000, 1.14 million people – over half the labourforce at a given point in time – were unemployed at least once. Over this period, 4%of the labour force had been unemployed more than 10 times and 3% for more thanthree years, in total (based on advice from national authorities).
• In Swedish data for 1982 to 1992, about 60% of individuals who received UI in oneyear also received it the next. Nearly 50% of all individuals with UI in a given yearwere at some point in a spell of at least four consecutive years with UI receipt(Ackum Agell et al., 1995).
• In the United Kingdom, 49% of all individuals who experienced claimant unem-ployment at some time over the five years 1992 to 1996 had more than one spell. InFebruary 1995, 36% of the current stock of claimants had been claiming continu-ously during the past year, but half of the remainder had claimed for more than oneyear in total over the past two years. From 1990 onwards, the rate of re-entry tounemployment within a year of the end of an unemployment spell was very close to50% irrespective of the duration of the preceding spell (Teasdale, 1998).6
• In US data for five states from 1979 to 1984, 60% of individuals who had claimedUI had claimed it only once. However, 70% of all benefit-years were accounted forby repeat users, and 42% were accounted for by individuals with a claim in at leastthree out of five possible years (Meyer and Rosenbaum, 1996).
Individuals who experience many spells of unemployment are often found to have alow average spell length,7 but this appears to be partly a statistical artefact arising in data setsrelating to a fixed time period (e.g. in data which cover only two years, by construction, nomultiple spells of long-term unemployment will be observed). OECD (1985, Chapter 6)remarked, in relation to Canadian data, that “When multiple spells are examined over aneven longer period (i.e. longer than two years), the negative relationship between numberand average length of spells all but disappears”. Thus in cross-section across individuals,rates of entry to unemployment while not-unemployed are not necessarily correlated withrates of exit from unemployment while unemployed. This does not preclude high levels ofcorrelation through time for a given individual such that, for example, some individuals arecontinuously at high risk of entering unemployment, others are continuously at high risk thatany spell experienced will be lengthy, and others again face neither, or both, risks.

OECD EMPLOYMENT OUTLOOK – ISBN 92-64-19778-8 – ©2002
The ins and outs of long-term unemployment – 199
Repeat unemployment is in fact much more common than it would be if unemploy-ment struck members of the workforce at random. One factor explaining this is seasonalunemployment. Gray and Sweetman (2001), using Canadian data for 1992 to 1997, dis-tinguished a number of patterns among 1996 Employment Insurance (EI) users:
• Relatively new entrant users (probably too young to have claimed every year) were11% of female and 13% of male users.
• Classic displaced users with just one claim (in 1996) were 14% of female and 10%of male users.
• Twice-unlucky users with claims in two years were 19% of female and 14% of maleusers.
• Strictly seasonal and mostly seasonal users, who claimed EI at least four out of thesix years within an 8-week window, were 17% of female and 15% of male users.
• Frequent and mostly frequent, but non-seasonal users who claimed EI in at leastfour of the six years, but for whom no pattern of seasonality was discerned, were15% of female and 22% of male users.
• Other frequent users who claimed in three of the six years were 20% of users.
• Perpetual users who had a claim active in over 90% of the six-year period (this canoccur when during claim periods, enough time is spent in employment to qualifyfor another claim immediately) were 4% of the female and 6% of the male users.
These findings suggest that users with a strictly seasonal pattern are a minority withinthe total of frequent users: frequent but irregular use of EI is more common. By contrastCEIC (2000), using different definitions, estimates that by 1999/2000 (following a sharp fallin non-seasonal frequent claims after 1995/96), 80% of all frequent claims were seasonal.
Temporary layoffs by employers are another cause of repeat (in some cases also seasonal)unemployment experiences. Corak (1995) reports for Canada that over 40% of claimants whomade at least five claims within a 14-year period supported their claims with employment fromthree or fewer different employers. Meyer and Rosenbaum (1996) similarly report for theUnited States that over 80% of all individuals with UI claims in three or more out of five yearshad been laid off by only one or two employers, and thus must have been recalled at least once.Temporary layoff unemployment can be defined as unemployment in spells which ended withthe unemployed person being rehired by the same employer. On this basis, temporary layoffshave been estimated to account for 45% of terminations of UI spells and 38% of UI weeks paidin Canada (late 1980s data in Corak, 1995), 32% of all terminations of unemployment spellsand 20% of total unemployment in Austria (late 1980s data), 50% of all unemployment spellsand 20% of total unemployment in Denmark (1981 to 1990 data), and 68% of unemploymentspells and 30% of total unemployment in manufacturing in the United States (1965 to 1976data, with some similar figures cited for 1979-80) (sources cited by Jensen and Svarer, 2001).In Germany, recalls accounted for about 17% of jobs started by benefit recipients and 11% ofbenefits were paid to workers who were later recalled (1980 to 1990 data) (Mavromaras andRudolph, 1998). In Norway, recall unemployment accounted for 32% of unemployment spellsand 13% of total unemployment (1989 to 1998 data) (Roed and Nordberg, 2001). In Sweden,45% of a sample of unemployed people who found work returned to a previous employer, andan estimated 10% of the unemployment stock consists of people on temporary layoff (datafrom a small survey, relating to 1995 and 1996) (Jansson, 2002).
Apart from seasonal unemployment and temporary layoffs – factors that are relatedto industry, occupation and employer behaviour – tendencies for unemployment experi-

OECD EMPLOYMENT OUTLOOK – ISBN 92-64-19778-8 – ©2002
– The ins and outs of long-term unemployment200
ences to be repeated could be due to heterogeneity in individual characteristics or to statedependence, i.e. so-called “scarring” whereby a first unlucky experience of unemploymentincreases the probability of further spells. Pedersen (1994) notes that low levels of educa-tional achievement are a very important influence on the amount of unemployment expe-rienced over a nine-year period by Danish youths: this is an example of an explanation interms of (observed) heterogeneity. Winter-Ebmer and Zweimuller (1992) find, using aprobit model for the probability of repeat unemployment after an unemployment spell inAustria in 1986, that the number of short-term (up to six-month) unemployment spells inthe three preceding years is the most significant explanatory variable and the duration ofthe 1986 unemployment episode (which enters with a positive coefficient) is the secondmost significant. They conclude that (even after allowing for seasonal work patterns,which are also important) the most prominent factor in explaining repeat unemployment ispast unemployment history, and they attribute this to state dependence effects.8
Repeat spells and alternative measures of long-term unemployment in the European Community Household Panel
Longitudinal data allow detailed analysis of unemployment durations, repeat spellsof unemployment and transitions between different labour market states. Tables 4.3 to 4.8here present various statistics – inspired by statistics used in the national studies citedabove – from the European Community Household Panel (ECHP) (including data fromGerman and UK national surveys, as described in Box 4.1). ECHP data suffer from strong“seam effects”, i.e. the tendency in survey-based longitudinal data for changes in reportedstatus to occur between the last month covered by one interview and the first month cov-ered by the next interview. In the ECHP, as described in Annex 4.B, interviewees reporttheir status month by month for the preceding calendar year and in half the countries themajority of all long-term spells of unemployment (those lasting 12 months or more) arereported to finish in December and/or commence in January. Tabulations here use a sam-ple that has been adjusted by putting higher weights on the records that report changes instatus in other months of the year. In the reweighted sample, the incidence of long-termunemployment is on average close to that reported in the EU Labour Force Survey. How-ever, some fairly large discrepancies arise for individual countries and it would be useful,wherever possible, to calculate the statistics in Tables 4.3 to 4.8 using alternative data sets.
International comparisons of “long-term unemployment” according to different definitions
Table 4.3, Panel A, shows the proportion of all individuals who were unemployed ata given point in time – December 1995 – who experienced 12 months or more of unem-ployment as measured over alternative reference periods. On average, 46% of unem-ployed people had already been unemployed for 12 or more months within their currentspell of unemployment: this is the conventional measure of the incidence of long-termunemployment. However about 40% of those with less than 12 months of unemploymentwent on to have a completed spell duration of 12 months or more: on this basis, nearly70% were long-term unemployed. Counting also unemployment that occurred in otherspells, nearly three out of four unemployed people had experienced 12 or more months ofunemployment in total over the two preceding years (1994 and 1995) and five out of sixexperienced 12 or more months of unemployment in total over the four years(1994 to 1997). The impact of using a longer reference period varies greatly betweencountries. Persons who were in a spell of less than 12 months (completed duration) inDecember 1995 nevertheless accumulated 12 months of unemployment over the four-year

OECD EMPLOYMENT OUTLOOK – ISBN 92-64-19778-8 – ©2002
The ins and outs of long-term unemployment – 201
period in two-thirds of the cases in France, Greece, and Spain, whereas in the UnitedKingdom this occurred in only one-fifth of the cases.
How much unemployment is “missed” if labour market policies focus only on individ-uals who are currently unemployed, with the aim of bringing the current spell of unemploy-ment to an end but without attention to the risk of later return to unemployment? Accordingto Table 4.3, on average only one-eighth of the unemployment-months experienced withinthe four-year window either side of December 1995 occurred outside the completed currentspell of unemployment. This proportion is necessarily low where the average duration ofcurrent spells is already very long: it is higher in Austria, France, Greece and Spain.
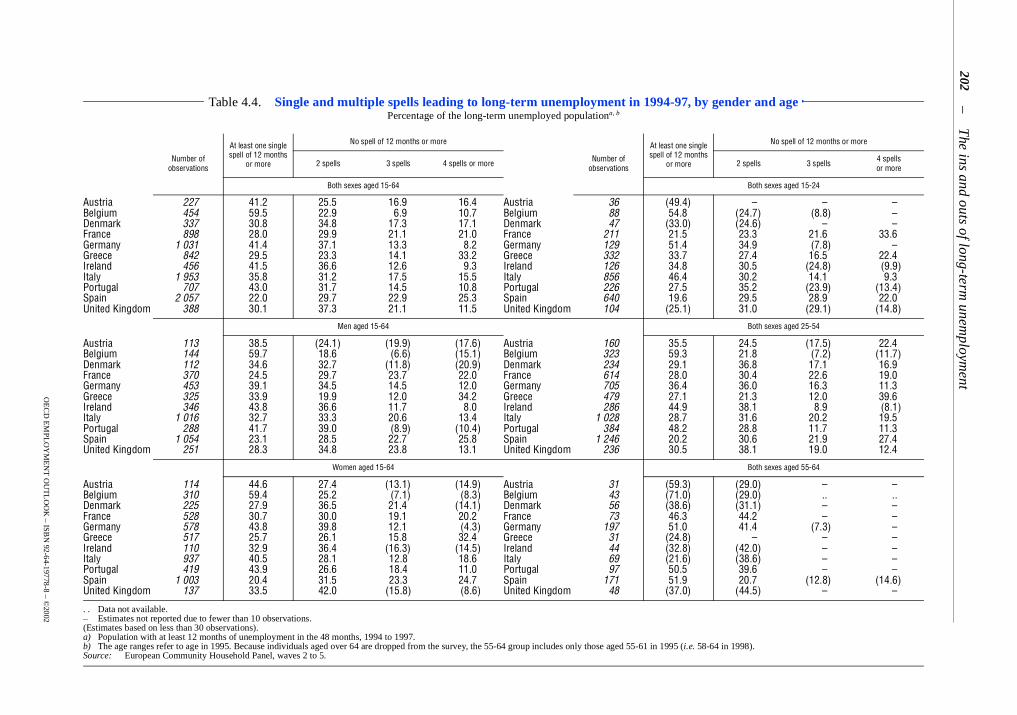
Repeat spells as a form of long-term unemployment
Table 4.4 reports the number of unemployment spells experienced by individualswho were unemployed for at least 12 months in total over the four years 1994 to 1997(these individuals appeared in the last column of Table 4.3 if they were unemployedin December 1995). In 10 of the 11 countries, only a minority of these “long-term
Table 4.3. The incidence of long-term unemployment and the mean duration of unemployment spells measured over four alternative reference periods, 1994-97
A. Percentage of all persons unemployed in December 1995 who experienced at least 12 months of unemployment as measured by:
B. Average months of unemployment experienced by persons unemployed in December 1995 as measured by:
ECHP: European Community Household Panel.a) Unweighted average of countries shown.Source: ECHP, waves 2 to 5.
Uncompleted duration of the current spell
Completed duration of the current spell
Total unemployment in the last 24 months
Total unemployment in the four years,
1994-97
Austria 23.0 47.3 55.2 68.0Belgium 67.4 82.2 87.2 91.6Denmark 47.1 67.1 68.8 78.6France 45.8 75.7 84.1 90.9Germany 47.0 75.7 77.6 86.6Greece 32.2 43.1 63.5 79.9Ireland 67.4 81.3 84.1 90.2Italy 54.2 71.4 80.8 88.4Portugal 36.8 67.4 69.3 76.0Spain 40.5 62.2 75.2 85.8United Kingdom 39.5 71.6 69.0 77.5ECHPa 45.5 67.7 74.1 83.0
Uncompleted duration of the current spell
Completed duration of the current spell
Total unemployment in the last 24 months
Total unemployment in the four years,
1994-97
Austria 7.4 17.0 9.5 20.0Belgium 16.6 34.2 17.6 35.8Denmark 12.0 24.4 14.3 27.0France 12.1 25.0 14.9 29.4Germany 12.5 25.5 14.0 27.7Greece 8.6 17.2 12.9 23.8Ireland 16.8 32.9 18.5 35.0Italy 14.1 27.7 16.8 32.1Portugal 10.5 21.1 12.2 22.9Spain 11.5 22.2 15.1 27.9United Kingdom 10.6 22.4 13.1 25.5ECHPa 12.1 24.5 14.4 27.9
OE
CD
EM
PL
OY
ME
NT
OU
TL
OO
K – IS
BN
92-64-19778-8 – ©2002
–T
he ins and outs of long-term unem
ployment
202
. . Data not available.– Estimates not reported due to fewer than 10 observations.(Estimates based on less than 30 observations).a) Population with at least 12 months of unemployment in the 48 months, 1994 to 1997.b) The age ranges refer to age in 1995. Because individuals aged over 64 are dropped from the survey, the 55-64 group includes only those aged 55-61 in 1995 (i.e. 58-64 in 1998).Source: European Community Household Panel, waves 2 to 5.
Number of observations
At least one single spell of 12 months
or more
No spell of 12 months or more
Number of observations
At least one single spell of 12 months
or more
No spell of 12 months or more
2 spells 3 spells 4 spells or more 2 spells 3 spells 4 spellsor more
Both sexes aged 15-64 Both sexes aged 15-24
Austria 227 41.2 25.5 16.9 16.4 Austria 36 (49.4) – – –Belgium 454 59.5 22.9 6.9 10.7 Belgium 88 54.8 (24.7) (8.8) –Denmark 337 30.8 34.8 17.3 17.1 Denmark 47 (33.0) (24.6) – –France 898 28.0 29.9 21.1 21.0 France 211 21.5 23.3 21.6 33.6Germany 1 031 41.4 37.1 13.3 8.2 Germany 129 51.4 34.9 (7.8) –Greece 842 29.5 23.3 14.1 33.2 Greece 332 33.7 27.4 16.5 22.4Ireland 456 41.5 36.6 12.6 9.3 Ireland 126 34.8 30.5 (24.8) (9.9)Italy 1 953 35.8 31.2 17.5 15.5 Italy 856 46.4 30.2 14.1 9.3Portugal 707 43.0 31.7 14.5 10.8 Portugal 226 27.5 35.2 (23.9) (13.4)Spain 2 057 22.0 29.7 22.9 25.3 Spain 640 19.6 29.5 28.9 22.0United Kingdom 388 30.1 37.3 21.1 11.5 United Kingdom 104 (25.1) 31.0 (29.1) (14.8)
Men aged 15-64 Both sexes aged 25-54
Austria 113 38.5 (24.1) (19.9) (17.6) Austria 160 35.5 24.5 (17.5) 22.4Belgium 144 59.7 18.6 (6.6) (15.1) Belgium 323 59.3 21.8 (7.2) (11.7)Denmark 112 34.6 32.7 (11.8) (20.9) Denmark 234 29.1 36.8 17.1 16.9France 370 24.5 29.7 23.7 22.0 France 614 28.0 30.4 22.6 19.0Germany 453 39.1 34.5 14.5 12.0 Germany 705 36.4 36.0 16.3 11.3Greece 325 33.9 19.9 12.0 34.2 Greece 479 27.1 21.3 12.0 39.6Ireland 346 43.8 36.6 11.7 8.0 Ireland 286 44.9 38.1 8.9 (8.1)Italy 1 016 32.7 33.3 20.6 13.4 Italy 1 028 28.7 31.6 20.2 19.5Portugal 288 41.7 39.0 (8.9) (10.4) Portugal 384 48.2 28.8 11.7 11.3Spain 1 054 23.1 28.5 22.7 25.8 Spain 1 246 20.2 30.6 21.9 27.4United Kingdom 251 28.3 34.8 23.8 13.1 United Kingdom 236 30.5 38.1 19.0 12.4
Women aged 15-64 Both sexes aged 55-64
Austria 114 44.6 27.4 (13.1) (14.9) Austria 31 (59.3) (29.0) – –Belgium 310 59.4 25.2 (7.1) (8.3) Belgium 43 (71.0) (29.0) .. ..Denmark 225 27.9 36.5 21.4 (14.1) Denmark 56 (38.6) (31.1) – –France 528 30.7 30.0 19.1 20.2 France 73 46.3 44.2 – –Germany 578 43.8 39.8 12.1 (4.3) Germany 197 51.0 41.4 (7.3) –Greece 517 25.7 26.1 15.8 32.4 Greece 31 (24.8) – – –Ireland 110 32.9 36.4 (16.3) (14.5) Ireland 44 (32.8) (42.0) – –Italy 937 40.5 28.1 12.8 18.6 Italy 69 (21.6) (38.6) – –Portugal 419 43.9 26.6 18.4 11.0 Portugal 97 50.5 39.6 – –Spain 1 003 20.4 31.5 23.3 24.7 Spain 171 51.9 20.7 (12.8) (14.6)United Kingdom 137 33.5 42.0 (15.8) (8.6) United Kingdom 48 (37.0) (44.5) – –
Table 4.4. Single and multiple spells leading to long-term unemployment in 1994-97, by gender and agePercentage of the long-term unemployed populationa, b

OECD EMPLOYMENT OUTLOOK – ISBN 92-64-19778-8 – ©2002
The ins and outs of long-term unemployment – 203
unemployed” had any one spell that lasted 12 continuous months (although truncation ofspell duration at the beginning and end of the observation window contributes to thisresult). Experiencing this type of “long-term unemployment” only through repeat spellswas common in Denmark, France, Greece, Spain and the United Kingdom. Youths do nothave more multiple spells than prime-age workers and older workers have relatively fewmultiple spells, but these observations need to be seen in the light of the fact that youthsand older workers often spent only part of these four years in the labour force.
The distribution of total months of unemployment
Table 4.5 shows the distribution of individuals with any unemployment by total monthsunemployed over the four years 1994-97. The top decile of this distribution (which repre-sents about 2% of the total population) in Ireland and Italy, and the top two deciles (about4% of the population) in Belgium experienced close to 48 months of unemployment. In allother countries the 90th percentile is below 38 months, indicating that continuous spells aslong as four years are rare. In some countries (e.g. Spain and Portugal) UI benefit exhaustionwould tend to produce this result. In others (Denmark and Germany) it may arise becausesome participation in labour market programmes would be obligatory for individuals whowould otherwise be entitled to four or more years of benefit.
On average, 39% of 15-24 year-olds, 22% of 25-54 year-olds, and only 10% of55-64 year-olds experienced unemployment at some time over the four years. Long spells aremore common for women than men in Belgium (where UI benefit is in some cases indefinitelycompatible with spousal earnings), and more common for men than women in the UnitedKingdom and Ireland (where long-term benefits are means-tested, and incompatible with spou-sal earnings or benefit income). Also, some cases of four years in almost-uninterrupted unem-ployment arise among older workers in contrast to prime-aged workers in France (whereindefinite-duration assistance benefits are more generous for older workers) and Spain (whereindefinite-duration assistance benefits are only available to older workers). These differencessuggest that benefit availability influences very-long-term unemployment, even in data whichare not in principle based on benefit recipiency status.9 However looking across countries atthe statistics for youths, an inverse relationship appears – Greece, Italy and Spain are amongthe four countries with the highest incidence of very-long-term youth unemployment, yet ben-efits are not generally available to unemployed youths in these countries.10
Calculations based on Table 4.5 suggest that nearly half of all months of unemploy-ment over four years are experienced by 5% of the population (mainly the individuals in thetop two deciles). This can be compared with the situation for any given month where (sinceabout 7% of the population are unemployed) half of the unemployment is experienced byabout 3.5% of the population. Thus unemployment over four years is less concentrated thanit is in a given month, but the difference is not very great. Comparing this table withTable 4.3, it is seen that on average less than half of the individuals with any unemploymentover the four-year period experienced 12 or more months of unemployment, whereas five-sixths of the individuals who were unemployed in December 1995 experienced 12 or moremonths of unemployment. This is because relatively few of the individuals who experiencedonly a few months of unemployment are included in the latter sample.
Risk of re-entering unemployment
Table 4.6 shows that about 40% of exits from unemployment were followed by re-entry to unemployment within a year. In Germany and Italy, re-entries to unemploymentare more frequent when the previous spell was short, possibly indicating an important

OE
CD
EM
PL
OY
ME
NT
OU
TL
OO
K – IS
BN
92-64-19778-8 – ©2002
–T
he ins and outs of long-term unem
ployment
204
a) The distribution includes only individuals with non-zero months.b) Percentage of the population having non-zero months of unemployment in the four years 1994 to 1997.Source: European Community Household Panel, waves 2 to 5.
Number of obser-vations
10% 20% 30% 40% 50% 60% 70% 80% 90%
Unem-ployment/ popula-
tion ratiob
Number of obser-vations
10% 20% 30% 40% 50% 60% 70% 80% 90%
Unem-ployment/ popula-
tion ratiob
Both sexes aged 15-64 Both sexes aged 15-24
Austria 641 1.0 2.1 3.2 4.6 6.7 8.5 11.6 15.6 21.9 16.5 Austria 169 0.7 1.5 2.6 4.0 6.0 7.7 9.5 12.9 17.4 25.6Belgium 730 1.4 2.8 5.3 8.3 13.1 19.0 29.5 44.7 47.4 21.7 Belgium 182 1.0 1.7 2.7 4.4 7.1 9.3 14.7 18.5 29.5 41.5Denmark 764 1.2 2.4 3.6 5.3 7.5 10.2 14.3 20.4 32.2 30.1 Denmark 155 0.5 1.2 2.1 2.5 2.9 4.5 6.0 10.7 24.7 41.7France 1 664 1.8 3.4 6.0 9.0 12.3 16.4 21.6 28.7 37.5 21.4 France 510 1.2 2.4 4.0 5.6 9.5 12.4 17.0 22.6 29.5 39.6Germany 2 009 1.2 2.6 4.8 7.8 10.6 14.6 19.8 26.3 32.8 21.8 Germany 391 0.5 1.0 2.0 3.4 5.0 7.8 10.7 16.3 28.2 33.7Greece 1 307 2.7 4.4 6.3 8.7 11.3 15.2 20.0 23.8 33.7 19.5 Greece 481 2.4 4.3 7.8 9.7 14.3 19.2 23.1 28.5 35.7 40.8Ireland 857 1.7 3.4 5.4 8.4 11.5 19.5 29.2 41.7 47.3 22.9 Ireland 302 1.2 1.9 3.3 4.6 6.2 10.9 15.8 25.4 38.1 39.5Italy 2 688 2.5 4.4 6.8 9.4 14.0 19.7 27.8 34.8 44.8 21.9 Italy 1 160 2.3 4.1 5.6 8.3 12.6 18.3 28.4 37.0 47.0 52.2Portugal 1 215 1.5 3.0 4.6 6.0 8.7 11.4 15.8 20.8 27.9 19.9 Portugal 439 1.3 2.5 4.2 5.7 8.2 10.3 12.5 16.8 20.7 31.0Spain 2 991 2.5 5.1 7.3 10.0 14.0 18.0 23.7 29.6 37.3 35.4 Spain 948 2.3 3.8 6.1 8.5 11.3 16.0 20.9 30.4 39.0 46.5United Kingdom 1 124 1.1 2.1 3.1 4.9 7.3 9.7 12.4 18.8 29.8 17.9 United Kingdom 318 1.1 2.0 3.0 4.7 6.9 8.8 11.9 15.9 26.7 33.6
Men aged 15-64 Both sexes aged 25-54
Austria 345 1.1 2.1 3.2 4.4 6.7 8.8 12.3 15.8 25.4 17.9 Austria 418 1.2 2.2 3.3 4.5 6.7 8.4 11.4 15.6 23.8 16.6Belgium 278 1.2 2.4 3.7 5.9 8.2 13.1 22.1 35.1 47.4 20.0 Belgium 496 1.7 3.8 7.0 11.1 16.0 24.7 35.9 47.0 47.5 21.2Denmark 317 1.0 2.4 3.8 5.2 7.2 9.8 13.3 20.2 38.4 26.8 Denmark 528 1.5 3.0 4.1 6.3 8.1 11.0 15.2 20.9 34.4 30.2France 763 1.6 3.0 4.9 8.1 10.6 14.4 20.1 28.1 36.3 21.0 France 1 052 2.2 4.1 7.4 9.8 13.3 17.5 22.4 29.7 37.4 20.3Germany 1 022 0.8 2.2 3.9 6.7 9.6 13.5 19.9 25.8 32.5 23.7 Germany 1 347 1.4 2.8 5.2 8.3 10.9 14.7 20.1 26.1 32.9 21.5Greece 589 2.4 3.7 5.2 7.0 9.6 12.7 17.2 22.1 29.6 19.9 Greece 761 2.9 4.5 6.0 8.5 10.5 13.8 17.7 22.4 32.0 18.8Ireland 560 2.3 4.5 8.1 12.2 20.6 29.5 39.4 47.1 47.5 30.6 Ireland 494 2.4 4.7 7.4 9.9 14.6 24.6 36.7 47.0 47.5 21.2Italy 1 408 2.5 4.8 7.5 10.5 16.9 22.8 31.0 39.0 47.0 24.7 Italy 1 436 2.5 5.0 7.8 10.1 14.9 20.7 27.9 33.5 44.2 18.6Portugal 568 1.2 2.6 3.8 5.4 6.7 9.6 13.0 19.0 26.7 20.5 Portugal 654 1.5 3.1 4.7 5.9 8.7 11.6 15.9 22.7 28.9 19.1Spain 1 605 2.4 4.9 7.2 10.2 14.0 17.7 23.2 30.2 37.4 40.5 Spain 1 808 2.6 5.3 7.8 10.7 15.1 19.4 24.2 29.3 36.4 37.5United Kingdom 622 1.2 2.2 3.5 5.4 8.2 11.2 15.4 24.1 35.3 22.0 United Kingdom 694 1.0 2.0 3.0 4.8 6.8 9.5 12.3 19.0 30.2 16.0
Women aged 15-64 Both sexes aged 55-64
Austria 296 1.0 2.1 3.3 4.7 6.7 8.3 11.1 14.5 18.8 15.1 Austria 54 2.2 3.7 5.4 11.1 13.8 15.5 18.2 21.7 29.8 6.4Belgium 452 1.5 4.0 7.5 12.5 17.4 27.3 37.5 45.7 47.5 23.3 Belgium 52 1.8 5.6 22.1 23.8 43.9 47.2 47.4 47.6 47.8 7.9Denmark 447 1.4 2.4 3.6 5.4 7.7 10.6 15.2 20.5 29.5 33.6 Denmark 81 3.3 5.9 8.3 9.9 12.3 15.2 17.6 23.7 35.9 18.6France 901 2.0 4.1 7.7 10.6 14.1 18.4 22.8 29.1 38.3 21.7 France 102 1.7 5.1 8.7 15.3 21.7 28.5 34.9 42.0 47.3 8.9Germany 987 1.7 3.5 5.9 8.7 11.9 15.3 19.6 26.6 33.3 19.9 Germany 271 3.9 6.2 10.9 13.9 17.1 23.3 27.2 31.1 39.7 16.0Greece 718 3.3 5.5 7.9 9.7 13.4 17.5 21.9 28.0 38.9 19.1 Greece 65 2.2 3.2 4.5 5.5 6.6 9.7 16.3 23.1 27.7 5.0Ireland 297 1.2 2.1 3.6 5.1 6.3 8.7 11.2 16.5 29.3 15.5 Ireland 61 2.8 7.0 12.3 16.8 23.8 31.3 34.7 45.5 47.4 9.2Italy 1 280 2.4 4.2 5.9 8.4 11.2 16.6 22.3 29.3 43.1 19.1 Italy 92 3.6 5.1 6.2 8.2 11.6 13.5 19.4 23.4 32.7 3.4Portugal 647 1.8 3.6 5.2 8.2 10.5 14.0 18.5 22.8 28.9 19.3 Portugal 122 2.6 3.9 7.7 11.3 18.0 23.2 27.3 34.2 43.0 9.4Spain 1 386 2.7 5.3 7.3 9.7 13.9 18.6 24.0 28.6 37.2 30.0 Spain 235 3.9 5.6 8.0 10.2 13.7 17.6 22.6 31.3 47.3 13.4United Kingdom 502 0.9 1.9 2.7 4.3 6.2 8.6 10.7 13.0 20.2 14.4 United Kingdom 112 1.6 2.6 4.1 7.8 9.7 11.6 14.5 21.6 32.6 12.9
Table 4.5. Distribution of individualsa by total months of unemployment, 1994-97, by gender and agePercentile break points in the distribution

OECD EMPLOYMENT OUTLOOK – ISBN 92-64-19778-8 – ©2002
The ins and outs of long-term unemployment – 205
high-turnover (e.g. seasonal) component in unemployment. In Ireland re-entry rates arehigher following long spells of unemployment, suggesting that exits from long-termunemployment are quite often only brief interruptions of the unemployment spell.
Future prospects for long-term unemployed people
People who were unemployed throughout 1995 spent on average slightly over half ofthe next two years in unemployment, a third in employment and slightly below a sixth outof the labour market (Table 4.7). This table shows a trade-off between inactivity and very-long-term unemployment: the three countries with the highest rates of continuing unem-ployment, Belgium, Ireland and Italy, which are also the countries where the top decile ofthe distribution experienced four years of uninterrupted unemployment (see Table 4.5),have among the lowest rates of transition to labour market inactivity. The apparent trade-off suggests that despite efforts at the international harmonisation of statistics, nationalidiosyncrasies (no doubt reflecting substantive factors, e.g. ease of access to differenttypes of income support) in the classification of people who have only tenuous links withthe labour market remain very important.
A transition to inactivity, rather than employment, is much more frequent for olderworkers. Re-entries to employment by older long-term unemployed workers appear to beextremely rare in some countries, although the small sample sizes involved in this caseshould be kept in mind.
Predicting future unemployment
Table 4.8 shows that labour market outcomes over the two following years are betterfor individuals who are short-term unemployed with less than 6 months of other recent
Table 4.6. Exits from unemployment followed by re-entry to unemployment within a year
Percentage returning to unemployment within a year following an exita
ECHP: European Community Household Panel.– Estimates not reported due to fewer than 10 observations.(Estimates based on less than 30 observations).a) Exits from unemployment between January 1995 and December 1996 only: in case of multiple spells only the exit closest to
December 1996 has been taken into account.b) Unweighted average of countries shown.Source: ECHP, waves 2 to 5.
Exits following an unemployment spell of duration of:All exits
Less than 6 months 6 to 11 months 12 months or more
Number of observations % Number of
observations % Number of observations % Number of
observations %
Austria 81 45.5 14 (40.9) 16 (47.7) 111 45.1Belgium 33 52.8 8 – 18 (45.5) 59 48.6Denmark 44 30.3 15 (29.1) 24 (26.0) 83 29.0France 137 48.6 41 40.2 70 41.4 248 45.0Germany 84 41.1 36 40.6 55 32.0 175 37.6Greece 82 49.2 77 62.7 47 41.8 206 52.2Ireland 43 34.3 18 (27.1) 31 53.1 92 38.6Italy 119 52.1 60 52.4 82 36.1 261 47.8Portugal 46 19.8 27 (39.3) 35 19.6 108 23.5Spain 206 53.8 118 53.5 105 45.5 429 51.6United Kingdom 55 32.8 25 (29.9) 30 30.4 110 31.5ECHP averageb 930 41.9 439 41.2 513 38.1 1 882 41.0

OE
CD
EM
PL
OY
ME
NT
OU
TL
OO
K – IS
BN
92-64-19778-8 – ©2002
–T
he ins and outs of long-term unem
ployment
206
– Estimates not reported due to fewer than 10 observations.(Estimates based on less than 30 observations).a) Equivalently people who were unemployed in every month of 1995.Source: European Community Household Panel, waves 2 to 5.
Average months per year in each status in 1996 and 1997 Average months per year in each status in 1996 and 1997
Number of observations
Average duration of unemployment (months)
Average duration of employment (months)
Average duration out of labour force (months) Number
of observations
Average duration of unemployment (months)
Average duration of employment (months)
Average duration out of labour force (months)
Both sexes aged 15-64 Both sexes aged 15-24
Austria 67 6.4 2.7 3.0 Austria 5 – – –Belgium 268 9.1 1.8 1.1 Belgium 29 (9.0) (1.8) (1.2)Denmark 180 5.4 4.4 2.1 Denmark 22 (7.5) (4.1) (0.4)France 488 6.0 4.3 1.7 France 79 5.7 5.5 0.8Germany 497 5.2 3.5 3.1 Germany 52 3.9 4.8 2.5Greece 354 6.1 4.9 0.8 Greece 152 6.5 4.5 1.0Ireland 268 8.1 3.2 0.6 Ireland 68 6.0 4.3 1.7Italy 891 7.4 4.2 0.4 Italy 384 8.4 3.2 0.4Portugal 272 4.6 6.0 1.5 Portugal 71 3.2 8.3 0.6Spain 855 6.0 5.2 0.8 Spain 261 6.6 4.8 0.5United Kingdom 228 5.2 4.2 2.6 United Kingdom 62 5.4 4.8 1.8
Men aged 15-64 Both sexes aged 25-54
Austria 33 7.1 2.0 2.9 Austria 46 6.7 3.4 1.9Belgium 80 9.4 1.9 0.7 Belgium 211 9.0 2.1 0.9Denmark 62 6.6 4.2 1.2 Denmark 121 5.5 5.1 1.4France 190 6.7 4.0 1.4 France 357 5.9 4.6 1.5Germany 214 5.5 3.2 3.2 Germany 347 5.4 4.3 2.0Greece 127 5.8 5.4 0.6 Greece 189 5.7 5.3 0.8Ireland 217 8.6 3.1 0.3 Ireland 181 8.8 2.9 0.3Italy 521 7.6 4.1 0.2 Italy 479 6.8 4.9 0.3Portugal 114 3.9 5.9 2.2 Portugal 156 4.8 6.5 0.7Spain 495 6.2 5.2 0.6 Spain 525 5.7 5.5 0.8United Kingdom 165 5.7 4.3 2.0 United Kingdom 136 5.1 4.5 2.4
Women aged 15-64 Both sexes aged 55-64
Austria 34 5.5 3.5 3.0 Austria 16 (4.9) (0.1) (7.0)Belgium 188 8.9 1.8 1.2 Belgium 28 (9.6) (0.0) (2.4)Denmark 118 4.5 4.6 2.9 Denmark 37 3.7 0.8 7.5France 298 5.5 4.6 1.9 France 52 7.3 0.4 4.3Germany 283 4.9 3.8 2.9 Germany 98 5.0 1.5 5.5Greece 227 6.3 4.7 1.0 Greece 13 (9.0) (2.8) (0.2)Ireland 51 5.7 4.1 2.2 Ireland 19 (8.1) (3.4) (0.6)Italy 370 6.9 4.4 0.7 Italy 28 (4.7) (5.9) (1.3)Portugal 158 5.0 6.0 1.0 Portugal 45 5.9 0.6 5.6Spain 360 5.6 5.2 1.2 Spain 69 6.6 2.8 2.6United Kingdom 63 3.5 4.0 4.5 United Kingdom 30 5.3 1.9 4.8
Table 4.7. Labour market status in 1996 and 1997 following long-term unemployment, by gender and agePeople who were long-term unemployed in December 1995a

OE
CD
EM
PL
OY
ME
NT
OU
TL
OO
K – IS
BN
92-64-19778-8 – ©2002
The ins and outs of long-term
unemploym
ent–
207
ECHP: European Community Household Panel.– Estimates not reported due to fewer than 10 observations.(Estimates based on less than 30 observations).a) Individuals whose current spell of unemployment started after January 1995.b) For example, if the current spell began in March 1995, a person who was unemployed for 4 months in total from March 1994 to February 1995 appears in the “1-5 months” category.c) Equivalently, half the total number of months spent unemployed and employed in the 24 months January 1996 to December 1997.d) Unweighted average of countries shown.Source: ECHP, waves 2 to 5.
Short-term unemployed in December 1995a
Long-term unemployed in December 1995Unemployment in the 12 months preceding the current spellb
None 1-5 months 6-11 months
Average months per year in each status in 1996 and 1997c
Number of observations Unemployed Employed Number of
observations Unemployed Employed Number of observations Unemployed Employed Number of
observations Unemployed Employed
Austria 68 3.8 6.2 39 5.0 6.7 8 – – 67 6.4 2.7Belgium 44 5.7 5.4 18 (6.9) (4.8) 14 (8.6) (3.3) 268 9.1 1.8Denmark 65 4.2 6.8 31 3.6 6.9 16 (7.3) (4.1) 180 5.4 4.4France 163 7.1 4.0 74 5.4 5.7 55 6.3 4.8 488 6.0 4.3Germany 203 7.1 3.6 48 4.5 5.7 27 (7.4) (3.5) 497 5.2 3.5Greece 78 3.6 5.5 109 4.2 7.0 83 5.3 5.4 354 6.1 4.9Ireland 72 4.8 6.8 29 (4.8) (6.6) 16 (8.5) (3.4) 268 8.1 3.2Italy 127 6.4 3.7 77 5.3 5.8 79 5.8 5.7 891 7.4 4.2Portugal 114 4.5 5.6 37 4.8 6.7 30 3.7 7.1 272 4.6 6.0Spain 176 4.9 4.8 131 5.2 5.8 153 6.6 4.6 855 6.0 5.2United Kingdom 107 4.7 5.1 31 4.7 6.4 22 6.5 5.1 228 5.2 4.2ECHPd 1 217 5.2 5.2 624 4.9 6.2 503 6.6 4.7 4 368 6.3 4.0
Table 4.8. Labour market status in 1996 and 1997 following short-term unemployment, by previous experience of unemploymentPeople who were unemployed in December 1995

OECD EMPLOYMENT OUTLOOK – ISBN 92-64-19778-8 – ©2002
– The ins and outs of long-term unemployment208
Box 4.1. The change in life satisfaction of the unemployed in a number of different countries
The link between personal well-being and unemployment has been explored overmany years, from the Great Depression of the 1930s to the present day (Machin andManning, 1999). The universal finding of both cross-sectional and panel data is thatunemployment tends to be associated with a marked reduction in psychological well-being.However, it is less clear whether, in addition, psychological well-being varies with theduration of unemployment. Some studies using cross-sectional data, such as Clark andOswald (1994), have found that unemployment duration has a small positive effect on well-being, conditional on being unemployed. This result might be explained by “habituation”– unemployed people might learn to live with unemployment over time. However, there isanother possible explanation. Those who are most badly affected by unemployment havethe greatest incentive to find a job. Unless such unemployed people also tend to havegreater difficulty in finding work, this should tend to change the composition of theunemployed pool towards people less affected by unemployment, as the duration ofunemployment increases. This is sometimes called a “sample selection” effect.
In order to explore the effect of unemployment duration on psychological well-being,cross-sectional data are therefore not enough. It is necessary to use longitudinal data aswell. Existing longitudinal studies have produced mixed findings. Winkelmann andWinkelmann (1998) find no statistically significant evidence for a decline in reportedsatisfaction “with life as a whole” as the duration of unemployment increases.
This box summarises the main results of a study to explore the relative influence of“habituation” and “sample selection” effects using national longitudinal surveys forGermany (German Socio-Economic Panel, GSOEP) and the United Kingdom (the BritishHousehold Panel Survey, BHPS), and cross-country panel data from the EuropeanCommunity Household Panel (ECHP – see Annex 4.B). Results from a straightforwardcross-sectional analysis are rather varied but in some countries they suggest that the lifesatisfaction of the long-duration unemployed is higher than that of the shorter durationunemployed, especially for women. However, this does not take account of changes in thecomposition of the unemployment pool as the duration of unemployment lengthens.
Using longitudinal data, it is possible to look at the change in life satisfaction ofindividuals who stay unemployed from one wave of the survey to the next. Table 4.9presents the simple means of the change in life satisfaction according to labour marketstatus at wave t-1 and wave t. Changes in life satisfaction of those who remain unemployedwere not statistically different from zero in the BHPS and GSOEP data. There is someevidence that life satisfaction fell for those who remained unemployed in the ECHP data,but in this case life satisfaction also fell for those who remained employed. Panel dataregressions (not shown), with dummies for unemployment of less than one year, one to twoyears, and two years or more, suggest that unemployment has a strongly depressing effecton life satisfaction, but that this effect is not strongly, or systematically, dependent upon thelength of the unemployment spell. The cross-section finding that life satisfaction of theunemployed rises slightly with unemployment duration may therefore be caused not byhabituation but by sample selection.
Many of the long-term unemployed leave the labour force, rather than continuing inunemployment. Table 4.9 shows that unemployed people who leave the labour forceexperience, on average, an increase in life satisfaction although this is less than the increasein satisfaction associated with entry to employment.

OECD EMPLOYMENT OUTLOOK – ISBN 92-64-19778-8 – ©2002
The ins and outs of long-term unemployment – 209
experience of unemployment than for those who are currently long-term unemployed.However, for those who are short-term unemployed yet were unemployed for half or moreof the year just before their current unemployment spell, unemployment outcomes are justas bad as they are for the long-term unemployed. These results suggest the short-termunemployed with a substantial recent history of unemployment are in important respectsjust as disadvantaged as the long-term unemployed. However the two groups are not iden-
Box 4.1. The change in life satisfaction of the unemployed in a number of different countries (cont.)
Table 4.9. Changes in life satisfaction related to changes in labour force statusUnits of satisfaction as measured in the surveys
BHPS: British Household Panel Survey.GSOEP: German Socio-Economic Panel.ECHP: European Community Household Panel.Source: Calculations by the OECD and by Andrew Clark.
Labour force status in the previous year
Current labour force status
Employed Unemployed Inactive
BHPS EmployedMean –0.008 –0.281 –0.102Standard error 0.009 0.09 0.047Number of observations 14 536 274 753UnemployedMean 0.388 –0.121 0.219Standard error 0.069 0.082 0.107Number of observations 376 339 224InactiveMean 0.048 –0.22 –0.041Standard error 0.043 0.098 0.02Number of observations 883 214 4 618
GSOEP EmployedMean –0.063 –0.763 –0.161Standard error 0.068 0.054 0.034Number of observations 60 363 1 909 3 279UnemployedMean 0.903 0.013 0.224Standard error 0.065 0.05 0.067Number of observations 1 419 2 151 981InactiveMean 0.034 –0.336 –0.076Standard error 0.031 0.086 0.012Number of observations 3 908 749 22 213
ECHP EmployedMean –0.0446 –1.271 –0.138Standard error 0.0033 0.029 0.019Number of observations 133 999 4 322 7 885Unemployed Mean 1.379 –0.041 0.521Standard error 0.025 0.018 0.026Number of observations 5 837 7 573 4 799Inactive Mean 0.211 –0.741 0.004Standard error 0.019 0.026 0.006Number of observations 7 504 4 950 64 000

OECD EMPLOYMENT OUTLOOK – ISBN 92-64-19778-8 – ©2002
– The ins and outs of long-term unemployment210
tical: the former group has, as can be calculated from the data in Table 4.8, much lowerrates of withdrawal from the labour market.
2. Active labour market policies and long-term unemployment
This section focuses on active labour market policies and the Public EmploymentService (PES), including unemployment benefits. These policies are mainly relevant forpeople who are registered unemployed or have UI or assistance benefits, who in somecountries are only a minority of the unemployed.11 Policies in other areas such as aggre-gate demand management, fostering entrepreneurship, taxation, wage determinationmechanisms, employment security, and education and training will not be studied: thesepolicies can affect long-term unemployment, but analysis of their impact needs to usemany further indicators. Rather than attempting to look at all aspects of PES policies thissection focuses on some issues of timing, notably the emphasis to be placed on the strat-egies of “prevention” rather than “cure” of long-term unemployment, and policies towardsrepeat unemployment.
A. Background
Recent OECD publications on active labour market policies and the PES have arguedfor the following policy stance (OECD, 2001a):
• High-quality job matching and related employment services, with effective use ofinformation technology: these further empower clients who are able to search effec-tively themselves.
• “Interventions” in the unemployment spell, designed to ensure continued effectivejob search: these can include regular short interviews, intensive interviews, individ-ual action plans, reporting and review of job-search efforts, referrals to vacant jobsby the PES and short job-search training courses. These interventions should bringthe jobseeker into regular contact with vacant jobs and correct ineffective jobsearch strategies. They may lead directly to a job, and also they help to maintain thejobseeker’s focus on the objective of finding work, and implement the requirementto be available for work as a condition for receiving benefits.
• Labour market programmes: these are to tackle problems such as individual skilldeficits, lack of work experience and information barriers in the labour market.When benefit disincentives are part of the problem, linking receipt of benefits toprogramme participation has a “motivation” effect, encouraging some jobseekers totake up market work instead.
None of these approaches is a panacea. Few labour market programmes have a largeand robust impact on job finding, and the most successful programmes are often thosewhich are difficult to expand: for example, temporary wage subsidies for private sectoremployment are relatively successful for the people who are hired, but if they areexpanded too far, high rates of displacement and churning arise. Programme participationrequirements can have a large “motivation” effect for some groups of unemployed, butthere is still a risk that, for others, programme participation becomes a means of requali-fying for another spell of UI benefits, or a way of life. It is important to monitor impacts,and only use each policy approach to the extent that it effectively promotes entry tounsubsidised work.

OECD EMPLOYMENT OUTLOOK – ISBN 92-64-19778-8 – ©2002
The ins and outs of long-term unemployment – 211
Management, institutional and legal factors determine to a large extent whethereffective services and interventions are implemented. Some significant factors are:
• Information: the PES needs to know the history and current status of unemployedpeople and of its own contacts with them, and have nationwide information onplacements, etc., on a consistent definitional basis to assess whether one approachor another is being successful.
• Management control mechanisms: effective management, whether through tradi-tional line-management approaches, performance-rating and management-by-objectives, or financial incentive mechanisms within the PES, is needed to ensurethat a strong focus on placement into unsubsidised work is maintained, down to thelevel of the individual employment counsellor and unemployed person.
• The legal definition of “suitable work”: for example, benefit legislation which stipu-lates that an unemployed person is not required to move or to change occupation tofind work can allow long-term unemployment to persist unnecessarily. However,stricter legislation has no impact if it is not applied (OECD, 2000, Chapter 4).
A high level of success with these and other policies towards unemployment shouldbe seen as a precondition for policies that have the broader objective of raising employ-ment rates. Otherwise the latter policies (e.g. restricting access to early retirement bene-fits, or making disability benefits conditional on the use of residual work capacity) may,by increasing number of disadvantaged jobseekers that need work, overwhelm the policiestowards unemployment.
B. The scheduling of labour market policy interventions
The EU Luxembourg process set out in 1997 the principle that an offer of assistanceshould be made to all young persons reaching 6 months of unemployment, and to alladults reaching 12 months of unemployment. This initial targeting on the long-term unem-ployed was soon supplemented by a renewed emphasis on prevention, e.g. the EU’sEmployment Guidelines for 2000 stated “The preventive approach (...) lies at the heart ofthe strategy. Stemming the flow into long-term unemployment is an essential prerequisitefor tackling the scourge of unemployment; otherwise the skills of those becoming unem-ployed become obsolete, and even the will to work can fade. The preventive approachrequires early intervention at the level of the individual and the aim must be an effectiveand rapid integration of the individual concerned into the labour market” (EC, 1999). Amulti-country survey, Preventing Unemployment in Europe: A New Framework forLabour Market Policy (Klemmer and Wink, 2000) reflected this shift in emphasis.
Regular services of the Public Employment Service (PES)
High-quality PES self-service facilities should be available at any time in the unem-ployment spell. Some countries also make specialised education and training programmesavailable, subject to screening checks, at any time. Certain “activation” measures – suchas requirements to report regularly to the employment office, keep a job-search diary,accept referrals to job vacancies, and participate in intensive interviews (albeit that oftenseveral months pass between such interviews) – are also usually applied on an ongoingbasis and from the start of an unemployment spell.
Some of the types of PES interventions that typically are “ongoing” throughout theunemployment spell are intensified after a certain duration of unemployment. For exam-

OECD EMPLOYMENT OUTLOOK – ISBN 92-64-19778-8 – ©2002
– The ins and outs of long-term unemployment212
ple, in the United Kingdom direct referrals to vacant jobs tend to occur under “caseload-ing” procedures (a series of regular interviews with an advisor), usually reserved forlonger-term unemployed (the 1-2-1 and Jobfinder programmes provided a formal struc-ture for targeting them on one-year and two-year unemployed). Requirements for report-ing job search sometimes intensify after some months (e.g. in Australia after participationin job-search training, in Finland after an action plan procedure, and in the United Statesinsofar as four job search contacts per week are required under the federal extended ben-efit programme12). At the same time, there is often a general tendency for the long-termunemployed to get less attention from PES officers because they are seen as being hard-to-place.
Individual action plans are often introduced after some months of unemployment(e.g. five months in Finland and a year in Belgium). However, in other countries an indi-vidual action plan must be drawn up before benefit payments start (in the United Kingdom)or within the first few weeks of unemployment (in Austria, France, New Zealand,Switzerland and Sweden) (OECD, 2001a, and advice from national authorities). Overall,it should be kept in mind that a number of basic services and regular interventions, withonly a weak tendency for these to be intensified as the duration of unemploymentincreases, are an important component of an active labour market policy. And importantly,regular interventions should increase rates of exit from unemployment at all durations:this means that their impact is not neutral as between short-term and long-term unemploy-ment, they unambiguously reduce the latter more than the former.
Targeting programmes on the long-term unemployed
Many long-term labour market programmes are offered only (or with just a fewexceptions) to people who have been unemployed for a minimum period, which may be 3,6 or 12 months or occasionally longer. This helps to limit costs. Job-creation programmesand hiring subsidies are usually restricted to the long-term unemployed, although there aresome exceptions (e.g. sheltered employment for the disabled, and the Belgian and Frenchyouth programmes mentioned in Chapter 1). As mentioned above, training programmesare – subject to additional checks and to the availability of suitable places – more oftenavailable to unemployed people irrespective of unemployment duration: limited take-up,depending on the range and attractiveness of the training offered and the prior qualifica-tions required, can limit the cost of providing training.
Arguments for targeting assistance
The main arguments for and against targeting employment assistance on the long-term unemployed are all related to the tendency for rates of exit from unemployment todecline with the duration of unemployment:
• If the decline in exit rates is due to “state dependence” such that the experience ofunemployment directly reduces rates of jobfinding,13 it will be more efficient todeliver assistance early in the unemployment spell. One argument for prevention isthat long-term unemployment results in the deterioration of skills, further detach-ment from the labour force or stigmatisation in the eyes of employers, so that earlyinterventions are more likely to be successful. This is an argument for profiling theshort-term unemployed, to determine early on which of them need intensive assis-tance (see below).

OECD EMPLOYMENT OUTLOOK – ISBN 92-64-19778-8 – ©2002
The ins and outs of long-term unemployment – 213
• If the decline in exit rates is due to heterogeneity and sorting, the implicationsdepend on the nature of the heterogeneity. Some workers become long-term unem-ployed because they are using ineffective job-search strategies, and this argues fortargeting interviews, assessment, and job-search training on the long-term unem-ployed. If the long-term unemployed are employable but poorly motivated, the“activation” measures described below may be appropriate. If underlying employ-ability varies, the long-term unemployed will on average have low employability,which argues for targeting “social” rather than “employment” measures on them.14
• Declining rates of exit imply that the expected future duration of an unemploymentspell is greater for a long-term unemployed person than for a short-term unem-ployed person. If one-off interventions (e.g. job-search training, or individualassessments which allow more accurate referral to jobs or further programmes) canachieve the same number of placements in both cases, it is more efficient to targetthem on the long-term unemployed.
• In the case of longer-term programmes, “lock-in” effects need to be considered.During programme participation, the employment rates of programme participantsfall below those of a comparable group of non-participants. After the programmehas ended this gap narrows, but it may not be decisively reversed in favour of par-ticipants.15 Such “lock-in” effects (in the case of training and job creation pro-grammes) and “deadweight” (in the case of hiring subsidies) are greatest for more-employable participants, who have high rates of entry to employment when they donot enter a programme. This is an argument for offering slots on labour market pro-grammes to unemployed people only after they have been unemployed for sometime.16
Scheduling activation measures
“Activation” involves an element of obligation on the unemployed person: if entry toa labour market programme is restricted to the long-term unemployed but remains whollyvoluntary for them, it is a targeted programme more than an activation measure. Nordiccountries often use the term “activation” to mean only participation in a training oremployment programme, although here the idea is that interventions such as job-searchmonitoring and the preparation of individual action plans can also be activation measures.
Arguments for targeting obligations on the long-term unemployed
Simple models of optimal unemployment benefits provide one important argumentfor targeting activation measures on the long-term unemployed. In these models, whereindividual search behaviour is an important influence on the unemployment rate butincome adequacy during unemployment is also a central policy consideration, the optimalbenefit schedule has a replacement rate that falls with the duration of unemployment(Fredriksson and Holmlund, 2001). The decline in benefit levels “later” increases searchincentives for all unemployed workers “now”, whereas the welfare losses associated withlow levels of benefit “later” affect only a limited proportion of the same unemployedworkers (because many of them find work first, and never suffer from the low levels ofbenefit). A declining time profile of benefits thus to a certain extent maintains incentivesfor job search while also maintaining jobseeker utility out of work, and thus it maximisessocial welfare, when this is defined as the sum of all individual utilities. This result doesnot depend on jobseeker heterogeneity: it holds even when individual characteristics and

OECD EMPLOYMENT OUTLOOK – ISBN 92-64-19778-8 – ©2002
– The ins and outs of long-term unemployment214
individual chances of finding work (conditional on job search) are the same for all indi-viduals and invariant to the duration of unemployment (i.e. the long-term unemployedhave searched as intensively as other unemployed, and differ from others only in terms oftheir bad luck). The probable empirical relevance of these mechanisms is illustrated byempirical findings that rates of job-finding increase around the time that the replacementrate declines or UI benefits expire.17
Replacement rates are usually reduced with increasing duration of unemployment,often sharply.18 Owing to the element of obligation involved, activation measures targetedon the long-term unemployed have a similar effect in motivating job search earlier in theunemployment spell. Under certain assumptions (e.g. if occupying jobseekers in pro-grammes and maintaining their incomes has positive social externalities in terms of crime,homelessness and the welfare of beneficiaries’ children), “workfare” requirements whichreduce the utility of the long-term unemployed without reducing their incomes could bepreferable to a declining schedule of replacement rates, as a means of achieving job-search incentive effects.19
Empirically, benefit eligibility conditions tend to be made stricter with the durationof unemployment20 and Australia and certain European countries with long-term unem-ployment benefits tend to require participation in some of their main programmes after afixed duration of unemployment. The principle of uniform timing runs contrary to policyrecommendations which call for an individualised treatment of unemployment. Possiblearguments for it are:
• Horizontal equity: all unemployed people face the same obligations.
• Reliable implementation: with a uniform rule, it is relatively difficult for either theunemployed person or PES staff to avoid appropriate action (e.g. drawing up anaction plan), as may often occur when interventions are decided on a discretionarybasis.
• Clarity and administration costs: obligations must be clearly defined if they are tobe enforced, and administrative resource constraints make it difficult to do this on acase-by-case basis.
• Motivation effects: letting jobseekers know their new obligations (e.g. to participatein a programme) in advance will give them more time to find a job instead, if that ispossible.21
Methods of implementing activation strategies
One way to individualise treatment, within a context of uniformly-defined obliga-tions, is to give the jobseeker and employment counsellor choice across options. Thus inthe UK New Deal, participants can choose between four options but there is “no fifthoption” of staying on benefits. In some other countries, an action plan is drawn up beforereferral to a labour market programme and allowance for individual situations can bemade at this point. In Sweden jobseekers and employment counsellors can even vary thetiming of programme participation: limits on benefit duration have traditionally helpedensure that some option is taken up.
Since 1990, several European countries have made any further payment of UI bene-fits after a certain duration of unemployment conditional, in principle, on participation ina labour market programme. Denmark’s policy, as first implemented in 1995, abolishedthe possibility of requalifying for UI through programme participation, extended the UI

OECD EMPLOYMENT OUTLOOK – ISBN 92-64-19778-8 – ©2002
The ins and outs of long-term unemployment – 215
benefit duration to seven years, and made the payment of the fifth, sixth and seventh yearsof UI benefit conditional on programme participation. In following years, as unemploy-ment rapidly fell, the timing of the period of continuous programme participation wasadvanced (see AM, 2000, for details). Switzerland introduced a similar policy in its 1996revision of UI legislation: after 7 months (12 months for older workers), UI for theremainder of the two-year UI entitlement period is conditional on participation in a labourmarket programme. Unemployment in Switzerland fell rapidly under this policy, althoughreforms of the PES (described in OECD, 2001a) contributed to this in addition to the pro-gramme participation requirement. The principle of continuous participation has not beenimplemented in a rigid way in either Denmark or Switzerland. Denmark aims to achieveprogramme participation for a minimum 75% of the time, during the “active period” ofbenefits. This allows for some periods of open unemployment in between programmes. InSwitzerland, in practice unemployed people often entered a labour market programmesome months before or after the 7-month limit,22 and in 2001 federal rules for the timingof programme participation were abandoned, leaving decisions about this to the cantonsand local employment offices.23
Sweden introduced an “activity guarantee” in 2000, with associated changes in UIlegislation early in 2001. Under previous legislation, UI could be paid for 300 days(60 weeks, or 14 months) but participation in a six-month labour market programme(which often started towards the end of the UI period) generated a new period of entitle-ment to benefit. Following the reform, UI can be paid for 600 days (120 weeks, or28 months), but programme participation no longer renews benefit entitlement. Thisimplies that after 28 months, an unemployed person has to participate in programmes con-tinuously in order to receive the programmes’ subsistence allowances (which are similarto UI benefits). According to some reports, under the terms of the activity guarantee peo-ple who have been unemployed for over two years are required to attend the local employ-ment office every day, and after 27 months a place on a labour market programme isoffered.
Profiling
“Profiling” in labour market policy is a procedure where a numerical score, calcu-lated on the basis of multivariate information (sometimes including variables assessed byPES staff judgement), determines the referral of a jobseeker to further employment ser-vices. In current applications, profiling scores are designed to be indicators of whether thejobseeker will be hard-to-place, or is likely to suffer long-term unemployment. Profilingseeks to deliver intensive services early rather than after long-term unemployment hasalready occurred. While this approach is attractive, two potential issues with it are:
• It may be difficult to identify the individuals at greatest risk of long-term unem-ployment accurately. For example, UK research identified many factors associatedwith the risk of long-term unemployment including age, gender, marital status,household composition, housing tenure and local market indicators, but was notable to develop a good predictive model.24 When prediction accuracy is low, inten-sive services will be delivered to many jobseekers who would have found work inany case, using resources which could have been conserved for helping those whoactually become long-term unemployed.
• Targeting intensive assistance on the groups with the highest levels of disadvantageis not necessarily an effective use of resources. Plausibly, a programme of training

OECD EMPLOYMENT OUTLOOK – ISBN 92-64-19778-8 – ©2002
– The ins and outs of long-term unemployment216
and job-search assistance which can raise the job-finding rate from 5% to 8% for agroup of highly-disadvantaged unemployed people will raise it in a similar propor-tion, e.g. from 20% to 30%, for a less-disadvantaged group.25 One evaluation ofprofiling services in the United States (Black et al., 1999) found an inverse-U rela-tionship, with the estimated impact of employment services being close to zero bothfor highly-employable and for highly-disadvantaged workers. Another US evalua-tion (Eberts, 2001) reported that profiling was able to increase total programmeimpact by allocating welfare recipients to the most appropriate service: some of theservices available were more effective for the more-employable jobseekers.26
The current pattern of use of statistical profiling techniques in OECD Member coun-tries is summarised in Annex Table 4.C.1. Australia, the Netherlands and the UnitedStates are the main users. This is probably related to other aspects of labour market policyin these countries. In the United States, the maximum duration of UI benefits is usually sixmonths, and programmes targeted on those who have already become long-term unem-ployed would not save money for insurance funds. In Australia and (starting in 2002) theNetherlands, hard-to-place workers are allocated to contracted intensive assistance ser-vices (called reintegration services in the Netherlands), which in Australia account foraround half of total government spending on employment services, and profiling scoresare used to determine which new jobseekers are referred to these services.
Only the United States profiles newly-unemployed workers directly on the basis ofeconometric models of the probability that jobseekers will enter long-term unemployment(the probability of exhausting UI benefits, in the US context). Australia incorporates someadditional variables with weights decided on the basis of expert judgement, and in theNetherlands the coefficients used have no explicit basis in econometric estimates.27 USforecasting models use a relatively restricted set of variables, notably education, job ten-ure, change in employment in the previous industry and occupation, and local unemploy-ment rate: the use of some other variables common in econometric modelling, includingage, race/ethnic group and gender, is prohibited.28 In Australia not only age, gender andfamily status but also disability, homelessness, prison record, limited literacy and otherpersonal factors can each contribute from 5 to 8 points to the JSCI (Jobseeker Classifica-tion Instrument) score which determines referral of an individual to Intensive Assistance.Although this greater detail should contribute to greater accuracy, some operational prob-lems arise when a client does not declare factors of disadvantage (such as disability or lit-eracy problems) at initial interview, and these factors are only detected when the serviceagency begins work with the client.29 The JSCI is reapplied annually and (followingrecent re-estimation of the weights) twelve months of unemployment contribute at least10 points and 10 years of unemployment contribute 26 points: 25 points in total areneeded to qualify for Intensive Assistance, and the majority of long-term unemployed job-seekers now qualify.
In the United States, the services provided to workers selected by profiling procedurevary considerably from state to state. A third of states offer only minimal re-employmentservices (five hours or less) to workers selected by the profiling mechanism, but in about45% of states over half the profiled claimants are required to participate in additional ser-vices as specified in their service plan (Wandner and Messenger, 1999).30 In Australia andthe Netherlands, intensive assistance providers typically make a further individual assess-ment of the jobseeker and provide a variety of further services. In no case are profilingscores alone used to determine referral to, or eligibility for, longer-term training or job-creation programmes.

OECD EMPLOYMENT OUTLOOK – ISBN 92-64-19778-8 – ©2002
The ins and outs of long-term unemployment – 217
Using a broader concept, a number of other countries can be said to use some form ofprofiling:
• Korea and New Zealand use scoring systems based on a statistical model. Howeverin Korea the system is voluntary for the unemployed and advisory for counsellors,and in New Zealand the scores are used to classify jobseekers, but it is not clear thatany specific action is based on the score alone (although those identified as hard-to-place may be given more expensive help, e.g. wage subsidies). The calculation ofprofiling scores here may help to structure the traditional activity of collecting andrecording relevant information about jobseekers, after which a summary score canbe calculated at no additional cost.
• In some other countries, PES staff classify unemployed workers into categories(such as “hard to place”) on the PES computer system. In Sweden PES officersjudge whether a person is likely to become long-term unemployed, and refer theperson to a labour market programme if this is the case.31 The Czech Republic men-tions categories defined by legislation, Portugal mentions a code from 1 to 5 on thebasis of perceived employability, and Swiss placement offices classify unemployedworkers into categories of placeability: “very easy”, “easy”, “medium” and “diffi-cult” (Gerfin and Lechner, 2001, Table A.3). Such categories function as supple-mentary registration information with a role similar to that of information on theperson’s qualification level or previous occupation, for example. Germany immedi-ately classifies jobseekers into two categories “immediately ready to take up a job”and “need for assistance and help”. In the latter case, a wide range of “placementcharacteristics”, which help determine which assistance strategy is appropriate, areoften later recorded through a questionnaire.32
• Intensive interviews or action plan procedures are often important in determiningreferrals to labour market programmes, as a function of individual characteristics,and in this sense also function as a form of profiling.
Thus reliance on profiling scores that are calculated on the basis of multivariateinformation remains fairly limited. However, profiling techniques are still under develop-ment. There seems to be scope for improving forecasting accuracy. In assessing jobseekerdisadvantage, future unemployment risk including repeat spells could be used as a depen-dent variable. The individual’s unemployment history prior to the current unemploymentspell could be used as an explanatory variable, as suggested by the analysis in Section 1.Cabove,33 and variables for the person’s “contactability” and transport facilities and typicaltravel-to-work times from the area where the person lives also seem promising. Someprogress may be made in identifying characteristics that indicate a jobseeker’s ability tobenefit from particular services, rather than only identifying disadvantage. Another stepthat could mitigate problems of deadweight due to inaccurate forecasting is to allocateresources to profiled workers only after a holding period of month or so (OPRA Consult-ing Group, 1998).
C. Policy measures towards repeat unemployment
This sub-section examines a number of policy issues involved in repeat unemploy-ment. The first two are policy issues for UI systems, the next two concern PES interven-tions, and the fifth concerns “carousel effects” arising from the interaction of benefitsystems with private sector employment practices and/or labour market programmes.
OECD EMPLOYMENT OUTLOOK – ISBN 92-64-19778-8 – ©2002
– The ins and outs of long-term unemployment218
Temporary layoff unemployment
As discussed in Section 1.C above, national data (mainly administrative) suggest thatone-third of unemployed workers are on temporary layoff in the United States and Can-ada, and up to a fifth in some European countries. There is a risk that UI benefits will arti-ficially subsidise the regular use of temporary layoffs. In the United States, there is anextensive literature (which will not be mentioned further here) analysing the “experiencerating” of UI benefits. Some other countries attempt to limit benefit payments to tempo-rarily-laid-off employees through administrative rules. Thus Italy’s Ordinary CIG benefitis restricted to workers affected by collective layoffs that are due to transitory causes inde-pendent of both the employer and the worker (OECD, 1996). In Norway, in 1990, theperiod during which a temporarily laid-off worker could be paid regular UI benefits, with-out having been formally dismissed or being available for other work, was restricted to12 weeks. This limit was then raised to 26 weeks in 1993 and to 52 weeks in 1994. Ratesof recall by employers, at months of unemployment duration near these time limits, wereseveral times higher than in other months (Roed and Nordberg, 2001).34
Because the PES does not refer workers with an official temporary layoff status tojob vacancies, in a tight labour market employers have some incentive to declare layoffsas temporary. In a slack labour market this incentive is weak, because firms will often beable to rehire former employees even if they are not identified as temporary layoffs. Jan-sson (2002) suggests that the administrative distinction between temporary layoffs andother forms of unemployment was not implemented effectively in Sweden in the mid-1990s, with unemployment spells that ended through rehiring by the previous employerrarely being declared as temporary layoffs by employers or identified as recalls by thePES. In general, benefit administrations need to assess the frequency of benefit claimsassociated with temporary layoffs that seem to have no real insurance function, and theeffectiveness of measures to limit them.
UI contribution and entitlement periods
Labour market histories with repeat movements from unemployment to employmentand back to unemployment again create two problems for UI systems. When employmentspells are too short to qualify for UI, economic hardship and incentives for moving short-term employment relationships into the informal economy result. At the same time,employment spells that are just long enough to qualify for benefit result in a relativelyhigh ratio of benefits received to contributions paid, so that the UI systems subsidise pat-terns of intermittent work of this duration.
If moral hazard were not an issue, UI systems could provide unlimited duration cov-erage of involuntary unemployment from the first day of contributions (as is more or lessthe case for industrial injury insurance, for example). However, in practice many UI sys-tems provide insurance only with additional restrictive conditions. Table 4.10 shows min-imum qualifying periods for repeat unemployment claims (a first claim requires morecontributions in Canada but fewer in Switzerland) and corresponding limits on benefitduration for 20 countries.
In eleven countries the benefit period is no longer than the contribution period: infour of these, the benefit period is only half as long or less.35 In these cases it seems pos-sible that drawing the full duration of UI benefits is sometimes regarded as an entitlement,so that PES efforts at placement prior to benefit exhaustion are relatively ineffective. In

OECD EMPLOYMENT OUTLOOK – ISBN 92-64-19778-8 – ©2002
The ins and outs of long-term unemployment – 219
such a context, a restrictive pattern of contribution requirements and benefit duration con-ditions will be important to contain costs and the level of insured unemployment. InCanada, benefit durations are longer than the corresponding contribution periods, but theyare both under a year with the exact periods varying by region, and these arrangementsappear to be associated with a relatively high incidence of recurrent unemployment(see Sub-section 1.C above) and a focus, in policy analysis and debate, on possiblechanges to the contribution and benefit periods (e.g. see HDRC, 2001).
However, in nine countries the benefit period is at least twice the contribution periodand there are also countries where indefinite-duration unemployment assistance benefitshave a major role. Even indefinite-duration benefits create some incentive for repeatunemployment, in the sense that work patterns where work is concentrated into relativelyfew weeks (with unemployment at other times) will usually maximise benefit income (forany given number of total hours worked over a given period such as a year). In thesecountries, active labour market policies (including non-monetary benefit eligibilityrequirements) tend to be the main policy instrument for containing levels of insuredunemployment. Thus Norway, in terms of its benefit entitlement conditions, would appearto be at risk of high unemployment in remote and fishing regions in a similar way to Canada,and its active labour market policies – which include a geographic mobility requirementon the unemployed – probably contribute to keeping unemployment rates low.
Table 4.10. Minimum UI contribution periods and entitlement durationa
Workers aged 40, not the first claim
a) Minimum contribution periods relate to repeat spells of unemployment: in some cases contributions required for a first claim to UI arelonger (except Belgium where the entitlement once opened continues indefinitely). The durations of benefit entitlement shown correspondto these minima (in some case longer durations of entitlement can be obtained for longer periods of contribution).
b) The minimum contribution and maximum entitlement periods cited apply only for repeat users in high-unemployment regions. For a firstclaim, a minimum of 26 weeks of insured employment are required. See http://www14.hrdc-drhc.gc.ca/ei-ae/ratesc.htm for a table of enti-tlements by region.
c) 12 months for people still within the four-year UI period to start a new UI period; 6 months for UI exhaustees.d) The minimum earnings requirement is 1.25 time the Basic Amount and the Basic Amount is about 18% of average production worker earnings.e) The minimum required duration of contributions depends on wages and can rise to 25 weeks for low-paid part-time work.f) The contribution requirement is for earnings in each of two quarters: employees with low earnings (perhaps 5 to 10 weeks of full-time work)
can qualify for benefit, but then receive fewer months of benefits.Source: OECD database on benefit systems and work incentives; UNEDIC (2001); Missoc (europa.eu.int/comm/employment_social/
missoc2001/index_en.htm).
Minimum contribution period Duration of benefit entitlement following minimum contributions Benefit/contribution ratio
Austria 28 weeks 20 weeks 0.7Belgium 468 days (78 weeks) Indefinite –Canadab 420 hours (11 weeks) 45 weeks 4.1Denmark 6 months or 1 yearc 4 years 4 or 8Finland 10 months 500 days (100 weeks) 2.3France 4 months 4 months 1Germany 12 months 6 months 0.5Greece 125 days (25 weeks) 5 months 0.9Ireland 13 weeks 390 days (65 weeks) 8.5Italy 78 days (3 months) 78 days (3 months) 1Japan 6 months 90 days (3 months) 0.5Korea 6 months 90 days (3 months) 0.5Netherlands 26 weeks 6 months 1Norway c.10 weeksd 3 years 15.6Portugal 540 days (18 months) 18 months 1Spain 360 days (12 months) 120 days (4 months) 0.3Sweden 6 months 300 days (60 weeks) 2.3Switzerland 12 months 2 years 2.0United Kingdom c.10 weekse 182 days (6 months) 2.6United States 2 quartersf 6 months 1

OECD EMPLOYMENT OUTLOOK – ISBN 92-64-19778-8 – ©2002
– The ins and outs of long-term unemployment220
Operational definitions of long-term unemployment
For any policy that involves timing (e.g. the rule that an individual action plan mustbe drawn up within the first few weeks of unemployment, see Sub-section 2.B), adminis-trative rules must distinguish the continuation of a current unemployment spell from thestart of a new spell. Thus, in Australia administrative rules allow a person who already haslong-term beneficiary status to retain that status after employment spells of up to 25 weeksin duration. In 2000, 60% of unemployment beneficiaries had a long-term beneficiary sta-tus (this is usually the same as the registration status used for timing labour market policyinterventions), but just over half of them had in fact experienced at least one fortnight inthe preceding year when no benefit was paid (OECD, 2001b).
In most European countries, administrative statistics appear to record more shortbreaks in unemployment and report a lower incidence of long-term unemployment thanlabour force survey statistics.36, 37 Two problems which can arise when the “counter” ofunemployment duration is set back to zero after even a short break are:
• Measures targeted on the long-term unemployed fail to reach individuals whoselong unemployment spell has been only briefly interrupted.
• Policies which achieve mainly “cosmetic” reductions in the long-term unemploy-ment statistics, by briefly interrupting unemployment spells, are incorrectly creditedwith an impact.
Austria has recently tackled such issues by provisionally defining, for internal use bythe PES, a status called “long-term jobless”. Membership of this category arises after12 months of registered unemployment and/or participation in official training andemployment measures. An individual’s unemployment duration is not reset to zero afterbreaks in unemployment and/or participation that last less than two months. There were22 210 “long-term unemployed” but 41 316 “long-term jobless” in the first half of 2000and 12 137 “long-term unemployed” but 31 329 “long-term jobless” in the first halfof 2001. Again, this shows that the number of “long-term unemployed” can be doubledwhen a broader concept is used.
Table 4.11 shows some definitions of entry into (or retention of) long-term unem-ployment status that are used by the PES in determining participation in major labour mar-ket programmes (these definitions are not necessarily those used for well-known register-based unemployment statistics38). A period of employment resets the administrativeunemployment duration “counter” back to zero if it lasts:
• Two weeks, or less, in Greece, (possibly) Ireland, Norway, Slovak Republic, (often)Spain, Sweden and (for purposes of compulsory referrals to the New Deal) theUnited Kingdom.
• Four weeks (long-term unemployed concept) or two months (long-term joblessconcept) in Austria.
• Three months in Belgium, the Netherlands and New Zealand and (for the short-termunemployed) Australia, and four months in Finland.
• Six months in Australia (for the long-term unemployed), Germany and (for entitle-ment to hiring subsidies) Spain and (to qualify for many programmes) France.
• A year in Denmark (for adults) and (to qualify for hiring subsidies) Portugal.

OE
CD
EM
PL
OY
ME
NT
OU
TL
OO
K – IS
BN
92-64-19778-8 – ©2002
The ins and outs of long-term
unemploym
ent–
221
General rules relating to breaks in the unemployment spell including temporary employment Specific rules for periods of illness and programme participation
Australia Beneficiary status is retained, with zero benefit payments, during work that lasts for upto 12 weeks. Long-term (more than 1 year) beneficiary status is restored after a break inbeneficiary status that lasts up to 13 weeks.
Unemployment benefit continues to be paid during periods of temporary illness.Participation in most programmes (except subsidised employment with a privateemployer) is assimilated to unemployment.
Austria The “long-term unemployed” are those who have been registered for 12 months, withbreaks up to 28 days assimilated to continuing unemployment.In 2002 the “long-term jobless” category used internally by the PES was defined aspeople registered as unemployed and/or participating in training or activation measuresfor a total of 12 months with breaks of up to 62 days continuing unemployment.
For the “long term unemployed” definition, periods of illness or programme participationup to 28 days are assimilated to continuing unemployment. Longer breaks reset thecounter to zero.For the “long term jobless” definition, periods of participation in training or activationmeasures are not counted as unemployment but they do not reset the counter to zero.
Belgium Breaks in unemployment of less than 3 months duration, for any reason, aredisregarded.
No special treatment.
Denmark The benefit period lasts for 4 years. To start a new benefit period prior to exhaustion,12 months of work in an ordinary job are needed. Following exhaustion, 6 months ofwork are needed. Adults are targeted for activation when they have received benefits for12 months and youths when they have received benefits for 6 months out of the last9 months.
The first six weeks of a spell of illness are counted as periods of continuing UI receipt,subsequent weeks postpone the period of rights to UI. Periods of participation onprogrammes are assimilated to continuing benefit receipt.
Finland A long-term unemployed person is one who has been an unemployed jobseeker in oneor several spells for at least 12 months in a period of 16 months.
Illness: not known.Subsidised employment: assimilated to regular employment: however since 1997,10 months’ contributions have been required to qualify for a new benefit spell andsubsidised employment alone is not enough to qualify for a new benefit spell.
France A previous personalised action plan (PAP) and the count of unemployment durationwithin that plan are resumed, when re-entry to unemployment occurs after less than6 months. Otherwise a new PAP is prepared.Eligibility for many employment and training programmes (CIE, SIFE, CQA, CES, CEC)arises when the person has been registered in unemployment for a total of 12 monthsout of the 18 months preceding admission.
The 18-month reference period is extended by any periods of illness, maternity oroccupational accident. In addition, for purposes of CIE (hiring subsidy programme) it isextended by any period of training and for purposes of CQA (adult qualification contract)it is extended by any period in CES (job creation programme), so that people can movedirectly from one programme to the next.
Germany Adult long-term unemployed are those who have been unemployed for a total of one yearwithin the last five years, except that the counter is reset to zero after a period of workthat lasts over six months.
Periods of illness and participation in programmes (as well as periods out of the labourmarket and in short-term employment) are not counted as unemployment but they donot reset the counter to zero.
Greece The long-term unemployed are those who have been unemployed for more than12 consecutive months.
Not specified.
Hungary In the case of participation in the active measures the period before and after the break inthe unemployment is counted.
For illness: unemployment benefit continues to be paid.
Ireland The long-term unemployed are those who have received unemployed benefit for over15 months. “Short breaks or employment” are normally disregarded.
Periods of illness and participation in government employment and training programmesare assimilated to unemployment.
Italy (Except for people on the mobility list and some kinds of unemployment benefit) mostemployment incentives are targeted on those who have been registered unemployed for24 months. After a fixed-term contract, for up to 12 months, the duration counterresumes: any excess over 12 months reduces the duration counter.
Not specified.
Table 4.11. Treatment of breaks in unemployment in determining active labour market policy interventions

OE
CD
EM
PL
OY
ME
NT
OU
TL
OO
K – IS
BN
92-64-19778-8 – ©2002
–T
he ins and outs of long-term unem
ployment
222
a) A fortnight where some days have been worked but also some benefit has been received is not counted as a break. Any work for over 16 hours per week averaged over two weeks, or which pays more than the benefit amountotherwise payable in a given week, interrupts the spell (Unemployment Unit and Youthaid, 1999).
Source: Advice from national authorities; for Belgium, EC (2001); for the United Kingdom, Unemployment Unit and Youthaid (1999, 2000).
General rules relating to breaks in the unemployment spell including temporary employment Specific rules for periods of illness and programme participation
Netherlands A new spell begins after working for a minimum of 65 days more than 12 hours a week. Illness and participation in training and employment measures for the unemployed donot break the unemployment spell, except for a limited number of jobs that are createdby municipalities for the unemployed but are otherwise regular jobs.
New Zealand Skills training and wage subsidies are available to those who have been registered asjobseekers for at least 26 weeks. The duration count is temporarily suspended duringbreaks of up to 3 months: only longer breaks reset the counter to zero.
For illness, the 3-month rule applies. The duration count is also temporarily suspendedduring attendance at one or more Training Opportunities (TO) courses.
Norway Programme provision is not generally conditional on any particular duration ofunemployment. However the long-term unemployed are defined operationally as thosewho have been unemployed for more than 26 weeks. Breaks of up to 2 weeks areassimilated to continuing unemployment: longer breaks reset the counter to zero.
Breaks in unemployment due to illness or programme participation are treated the sameway as other breaks.
Portugal Adult unemployed are eligible for job creation incentives if they have been registeredunemployed for a total of at least a year and have had fixed-term contract employment notexceeding 12 months, consecutively or at repeated intervals.
Not specified.
Slovak Republic The long-term unemployed are those who have been unemployed for at least12 consecutive months.
Periods of illness are assimilated to periods of unemployment. Any other break inunemployment resets the counter to zero.
Spain Entitlement to subsidies for indefinite-term contracts under the employment promotionprogramme arises after 12 months of registration for work, disregarding periods in workthat last less than six months.Entitlement to active insertion income (paid only to workers aged over 45 years) arisesafter 12 months of registration for work, disregarding periods in work that last less than90 days in total.
Not specified.
Sweden Short-term employment leads to loss of long-term unemployment status. Periods of temporary illness, when the individual remains available for work, do not alterlong-term unemployment status.Prior to 2001, participation in labour market programmes was assimilated to regularemployment. Now, it no longer contributes to entitlement for a new spell of UI benefit.
United Kingdom For many measures, spell duration refers to a continuous spell on unemployment benefita
(JSA), e.g. initial referrals to New Deal for Young People (NDYP) are only compulsory forpeople who have been unemployed continuously for 6 months.For Back to Work Bonus, the duration count can be temporarily suspended during a periodin training or on maternity allowance, up to 12 weeks without benefit for another reason,and up to two years on invalidity benefits.Eligibility for Work Base Learning for Adults, as well as voluntary entry to NDYP, arisesafter 26 weeks unemployed, with breaks of up to 4 weeks (including those due totemporary employment) assimilated to unemployment.
Illness: JSA may be paid for up to two periods each of up to two weeks, in each12-month period. After longer or more frequent spells of illness a new claim (involvinganother New Jobseeker Interview) must be made.
Table 4.11. Treatment of breaks in unemployment in determining active labour market policy interventions (cont.)

OECD EMPLOYMENT OUTLOOK – ISBN 92-64-19778-8 – ©2002
The ins and outs of long-term unemployment – 223
In Italy, the nominal duration of unemployment can remain high even after losing ajob that has lasted more than 12 months. One idea behind these rules may be that a “large”entitlement should be lost only after a “large” amount of employment: in Denmark,France, Italy, Portugal and Spain, the rules cited above determine access to relativelylengthy (one- to three-year) intervention regimes and hiring incentives.
Relatively short breaks in unemployment are often assimilated to periods of unem-ployment, so that the duration counter “keeps ticking” during the break. This is whatoccurs when long-term unemployment status is determined by looking at whether theunemployed person was unemployed a year earlier, subject to some maximum duration ofintervening breaks. It is probably a common treatment for employment spells that lastonly a few days (such that some benefit was paid, or registered unemployment status wasretained, in each administrative period), but it appears to also apply to employment of upto four weeks in Austria (long-term unemployed concept), three months in Belgium andthree or six months (as regards specific programme) in Spain. During rather longer spellsof unsubsidised employment (short of the durations, listed above, that reset the unemploy-ment duration counter to zero), the unemployment duration counter often temporarily“stops ticking”. This applies in Denmark, Finland, France, Germany, Italy, New Zealand,Portugal and (for eligibility for at least one programme) the United Kingdom. This is theoutcome if long-term unemployment is defined in terms of total benefit received withinthe current spell of benefit entitlement (as in Denmark) or the amount of registered unem-ployment in the last 16 months (as in Finland).
In some countries, although the unemployment duration counter is reset (or at leaststops ticking) following a short spell of employment, it keeps ticking during sickness.This is the case in Australia, Denmark (limited to the first six weeks of sickness), Ireland,the Slovak Republic, Sweden and the United Kingdom (limited to two two-week periodsper year). In France and Germany, by contrast, the duration counter stops ticking duringtemporary sickness. Similarly, in some countries (Australia, Denmark, and Ireland) par-ticipants in labour market programmes (except for those in subsidised employment in theprivate sector) are paid an unemployment benefit or similar allowance and the unemploy-ment duration counter keeps ticking during participation. This is also the case forAustria’s long-term jobless concept. In Germany, Hungary and New Zealand, the count ofunemployment duration is temporarily suspended during programme participation. Bycontrast, in Finland, Norway, the Slovak Republic, and probably some other countries,participation in the longer-duration programmes typically resets the unemployment dura-tion counter to zero.
These survey results illustrate that the majority of countries do target measures forthe long-term unemployed on people who are not long-term unemployed in the conven-tional statistical sense. National definitions, perhaps reflecting administrative convenienceand ad hoc historical precedent, are highly erratic. Two possible guidelines for rethinkingand redefining them are:
• Spells of sickness and participation in labour market programmes (if availability-for-work requirements are suspended during participation) could both temporarily“stop the clock”. Then, for example, temporary sickness will push back the timingof any right and/or duty to participate in programmes, but not by more than theduration of the sickness spell. Also, a person who enters a year-long training courseearly in the unemployment spell will not necessarily qualify upon exit for a hiringsubsidy that is targeted on the long-term unemployed; but a person who is initially

OECD EMPLOYMENT OUTLOOK – ISBN 92-64-19778-8 – ©2002
– The ins and outs of long-term unemployment224
entitled to such a hiring subsidy will be able to participate in training, without los-ing that entitlement.
• Sufficiently long employment spells will by definition reset the unemploymentduration counter to zero. The Danish arrangement where (once the relevant durationof unemployment has cumulated) twelve months of unsubsidised employment areneeded to avoid entry to the “active period”, is at first sight more logical than theUK arrangement where participation in the New Deal can be postponed forsix months – perhaps repeatedly – by undertaking just a few days’ work (or indeedmerely not signing on for benefit in one fortnight). Research could clarify this issue,e.g. it might be possible to demonstrate that even a brief recent experience of worksignals better prospects of longer-term unsubsidised work.
Short-term jobs and long-term subsidies
The PES in some countries undertakes individual preselection of candidates forvacancies, uses formal referral procedures with employers reporting the outcome of jobinterviews and focuses on placing unemployed people into stable full-time jobs. Howeverin some cases the PES also operates in the market for casual and interim work. InAustralia, contracted Job Matching providers receive a payment for each placementachieved and a statistical evaluation here found that “those who accept any employmentof more than 15 hours per week do increase their chances of moving to full-time, perma-nent employment” (DEWRSB, 2001). There can be a case for both approaches, keeping inmind that permanent exit from unemployment is the main ultimate objective.
Another “timing” issue concerns the duration of subsidised employment. Job cre-ation programmes usually create jobs that last for six months to a year, typically interrupt-ing long-term unemployment but generating repeat unemployment instead. Manycountries have sheltered workshops that create a certain amount of permanent subsidisedemployment for the disabled, but programmes creating permanent subsidised jobs for theunemployed are very exceptional. Japan long ago created permanent jobs for workersmade redundant by the closure of military bases and coal mines.39 Belgium created somepermanent jobs mainly in the 1980s, and the Netherlands in the 1990s (Brodsky, 2001).One “programme” offering regular working conditions that, exceptionally, seems to havebeen kept open for new hires for many years is the priority list (with duration of unem-ployment being one of the variables contributing priority points) in Italy for PES referralsof jobseekers to public sector jobs at the lowest level (OECD, 1996). Recently Denmarkhas introduced subsidies (paying one-third, one-half or two-thirds of wage costs) to sup-port “flexible working arrangements” for people whose capacity for work is permanentlyrestricted and who are not granted a disability benefit: half the hires so far have been inthe private sector (SM, 2001). Permanent employment programmes with a low annualinflow determined by very strict targeting criteria probably can be sustainable, but thenthey will be a last-resort solution, for only a small fraction of disadvantaged jobseekers.
Restricting carousel effects
In labour market policy, mechanisms that generate repeated movements in and out ofunemployment can be called “carousel effects”.
In some countries, interactions between UI and the deregulation of fixed-term con-tracts have probably generated such effects. When an employee who has a permanent con-tract leaves due to either dismissal for fault (e.g. bad timekeeping) or voluntary quit,

OECD EMPLOYMENT OUTLOOK – ISBN 92-64-19778-8 – ©2002
The ins and outs of long-term unemployment – 225
benefits are in principle not paid, or paid only subject to a sanction or deferment (OECD,2000, Table 4.1). To enforce this provision, the PES typically does not pay benefits until ithas received an employer statement concerning the nature of the separation. Typical rea-sons for separation are dismissal with notice and severance pay, dismissal for fault, andvoluntary quit. In many countries notice and severance payments are required by law(see OECD, 1999, Chapter 2) and the PES may not accept a statement that none of thesesituations applied, or may accept it only in exceptional circumstances. These administra-tive checks on the reason for separation tend to limit separations, since employers seek tominimise dismissals with notice and severance pay, and employees seek to avoid separa-tions that are classified as dismissal for fault or voluntary quit.
By contrast when a fixed-term contract ends, often no particular cost arises for theemployer and the PES has no means of determining whether non-renewal of the contracthas the character of dismissal for fault or voluntary quit. Benefit entitlements then createincentives for employers to offer fixed-term rather than permanent contracts. Italy andSweden are examples of countries where fixed-term contracting practices and UI claimshave grown hand in hand.40 Possible measures to counter this tendency are to removelegal recognition of fixed-term contracts (ensuring that legislation for regular contracts isappropriate), to restrict fixed-term contracts to situations where “objective” reasons arepresent, or to tax them where “objective” reasons are absent, or to experience-rate UI.41
Mechanisms that encourage repeat movement between unemployment and labourmarket programmes are well known. In Denmark, Finland and Sweden, the PES has in thepast systematically provided workers nearing UI benefit exhaustion with places on pro-grammes that generate a new period of UI entitlement. Both Denmark and Sweden havenow abolished the possibility of requalifying for UI through programme participation, asdescribed in Section 2.B. Finland had to scale back a system of generalised subsidies forprivate sector hiring of the long-term unemployed in the early 1990s, but it continued toprovide places on programmes near the time of UI exhaustion (OECD, 1996). More thanhalf of those who participated in a programme in 1995, and 63% of those who participatedin 1998, had already participated in at least one programme since 1991 (Aho et al., 1999,updated to 1998 in a separate memorandum). In 1997 the contribution period required toqualify for UI was increased from 6 months to 10 months so that it was no longer possibleto requalify only through participation in a single 6-month programme.
A closely-related issue arises in countries where many unemployed people receivelocally or regionally-financed social assistance benefits. Commonly, local or regionalauthorities hire their social assistance beneficiaries just long enough to qualify them for UI.Among the countries where this practice appears to be widespread or fairly widespread areBelgium, Canada, Germany, and Switzerland, but there may be a few others.42 It arises in theNetherlands to a limited extent (see Table 4.11) perhaps because municipalities there have(until recently) been liable for only 10% of the cost of assistance benefits. National author-ities may not be able to prevent municipal and regional authorities from hiring clients in reg-ular jobs with payment of UI contributions. However, when repeated cycling arises, thedifferent levels of government have an incentive to co-operate to stop this.43
Although it is generally desirable to restrict carousel effects of the kinds describedhere, it is important to examine the alternatives. If government is unwilling to reduce lev-els of income support or wages within programmes, or if such measures would be inef-fective, the obvious alternatives to cycling are quasi-permanent income support orprogramme participation, which may not be better. Rather than only trying to put a stop to
OECD EMPLOYMENT OUTLOOK – ISBN 92-64-19778-8 – ©2002
– The ins and outs of long-term unemployment226
cycling in general, policy reforms need to look at issues such as how to distinguish layoffsfor objective economic reasons from voluntary quits and regular employer use of UI, andhow to treat repeat unemployment as a form of long-term unemployment where the policyconsiderations listed in Sub-section 2.B apply.
Conclusions
Countries with a low share of long-term unemployment in total unemployment tendto have a low overall level of unemployment: this relationship is not very tight, but itholds in cross-country comparisons of both the levels and the changes through time inthese variables. A study here of longitudinal data for eleven European countries in themid-1990s has highlighted the central role of long-term unemployment, where total unem-ployment is high. Many individuals do experience only short, non-repeated spells ofunemployment, but they account for only a relatively small proportion of total months ofunemployment. About 40% of those who were short-term unemployed at a given point intime (December 1995), according to the conventional definition of unemployment dura-tion, went on to experience 12 or more months of unemployment by the time their currentspell had finished. About half of the remainder accumulated 12 months of unemploymentin total over a four-year time-span, when months spent in other spells of unemploymentare also taken into account. So in the end, on average five out of six people who wereunemployed in December 1995 experienced 12 months of unemployment.
The long-term unemployed appear to be relatively more likely to go on to becomevery-long-term unemployed in some countries, and more likely to leave the labour forcein others. In European countries, even among prime-aged males the total inactive popu-lation is several times the population in long-term unemployment, as conventionallydefined. However for this group the population in potentially-avoidable disability andearly retirement and in long-term unemployment are, arguably, roughly similar in size.Patterns of variation across countries seem partly consistent with the hypothesis that long-term unemployment, disability and early retirement behave as substitutes.
Patterns of unemployment benefit availability could explain some cases where very-long-term unemployment is reported, particularly among older workers. However for youthsa reverse pattern holds, since in several countries in Southern Europe there are many youthsin very-long-term unemployment, who are unlikely to be receiving unemployment benefits.In interpreting such cross-country relationships reverse causality must be considered, i.e. itmust be asked whether high unemployment has encouraged exclusion from benefits (morelikely for youths, who in some countries are expected to rely on parental income support) orthe provision of more generous benefits (more likely for older workers). Background factorssuch as aggregate demand conditions, employment protection legislation and wage determi-nation systems were not analysed here, but may also play an important role.
The second section of the chapter focuses on issues of timing in the design of activelabour market policies. Most such policies can be seen as aiming either to “prevent” or“cure” long-term unemployment. There are various arguments both for and against target-ing assistance mainly on the long-term unemployed. If exit rates from unemploymentdecline with the duration of the unemployment spell because of “state dependence” (theexperience of unemployment in itself reducing employability), or if the long-term unem-ployed are hardly employable at all, targeting employment assistance on the short-termunemployed may be appropriate, leaving long-term unemployment to be handled partly

OECD EMPLOYMENT OUTLOOK – ISBN 92-64-19778-8 – ©2002
The ins and outs of long-term unemployment – 227
by social measures. However, “lock-in” effects argue against making places on long-termlabour market programmes available to the short-term unemployed. When activation mea-sures which involve an element of obligation to participate are considered, an argumentfor making obligations stricter as the duration of unemployment increases is that this helpsto motivate job search among the shorter-term unemployed.
Faced with such conflicting arguments and trade-offs between “prevention” and“cure”, most countries with long-duration benefits adopt a strategy of regular interventionsin the unemployment spell, combined with special programmes that are targeted on the long-term unemployed. The idea of delivering intensive assistance early to individuals who are atrisk of long-term unemployment, as identified by statistical “profiling”, attracts considerableinterest. However profiling techniques are still under development, and it is not clear thatcurrent techniques are targeting assistance where it will be most effective. Relatively fewcountries use profiling extensively, and a combination of standardised eligibility rules andindividualised assessment still applies when referrals to training or job-creation programmesare made. Some of the more disadvantaged short-term unemployed could, this chapter sug-gests, be given earlier admission to labour market programmes currently targeted on thelong-term unemployed simply by using a broader definition of long-term unemployment(e.g. 12 months of unemployment in the last 18 months).
In countries where unemployment is high without a high incidence of long-term unem-ployment, the short-term unemployment that makes up the bulk of total unemploymentarises mostly in repeat spells. Various “carousel effects” have been identified here. Countrieswith a relatively short duration of UI entitlements may rely on this to limit the cost of benefitpayments, but this allows labour markets to respond to the incentives in the monetary enti-tlement conditions, which favour patterns of employment alternating with UI claims. Dereg-ulation of fixed-term contracts, leading to growing use of them (Chapter 3) along withincreasing UI claims, may also be interpreted as a factor that generates carousel effects.
Other countries, those which provide long-duration benefits, have more often adoptedexpensive labour market programmes as part of their strategy for limiting benefit claims. Attimes this has been successful, but one of the main problems has been the emergence ofanother type of carousel effect, cycling between unemployment and programme participa-tion by the most disadvantaged unemployed. First Denmark and more recently Sweden havetaken steps to stop this type of cycling by making participation in labour market pro-grammes, after some time in unemployment, quasi-permanent. In recent decades, only a fewprogrammes have offered permanent subsidised jobs for the unemployed, and the older onesamong these were closed to new entrants after a few years. The more recent strategies aremore cautious and sophisticated, but they still face some of the same risks.
Wide international variation in rates of disability, early retirement and female labourforce participation (Chapter 2) and total employment (Chapter 5) suggests that there isconsiderable scope for raising employment rates in many countries through policy mea-sures. However the success of reforms to reduce inactivity rates will depend very muchupon having already in place policies that can rapidly convert entries into the labour mar-ket into entries to employment: such reforms will not be productive if they overwhelmpolicies that are already finding it difficult to keep long-term unemployment down. It isimportant to ensure that future policies are grounded in experience, studying and under-standing both the difficulties that have arisen in trying to keep unemployment low withhigh levels of social protection, and the situations where this combination has to someextent proved to be sustainable.

OECD EMPLOYMENT OUTLOOK – ISBN 92-64-19778-8 – ©2002
– The ins and outs of long-term unemployment228
Notes
1. Machin and Manning (1999) note that the rise in unemployment seen in the bulk of these European coun-tries following the first oil-shock has been associated with an increase in the average duration of unem-ployment, rather than with an increase in the inflows to unemployment.
2. Corak and Heisz (1996) also argue that duration should be measured in terms of the average completedduration of unemployment, but (in contrast to Karr, 1997, who measures it for currently-unemployed per-sons) their measure relates to cohorts of individuals who begin their spell of unemployment at the sametime. Such a measure would be sensitive to the frequency of extremely short spells which make little con-tribution to total unemployment.
3. Chart 4.2 relates to two years, 1990 and 2000, which in most countries were preceded by fairly long peri-ods of employment growth. In time-series, a graph relating unemployment to the conventionally-measured average duration of unemployment shows “loops” because at the start of a recession short-termunemployment increases. Corak and Heisz (1996) show that there is a near-linear relationship betweenunemployment and their measure of the average completed duration of unemployment spells(see Note 2).
4. In Canada in 1999, just 9% of the unemployed were long-term unemployed, but 34% had not beenemployed in the last year. The latter figure has grown considerably since the 1980s, which might reflectincreased problems in entering or re-entering the labour market, or institutional changes that encouragedmore jobless Canadians to look for work (Bédard et al., 2000).
5. See Schwartz et al. (2001) for more recent survey information on frequent users of Employment Insur-ance (EI).
6. In UK data for 1984, 58% of individuals who had been unemployed for less than 6 months and 40% ofindividuals who had been unemployed for over 12 months returned to unemployment within a year, butby 1990 these percentages had converged to near 50%. The Restart strategy (introduced between 1986and 1990) increased the rate at which long-term unemployed leave unemployment (in some cases, byentering a labour market programme).
7. According to Winter-Ebmer and Zweimuller (1992), it is a well-known fact that individual spell durationis inversely related to the repetition factor.
8. Winter-Ebmer and Zweimuller include some control variables in their regressions, but nevertheless theserial correlation in individual unemployment experiences that they observe could reflect changes (e.g. inpersonal circumstances or occupation) that increase an individual’s risk of unemployment for some yearsat a time, rather than a causal impact of past unemployment experience on future experience.
9. The level of the Allocation spécifique de solidarité is increased by 44% for unemployed workers aged55 and over, who are also able to request exemption from job-search requirements (see the indemnisationdu chômage page at www.service-public.fr). In Spain, assistance benefits are limited in durationfor workers aged less than 52. For a concise overview of benefit provisions in EU countriessee www.europa.eu.int/comm/employment_social/missoc2001/missoc_238_en.htm and related pages. InAustralia a benefit (Mature Age Allowance) providing exemption from job-search requirements wasintroduced in 1994, and by 1999 the number of unemployment payments to the 60- to 64-year-old agegroup concerned had increased by 85%, relative to other age groups (OECD, 2001b). Reverse causalitycould also explain cross-country correlations, i.e. high unemployment among older workers tends to leadto more generous benefit arrangements for them. Brunet and Richet-Mastain (2002) document the lowhiring rates of older workers in France.
10. There are non-cash incentives for unemployed people to register in Italy and Spain, e.g. concession ratesfor public transport and eligibility for hiring subsidies. These are the only EU countries where over 80%of young adults (those aged 20 to 24) live with their parents, according to a limited set of 1987 data citedby Fernandez Cordón (2001), suggesting that parental income support substitutes for cash benefits.
11. In the European Economic Area, 76% of the unemployed are registered, and contact with the PublicEmployment Service (PES) is much the most common method of job search, concerning 75% of theunemployed (Eurostat, 2001). Many people who are registered unemployed or have UI benefits are notunemployed according to the labour force survey definition (see OECD, 2001b, note 141), and PES poli-cies are also relevant to this labour market group. Some old estimates (OECD, 1998) indicate that num-bers receiving benefits are low (less than half the numbers unemployed) in Japan, the United States,

OECD EMPLOYMENT OUTLOOK – ISBN 92-64-19778-8 – ©2002
The ins and outs of long-term unemployment – 229
Greece, Portugal and probably Spain (benefit coverage is likely to have increased in Portugal and Spainwith the introduction of new assistance benefits). Benefit coverage is also low in Korea and Italy and nearzero in Turkey and Mexico.
12. Woodbury and Rubin (1997) list some arguments for subjecting Extended Benefits to strict eligibilityrequirements and work search tests, saying that their merits are debatable.
13. Much research has attempted to determine how far negative “duration dependence” (a decline in themonthly rate of exit from unemployment with the duration of unemployment) is due to “unobserved het-erogeneity”. (AM, 2000, Box 6.7, gives an illustrative calculation of “unobserved heterogeneity” and aweb search finds many papers that apply these concepts). For example, data which do not distinguishbetween temporary layoff and permanent layoffs give a misleading impression of the extent of negativeduration dependence (Jensen and Svarer, 2001). Jansson (2002), citing US and Danish evidence, com-ments that hazard rates for [exit from unemployment] to new jobs are close to horizontal. Lacroix (1999)finds that there is no negative duration dependence among welfare recipients in Newfoundland afterallowing for observed forms of heterogeneity. Negative duration dependence, if any, seems to be a weaktendency that can be reversed by labour market policies: positive duration dependence has been observedin Sweden (when benefit duration was limited to 60 weeks) and Denmark (where benefits become aftersome time conditional on programme participation).
14. In some countries, policy analysts emphasise the importance of a very-hard-to-place group of long-termunemployed, needing assistance from several different public authorities (e.g. help from social workers aswell as employment counsellors). This concern seems to be increasingly expressed when long-termunemployment falls below 1% of the population. In Australia and the Netherlands, where jobseekers areassessed for referral to contracted intensive assistance providers, about 0.1% of the working-age popula-tion are referred to special programmes (the Personal Support Program aiming to tackle severe personalbarriers in Australia, “social activation” offering socially useful unpaid activities in the Netherlands) forpeople who are unemployed (rather than disabled) and yet are assessed as having little immediate pros-pect of a regular job (e.g. alcohol abusers).
15. Gerfin and Lechner (2001) for Switzerland and Sianesi (2002) for Sweden illustrate the pattern whereemployment rates for programme participants fall behind those of non-participants during the pro-gramme, and then catch up – partially or completely – over the next year.
16. “Activation early in the unemployment period entails a risk of retaining the individual in employabilityenhancement programmes rather than employment. This is particularly valid for those groups of unem-ployed persons who are highly like to find employment even without participating” (AM, 2000). See alsoRaïsanen (2001).
17. See Holmlund (1998). Dormont et al. (2001) and Fougère (2001) summarise similar evidence for France.
18. Exceptionally in Ireland (as in the United Kingdom, many years ago) the long-term rate of Unemploy-ment Assistance benefit (paid after 15 months) is slightly higher than the short-term rate.
19. These advantages of “workfare” targeted on the long-term unemployed, over a strategy of simply reduc-ing replacement rates, would need to be quite large to justify its much greater cost. Obligations on job-seekers to participate in employment programmes may face criticism but also have public support,e.g. see the discussion of assessments of Work for the Dole in OECD (2001b). Martin and Grubb (2001)discuss some evidence for “motivation” effects in terms of individuals leaving unemployment around,and often before, the time that their participation in programmes is scheduled to start.
20. OECD (2000, Chapter 4) describes benefit eligibility conditions in a number of countries.
21. The idea that a progressive tightening of obligations achieves a more favourable balance between the job-search incentive effects and programme cost and disutility effects is an argument against profiling, insofaras this leads to obligations being applied and costs engaged early in the unemployment spell.
22. Lalive et al. (2000) found that, in Switzerland in 1998 and 1999, after expiry of the unconditional benefitperiod the rate of entry to training courses by male unemployed increased by 47% and their rate of entryto employment programmes increased by 80%. Programme participation was often limited to a singlelabour market programme (of six months’ duration or less), rather than being continuous through to theend of the two-year benefit entitlement period.
23. An evaluation finding that early referral to temporary employment programmes is often more effectivethan referral at seven months (SECO, 2000) favoured this move to flexibility in timing.
24. In UK pilot projects, it was found that when the 10% of newly-unemployed clients of the EmploymentService with the highest estimated probabilities of remaining unemployed were selected, using a statisti-cal model, 65% of them did not subsequently enter long-term unemployment: and this method identifiedonly 19% of the clients who did in fact become long-term unemployed (Wells, 1998). Payne and Payne(2000) estimated another model and found that the 9% of new claimants with the highest predicted proba-bilities became long-term unemployed in 52% of cases, while 23% of other new claimants also became

OECD EMPLOYMENT OUTLOOK – ISBN 92-64-19778-8 – ©2002
– The ins and outs of long-term unemployment230
long-term unemployed. Berger et al. (2001) argue that accurate prediction is possible but most US stateprofiling systems do not use enough exogenous variables to achieve this.
25. According to Martin and Grubb (2001), results from two major studies of the impact of activation mea-sures suggest that proportional impacts on exit rates from unemployment to employment do not vary sys-tematically with the level of labour market disadvantage. This implies that the impact on employmentrates in absolute terms (the percentage point increase) does tend to be smaller for the more disadvantagedgroups.
26. In the evaluation reported by Eberts (2001), welfare recipients were referred to three different serviceagencies either at random (the control treatment) or according to their predicted probabilities of enteringemployment. Individuals with the lowest estimated employability were referred to the agency (Goodwill)that provided the most hours of assessment and employability planning, with an approach conducive tohelping those with fewer job-ready skills. Those with the highest employability were referred to anagency (Behavioral Foundation) which delivered services on a self-directed and self-paced basis. Assign-ing recipients to service providers in this way raised average employment outcomes compared to those ofthe control group by an estimated 25% (i.e. from 12% to 15%), mainly because Goodwill achieved betteroutcomes than other agencies for low-probability welfare recipients. These positive findings relate to apilot programme, evaluated with a relatively small sample.
27. De Koning et al. (2000) describe estimated econometric models used to calculate profiling scores in theNetherlands in the 1990s: region, education, ethnic origin and age were the most important factors deter-mining the probability that a person becomes long-term unemployed. However profiling procedures havebeen modified since then.
28. Restrictions on the variables allowed in profiling models are also an issue in the EU, where in manycountries “it is forbidden to record so-called soft characteristics and attitudes in a database due to theirstigmatising effect. Hence, alcoholic abuse, etc., must be kept separately. There is no doubt that abuses ormotivational factors have an important impact on the re-integration to the labour market. One way toreduce the problem is to (…) assign recurrent jobseekers to the same counsellor as before”. (PLSRamboll, 2001a).
29. Certain recent policy changes should help to minimise the problem of inaccurate responses by jobseekers:some new clients (older workers, parents, indigenous Australians and those recently released from prison)are now referred for a broader assessment interview to a Personal Advisor who, where appropriate,undertakes a re-classification of the initial JSCI score (FACS, 2002).
30. Some US state employment service staff are reportedly reluctant to refer some workers to more intensiveprogrammes, because obliging some claimants to participate in more services than others could be seen asunfair (OECD, 1999, pp. 115 and 120). However research suggests that customer satisfaction is higherwhen individual service plans are created and more intensive services are proposed, as the federalEmployment and Training Administration recommends (Wandner and Messenger, 1999).
31. Swedish employment offices can also place the unemployed into a category “not job ready” (OECD,2001a, p. 78).
32. The determination of “placement characteristics” in Germany often takes place fairly early in the unem-ployment spell, but practices vary by locality. A legal obligation to engage in an assessment arises aftersix months of unemployment (PLS Ramboll, 2001b).
33. Le and Miller (2001) (in line with findings by Winter-Ebmer and Zweimuller, 1992), find that a forecast-ing model that gives high weight to individual labour market history variables performs well in predictingthe number of weeks looking for work in the next calendar year. They note that it is the individual’s morerecent labour market history that is relevant: a variable summarising labour market performance since theperson first left full-time education is barely significant. Thus, gains in forecasting accuracy may beavailable by using individual history data relating to just the last few years. Their research uses retrospec-tively self-reported data and merits cross-checking in administrative data, given the low degree of corre-lation between the two Australian data sources (OECD, 2001b).
34. Roed and Nordberg (2001) also found that employees with high unemployment benefits had high rates ofrecall: this “confirms the implicit contract hypothesis and suggests that frequently dismissing firms allo-cate unemployment to workers with high benefits… it seems that while ordinary unemployment spellsare explained primarily by individual search behaviour, recall unemployment spells are largely explainedby firm behaviour (or implicit contracts between workers and firms)”. Winter-Ebmer (2002) argues thatimplicit contracting also influences permanent layoff behaviour, in the case of older workers who canexpect to draw benefits through to retirement.
35. As the contribution period increases, the ratio of the benefit period to the contribution period increases inFrance (where 14 months of contributions can be followed by 30 months of benefit) and also slightly inGreece; it is constant in Germany and Spain; and it declines in Austria (the UI period increases to39 weeks only after 6 years of contributions). Canada, the United States, Japan and the Netherlands have

OECD EMPLOYMENT OUTLOOK – ISBN 92-64-19778-8 – ©2002
The ins and outs of long-term unemployment – 231
relatively complex schedules. In most other countries this ratio declines rapidly, since potential benefitduration does not vary at all with the contribution period.
36. Some administrative statistics discount short breaks in the unemployment spell. EC (2001) treats the Bel-gian rule that unemployment breaks under three months are not counted as exits from registered unem-ployment as exceptional. In Denmark, the long-term unemployed are defined as those who have beenunemployed more than 80% of the year. Policy analysis has also focused attention on the “marginalgroup” who were unemployed more than 70% of the time (or either unemployed or in a programme morethan 80% of the time) over a 3-year period (FM, 1997; AM, 2000).
37. OECD (1994a, Table S) gave statistics for the incidence of long-term unemployment in registration datafor seven European countries: the incidence of long-term unemployment was always lower in registrationdata than in labour force survey data, with discrepancies exceeding 10 percentage points in Germany,Ireland, and the United Kingdom. Teasdale (1998) notes this discrepancy in UK longitudinal data.Respondents to the German “Structure of unemployment in early 2000 survey” appear not to reportbreaks in unemployment due to illness or failure to report to the employment office (advice from nationalauthorities). Karr (1997) claims that the duration of unemployment as reported in questionnaire responseswill always be longer than the duration of registered unemployment because respondents do not considerinterruptions such as illness and failing to register to be interruptions of their unemployment. Howeversome factors could generate the opposite result, e.g. part-time work breaks the unemployment spell inlabour force survey data but it can be compatible with continuing unemployment in registration data, andpolicies in some countries (e.g. Australia and France) encourage this.
38. Eurostat (1987) reported that people on courses to improve their qualifications were no longer classifiedwith the registered unemployed, except (in Greece, Italy, Luxembourg, Denmark, Spain and the Nether-lands) if participants continue to receive unemployment benefit or if the course is held in PES centres.People in subsidised employment were not counted among the registered unemployed.
39. OECD (1993) reported that the “temporary” jobs created “turned out to be very difficult to terminate andthere is no desire to have further experiences of this sort”.
40. In Sweden a large rise in the proportion of unemployed people qualifying for UI preceded the recessionof the early 1990s, and this might be related to deregulation and increased use of fixed-term contracts(OECD, 1994b, p. 198). In Italy claims for ordinary unemployment benefit with reduced requirements(for people who employed between three and six months in the year) more than doubled between 1991and 1999 and in 1999 these claims accounted for over half total spending on ordinary unemployment ben-efit (a quarter of spending on all types of unemployment benefits: numbers on the benefits restricted tovictims of layoffs for economic reasons, CIG and mobility, have been falling since 1994). The growth oftemporary labour, creating a continuous flow of persons who have acquired the right to benefits, probablycontributed to this (MLPS, 2000). As mentioned in Section 1.C these claims are often repeated.
41. Seasonal employment raises similar issues. Some countries (Australia, France, and Norway) have definedpatterns of seasonal work that preclude the receipt of unemployment benefit. In Australia, since 1999people who have been engaged in high-income seasonal work in the six months prior to claiming allow-ances have to use that income before accessing allowances. Such definitions seem to be quite difficult toapply in practice. However, benefit legislation usually has no specific provisions for employment onfixed-term contracts.
42. In Belgium, arrangements allowing local authorities to employ Minimex recipients for long enough forthem to accrue entitlement to UI benefits are officially codified in Article 60 of the 1976 legislationwhich governs social assistance. In Canada, employment programmes for social assistance recipientsappear to pay Employment Insurance contributions: for example in Prince Edward Island “There is moretracking by welfare staff now to ensure that [social assistance] individuals qualify for EI through EEP/JCP [Employment Enhancement and Job Creation] placements” (publish.uwo.ca/~pomfret/wtw/html/provsum/phase2.html). In Germany, an estimated 46% of social assistance recipients who are in a labourmarket programme are in insured work with a regular contract, typically lasting a year, which qualifiesthe participants for UI. In Switzerland, as of December 1998, the town of Geneva was employing 310 UIexhaustees in temporary jobs with a maximum duration of 12 months (www.ville-ge.ch/geneve/chomage/f_action.htm), which is the minimum duration of contributions to requalify for UI benefits. In Finland,also, municipalities may provide UI exhaustees with enough employment (additional to qualifyingemployment provided by national PES programmes) to requalify them for UI benefits.
43. In 2000, Germany passed a Law for the Improvement of Co-operation between the Employment Officesand Social Assistance Authorities with this aim.

OECD EMPLOYMENT OUTLOOK – ISBN 92-64-19778-8 – ©2002
– The ins and outs of long-term unemployment232
Annex 4.A
The full range of possible categories in the Eurostat Main Labour Status variable are as follows:
• Carries out a job or profession, including unpaid work for a family, business or holding, including anapprenticeship or paid traineeship, etc.
• Unemployed.
• Pupil, student, further training, unpaid work experience.
• In retirement or early retirement or has given up business.
• Permanently disabled.
• In compulsory military service.
• Fulfilling domestic tasks.
• Other inactive person.
• Not applicable (child less than 15 years).
The guidelines (Eurostat, 1998) explain that “The ‘main activity status’ gives each person’s self-perceptionregarding his/her activity status; for instance, it identifies students with small jobs who are more closely asso-ciated with other students than with other employed persons”. Most of the EU member states have a singlequestion which follows the above list more or less closely. The guidelines ask for it to be placed after the mainquestions on “ILO labour force status”, relating to classification as employed, unemployed or out of the labourforce. However, in practice, some put it before, and this may have an influence on the results.
In principle, long-term unemployment should be a subset of the “unemployed” category of the MainLabour Status variable. A check shows that there is only a little overlap with other categories of the MainLabour Status variable. The largest overlaps, in terms of men aged 25-54, are with employment (CzechRepublic), education (Sweden) and “other inactive” (Belgium), in all cases at around 0.3% of the populationof working age.
Data for the Main Labour Status variable in Table 4.2

OECD EMPLOYMENT OUTLOOK – ISBN 92-64-19778-8 – ©2002
The ins and outs of long-term unemployment – 233
Annex 4.B
“Seam effects” are a well-known phenomenon in survey data where respondents are asked to recallevents that occurred prior to the interview. Frequently, respondents report unchanged labour market statusover the reference period back to the previous interview date, so that transitions are reported to occur just afterthis date. Cognitive research suggests that respondents forget information within the response interval, andbias their reporting when they can no longer remember correct answers (Rips et al., 2000). Respondents mayeven have no meaningful basis for reporting detailed month-by-month changes in status if survey categoriescorrespond poorly with reality as they perceived it, e.g. because the respondent had irregular work while alsoseeking regular work, but questions do not recognise this status.
In the ECHP, surveys go into the field between March and September and ask respondents to recall theirlabour market status month by month over the preceding calendar year, so the presence of seam effects at thebeginning and end of calendar years is not surprising (Fisher et al., 2000). The analysis here uses ECHP datafor the years 1994 to 1997 (waves 2 to 5 of the survey, 1995 to 1998). All spells of long-term unemployment(12 or more continuous months unemployed) were identified and the distribution of these spells by start andtermination month was examined (discarding starts/terminations in January 1994 and December 1997, whereobservations are truncated). The relative frequency of January as a start month and December as a terminationmonth in the unweighted data is shown in Table 4.B.1.
Only in UK and in French data are reported transitions (nearly) equally frequent in all months of theyear. In countries where ratios in Table 4.B.1 are over 11, more than half of all entries to and exits from spellsof long-term unemployment were reported to occur in January. Reported transition rates are near evenly dis-tributed across the remaining months, rising slightly in the summer months and shortly afterwards (July toOctober). One important consequence of the seam effects is that – when a person reporting unemployment ineach month of one year is counted as being long-term unemployed for the first time in December – the totalnumber of long-term unemployed is on average one-third higher in December than in other months.
Labour market transitions in European CommunityHousehold Panel data
Table 4.B.1. Relative frequency of end-year starts and terminations of long-term unemployment spells in ECHP data
ECHP: European Community Household Panel.a) Unweighted average of countries shown.Source: OECD calculations based on the European Community Household Panel, waves 2 to 5.
Ratio of starts of long-term unemployment spells in January 1995, 1996 and 1997 to average starts
in the preceding 11 months
Ratio of terminations of long-term unemployment spells in December 1994, 1995 and 1996 to average terminations
in the following 11 months
Austria 3.4 10.9Belgium 12.3 23.0Denmark 8.0 15.4France 2.2 1.8Germany 7.8 3.8Greece 15.8 43.4Ireland 8.0 6.3Italy 22.8 28.1Portugal 6.6 15.3Spain 18.6 21.9United Kingdom 0.7 1.2ECHPa 9.7 15.6
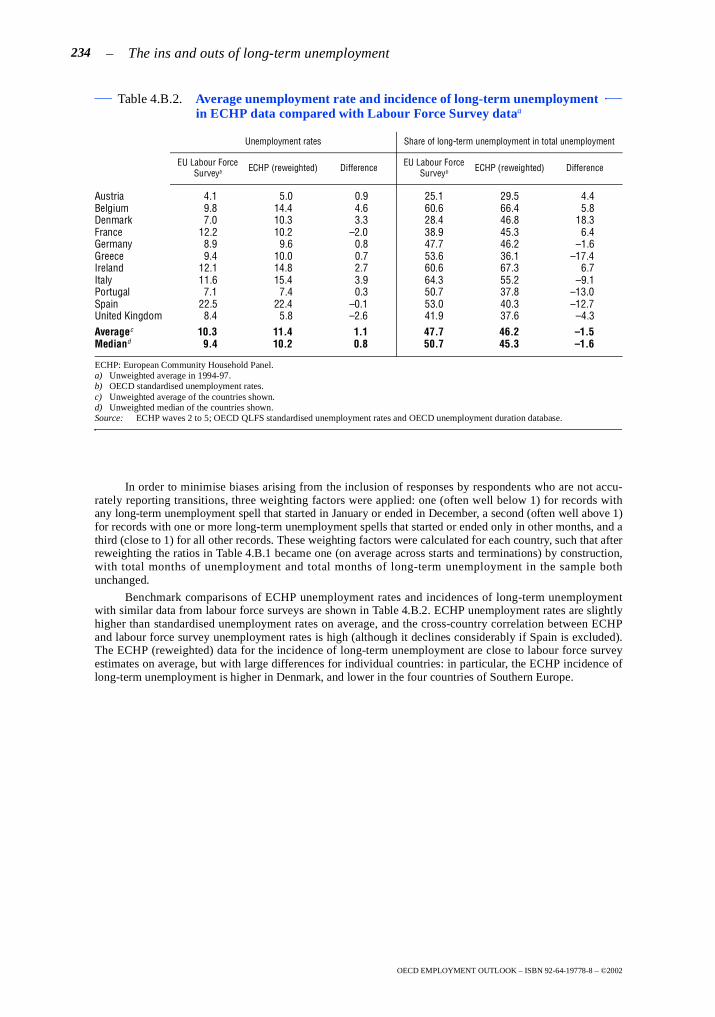
OECD EMPLOYMENT OUTLOOK – ISBN 92-64-19778-8 – ©2002
– The ins and outs of long-term unemployment234
In order to minimise biases arising from the inclusion of responses by respondents who are not accu-rately reporting transitions, three weighting factors were applied: one (often well below 1) for records withany long-term unemployment spell that started in January or ended in December, a second (often well above 1)for records with one or more long-term unemployment spells that started or ended only in other months, and athird (close to 1) for all other records. These weighting factors were calculated for each country, such that afterreweighting the ratios in Table 4.B.1 became one (on average across starts and terminations) by construction,with total months of unemployment and total months of long-term unemployment in the sample bothunchanged.
Benchmark comparisons of ECHP unemployment rates and incidences of long-term unemploymentwith similar data from labour force surveys are shown in Table 4.B.2. ECHP unemployment rates are slightlyhigher than standardised unemployment rates on average, and the cross-country correlation between ECHPand labour force survey unemployment rates is high (although it declines considerably if Spain is excluded).The ECHP (reweighted) data for the incidence of long-term unemployment are close to labour force surveyestimates on average, but with large differences for individual countries: in particular, the ECHP incidence oflong-term unemployment is higher in Denmark, and lower in the four countries of Southern Europe.
Table 4.B.2. Average unemployment rate and incidence of long-term unemployment in ECHP data compared with Labour Force Survey dataa
ECHP: European Community Household Panel.a) Unweighted average in 1994-97.b) OECD standardised unemployment rates.c) Unweighted average of the countries shown.d) Unweighted median of the countries shown.Source: ECHP waves 2 to 5; OECD QLFS standardised unemployment rates and OECD unemployment duration database.
Unemployment rates Share of long-term unemployment in total unemployment
EU Labour Force Surveyb ECHP (reweighted) Difference EU Labour Force
Surveyb ECHP (reweighted) Difference
Austria 4.1 5.0 0.9 25.1 29.5 4.4Belgium 9.8 14.4 4.6 60.6 66.4 5.8Denmark 7.0 10.3 3.3 28.4 46.8 18.3France 12.2 10.2 –2.0 38.9 45.3 6.4Germany 8.9 9.6 0.8 47.7 46.2 –1.6Greece 9.4 10.0 0.7 53.6 36.1 –17.4Ireland 12.1 14.8 2.7 60.6 67.3 6.7Italy 11.6 15.4 3.9 64.3 55.2 –9.1Portugal 7.1 7.4 0.3 50.7 37.8 –13.0Spain 22.5 22.4 –0.1 53.0 40.3 –12.7United Kingdom 8.4 5.8 –2.6 41.9 37.6 –4.3Averagec 10.3 11.4 1.1 47.7 46.2 –1.5Mediand 9.4 10.2 0.8 50.7 45.3 –1.6
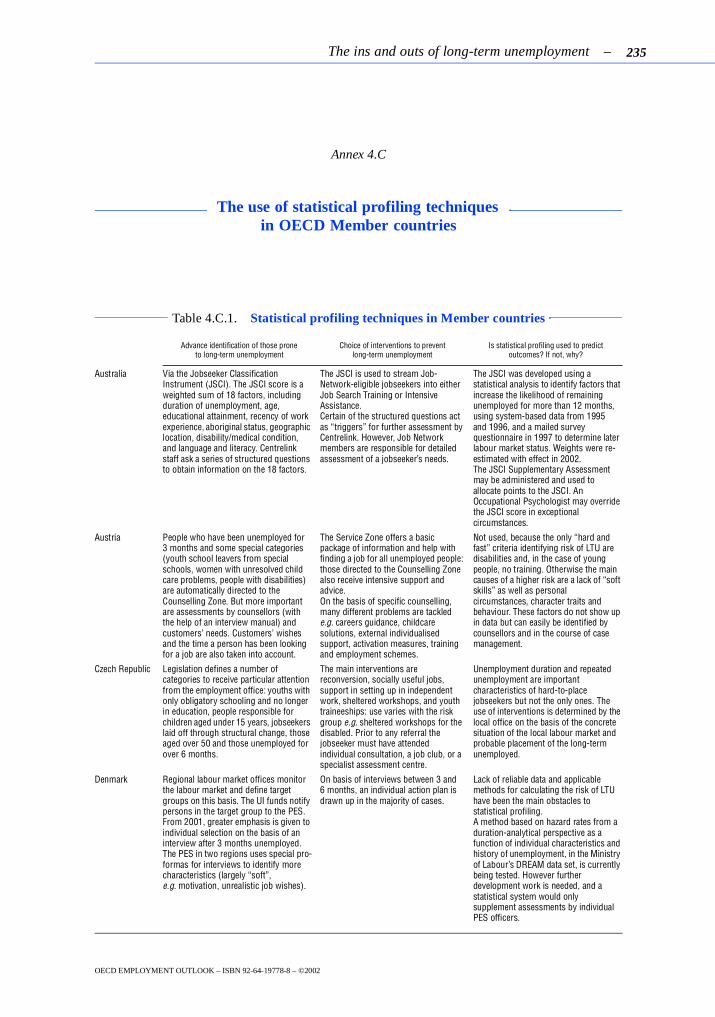
OECD EMPLOYMENT OUTLOOK – ISBN 92-64-19778-8 – ©2002
The ins and outs of long-term unemployment – 235
Annex 4.C
The use of statistical profiling techniques in OECD Member countries
Table 4.C.1. Statistical profiling techniques in Member countries
Advance identification of those prone to long-term unemployment
Choice of interventions to prevent long-term unemployment
Is statistical profiling used to predict outcomes? If not, why?
Australia Via the Jobseeker Classification Instrument (JSCI). The JSCI score is a weighted sum of 18 factors, including duration of unemployment, age, educational attainment, recency of work experience, aboriginal status, geographic location, disability/medical condition, and language and literacy. Centrelink staff ask a series of structured questions to obtain information on the 18 factors.
The JSCI is used to stream Job-Network-eligible jobseekers into either Job Search Training or Intensive Assistance.Certain of the structured questions act as “triggers” for further assessment by Centrelink. However, Job Network members are responsible for detailed assessment of a jobseeker’s needs.
The JSCI was developed using a statistical analysis to identify factors that increase the likelihood of remaining unemployed for more than 12 months, using system-based data from 1995 and 1996, and a mailed survey questionnaire in 1997 to determine later labour market status. Weights were re-estimated with effect in 2002.The JSCI Supplementary Assessment may be administered and used to allocate points to the JSCI. An Occupational Psychologist may override the JSCI score in exceptional circumstances.
Austria People who have been unemployed for 3 months and some special categories (youth school leavers from special schools, women with unresolved child care problems, people with disabilities) are automatically directed to the Counselling Zone. But more important are assessments by counsellors (with the help of an interview manual) and customers’ needs. Customers’ wishes and the time a person has been looking for a job are also taken into account.
The Service Zone offers a basic package of information and help with finding a job for all unemployed people: those directed to the Counselling Zone also receive intensive support and advice.On the basis of specific counselling, many different problems are tackled e.g. careers guidance, childcare solutions, external individualised support, activation measures, training and employment schemes.
Not used, because the only “hard and fast” criteria identifying risk of LTU are disabilities and, in the case of young people, no training. Otherwise the main causes of a higher risk are a lack of “soft skills” as well as personal circumstances, character traits and behaviour. These factors do not show up in data but can easily be identified by counsellors and in the course of case management.
Czech Republic Legislation defines a number of categories to receive particular attention from the employment office: youths with only obligatory schooling and no longer in education, people responsible for children aged under 15 years, jobseekers laid off through structural change, those aged over 50 and those unemployed for over 6 months.
The main interventions are reconversion, socially useful jobs, support in setting up in independent work, sheltered workshops, and youth traineeships: use varies with the risk group e.g. sheltered workshops for the disabled. Prior to any referral the jobseeker must have attended individual consultation, a job club, or a specialist assessment centre.
Unemployment duration and repeated unemployment are important characteristics of hard-to-place jobseekers but not the only ones. The use of interventions is determined by the local office on the basis of the concrete situation of the local labour market and probable placement of the long-term unemployed.
Denmark Regional labour market offices monitor the labour market and define target groups on this basis. The UI funds notify persons in the target group to the PES. From 2001, greater emphasis is given to individual selection on the basis of an interview after 3 months unemployed. The PES in two regions uses special pro-formas for interviews to identify more characteristics (largely “soft”, e.g. motivation, unrealistic job wishes).
On basis of interviews between 3 and 6 months, an individual action plan is drawn up in the majority of cases.
Lack of reliable data and applicable methods for calculating the risk of LTU have been the main obstacles to statistical profiling.A method based on hazard rates from a duration-analytical perspective as a function of individual characteristics and history of unemployment, in the Ministry of Labour’s DREAM data set, is currently being tested. However further development work is needed, and a statistical system would only supplement assessments by individual PES officers.

OECD EMPLOYMENT OUTLOOK – ISBN 92-64-19778-8 – ©2002
– The ins and outs of long-term unemployment236
Table 4.C.1. Statistical profiling techniques in Member countries (cont.)
Advance identification of those prone to long-term unemployment
Choice of interventions to prevent long-term unemployment
Is statistical profiling used to predict outcomes? If not, why?
Finland As early as possible, the jobseeker is invited to an interview where a skill-mapping and personal job-seeking plan are made. There is an obligation to participate in drawing up the plan after five months at the latest. From 2001, in relevant cases, this can be replaced by an “activation plan” which also involves municipality.
The jobseeking plan should be as concrete as possible (job-seeking course, vocational training, subsidised work, etc.). It is a precondition for assignment to employment promotion measures.
Profiling of the unemployed has been discussed very much but the general opinion is that classifying clients or predicting outcomes will be problematic, for both officials and clients. However a method for estimating the quality and quantity of service needs is under development and will be tested during the year 2002.
France From 2001, a personalised action plan (PAP) is established through an in-depth interview which takes place within a month after registration.
The PAP identifies services the jobseeker needs and any potential risk of LTU.
Two approaches are envisaged: (a) a statistical approach, used to enhance and facilitate the employment officer’s assessment: in some 70% of cases it appears possible to forecast LTU using administrative data; (b) the formalisation of the interview procedure.
Germany There exist national “placement-relevant criteria”, i.e. whether an unemployed person is considered to be “someone whom may be placed without restriction”, whether “support is necessary/useful” or “qualification measures have to be provided”.
The AQTIV Act envisages from 2002 a “profiling” procedure at the beginning of unemployment to identify jobseeker strengths and weaknesses and the risk of LTU.
The “placement-relevant criteria” are starting-points for a classification of unemployed people according to the type of services to be provided. After 6 months the employment office must establish, together with the unemployed person, by which measures, benefits or own efforts LTU can be avoided. The AQTIV “profiling” procedure will set out the individual placement strategy in an integration agreement.
There is no forecasting procedure on a national scale, but a number of regions are testing techniques.
The AQTIV Act foresees a uniform and sound procedure for the identification of the risk of LTU.
Greece Reference to introduction of “personalised approach”.
Not yet developed.
Hungary No formal method. The main interventions are:1. subsidy for intensive job search,2. labour market services (providing information, labour exchange, counselling for finding job).
Not yet developed.
Iceland Those who are unemployed for 6 to 7 months attend a 4-day course to prevent them from becoming LTU.
Some labour market measures are intended for certain groups e.g. women in rural areas or young people.
Not necessary in view of small number of unemployed in Iceland.
Ireland No system of advance identification. Referrals to measures are made on the basis of the actual duration of unemployment.
A pilot scheme is being examined.
Italy No. Individual characteristics of unemployed are to be taken into account, with special attention to the LTU.
No.
Japan No. No. No. The reasons for unemployment are very varied, so the emphasis is placed on individual situations.
Korea The subsidy for employment promotion was targeted originally on workers unemployed for a year or more who had been referred to jobs three times. Since 2001 all those unemployed for more than six months are eligible.
Appreciation of counsellors. A programme to predict the probability of LTU has been used since July 2000. It uses age, education, health, sex, relation with head of household, marital status, and 5 work experience and 3 local labour market variables. An evaluation of its predictive power is not yet available. The system is voluntary for the unemployed and advisory for counsellors.
Luxembourg Early identification is through the “psycho-social support scheme” applied after a maximum of 3 months to youths and 6 months to adults.
Psychologists, teachers, social workers and doctors provide personalised support.
No. Thanks to the low level of unemployment, the services can easily see the registered population at any time.

OECD EMPLOYMENT OUTLOOK – ISBN 92-64-19778-8 – ©2002
The ins and outs of long-term unemployment – 237
Table 4.C.1. Statistical profiling techniques in Member countries (cont.)
Advance identification of those prone to long-term unemployment
Choice of interventions to prevent long-term unemployment
Is statistical profiling used to predict outcomes? If not, why?
Mexico State employment services detect people that have more difficulties for job search training.
Access to other programmes is by personal application conditional on screening criteria.
Data are used for aggregate analysis of the labour market to guide public policy, not for individual prediction. Automated evaluation of the capabilities of employment applicants is under consideration.
Netherlands The “chance meter” is based on a questionnaire, with instructions to the counsellor on how to calculate a score. The score classifies the person into one of four groups. Groups 2 and 3 are considered placeable but at risk of LTU.
Group 1 receives no intervention until after six months of unemployment. In other cases the counsellor decides on appropriate labour market or other measures.
The questionnaire responses are scored as described, but an econometric model is not used.
New Zealand The counsellor enters the jobseeker’s answers to multiple-choice questions into the SOLO computer system, which allocates a Service Group Indicator (SGI) rating. Staff may overwrite SGI assessments, but they have to provide a reason for doing so. The key difference between SGI 1 (highly employable) and 2 (easily employable) is willingness. The key differences between SGI 3 (employable) and SGI 4 (employable with assistance) are capacity and opportunity. SGI 4 is considered to be at risk of LTU.
Short-term jobseekers who achieve a certain SGI rating may be eligible for more expensive help (e.g. wage subsidies). The Case Manager carries out a secondary assessment of SGI 4 people to help select the appropriate intervention. Access to particular programmes is subject to ministerial eligibility criteria, which are based on some of the SGI ratings, categorical factors (age, disability, literacy barriers, etc.), and disadvantage in the local labour market (as assessed by the Case Manager).
All items in the SGI scoring system were selected according to “their capacity to predict unemployment and their usefulness in client management as determined by staff consultation, regression analysis and the review of literature”. OPRA Consulting Group (1998) concluded that it is possible, with the right tools, to predict fairly accurately those at risk and those not at risk. There has been some tracking of cohorts to investigate whether SGI rating predicts time on benefit.
Norway An individual approach is used, with an interview after three months unemployed.
The underlying principle is that services should be offered related to the individual jobseeker’s situation and competencies.
No. It is better to trust the discretion of the local officer particularly when there is low unemployment and more time to process each case. Profiling would complicate co-operation between the local office and jobseeker in the development of the individual action plan.
Portugal Registered unemployed are given a code from 1 to 5: codes 4 or 5 are more likely to enter LTU. These indicators are combined with information about the local labour market.
For each standardised group, guidelines describe appropriate operating strategies. Job centres apply qualitative knowledge of the local market and applicant files, and set up personalised and integrated interventions.
The profiling method was evaluated on the basis of a survey of unemployed people, and another of the “CTE” finding that unemployed difficult to place in the labour market did have expected profile.
Slovak Republic Counsellors identify the risk of LTU informally on the basis of four factors: a) a long history of permanent employment; b) low education; c) personal, social and health obstacles; d) attitude and opinions on the “world of labour”.
Statistical systems are being improved, both for purposes of aggregate analysis, and to make measures more effective through better knowledge of the characteristics and behaviour of different groups among the unemployed.
Spain No formal method – action plan based on intensive interviews.
Only on aggregate basis, as part of assessment of employability of person.
Sweden No formal method. No formal method. However, employment service officers do make estimates as to whether a person is likely to become LTU or not and provide the Activities Guarantee Programme (since August 2000) if this is the case. There is also the Employment Support programme of subsidies.
No, but it appears that some method of aggregate statistical profiling, used for the distribution of resources, may be developed as the basis for a system to “support the employment officer better make use of her/his knowledge and experience”. They note that commuting patterns are an important element on which they have no data at the National Labour Market Board, so not all important variables could be included. But they say that “a systemic pattern has to be developed in the way employment officers judge various cases”.

OECD EMPLOYMENT OUTLOOK – ISBN 92-64-19778-8 – ©2002
– The ins and outs of long-term unemployment238
Table 4.C.1. Statistical profiling techniques in Member countries (cont.)
Source: Secretariat summary of responses to a questionnaire addressed to national labour market authorities in 2001.
Advance identification of those prone to long-term unemployment
Choice of interventions to prevent long-term unemployment
Is statistical profiling used to predict outcomes? If not, why?
United Kingdom No formal process, but access to mainstream programmes for everyone after 6 months. For adults the range and the intensity of help builds up from that point, culminating in access (compulsory) to the New Deal for long-term unemployed adults at 18 months. For young people, access to the New Deal for Young People occurs at 6 months.
Not used because considered insufficiently precise. Issue has been investigated thoroughly, and papers are available.
United States Formal method – worker profiling programme established by law in 1993, made mandatory for State Agencies charged with administration of state unemployment compensation law.
No formal method, but DoL is testing an automated decision support system for staff in One-Stop Centres. It will help workers search for work in their “prior occupation and related occupations” and help to determine which services will help them find work in a cost-effective manner. Not clear that this is just for the LTU.
Identification of those individuals who are likely to exhaust their UI benefits and would benefit from reemployment services, using individual characteristics and local labour market conditions. Leads to mandatory orientation and assessment – at which time PES staff may use their judgement. Studies of predictive power exist.

OECD EMPLOYMENT OUTLOOK – ISBN 92-64-19778-8 – ©2002
The ins and outs of long-term unemployment – 239
BIBLIOGRAPHY
ACKUM AGELL, S., BJÖRKLULND, A. and HARKMAN, A. (1995),“Unemployment Insurance, Labour Market Programmes and Repeated Unemployment in Sweden”,Swedish Economic Policy Review, Vol. 2, pp. 101-128.
AHO, S., HALME, J. and NÄTTI, J. (1999),“Tukityöllistämisen ja työvoimakoulutuksen kohdentuminen ja vaikuttavuus 1990-1996” (Targeting andEffectiveness of Labour Market Training and Subsidised Employment in 1990-1996), Studies in LabourPolicy, No. 207, Ministry of Labour, Helsinki.
ALLAIRE, G., CAHUZAC, E. and TAHAR, G. (2000),“Persistance du chômage et insertion”, L’Actualité économique, Vol. 76, No. 2, June, pp. 237-263.
AM (Danish Ministry of Labour) (2000),Effects of Danish Employability Enhancement Programmes, Copenhagen (www.am.dk/english/publications/effects/eodeep.pdf).
BÉDARD, M., BERTRAND, J.-F. and GRIGNON, L. (2000),The Unemployed Without Recent Employment, HRDC Applied Research Branch Papers W-00-4E, March(www.hrdc-drhc.gc.ca/arb/publications/research/2000docs/abw-00-4e.shtml).
BERGER, M., BLACK, D. and SMITH, J. (2001),“Evaluating Profiling as a Means of Allocating Government Services”, in F. Pfeiffer and M. Lechner(eds.), Econometric Evaluations of Active Labour Market Policies in Europe, Physica, Heidelberg,pp. 59-84.
BLACK, D., SMITH, J., BERGER, M. and NOEL, B. (1999),“Is the Threat of Training More Effective than Training Itself? Experimental Evidence from the UISystem”, Universi ty of Western Ontar io Department of Economics, Working Paper 99-13(www.ssc.uwo.ca/economics/econref/html/WP99/wp9913.pdf).
BRODSKY, M. (2001),“Public-Service Employment Programs in Selected OECD Countries”, Monthly Labor Review, October,pp. 31-41.
BRUNET, F. and RICHET-MASTAIN, L. (2002),“L’âge des salariés joue surtout à l’embauche”, INSEE, Premières Synthèses, April, No. 15.3(www.travail.gouv.fr/etudes/etudes_h.html).
CEIC (Canada Employment Insurance Commission) (2000),Employment Insurance 2000 Monitoring and Assessment Report, HRDC Labour Market PolicyDirectorate (www.hrdc-drhc.gc.ca/ae-ei/loi-law/eimar.shtml).
CLARK, A. and OSWALD, A. (1994),“Unhappiness and Unemployment”, Economic Journal, No. 104, pp. 648-659.
CORAK, M. (1993),“Unemployment Insurance Once Again: The Incidence of Repeat Participation in the Canadian UIProgram”, Canadian Public Policy, Vol. 19, No. 2, pp. 162-176.
CORAK, M. (1995),“Unemployment Insurance, Temporary Layoffs and Recall Expectations”, HRDC (www11.hrdc-drhc.gc.ca/edd/TLRE.shtml).
CORAK, M. and HEISZ, A. (1996),“Alternative Measures of the Average Duration of Unemployment”, Review of Income and Wealth,Series 42, No. 1, pp. 63-74.
DE KONING, J., VAN DE VEEN, C. and WIJDEVELD, M. (2000),“Long-term Unemployment Benchmarking Study”, Report by the NEI Division of Labour and Educationfor the European Commission, mimeo.
DEWRSB (2001),Job Matching: A Stepping Stone to a Better Future?, Evaluation and Program Performance Branch Report4/2001 (www.workplace.gov.au).

OECD EMPLOYMENT OUTLOOK – ISBN 92-64-19778-8 – ©2002
– The ins and outs of long-term unemployment240
DORMONT, B., FOUGÈRE, D. and PRIETO, A. (2001),“L’effet de l’allocation unique dégressive sur la reprise d’emploi”, Economie et statistique, No. 343,pp. 3-28.
EBERTS, R. (2001),“Design, Implementation, and Evaluation of the Work – First Profiling Pilot Project”, Report prepared forthe Employment and Training Administration, US Department of Labor, W. E. Upjohn Institute forEmployment Research, Kalamazoo, Michigan (www.upjohninst.org/cproject.html).
EC (1999),“Proposal for Guidelines for Member States’ Employment Policies 2000” (europa.eu.int/comm/employment_social/empl&esf/empl2000/eg2000_en.pdf).
EC (2001),“Assessment of the Implementation of the 2001 Employment Guidelines: Supporting Document to theJoint Employment Report 2001”, SEC(2001)1398.
EUROSTAT (1987),Schemes with an Impact on the Labour Market and their Statistics Treatment in the Member States of theEuropean Community, Office for Official Publications of the European Communities, Luxembourg.
EUROSTAT (1998),The European Union Labour Force Survey – Methods and Definitions 1998, Office for OfficialPublications of the European Communities, Luxembourg.
EUROSTAT (2001),Labour Force Survey Results 2000, Office for Official Publications of the European Communities,Luxembourg.
FACS (Department of Family and Community Services) (2002),“Submission to the Productivity Commission Review of the Job Network” (www.pc.gov.au/inquiry/jobnetwork/subs/sub042.pdf).
FERNANDEZ CORDÓN, J. (2001),“Youth as a Transit ion to Ful l Autonomy”, Family Observer, No. 3 (europa.eu.int/comm/employment_social/eoss/publications_en.html).
FISHER, K., FOUARGE, D., MUFFELS, R. and VERMA, V. (2000),“Examining Flexible Labour in Europe: The First Three Waves of the ECHP” (paper prepared in thecontext of the project “ECHP – Flexible Labour and Its Impact on Earnings and Poverty”.
FM (Finance Ministry) (1997),“The Danish Economy – Medium Term Economic Survey” (www.fm.dk/udgivelser/publikationer/FR97/uk/index.htm).
FOUGÈRE, D. (2001),“La durée du chômage en France”, Réduction du chômage: les réussites en Europe, Conseil d’analyseéconomique (www.ladocfrancaise.gouv.fr/pdf/0040014.71/pdf/0000.pdf).
FREDRIKSSON, P. and HOLMLUND, B. (2001),“Optimal Unemployment Insurance in Search Equilibrium”, Journal of Labor Economics, Vol. 19, No. 2,pp. 370-399.
GERFIN, M. and LECHNER, M. (2001),“Microeconomic Evaluation of the Active Labour Market Policy in Switzerland” (revised version of IZADiscussion Paper No. 154, www.iza.org).
GOBBI, M. and REA, D. (2000),“Unemployment Dynamics in New Zealand”, mimeo.
GRAY, D. and SWEETMAN, A. (2001),“A Typology Analysis of the Users of Canada’s Unemployment Insurance System: Incidence andSeasonality Measures”, in S. Schwartz and A. Aydemir (eds.), Essays on the Repeat Use of UnemploymentInsurance, SRDC, Ottawa, pp. 15-61 (www.srdc.org/english/publications/ publications.htm).
HDRC (2001),“Proposed Changes to the Employment Insurance Act”, news release, 2 February (www.hrdc-drhc.gc.ca/common/news/insur/01-05.shtml).
HOLMLUND, B. (1998),“Unemployment Insurance in Theory and Practice”, Scandinavian Journal of Economics, Vol. 100, No. 1,pp. 113-141 (www.nek.uu.se/Pdf/1997wp25.pdf).

OECD EMPLOYMENT OUTLOOK – ISBN 92-64-19778-8 – ©2002
The ins and outs of long-term unemployment – 241
JANSSON, F. (2002),“Rehires and Unemployment Duration on the Swedish Labour Market – New Evidence of TemporaryLayoffs”, Labour, Vol. 16, No. 2.
JENSEN, P. and SVARER, M. (2001),“Short and Long-Term Unemployment: How do Temporary Layoffs Affect this Distinction?”, EmpiricalEconomics (www.cls.dk/~msn/mptxt.pdf).
KARR, W. (1997),“Conceptual Problems in the Understatement of Long-Term Unemployment”, IAB Topics No. 21(www.iab.de/iab/publikationen/inhtopics.htm).
KLEMMER, P. and WINK, R. (2001),Preventing Unemployment in Europe: A New Framework for Labour Market Policy, Edward Elgar,Cambridge.
LACROIX, G. (1999),“The Dynamics of Welfare Participation in Newfoundland: 1986-1998” (www.hrdc-drhc.gc.ca/arb/publications/research/alph_e.shtml).
LALIVE, R., VAN OURS, J. and ZWEIMULLER, J. (2000),“The Impact of Active Labor Market Programs and Benefit Entitlement Rules on the Duration ofUnemployment”, Tilburg University Center for Economic Research Discussion Paper 2000-41(greywww.kub.nl:2080/greyfiles/center/2000/41.html).
LE, A. and MILLER, P. (2001),“Is a Risk Index Approach to Unemployment Possible?”, The Economic Record, Vol. 77, No. 236, March,pp. 51-70.
MACHIN, S. and MANNING, A. (1999),“The Causes and Consequences of Long-Term Unemployment in Europe”, in O. Ashenfelter and D. Card(eds.), Handbook of Labor Economics, Vol. 3, Elsevier Science.
MARTIN, J. and GRUBB, D. (2001),“What Works and for Whom: A Review of OECD Countries’ Experiences with Active Labour MarketPolicies”, IFAU Working Paper 2001:14 (www.ifau.se/eng/index.html).
MAVROMARAS, K. and RUDOLPH, H. (1998),“Verteilungseffekte der Arbeitslosenversicherung in Deutschland in den 80er Jahren”, MittAB, 31. Jg.,Vol. 1, pp. 93-107.
MEYER, B. and ROSENBAUM, D. (1996),“Repeat Use of Unemployment Insurance”, NBER Working Paper 5423.
MLPS (Ministero del Lavoro e Della Previdenza Sociale) (2000),Rapport di monitoraggio sulle politiche occupazionali e del lavoro, No. 2 (www.minwelfare.it/minlavoro/reti/ret-StudiRicerche.asp: summary available in English).
OECD (1983),Employment Outlook, Paris.
OECD (1985),Employment Outlook, Paris.
OECD (1993),The Public Employment Service in Japan, Norway, Spain and the United Kingdom, Paris.
OECD (1994a),Employment Outlook, Paris.
OECD (1994b),The OECD Jobs Study, Part 2, Paris.
OECD (1996),The Public Employment Service: Denmark, Finland, Italy, Paris.
OECD (1998),The Public Employment Service: Greece, Ireland, Portugal, Paris.
OECD (1999),The Public Employment Service in the United States, Paris.
OECD (2000),Employment Outlook, Paris (Chapter 4 at www.oecd.org/pdf/M00028000/M00028078.pdf).
OECD (2001a),Labour Market Policies and the Public Employment Service, Paris.

OECD EMPLOYMENT OUTLOOK – ISBN 92-64-19778-8 – ©2002
– The ins and outs of long-term unemployment242
OECD (2001b),Innovations in Labour Market Policy: The Australian Way, Paris.
OPRA Consulting Group (1998),“Forecasting Individual Long-Term Unemployment: A Report Prepared for Work and Income NewZealand”, mimeo.
PAYNE, C. and PAYNE, J. (2000),Early Identification of the Long-Term Unemployed, PSI Research Discussion Paper, No. 4, PSI, London(www.psi.org.uk/publications/publ.htm).
PEDERSEN, P. (1994),“Persistent Unemployment – Aspects of the Danish Experience”, in T. Eriksson, S. Leppänen andP. Tossavainen (eds.), Proceedings of the Symposium on Unemployment, Government Institute forEconomic Research, Helsinki.
PLS RAMBOLL (2001a),Study on Early Identification of High Risk Unemployed Final Report (www.pls-ramboll.com/homepage/uk/publications/).
PLS RAMBOLL (2001b),Study on Early Identification of High Risk Unemployed: Annex Report I (www.pls-ramboll.com/homepage/uk/publications/).
RAÏSANEN, H. (2001),“Implementation Issues in Finland: Experiences, Developments and Context of Labour Market PolicyMeasures”, Labour Market Policies and the Public Employment Service, OECD, Paris.
RIPS, L., CONRAD, F. and FRICKER, S. (2000),“Unraveling the Seam Effect”, Proceedings of the Section on Survey Research Methods, AmericanStatistical Association.
ROED, K. and NORDBERG, M. (2001),“Temporary Layoffs and the Duration of Unemployment”, University of Oslo, Department of Economics,Memorandum 12/2001 (www.oekonomi.uio.no/memo/memopdf/memo1201.pdf).
SCHWARTZ, S., BANCROFT, W., GYARMATI, D. and NICHOLSON, C. (2001),The Frequent Use of Unemployment Insurance in Canada, SRDC, Ottawa (www.srdc.org/english/publications/publications.htm).
SECO (2000),Évaluation de la mise en œuvre des mesures du marché du travail: rapport final, Politique du marché dutravail, Publication No. 8, Bern.
SIANESI, B. (2002),“Differential Effects of Swedish Active Labour Market Programmes for Unemployed Adults duringthe 1990s”, Swedish Economic Policy Review.
SM (Ministry of Social Affairs) (2001),Social Policy in Denmark (www.sm.dk/eng/dansk_socialpolitik/index.html).
TEASDALE, P. (1998),“Incidence and Repeat Spells of Unemployment in Analysis Using Claimant Data”, Labour MarketTrends, November, pp. 555-561.
UNEDIC (2001),Zoom 2001: European and International Unemployment Insurance Systems, Paris (www.unedic.fr).
UNEMPLOYMENT UNIT and YOUTHAID (1999),Unemployment and Training Rights Handbook (6th edition), London.
UNEMPLOYMENT UNIT and YOUTHAID (2000),New Deal Handbook, London.
WANDNER, S. and MESSENGER, J. (1999),Worker Profiling and Reemployment Services: Final Report and Recommendations, US Department ofLabour Employment and Training Administration (wdr.doleta.gov/opr/fulltext/).
WELLS, B. (1998),“Early Identification/Profiling in the United Kingdom”, Early Identification of Jobseekers at Risk ofLong-term Unemployment: the Role of Profiling, OECD, Paris.
WINKELMANN, L. and WINKELMANN, R. (1998),“Why Are the Unemployed So Unhappy? Evidence from Panel Data”, Economica, No. 65, pp. 1-15.

OECD EMPLOYMENT OUTLOOK – ISBN 92-64-19778-8 – ©2002
The ins and outs of long-term unemployment – 243
WINTER-EBMER, R. (2002),“Benefit Duration and Unemployment Entry: Quasi-Experimental Evidence for Austria”, EuropeanEconomic Review (www.economics.uni-linz.ac.at/Members/Winter/cv.htm).
WINTER-EBMER, R. and ZWEIMULLER, J. (1992),“Do They Come Back Again? Job Search, Labour Market Segmentation and State Dependence asExplanations of Repeat Unemployment”, Empirical Economics, Vol. 17, pp. 273-292.
WOODBURY, S. and RUBIN, M. (1997),“The Duration of Benefits”, in C. O’Leary and S. Wandner (eds.), Unemployment Insurance in the UnitedStates, Upjohn Institute for Employment Research, Kalamazoo, Michigan.