Embed Size (px)
Citation preview
Port Investments Study 20181
THE INFRASTRUCTUREINVESTMENT NEEDSAND FINANCING CHALLENGE OF EUROPEAN PORTS
ESPOReport prepared for the European Seaports Organisation (ESPO)
Prepared by Peter de Langen, Mateu Turró, Martina Fontanet and Jordi Caballé

MESSAGE FROM THE CHAIR I
ESPO RECOMMENDATIONS II
STUDY: THE INFRASTRUCTURE INVESTMENT NEEDS AND FINANCING CHALLENGE OF EUROPEAN PORTS Introduction 3
INTRODUCTORY CHAPTER1. The role of ports in theeu economy and the EU TEN-Tpolicy for ports 5
ANALYSIS OF INVESTMENTS IN PORTS2. Characteristics of investments in port infrastructure 113. The challenge of financing port infrastructure investments 214. Investment needs and investment priorities of European ports 31
ASSESSMENT OF PAST & CURRENT EU POLICIES ON PORT INVESTMENTS5. EU port policies and instruments for financing investments in port infrastructure 456. The EU policy framework (2014 – 2020) and its results for ports until 2017 53
ASSESSMENT OF EVALUATION AND ADMINISTRATIVE PROCESSES7. The evaluation processes for EU financial instruments 67
CONCLUDING RECOMMENDATIONS 8. Summary: Towards effective mechanismsto support investment priorities in ports 75
THE AUTHORS 81
REFERENCES 82
APPENDIX 1: EU CORE PORTS PER CORRIDOR 83
APPENDIX 2: THE SPLIT BETWEEN GENERAL AND COHESION CALLS 84
GLOSSARY 85
Cover picture: painting from the series The Colours of ESPO, reflections on upcoming harbourscapes by Sasja Hagens.

Port Investments Study 2018I
MESSAGE FROM THE CHAIR
The development of the Single European Market required the elimination of a range of barriers to trade. Nowhere is this more evident than in Europe’s seaports where the work to create a level playing pitch has been a project of decades. In recent years, however, there has been a range of inter-related EU policy initiatives which have largely created the level playing pitch in the port sector. As a result, seaports are now in the position to fully realise their potential and maximise their contribution to the prosperity of people and communities throughout the EU.
Central to this change has been the increased focus on ports as commercial entities with increased financial autonomy in most cases. However, this new perspective highlights a conundrum at the heart of port development plans. In many cases, the main benefits of port projects accrue to the wider community and economy rather than to the port authority itself. This is particularly true when ports invest in basic infrastructure to provide capacity for future growth.
Beyond that, the requirement for ports to invest in basic infrastructure has been joined by a range of investment requirements as a result of wider societal imperatives particularly in the areas of environmental policy and energy policy.
The challenge ports everywhere face now, is to implement projects which often are financially unattractive to the port authority and even less attractive to external investors but which are essential for wider societal and economic reasons.
Some ports are financially strong enough to finance such projects and accept the low financial returns. Other ports are challenged to implement projects which are essential but are entirely beyond their means.
The Connecting Europe Facility (CEF) is the essential means to resolve this conundrum.
TEN-T policy recognises ports as engines for growth. Europe’s ports have the projects ready to meet TEN-T objectives. CEF is the facilitator.
As CEF ll is being prepared, the experience and expertise of Europe’s ports has been harnessed in this study report by ESPO to provide Europe’s institutions with an informed viewpoint on the needs of ports and on how ports can contribute to the achievement of TEN-T and other EU policies.
ESPO recognises that there are many demands on the EU budget at a time when the size of this budget is challenged by Brexit. But there are important choices to be made in how scarce resources are allocated.
ESPO contends that investment in Europe’s seaports is essential if critical policy objectives are to be met in a wide range of EU policy areas. If Europe’s seaports cannot make the investments that are needed, then key policy objectives in the areas of transport, energy and environment will be compromised.
Nine key findings are presented in this report, which go beyond a simplistic request by ports for more funds, to inform the debate and discussion of the size and allocation of the budget for the second Connecting Europe Facility.
Eamonn O’Reilly
Port Investments Study 2018
RECOMMENDATIONS OF THE EUROPEAN SEA PORTS ORGANISATION
In preparation of the Connecting Europe Facility II (CEF II) budget proposal 1
Policy recommendations
The European Sea Ports Organisation (ESPO) welcomes the opportunity to participate in the preparatory process of the future Connecting Europe Facility (CEF II). In order to draw up well-reasoned recommendations, ESPO commissioned a study on the infrastructure investment needs and financing challenges of ports.
ESPO acknowledges that CEF has proved to be an efficient financial instrument, which is based on a sound strategic framework (TEN-T) and has provided important support to a series of valuable projects in European seaports. However, the size of the current CEF is a limited means to complete the TEN-T network, as demonstrated by the substantial oversubscription of the various calls. Based on this acknowledgement and the analysis carried out in the following study, the European Sea Ports Organisation puts forward the following considerations:
Ports are vital for the EU economy
Seaports have evolved from the classic role of being predominantly responsible for the reception of ships (their loading and unloading and the storage and transport of goods) to a more comprehensive entity of functional and spatial clusters of activities which are directly or indirectly linked to maritime transportation. The passenger dimension has gained substantial importance, with ports playing a key role for the provision of the relevant facilities and for enabling the passengers’ connectivity. Moreover, many ports have developed into strategic nodes for energy generation, trade, storage and distribution, and increasingly important clusters of industry and blue economy. Ports have been constituting the main link from maritime transport to any destination in the hinterland. On top of that, some ports have been identified as critical infrastructure due to their strategic importance.
The 2013 TEN-T policy acknowledges the ports’ crucial role as primary nodes of the network and as starting points of the TEN-T corridors.
Despite the recognition of the significant role of ports and their very diverse responsibilities, port projects initiated by port managing bodies only succeeded to attract 4% of the CEF transport funding during the period 2014 – 2017 2.
1. Legal Notice: The content of these recommendations is based on the findings of the study ‘The infrastructure investment needs and financing challenge of European ports’, but solely reflects the views of the European Seaports Organisation.2. It is important to bear in mind that other projects benefitted ports which are not initiated by the port authorities, or where the port authority is not the main applicant.
II

Port Investments Study 2018
Efficient, sustainable and well-connected ports need investments
According to the estimation of the European Commission, the investments from 2016 until 2030 needed for realising the core network in its totality amount to about 750 €billion 3.
The study reveals that European seaports (EU-27) currently face substantial investment needs of around 48 €billion (5 €billion annually) for the period 2018 – 2027. As these investment needs are mostly driven by dynamic and continuous trends, such as the rapid development of the logistics industry, the port related industry and environmental requirements, port investments will remain crucial in the future.
As stated in the Valetta Declaration, well-connected and modern ports play a key role to preserve and attract new industries and logistic activities, to link up the different regions within the internal market of the European Union and support the greening of transport. This role requires ports to make substantial investments, in order to maintain and enhance existing infrastructure, to create new transport links and to improve the environmental sustainability of port operations.
Diversity of investment drivers
Ports are facing several challenges that have a major impact on the requirements for infrastructure investments: new trends in the maritime industry (increasing vessel sizes, increasing market power through alliances), the decarbonisation agenda, building resilience to climate change and the overall greening of vessels, digitalization and automation, increased security challenges, growing urbanisation and increasing pressure from expanding cities, as well as Brexit. There are consequently many more requirements for developing new and adapting existing port infrastructure than simply increasing capacity.
To a large extent, these investment needs are triggered by external drivers (for example the need for LNG infrastructure to facilitate the greening of vessels). The future CEF call priorities and the specific blend of instruments should reflect the diversity of the investment drivers, in order to better account for the various investment needs.
Very diverse port investment needs
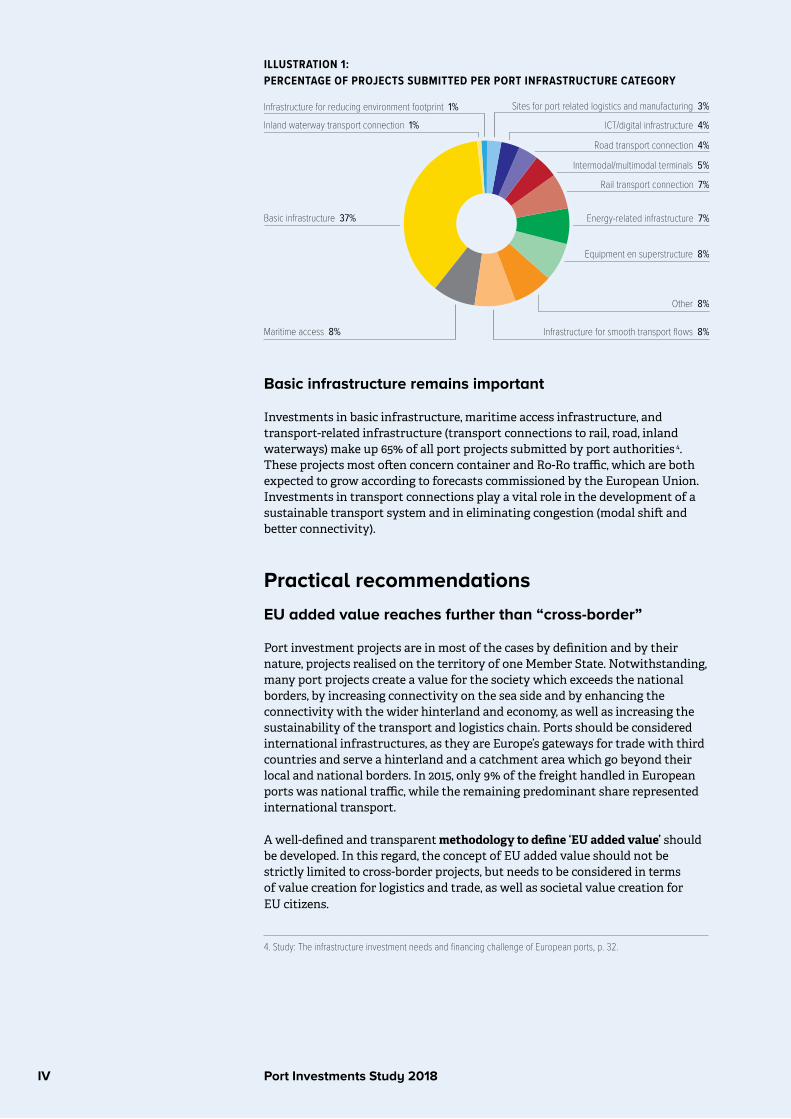
Even though basic infrastructure remains the largest investment category, port investment needs are very diverse, as displayed by the graph below. The analysed projects feature a balanced mix of project stages, with projects in (partial) execution, others ready for execution, as well as projects in the study and idea phases.
3. European Commission, Delivering TEN-T, Facts & Figures September 2017.
III
IV Port Investments Study 2018
ILLUSTRATION 1: PERCENTAGE OF PROJECTS SUBMITTED PER PORT INFRASTRUCTURE CATEGORY
Other 8%
Sites for port related logistics and manufacturing 3%Infrastructure for reducing environment footprint 1%
Intermodal/multimodal terminals 5%
ICT/digital infrastructure 4%
Maritime access 8%
Equipment en superstructure 8%
Energy-related infrastructure 7%
Rail transport connection 7%
Road transport connection 4%
Infrastructure for smooth transport flows 8%
Basic infrastructure 37%
Inland waterway transport connection 1%
Basic infrastructure remains important
Investments in basic infrastructure, maritime access infrastructure, and transport-related infrastructure (transport connections to rail, road, inland waterways) make up 65% of all port projects submitted by port authorities 4. These projects most often concern container and Ro-Ro traffic, which are both expected to grow according to forecasts commissioned by the European Union. Investments in transport connections play a vital role in the development of a sustainable transport system and in eliminating congestion (modal shift and better connectivity).
Practical recommendations
EU added value reaches further than “cross-border”
Port investment projects are in most of the cases by definition and by their nature, projects realised on the territory of one Member State. Notwithstanding, many port projects create a value for the society which exceeds the national borders, by increasing connectivity on the sea side and by enhancing the connectivity with the wider hinterland and economy, as well as increasing the sustainability of the transport and logistics chain. Ports should be considered international infrastructures, as they are Europe’s gateways for trade with third countries and serve a hinterland and a catchment area which go beyond their local and national borders. In 2015, only 9% of the freight handled in European ports was national traffic, while the remaining predominant share represented international transport.
A well-defined and transparent methodology to define ‘EU added value’ should be developed. In this regard, the concept of EU added value should not be strictly limited to cross-border projects, but needs to be considered in terms of value creation for logistics and trade, as well as societal value creation for EU citizens.
4. Study: The infrastructure investment needs and financing challenge of European ports, p. 32.
Port Investments Study 2018V
Port investments often have a high societal value, but do not always generate a sufficient return on investment for the investing port authority
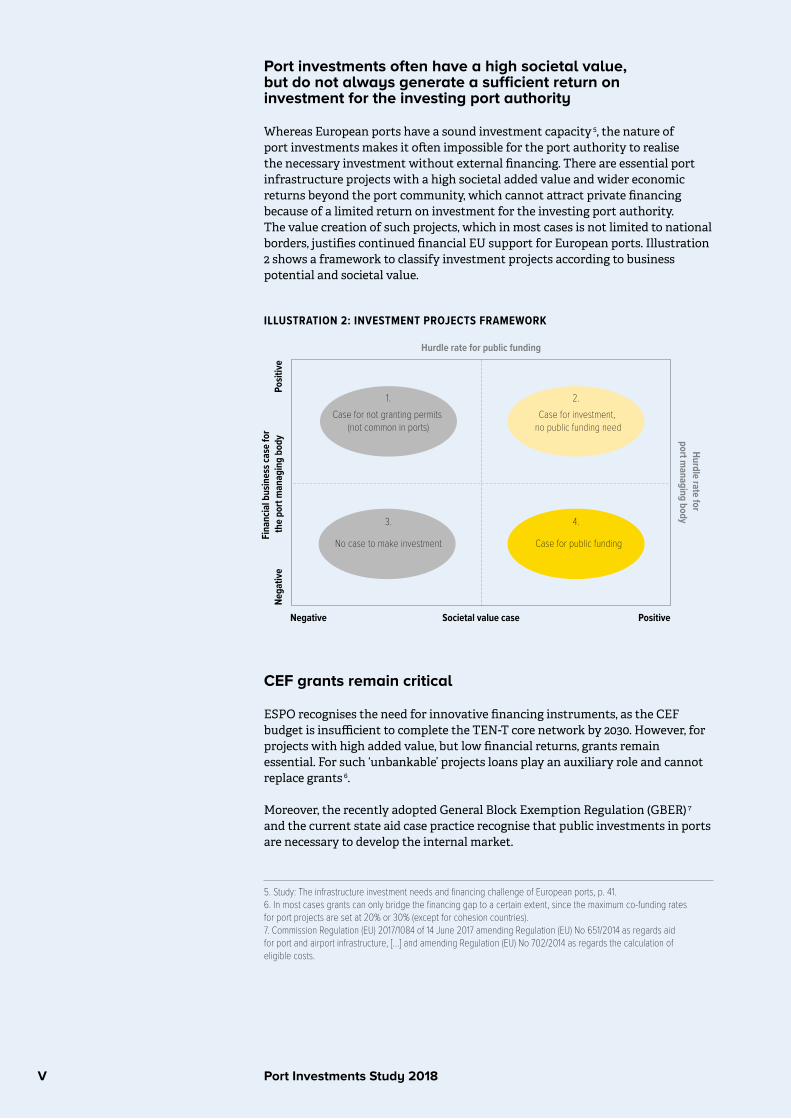
Whereas European ports have a sound investment capacity 5, the nature of port investments makes it often impossible for the port authority to realise the necessary investment without external financing. There are essential port infrastructure projects with a high societal added value and wider economic returns beyond the port community, which cannot attract private financing because of a limited return on investment for the investing port authority. The value creation of such projects, which in most cases is not limited to national borders, justifies continued financial EU support for European ports. Illustration 2 shows a framework to classify investment projects according to business potential and societal value.
ILLUSTRATION 2: INVESTMENT PROJECTS FRAMEWORK
Negative
Nega
tive
PositiveSocietal value case
Hurdle rate for public funding
Hurdle rate for port m
anaging body
Posit
iveFi
nanc
ial b
usin
ess c
ase
for
the
port
man
agin
g bo
dy
Case for not granting permits (not common in ports)
No case to make investment Case for public funding
Case for investment, no public funding need
1. 2.
3. 4.
CEF grants remain critical
ESPO recognises the need for innovative financing instruments, as the CEF budget is insufficient to complete the TEN-T core network by 2030. However, for projects with high added value, but low financial returns, grants remain essential. For such ‘unbankable’ projects loans play an auxiliary role and cannot replace grants 6.
Moreover, the recently adopted General Block Exemption Regulation (GBER) 7 and the current state aid case practice recognise that public investments in ports are necessary to develop the internal market.
5. Study: The infrastructure investment needs and financing challenge of European ports, p. 41.6. In most cases grants can only bridge the financing gap to a certain extent, since the maximum co-funding rates for port projects are set at 20% or 30% (except for cohesion countries).7. Commission Regulation (EU) 2017/1084 of 14 June 2017 amending Regulation (EU) No 651/2014 as regards aid for port and airport infrastructure, […] and amending Regulation (EU) No 702/2014 as regards the calculation of eligible costs.
VI Port Investments Study 2018
Responsible grant management
In order to ensure efficient use of the grants, ESPO calls for more harmonised and transparent evaluation methods across all transport sectors. To this end, European ports are in favour of the development of a more rigorous cost-benefit analysis (CBA), which also takes into account the projects’ societal value creation and the generation of EU added value.
A long-term vision on priorities would benefit project quality
A stable financial framework and long-term vision on priorities will allow ports to submit more well-prepared and high-quality projects. On the one hand, the early announcement of call priorities will provide ports with sufficient time to prepare eligible projects that are solid and contribute to reaching the priorities set forward in the most efficient way.
On the other hand, a more balanced distribution of funds over all seven years of the financing period will accommodate more high-quality proposals. Whereas ESPO acknowledges the Commission’s frontloading method, a more balanced distribution of the budget during the funding period would better fit with the (dynamic) nature of project generation and the complexity of project development and maturity.
Thus, a more equal distribution of funds over time is likely to lead to a higher impact of the available funding.
Additionally, detailed formal feedback should be provided directly to the applicants in case of rejected project proposals, in order to ensure that the ports can use the information to improve future applications. This will also avoid repetitive failures which are a loss of time and money both for the applicant and the evaluator (the European Commission and INEA).
The funding gap should be the main criterion to define the level of co-financing
The reduction of the requested funding does not support the methodology of closing the funding gap. Projects, which receive only a partial amount of the requested funding, risk to be no longer viable due to the remaining (smaller) funding gap. In order to increase the efficiency of the funding and to enable the execution of the selected projects, the initially requested amount should not be reduced for accepted projects, unless the reduction is based on a shared new understanding of the funding gap.
Aiming at the right level of endorsement
Member State endorsement should be a key requirement for large projects with implications for the national and European network. However, smaller port projects, which strictly aim at improvements within the port area (for example energy efficiency or data exchange) and which do not apply for national funding, should not require the prior endorsement by the Member State.

THE INFRASTRUCTUREINVESTMENT NEEDSAND FINANCING CHALLENGE OF EUROPEAN PORTS
A study commissioned by ESPO
Port Investments Study 20183
INTRODUCTION
The European Sea Ports Organisation (ESPO) commissioned this study so that it could serve as input for the preparation of the future Connecting Europe Facility (CEF II).
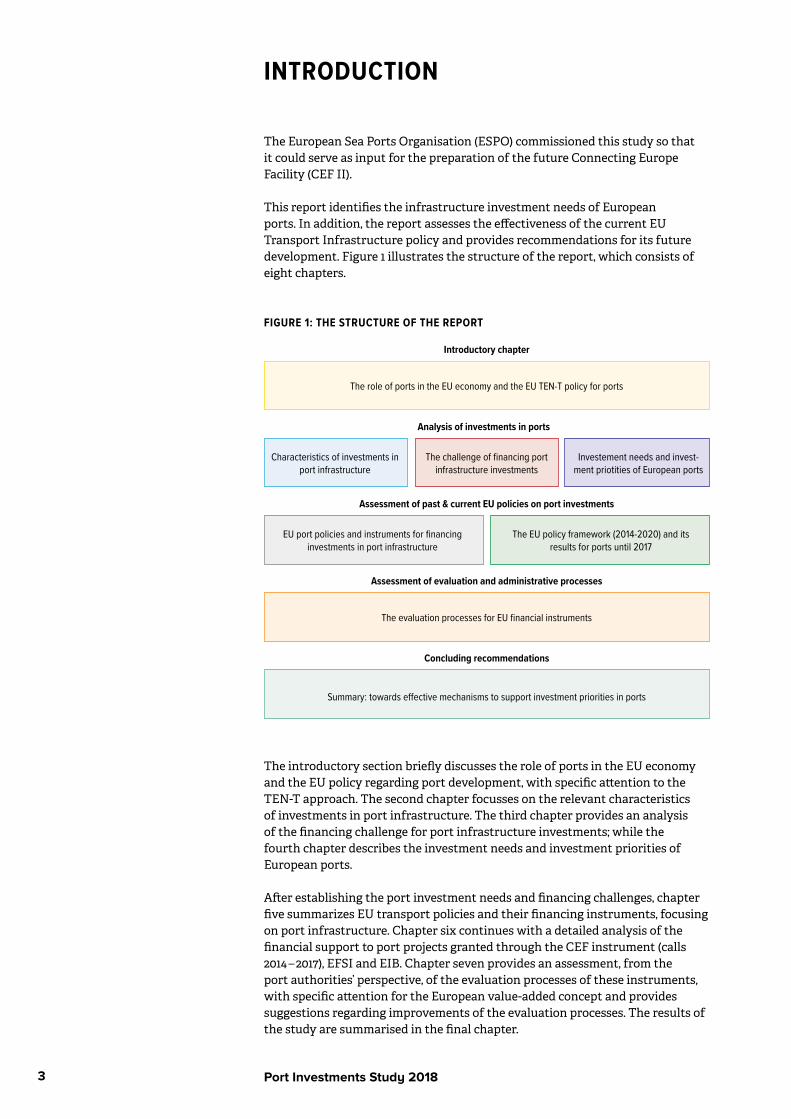
This report identifies the infrastructure investment needs of European ports. In addition, the report assesses the effectiveness of the current EU Transport Infrastructure policy and provides recommendations for its future development. Figure 1 illustrates the structure of the report, which consists of eight chapters.
FIGURE 1: THE STRUCTURE OF THE REPORT
The evaluation processes for EU financial instruments
Summary: towards effective mechanisms to support investment priorities in ports
Analysis of investments in ports
Introductory chapter
Assessment of past & current EU policies on port investments
Assessment of evaluation and administrative processes
Concluding recommendations
The role of ports in the EU economy and the EU TEN-T policy for ports
Characteristics of investments in port infrastructure
The challenge of financing port infrastructure investments
Investement needs and invest-ment priotities of European ports
EU port policies and instruments for financing investments in port infrastructure
The EU policy framework (2014-2020) and its results for ports until 2017
The introductory section briefly discusses the role of ports in the EU economy and the EU policy regarding port development, with specific attention to the TEN-T approach. The second chapter focusses on the relevant characteristics of investments in port infrastructure. The third chapter provides an analysis of the financing challenge for port infrastructure investments; while the fourth chapter describes the investment needs and investment priorities of European ports.
After establishing the port investment needs and financing challenges, chapter five summarizes EU transport policies and their financing instruments, focusing on port infrastructure. Chapter six continues with a detailed analysis of the financial support to port projects granted through the CEF instrument (calls 2014 – 2017), EFSI and EIB. Chapter seven provides an assessment, from the port authorities’ perspective, of the evaluation processes of these instruments, with specific attention for the European value-added concept and provides suggestions regarding improvements of the evaluation processes. The results of the study are summarised in the final chapter.

Port Investments Study 20184

Port Investments Study 20185
THE ROLE OF PORTS IN THE EU ECONOMY AND THE EU TEN-T POLICY FOR PORTS 8
The European Union (EU) is highly dependent on seaports, both for trade with the rest of the world and for trade between Member States. 74% of imported and exported goods (in tonnes) and 37% of intra-EU transport flows make use of seaports 9.
In addition to freight transport, about 400 million passengers embark and disembark in EU ports every year 10, and ports also attract increasing volumes of cruise ships and passengers (more than 6 million passengers yearly embark on a cruise in Europe), which creates a positive impact on the tourism sector.
Ports not only accommodate freight and passengers, but they are also quite often the site of energy nodes and clusters of industrial logistics and also tourism/leisure activities. For instance, ports are energy hubs for conventional and renewable energies. Thus, ports will have to play a major role in decarbonising the economy, beyond the port area and operations, by offering alternative energy solutions.
Ports generate employment for about 470.000 people directly and help sustain 3 million jobs, for instance in warehousing or export-oriented manufacturing 11.Ports also contribute to territorial cohesion: in regions with a weak economic basis, efficient seaports can be a catalyst for the development of the region.
As outlined in ‘Ports: an engine for growth’, the communication from the European Commission, ports are critical for a competitive European economy; efficient ports are needed to accommodate economic growth 12. These facts underline the importance of ports for the overall economy and are reflected in the EU classification of ports as critical infrastructure 13.
EU TEN-T policy
The EU transport policy acknowledges the need for well-performing maritime ports. Removing bottlenecks that cause congestion, extra emissions and extra costs for shippers, transport operators, consumers and society as a whole will enhance sustainable economic development.
Whilst the European Union is supporting fair competition in the transport sector, the European transport policy respects the diversity of governance models and ownership structures and does not impose a uniform model for ports.
8. This chapter uses sentences from relevant EU policy documents, such as the communication ‘European ports: an engine for growth’ as this is the best way to summarize the EU policies on ports.9. European Commission, 2018, see https://ec.europa.eu/transport/modes/maritime/news/2016-06-27-ports_en.10. Eurostat, 2018, see http://appsso.eurostat.ec.europa.eu/nui/show.do?dataset=mar_mp_aa_cph&lang=en.11. European Commission (2014).12. European Commission (2013).13. EU directive 2008/114/EC, see https://ec.europa.eu/energy/en/topics/infrastructure/protection-critical-infrastructure.
1
Port Investments Study 20186
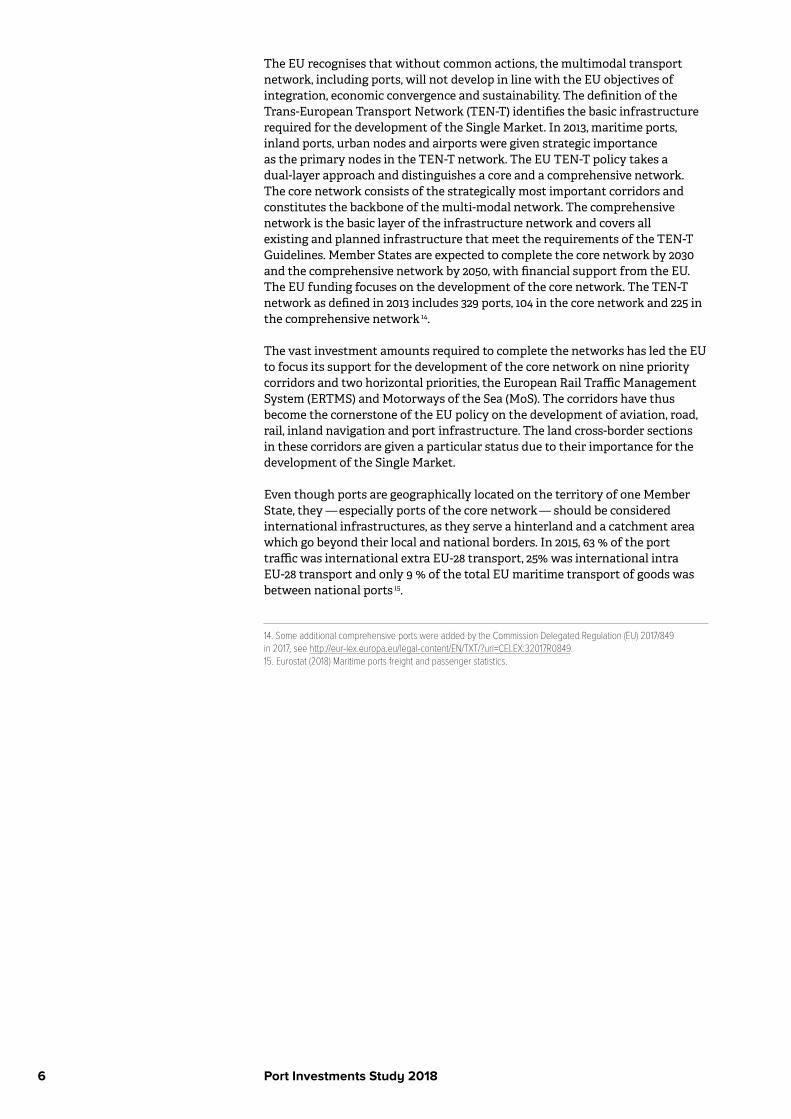
The EU recognises that without common actions, the multimodal transport network, including ports, will not develop in line with the EU objectives of integration, economic convergence and sustainability. The definition of the Trans-European Transport Network (TEN-T) identifies the basic infrastructure required for the development of the Single Market. In 2013, maritime ports, inland ports, urban nodes and airports were given strategic importance as the primary nodes in the TEN-T network. The EU TEN-T policy takes a dual-layer approach and distinguishes a core and a comprehensive network. The core network consists of the strategically most important corridors and constitutes the backbone of the multi-modal network. The comprehensive network is the basic layer of the infrastructure network and covers all existing and planned infrastructure that meet the requirements of the TEN-T Guidelines. Member States are expected to complete the core network by 2030 and the comprehensive network by 2050, with financial support from the EU. The EU funding focuses on the development of the core network. The TEN-T network as defined in 2013 includes 329 ports, 104 in the core network and 225 in the comprehensive network 14.
The vast investment amounts required to complete the networks has led the EU to focus its support for the development of the core network on nine priority corridors and two horizontal priorities, the European Rail Traffic Management System (ERTMS) and Motorways of the Sea (MoS). The corridors have thus become the cornerstone of the EU policy on the development of aviation, road, rail, inland navigation and port infrastructure. The land cross-border sections in these corridors are given a particular status due to their importance for the development of the Single Market.
Even though ports are geographically located on the territory of one Member State, they — especially ports of the core network — should be considered international infrastructures, as they serve a hinterland and a catchment area which go beyond their local and national borders. In 2015, 63 % of the port traffic was international extra EU-28 transport, 25% was international intra EU-28 transport and only 9 % of the total EU maritime transport of goods was between national ports 15.
14. Some additional comprehensive ports were added by the Commission Delegated Regulation (EU) 2017/849 in 2017, see http://eur-lex.europa.eu/legal-content/EN/TXT/?uri=CELEX:32017R0849. 15. Eurostat (2018) Maritime ports freight and passenger statistics.
Port Investments Study 20187
Defining core and comprehensive portsPorts and port systems have evolved over time in response to external changes such as the size of ships, changing trade patterns or changes in supply and production chains. The port of Gdansk (Poland) for instance, handled less than 18 million tonnes in 2008, and saw traffic increase to over 37 million tonnes in 2016. Port activity can also be deeply affected by its governance. For instance, the cross-border merger of the ports of Copenhagen (Denmark) and Malmö (Sweden) has led to port activity integration on both sides of the Oresund, so it makes sense to define them as a single bi-national port complex. Finally, the roles of ports have also changed. For instance, as a result of the rapid growth of cruise tourism, this segment in some ports grows fast. The same applies to Ro-Ro traffic, which is often a combination of passengers and freight. This Ro-Ro traffic has been one of the fastest growing segments in the ports industry, partly due to national and European policy initiatives to promote the use of shipping, for instance through the Motorways of the Sea policies.
The changes mentioned above suggest that the status of EU ports in transport networks has been developing over time. It is therefore sensible to assess from time to time whether the previously defined set of ports within the core and comprehensive TEN-T networks still reflects the current situation. Given the relevance of passenger transport, one item that may deserve consideration is a better recognition of ports accommodating substantial passenger traffic in the definition of the EU core network ports.
TEN-T corridors
The nine priority corridors were defined in 2013 and constitute the main axes of the TEN-T core network. Each of them involves at least three different Member States, three transport modes and two cross-border sections. These corridors, the core ports on these corridors and the core ports outside these nine corridors are shown in figure 2.
The development of the TEN-T corridors is driven by Member States decisions. They are committed to complete them by 2030, but can count on EU funding, in particular for cross-border sections.
Each corridor is led by a European Coordinator who chairs the Corridor Platform, composed by Member States and supported by a Corridor Forum involving relevant public and private stakeholders.
There is one work plan per corridor (and per horizontal priority) that is adapted periodically in function of the progress made. The second versions of all work plans were published in December 2016 16 and the third versions are expected by Spring 2018. Each work plan includes the characteristics of the corridor, its objectives and its implementation timing, including a list of projects to be executed. These projects can be financed by a variety of financing sources including local, regional and national funding and private funding. The projects can also apply for co-funding from the EU, through the CEF, ERDF, Cohesion Fund and EIB instruments (these are discussed in more detail in chapter 5). This list of priority projects includes port projects.
16. See https://ec.europa.eu/transport/themes/infrastructure/news/2017-01-11-transport-infrastructure-second-generation-work-plans-11_en, these work plans contain a large number of port projects.

FIGURE 2: CORE CORRIDORS, CORE PORTS ON THESE CORRIDORS AND THE CORE PORTS OUTSIDE THESE NINE CORRIDORS.● Core ports or cluster of core ports of the TEN-T network ● Other corridor nodes
● Baltic - Adriatic Corridor ● North Sea - Baltic Corridor ● Mediterranean Corridor ● Orient/East - Med Corridor ● Scandinavian - Mediterranean Corridor ● Rhine - Alpine Corridor● Atlantic Corridor ● North Sea - Mediterranean Corridor ● Rhine - Danube Corridor
Source: based on European Commission publication “Ports 2030– gateways for the Trans European Transport Network” and updated TENtec information
* Ghent, Vlissingen, Terneuzen
GlasgowEdinburgh
Belfast
Dublin
Limerick S.F
Cork
Cardi� NewportMilford Haven
LiverpoolManchester
Grimsby/Immingham
Luleå
Hamina Kotka
Tallinn
Riga
VilniusKaunas
WarsawPoznan
RostockLübeck
Frankfurt/Oder
Berlin
Dresden Wroclaw
Ostava
Brno
BratislavaVienna
Wels/Linz
Passau
Nuremberg
MunichDijon
Basel
MannheimLuxembourg
MetzParisRouen
LilleCalaisDunkerque Brussels Liège
AntwerpMoerdijk
Utrecht
RotterdamAmsterdam
Le Havre Frankfurt
CologneDüsseldorf
Nantes Saint-Nazaire
Regensburg
Prague
StuttgartStrasbourg
Würzburg
Hamburg
Osnabrück Hannover
Magdeburg
Wilhelmshaven
Aarhus
BremerhavenBremen
Katowice
Zilina
Szczecin/Swinoujscie
Ventspils
Klaipeda
Gdynia/Gdansk
Helsinki
Stockholm
Örebro
TrelleborgCMP MalmöCMP Copenhagen
Oslo
Gothenburg
Turku Naantali
Teesport
Birmingham
BristolLondon
Southampton Dover
Zeebrugge
FelixstoweHarwich
Lisbon
Aveiro
A Coruña
Porto
Bilbao
Vitoria
ValladolidZaragoza
Madrid
Antequera/Bobadilla
Gijón
Sines
HuelvaCartagena
Murcia
Valencia
Palma de Mallorca
TarragonaBarcelona
CagliariPalermo
Naples
Bari
Ancona
Rome
Livorno
Genoa
Lyon
Turin Milan
Venice
Koper
Trieste
Graz Budapest Arad
Timișoara
Brașov
GalaţiSulina
Bucharest
Cralova
Sofia
Igoumenitsa
Patras
Heraklion
Limassol
Nicosia
Athens/Piraeus
Burgas
Thessaloniki
ConstanţaLjubljana
Innsbruck
Rijeka
Zagreb
Udine
Klagenfurt
Verona
Bologna
Novara
La SpeziaRavenna
Taranto
Augusta
Gioia Tauro
Valletta/Marsaxlokk
Perpignan
Bordaux
MarseilleFos-sur-Mer
Algeciras
Las Palmas, Santa Cruz (Tenerife)
Santa Cruz
Las Palmas
Seville
Noth Sea Port*
Ostend

Port Investments Study 201810
Port Investments Study 201811
2 CHARACTERISTICS OF INVESTMENTS IN PORT INFRASTRUCTURE
Seaports are primarily facilities for loading and unloading of ships, the storage of goods, as well as transfer of goods and passengers to inland transport modes. In addition, ports are functional and spatial clusters of activities which are directly or indirectly linked to maritime transportation. They are privileged locations for transformation processes of goods, notably those moved by ship, and have developed substantial logistics and manufacturing activities over the years. They also host service and leisure activities related to ships (for instance, cruise and marina activities). Thus, besides nodes of transport networks, ports are also sites for a number of activities that may require specific facilities. Based on this broad definition of ports, we identify different types of port infrastructure.
The relevant types of infrastructure investments in ports
Twelve types of infrastructure investments are distinguished. In some cases, an example is provided. Investments may concern the construction of new infrastructure as well as upgrading or redeveloping existing infrastructure 17.
1 Maritime access
Examples of relevant infrastructure investments in the category of maritime access include:• capital and maintenance dredging of entrance channels or rivers,• breakwaters, that protect ships in ports,• sea locks (that enable ship entry to ports and project against flooding).In general, investments in maritime access benefit all port users, not specific segments nor specific terminals in the port.
Maritime access; the case of capital dredging in Koper (Slovenia)Koper was constrained by a draft of 13 meter. Due to a limited draft, fully loaded ships had to be partially unloaded in another port before being able to call at Koper. The dredging works deepened the accessing channel and basin to 15 meters, resulting in an increase of the maximum ship size that can be received fully loaded from about 10.500 TEUs to about 14.000 TEUs. Larger vessels that are coming to the port require also greater shore capacities, thus driving the need for the reconstruction of berths.
17. Investments in security (such as fences), cyber security and safety are not included as a specific investment category as they are relevant for each of the twelve categories.

Port Investments Study 201812
2 Basic port infrastructure
Basic port infrastructure covers infrastructure and facilities for the provision of transport-related port services, such as berths used for the mooring of ships, quay walls, jetties and floating pontoon ramps in tidal areas, internal basins, backfills and land reclamation. This infrastructure is necessary for the development of terminals for loading and unloading of ships. Such terminals are generally dedicated to specific traffics, such as containers, Ro-Ro, cruise, dry bulk or liquid bulk, or to the storage/distribution of transport fuels (including LNG). In some cases, basic port infrastructure investments address the needs (e.g. more capacity, stronger quay-walls) of one specific segment, in other cases basic port infrastructure investments address the needs of various segments 18.
3 Equipment and superstructure
The basic infrastructure described above enables development of terminals. Port superstructure covers surface arrangements (such as for storage), fixed equipment (such as warehouses and terminal buildings) as well as mobile equipment (such as cranes) located in a port for the provision of transport related port services.
Basic port infrastructure, equipment and superstructure; the case of Thessaloniki (Greece)In order to serve state-of-the art vessels, the port of Thessaloniki will invest in expanding the container terminal, more specifically with new and deeper quays (-16,50 m depth) and additional storage space, to increase its capacity to 1,36 million TEUs per year. The project also includes investments in equipment and superstructures, such as high voltage electricity supply, lighting, an administration building, a customs check point, fencing and security control.
4 Infrastructure for smooth transport flows within the port area
Infrastructure for smooth transport flows within the port area covers inland waterway, road, and rail infrastructure inside the port, as well as parking lots. All such infrastructure is required for smooth transport flows between maritime terminals, from maritime terminals to port users located in the port and from maritime terminals to rail or inland waterway terminals from which the hinterland of a port is served.
5 Energy-related infrastructure such as infrastructure for exchange of energy
Seaport complexes are often important sites for the storage and production of energy products (crude oil, LNG and petroleum derivatives, but also of electricity) and petro-chemicals, with a substantial impact on climate change, air quality and water quality. This infrastructure category includes pipelines for fuel, LNG, heath, steam, CO2 as well as (smart) electricity grids, infrastructure for the provision of transport fuels (including LNG) to ships and infrastructure for onshore power supply (cold ironing) to ships.
18. For instance, some ports may need infrastructure exclusively to handle Ro-Ro traffic (for instance island ports), while other ports may develop infrastructure for Ro-Ro, container and general cargo.
Port Investments Study 201813
Development of energy-related infrastructure; the case of Antwerp (Belgium)Antwerp Port Authority has purchased the national pipeline company (NMP), who was the owner and developer of a network of pipelines serving Antwerp’s port complex, as well as industrial users in the vicinity of the port. Antwerp Port Authority intends to use this pipeline infrastructure to shift liquid bulk flows to pipelines, to free up capacity of other transport modes. In addition, the port managing body explores opportunities to expand pipelines, for instance to be able to transport CO2 that may in the future be captured instead of being emitted. This case shows the increasing relevance of pipeline infrastructure for port development.
6 Rail transport connection from port to main (TEN-T) line
This category of port infrastructure consists of rail infrastructure from maritime terminals in ports to the main (TEN-T) rail network. Such infrastructure, both tracks and facilities, should enable direct (or easy) transfer from trains to ships and vice versa and facilitate rail operations to/from the hinterland. A part of the rail link may be outside the defined port area.
Development of rail connection; the case of the new Kattwyk Rail Bridge in Hamburg (Germany)The construction of the New Kattwyk Railway Bridge aims to eliminate the existing bottleneck on the Kattwyk Bridge, shared by both rail and road transport. The new bridge will only be used by rail transport and improve the connection from the port to the German rail network, while road traffic will exclusively use the previous Kattwyk Bridge, improving traffic flows and safety.
7 Road transport connection from port to the main (TEN-T) highway
This category of port infrastructure consists of road infrastructure from maritime terminals to the basic (TEN-T) road network. A part of the connecting road link may be outside the direct port area itself.
8 Inland waterway connection between the port and the main (TEN-T) waterway
This category of port infrastructure consists of inland waterway infrastructure linking the port with the inland waterway network. A part of the canal may be outside the defined port area.
9 ICT/digital infrastructure for efficient port & hinterland operations
Within the category of ICT/digital infrastructure, both the hardware, such as fibre cables in the port area, as well as a digital port community platform are considered as ‘infrastructure’ in the sense that they enable information flows in the same way that transport infrastructure enables flows of physical goods 19.
19. This category does include ‘infrastructure for data exchange’, which is provided as a service. The category does not include digital services based on availability of data, such as planning, monitoring and billing. In practice, the distinction between both may not always be clear cut.
Port Investments Study 201814
ICT/digital infrastructure for seamless port calls and efficient port & hinterland operations*Digital infrastructure, mainly as Port Community Systems (PCS), enables smooth data exchange. A PCS enables intelligent and secure exchange of information between public and private stakeholders through enabling a single submission of data which becomes available for (selected) third parties to optimise, manage and automate port and logistics processes (e.g. documentation for exports, imports, hazardous cargo, ship manifest information, port health formalities and maritime statistics reporting).Thus, digital infrastructure is aimed at eliminating unnecessary paperwork which can cause delays in cargo handling, at improved security, at cost reduction and at more environmental sustainability.
* Based on information available from the International Port Community System association, see www.ipcsa.international
10 Intermodal/multimodal terminals in the port area and/or dry ports outside the port area
The intermodal terminals and dry ports can be located either inside or outside the port area. In the same logic as applied above, this category includes the basic infrastructure, i.e. land and transport infrastructure, but not the equipment and superstructures.
11 Infrastructure for reducing the environmental footprint of port and shipping operations
Ports operations and development plans relating to both land and sea activities may have negative impacts on the environment (biodiversity, water quality, air quality and climate change). New infrastructure may mitigate these effects for instance by increasing coastal protection, curbing water and air emissions (Onshore Power Supply, LNG refuelling points) or reducing other negative effects for local communities such as noise (natural walls).
12 Sites for port-related logistic and manufacturing activities in the port area
The high-quality connectivity in seaports (both through maritime services and intermodal services to the hinterland) makes ports attractive locations for logistic activities. Thus, ports often develop logistic zones and manufacturing zones in direct proximity to (container) terminals. As for maritime terminals, logistics and manufacturing require land and associated utilities.
The logistics zone (ZAL) in Barcelona (Spain)ZAL Port is the intermodal logistic platform of the Port of Barcelona, which aims to attract maritime traffic by offering services in logistics. It has been developed in phases responding to the demand.
ZAL Port offers warehouses rental near Barcelona port (and the nearby airport) with intermodal connections to railway and motorway networks, as well as a Service Center building and other facilities designed to meet the needs of the companies located in the platform.

Port Investments Study 201815
The manufacturing and logistic zone in Sines (Portugal)Sines Industrial and Logistic Zone (ZALSINES) is a logistic platform that offers added value services near the Port of Sines, which is integrated in the TEN-T network. It is served by a high-capacity road and a rail line facilitating the links with the hinterland.
ZALSINES provides land for logistic and manufacturing activities in two main areas: the Intra-port zone with service buildings and support facilities; and the Extra-port zone that disposes of 215 hectares, near the port, for industrial and logistic companies. Both areas are connected by road and rail to the Iberian markets. It is a government-led development with an important focus on the regional development of the Alentejo region.
Interrelation of investment categories
The distinction of these twelve categories of port infrastructure investments facilitates more detailed insights into financing challenges and investment needs. The categories of investment are strongly interrelated. For instance, improving maritime access may only be possible, admissible or valuable if it goes hand in hand with an investment in basic port infrastructure and better connections to road, rail and inland waterway networks. In addition, due to the scale economies in construction, investment decisions often concern various infrastructure types.
The Maasvlakte II in Rotterdam (Netherlands)A clear example of an investment decision involving various infrastructure types is the Second Maasvlakte in Rotterdam. This investment involves maritime access (a breakwater), basic port infrastructure (quays and basins), road and rail connections to main road and railway networks, as well as land for logistics and manufacturing sites. The commitment to invest in intermodal transport, as well as the support of other stakeholders, including environmental groups, were a precondition for government approval of the entire Maasvlakte II project, which was partly financed by the EIB.
Drivers of infrastructure investments in ports
Investments in infrastructure (as defined above) are needed for seaports to enhance their efficiency, to address the challenges of the growing and changing needs of production and supply chains and to adapt to the requirements of sustainable transport addressing air quality, climate change and biodiversity. The challenges driving such investments include:
• Increased size and complexity of the fleet, in particular ultra-large container vessel (ULCV), new types of Ro-Ro ferries and gas-carriers. The technical requirements of some new ships in terms of size and ship design 20 mean that ports may need to eliminate constraints for handling these ships, either due to lock, draft, length and turning basin restrictions or lack of adapted energy supply systems. These constraints can only be removed through infrastructure investments 21.
20. The largest container ship on order (November 2017), able to carry over 22.000 TEU, has a designed draught of 14,5 m and will be LNG powered.21. The increase in ship sizes has important consequences for port operations and leads to higher peaks in cargo handling (e.g. the unloading of bigger volumes per ship), which may create a need for more storage space and more capacity of hinterland operations. In addition, the increase in ship sizes leads to a ‘cascading effect’ to feeder and short sea services, which also require larger ships that may need ports investment to accommodate them.

Port Investments Study 201816
• Growth of volumes handled in ports. While there is uncertainty regarding trade growth, projections generally suggest increases of maritime transport volumes (UNCTAD, 2017). Apart from cruises, the segment with the highest growth in the past decade has been containers. Due to the increase in ship sizes, this growth will probably be concentrated in the main ports of the Trans-European Network. However, feeders connecting such main ports with smaller ones are likely to lead to traffic growth in smaller ports. The expansion of the hub-and-spoke model represents increased port traffic volumes for equivalent trade due to increased transhipment activity.
• Increase in passenger numbers in the majority of ports. Both cruise and Ro-Ro passengers traffic has also increased substantially in the past decades and is expected to continue to grow. This has led to a higher demand for port infrastructure and services.
• A long-term transition towards decarbonisation of the economy, through the reduction of GHG emissions, the increase of energy efficiency and the uptake of low emission energy sources. This transition will involve changes in current traffic flows to optimise movements and significant developments in energy generation and distribution, with a shift from oil to LNG, hydrogen and renewable electricity. In addition, this transition will lead to a vast increase in renewable energy production (e.g. solar panels or wind turbines) in the port and more importantly offshore, with a need for the development of efficient methods to bring the energy (products) from offshore wind ashore. Finally, the CO2 capture and storage or use (CCS/CCU) is also an element of this transition that will require investments in ports. The decarbonisation targets can only be met if all transport modes continue to invest in greener technologies and in more efficient and smart logistic chains. A related additional driver of port investments is adaptation to climate change and the need to invest in the resilience of port facilities.
•Stricter requirements on environmental performance and the uptake of alternative fuels 22 (e.g. LNG and eventually hydrogen). The Directive on the deployment of alternative fuels infrastructure requires that all maritime ports of the TEN-T Core network are equipped with LNG refuelling points by 2025. Under the same Directive, Onshore Power Supply should be installed as a priority in ports of the TEN-T Core Network, and in other ports by 2025, unless there is no demand and the costs are disproportionate to the benefits. Some of the investment needs of ports are driven by international (IMO), EU and national environmental regulations; the need to invest in adequate waste reception facilities being one example.
• Pressure to increase the modal split of more sustainable transport modes, as advocated amongst others by the European Commission 23. The objective of decarbonising transport puts pressure on ports to reduce the share of road transport in the modal split, in order to promote greener transport modes and to decrease congestion and pollution.
• Pressure towards urbanisation of coastal zones, especially in densely populated areas. Most ports are located in or in close proximity to urban/metropolitan areas. This leads to pressure to transform port land into urban space and to develop new port facilities outside urban areas. Thus, urbanisation of the coastal zone is a driver of investments in new port areas.
• A strong digitalisation of virtually all parts of the economy, including manufacturing, logistics and transport. Driven by the increased use of sensing technology and data processing capabilities, many value chains are re-designed towards more automated processes based on real-time data. This trend has huge implications for port operations 24.
22. An action plan and investment solutions for the trans-European deployment of alternative fuels infrastructure was part of the Commission’s Clean Mobility Package (2017). 23. See for instance the 2011 white paper ‘Roadmap to a Single European Transport Area – Towards a competitive and resource efficient transport system’.24. See for instance a report by Fraunhofer, available at https://leseprobe.buch.de/images-adb/b5/54/b5541484-c38c-4f6e-9600-8b4460798994.pdf.

Port Investments Study 201817
• Rise in e-commerce. Digitalisation has generated a substantial rise in e-commerce and as a consequence ‘e-warehousing’, which increasingly leads to demand for land for logistics in port areas.
In conclusion, various external factors create a need for investments in port infrastructure. These investments are needed to remove bottlenecks and secure that ports can continue to function as sustainable and efficient gateways and logistics and manufacturing clusters.
Port governance models and responsibilities for investments in infrastructure
The trends summarised above lead to investment needs in port infrastructure. The decisions regarding these investments are taken by different actors. This depends on the port governance model in place, which substantially varies across Member States 25. Regardless of the precise governance model, European ports have sought and in large measure achieved financial autonomy as corporate entities. Table 1 shows the most common role of various stakeholders in the investment decisions of each of the 12 types of port infrastructure investments distinguished above.
TABLE 1: STAKEHOLDER’S ROLES IN INVESTMENT DECISIONS BY TYPE OF PORT INFRASTRUCTURE
Type of port infrastructure Common stakeholder’s roles in investment decisions
Maritime access Generally decided by port managing body or government or in partnership
Basic port infrastructure Generally a port managing body investment decision
Equipment and superstructure Generally private terminal operator decision under the landlord model and a port managing body investment decision in case of a service port model
Infrastructure for smooth transport flows within the port Generally a port managing body investment decision
Energy-related infrastructure such as infrastructure for exchange of energy
Investment decision of utility infrastructure provider or the port managing body or in partnership
Rail transport connection from port to main (TEN-T) line Generally a rail infrastructure manager decision, in some cases in partnership with port managing body
Road transport connection from port to main (TEN-T) highway
Generally a road infrastructure manager decision, in some cases in partnership with port managing body
Inland waterway transport connection from port to main (TEN-T) line
Generally a waterway infrastructure manager decision, in some cases in partnership with port managing body
ICT/digital infrastructure for efficient port & hinterland operations
Generally a port managing body investment decision
Intermodal/multimodal terminals in the port area and/or dry ports outside the port area
When in the port area, generally a port managing body investment decision, but when outside the port (as in case of a dry port) generally a government entity from that jurisdiction decides
Infrastructure for reducing environmental footprint of port and shipping operations
Generally a port managing body investment decision
Sites for port-related logistic and manufacturing activities in the port area
Generally a port managing body investment decision
25. While in most European countries, port development is mainly undertaken by government-owned port managing bodies that operate with a landlord model, in the UK model port development and operations are mainly undertaken by fully private companies. See the ESPO report on port governance at www.espo.be/media/Trends_in_EU_ports_governance_2016_FINAL_VERSION.pdf

Port Investments Study 201818
Even though the port managing body may not always be formally responsible for investment decisions in maritime access and hinterland access infrastructure, it is generally actively involved in the development of such infrastructure. Most of the times it is the stakeholder with the clearest interest in securing that sufficient investments are made in hinterland and maritime infrastructure access.
Case of funding differences: investments in locks The below-listed cases show substantial differences in the role of ports and Member States regarding port infrastructure investments concerning locks:
• In the case of Sevilla (Spain): the investment decision to invest in the lock was taken by the Sevilla Port Authority. The lock is financed by the port authority and co-funded by the EU.
• In the case of North Sea Port* (Belgium, Netherlands): the decision to invest in the lock in Terneuzen was taken by the regional government of Flanders together with the Dutch national government, as the new lock is of interest both for the port of Ghent (Belgium) and Zeeland Seaports (Netherlands). The lock is mainly financed by both governments, but with a part of the funding provided by both port managing bodies and an EU grant of 6% of the total cost.
• In the case of Amsterdam (Netherlands): the decision to invest in the lock was taken by the Dutch national government. The lock is mainly financed by the state, with a smaller part of the funds being provided by the port managing body and the European Union.
• In the case of Antwerp (Belgium): The Kieldrechtsluis is a partnership between the port authority of Antwerp and the Flemish government. The port managing body is the majority shareholder in the special purpose company tasked with the construction of the lock, and will take the risk of construction costs being higher than budgeted, carry out the maintenance and be responsible for the lock operations, based on service levels agreed with the Flemish government.
These cases show how port infrastructure development often follows specific partnership models, involving shared responsibilities on investment and operation.
*North Sea Port is the name of the new port authority that is the result of the merger between Port of Ghent and Zeeland Seaports. North Sea Port is in operation since the beginning of 2018.


Port Investments Study 201820
Port Investments Study 201821
3 THE CHALLENGE OF FINANCING PORT INFRASTRUCTURE INVESTMENTS
This section discusses the challenge of financing port infrastructure investments in three steps. First, the value creation of investments in port infrastructure is analysed, followed by the assessment of the justification of government co-funding for the various investments. The third section provides an overview of the funding structure of investments in port infrastructure to illustrate funding patterns for port infrastructure.
The societal and economic value creation of port infrastructure
Investments only make sense if they create value, either for port users, for society at large, or for both. The value for users becomes apparent through a market mechanism: users have a demand for port infrastructure and are ready to pay the charges requested by their providers (the port managing bodies). Three types of users can be identified: shipping lines that use the port and pay port dues, terminal operating companies and other service providers that occupy land in the port area and pay lease/concession charges and import/export companies that use transport service providers for their trade flows. The latter generally pay indirectly for the use of port infrastructure (i.e. they pay the shipping line, the terminal operator or both). The charges for shipping lines and tenants are mechanisms through which the port managing body captures the value they create for users 26.
Investments in port infrastructure also create societal value, through benefits for society at large, instead of or in addition to the direct users. The societal value creation is based on externalities, i.e. effects of the investments that reach beyond the users. These externalities are difficult to quantify and monetize. The most prevalent forms of societal value creation through port investments are the following 27:
• Improved maritime and hinterland connectivity, resulting in enhanced trade flows. A share of the benefits of enhanced trade, notably a stronger export competitiveness and positive effects for the economies in the port hinterland, can be considered as ‘value for society’.
• Local and regional economic development and associated employment creation 28, especially in regions with a weaker economic basis (e.g. peripheral regions and cohesion countries).
26. However, this value capture mechanism is imperfect. For instance, long-term lease contracts with tenants implying port managing bodies cannot increase lease fees even if they make investments that improve the competitiveness of the port. Thus, the charges to users can be regarded as the minimum of the economic value creation of these infrastructures. 27. Investments in port infrastructure may also lead to negative externalities, such as the environmental impacts due to the construction works. In general, compensation of such negative effects is required28. In a strict approach to societal value creation, the economic development impact and positive impact on trade may not be regarded as such because the economic impact of the investment arises mainly through the direct benefits of port operations for users. Thus, this impact is already considered under the economic value creation for port users. However, in the case where port development is essential to boost regional development in regions with a weak economic basis (e.g. peripheral regions and cohesion countries), notably through the enhancement of its industrial and tourism potential, these effects can be considered as ‘value for society’. Various studies show the substantial effect of port efficiency on trade and development (Clark et al, 2004, Portugal-Perez & Wilson, 2012).

Port Investments Study 201822
• Reduced road congestion. Making shortsea shipping more competitive and promoting modal shift reduces the costs for society generated by traffic congestion (increased travel times, unreliability, increased energy consumption and emissions).
• Reduced negative externalities for residents around the port and improved attractiveness of public spaces in the port area (e.g. green zones). For instance, investments facilitating the use of clean fuels in ports, such as in cold ironing, lead to a better air quality.
• Reduced CO2 emissions. The reduction of CO2 emissions in the port industrial cluster 29 and beyond the port area contributes to the decarbonisation of the economy and climate change mitigation. This form of value creation is especially relevant following the Paris Agreement to reduce CO2 emissions.
• The transformation of port land for urban purposes. Urban waterfront development (including housing) is often enabled by the transfer of port facilities to locations elsewhere. Thus, investments in port infrastructure that enable a shift of port activities away from the city center create value for society.
• Increased safety and security, including flood protection and more resilience of coastal zones against extreme weather conditions caused by climate change. Locks, for instance, may protect the area behind them against flooding. Likewise, investments in ICT infrastructure may increase security due to better data and real time availability.
• Innovation. Ports are active in all phases of innovation, from Research & Development (R&D) to testing and scaling-up 30, which has positive external effects for society.
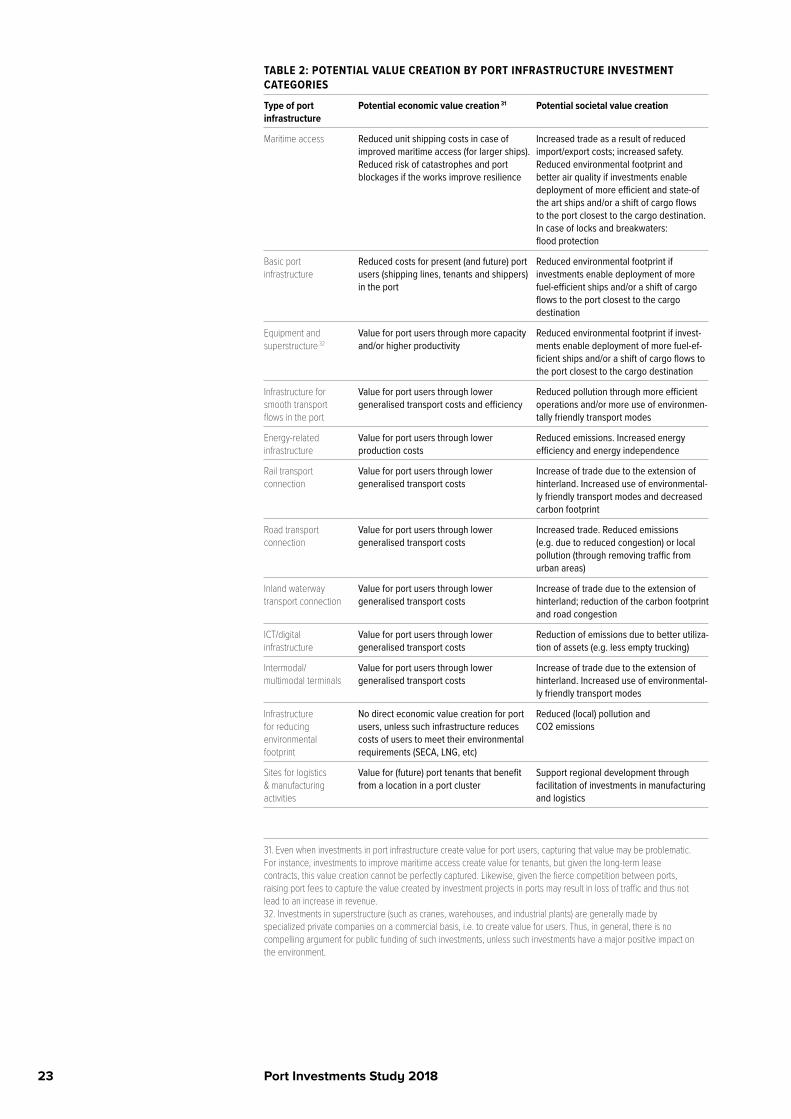
The majority of these mechanisms through which ports create value for society are also identified in the Commission’s Communication ‘Ports: an engine for growth’ (2013). The societal value creation is often substantial and is the reason for widespread government support for investments in port infrastructure as well as government ownership of port managing bodies. Table 2 shows the potential value creation of the investment categories previously defined.
29. The CO2 emissions in the port area are often a substantial part of the industry related emissions in the country as a whole. For instance, in the Netherlands, over 50% of all CO2 emissions by industry is emitted in port areas.. 30. EU support mechanisms for R&D are outside the scope of this report, which is focused on port infrastructure investments. However, such mechanisms are clearly very relevant for boosting the innovation performance in European ports.
Port Investments Study 201823
TABLE 2: POTENTIAL VALUE CREATION BY PORT INFRASTRUCTURE INVESTMENT CATEGORIES
Type of port infrastructure
Potential economic value creation 31 Potential societal value creation
Maritime access Reduced unit shipping costs in case of improved maritime access (for larger ships). Reduced risk of catastrophes and port blockages if the works improve resilience
Increased trade as a result of reduced import/export costs; increased safety. Reduced environmental footprint and better air quality if investments enable deployment of more efficient and state-of the art ships and/or a shift of cargo flows to the port closest to the cargo destination. In case of locks and breakwaters: flood protection
Basic port infrastructure
Reduced costs for present (and future) port users (shipping lines, tenants and shippers) in the port
Reduced environmental footprint if investments enable deployment of more fuel-efficient ships and/or a shift of cargo flows to the port closest to the cargo destination
Equipment and superstructure 32
Value for port users through more capacity and/or higher productivity
Reduced environmental footprint if invest-ments enable deployment of more fuel-ef-ficient ships and/or a shift of cargo flows to the port closest to the cargo destination
Infrastructure for smooth transport flows in the port
Value for port users through lower generalised transport costs and efficiency
Reduced pollution through more efficient operations and/or more use of environmen-tally friendly transport modes
Energy-related infrastructure
Value for port users through lower production costs
Reduced emissions. Increased energy efficiency and energy independence
Rail transport connection
Value for port users through lower generalised transport costs
Increase of trade due to the extension of hinterland. Increased use of environmental-ly friendly transport modes and decreased carbon footprint
Road transport connection
Value for port users through lower generalised transport costs
Increased trade. Reduced emissions (e.g. due to reduced congestion) or local pollution (through removing traffic from urban areas)
Inland waterway transport connection
Value for port users through lower generalised transport costs
Increase of trade due to the extension of hinterland; reduction of the carbon footprint and road congestion
ICT/digital infrastructure
Value for port users through lower generalised transport costs
Reduction of emissions due to better utiliza-tion of assets (e.g. less empty trucking)
Intermodal/ multimodal terminals
Value for port users through lower generalised transport costs
Increase of trade due to the extension of hinterland. Increased use of environmental-ly friendly transport modes
Infrastructure for reducing environmental footprint
No direct economic value creation for port users, unless such infrastructure reduces costs of users to meet their environmental requirements (SECA, LNG, etc)
Reduced (local) pollution and CO2 emissions
Sites for logistics & manufacturing activities
Value for (future) port tenants that benefit from a location in a port cluster
Support regional development through facilitation of investments in manufacturing and logistics
31. Even when investments in port infrastructure create value for port users, capturing that value may be problematic. For instance, investments to improve maritime access create value for tenants, but given the long-term lease contracts, this value creation cannot be perfectly captured. Likewise, given the fierce competition between ports, raising port fees to capture the value created by investment projects in ports may result in loss of traffic and thus not lead to an increase in revenue. 32. Investments in superstructure (such as cranes, warehouses, and industrial plants) are generally made by specialized private companies on a commercial basis, i.e. to create value for users. Thus, in general, there is no compelling argument for public funding of such investments, unless such investments have a major positive impact on the environment.
Port Investments Study 201824
The case for government co-funding of port infrastructure
Viable port infrastructure investments are those that are expected to produce a high value (benefitting both users and society at large) relative to their costs. Not all viable investments generate, however, the necessary financial return on investment to make them attractive from a commercial perspective, based on a business case. The core reason is the fact that the societal value creation (which is often substantial) cannot be (fully) captured through the port’s income. In addition, port infrastructure is capital intensive and has a long pay-back period.
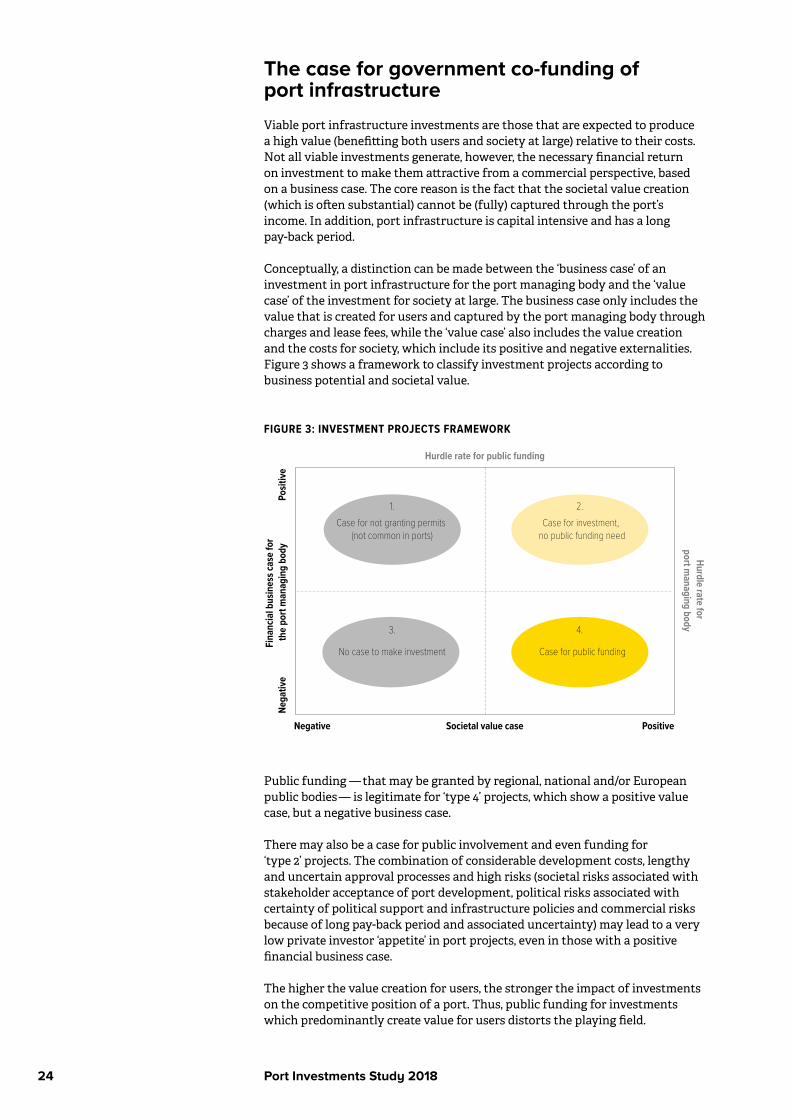
Conceptually, a distinction can be made between the ‘business case’ of an investment in port infrastructure for the port managing body and the ‘value case’ of the investment for society at large. The business case only includes the value that is created for users and captured by the port managing body through charges and lease fees, while the ‘value case’ also includes the value creation and the costs for society, which include its positive and negative externalities. Figure 3 shows a framework to classify investment projects according to business potential and societal value.
FIGURE 3: INVESTMENT PROJECTS FRAMEWORK
Negative
Nega
tive
PositiveSocietal value case
Hurdle rate for public funding
Hurdle rate for port m
anaging body
Posit
iveFi
nanc
ial b
usin
ess c
ase
for
the
port
man
agin
g bo
dy
Case for not granting permits (not common in ports)
No case to make investment Case for public funding
Case for investment, no public funding need
1. 2.
3. 4.
Public funding — that may be granted by regional, national and/or European public bodies — is legitimate for ‘type 4’ projects, which show a positive value case, but a negative business case.
There may also be a case for public involvement and even funding for ‘type 2’ projects. The combination of considerable development costs, lengthy and uncertain approval processes and high risks (societal risks associated with stakeholder acceptance of port development, political risks associated with certainty of political support and infrastructure policies and commercial risks because of long pay-back period and associated uncertainty) may lead to a very low private investor ‘appetite’ in port projects, even in those with a positive financial business case.
The higher the value creation for users, the stronger the impact of investments on the competitive position of a port. Thus, public funding for investments which predominantly create value for users distorts the playing field.

Port Investments Study 201825
However, the aim for a level playing field is compatible with public funding mechanisms for investments in port infrastructure that mostly create value for society.
Each port managing body sets a ‘hurdle rate’, the minimum financial return required for investment projects 33. In line with their societal goals, government-owned managing bodies are likely to have lower hurdle rates than private port managing bodies. However, as these managing bodies are more and more financially autonomous, they cannot finance 'type 4' investments by themselves (the increase of their revenues is not enough to cover investment costs), without losses 34.
Findings of ESPO’s port governance report* In 2016, most port managing bodies in Europe were government-owned; private ownership of major ports was only observed in the UK and Greece. Nevertheless, port managing bodies were moving towards more independent management structures and a more commercial approach. Compared to 2010, more port managing bodies (51% of the respondents of ESPO’s 2016 survey) were structured as independent commercial entities, while 44% of port authorities were (still) independent public bodies. Both categories generally needed to be self-financing and to take an entrepreneurial approach to port development.
ESPO’s report on port governance demonstrates that, in line with the societal value creation of investments in port infrastructure, most European port managing bodies are not aiming at maximising profits. Instead, whilst ensuring financial sustainability, they have a range of other goals, such as maximisation of added value and port throughput, facilitating trade and business or ensuring that port activity is sustainable in the long run (ESPO, 2016). This orientation towards societal value creation justifies making investments with relatively low returns.
* See www.espo.be/media/Trends_in_EU_ports_governance_2016_FINAL_VERSION.pdf
Thus, for self-financing government-owned port managing bodies and private port managing bodies alike, type 4 investment projects are not commercially viable and ‘unbankable’. Such investments can only be carried out if public funding is available through government grants. Long-term loans by public entities, such as the European Investment Bank or national development banks 35 could contribute to make the project financially sustainable, as a complementary measure to grants.
In conclusion, the societal value creation of investments in port infrastructure makes government co-funding legitimate when the revenue expectations from user charges are insufficient for a positive business case but investment projects do create substantial societal value.
33. In some cases, port managing bodies set a minimum hurdle rate for the whole portfolio of investments; some investments may be accepted even though the business case is negative, as long as this is compensated by other projects with positive business cases. 34. The managing body cannot obtain a loan for the specific project. If they are solvent enough they may be able to get a loan, but the project would still negatively impact the financial performance of the port managing body, i.e. it’s future investment capacity. Thus, while a managing body may be able to incidentally finance a ‘type 4’ project, they cannot do so on a structural basis. 35. The case for public involvement of ‘type 4 investments’ is also the main driver of PPP models globally applied to enable a private role in ports and port development. In such models, an adequate share of risks and rewards is designed with, generally, either public sector financing or insurance against important risks.

Port Investments Study 201826
In virtually all countries around the world 36, port infrastructure is partially funded by the public sector, to close the ‘financial gap’ for projects with a positive ‘value case’. Public funding of port infrastructure is the rule, rather than the exception. This also applies to the European Union.
The funding structures described below for one port infrastructure investment in 17 different EU Member States illustrates this conclusion (table 3) 37.
TABLE 3: EXAMPLES OF PORT INFRASTRUCTURE INVESTMENT FUNDING STRUCTURE IN 17 MEMBER STATES
EU Member state Port, case of infrastructure investment Funding structure
Belgium North Sea Port (Ghent), Sea lock CEF funding, national government, port managing body
Cyprus Lemesos, extension of breakwater and new quay walls
CEF funding, port managing body
Finland Port of Turku, smooth connection between sea and land transport
CEF funding, port managing body
France Nantes Saint-Nazaire, lengthening container terminal
CEF funding, port managing body
Greece Patras, breakwater, road access, terminal buildings
ERDF, national government
Ireland Dublin, redevelopment of Alexandra Basin CEF funding, port managing body
Italy Ravenna, dredging, upgrade and construction of quays
CEF funding, EIB loan, port managing body
Latvia Ventspils, dry cargo terminal & breakwater CEF funding, port managing body
Lithuania Klaipeda, infrastructure for the passenger and cargo ferries terminal
CEF funding, port managing body
Netherlands Removing the bottleneck on the rail freight corridor by realising the Theemsweg railway section
CEF funding, national government, port managing body
Malta Valletta and Marsaxlokk, road access to remove bottlenecks
CEF funding, port managing body
Poland Gdansk, expansion of quays and improvement of navigation
ERDF, national government, port managing body
Portugal Leixoes, new cruise ship terminal ERDF, national government, port managing body
Romania Constanta, new waste collection and treatment facility
CEF funding, port managing body
Slovenia Koper, dredging works, accessibility to Basin I
Cohesion Fund, national government
Spain Bilbao, quays and port area development CEF funding, port managing body
Sweden Trelleborg, moving the port to the East and real estate operation.
CEF funding, port managing body
Source: based on publicly available project information from the European Commission and EIB 38.
36. For a recent initiative with government funding for infrastructure development in the United States, see www.whitehouse.gov/briefings-statements/building-stronger-america-president-donald-j-trumps-american-infrastructure-initiative/. 37.This section describes the funding structure (e.g. part port managing body, part EU loan, part national or regional funding) not the precise funding arrangement (as investment amounts or loan details are not relevant here). 38. See https://ec.europa.eu/eipp/desktop/en/list-view.html#c,projects=+submitDateStr/asc for the EU information on financed projects; EIB provided an overview of loans to the maritime sector (including ports), which is a selection of the transport projects provided at www.eib.org/projects/loan/list/?sector=2010.
Port Investments Study 201827
Table 3 clearly reveals that partial public funding (EU, national, regional) for port infrastructure investments is the rule, not the exception. It also shows the relevance of CEF as a funding source. The findings demonstrate that the value creation of investments in port projects as outlined above has been acknowledged by the European Commission and Member States. In most cases, the public funding takes the form of grants. This practice is accommodated in the EU’s State aid policy with respect to ports. The General Block Exemption Regulation 39 for ports allows direct public financing of port infrastructure, access infrastructure and dredging below a certain threshold as it is considered to be compatible with the internal market and of common interest 40.
Both the widespread public funding and the block exemption underline that port investment projects with a positive societal value case, but a negative business case, are common in the EU and that for these “unbankable” projects grants are an important instrument.
Ports as strategic assets The geopolitical dimension of port infrastructure financing is important to mention, even if it goes beyond the scope of this study. Given the significance of ports for society in their various functions, many governments around the world consider ports as strategic assets for their economy and their international presence. Even though most governments retain some form of control over port assets, some of them rely on third parties, such as the World Bank, other multinational financial institutions or foreign governments for support in financing port investments. The latter, usually in the form of bilateral loans and even grants, give the lending country leverage on international trade flows and thus political influence. This explains why providing financing for port development has a geopolitical dimension.
Three policy considerations are worth mentioning. First, while ports in Europe have benefitted from substantial investment from outside the European Union, ports are strategic assets and have been designated as “critical infrastructure” (European Commission, 2006).
Second, the geopolitical dimension of port development strengthens the case for public funding mechanisms, as the absence of such mechanisms would accelerate foreign participation in the development of critical port infrastructure.
Third, given the emergence of China’s Belt and Road Initiative (BRI), a platform with mechanisms to provide financial support for port development, and certain Russian investments (for instance in pipelines), Europe may consider offering instruments for port financing, both for Member States’ ports and for current and prospective trade partners, especially in North Africa, as mechanism to secure the geopolitical interests of the EU.
39. Commission Regulation (EU) 2017/1084 of 14 June 2017 amending Regulation (EU) No 651/2014 as regards aid for port and airport infrastructure, […] and amending Regulation (EU) No 702/2014 as regards the calculation of eligible costs. 40. In addition, the funding of port infrastructure used for activities that the State, or the port managing body, normally performs in the exercise of its public powers, or that benefits society at large, is in principle excluded from the application of State aid rules.

Port Investments Study 201828
On the efficient use of public funding
The core challenge regarding funding decisions is how to identify ‘type 4’ projects (Figure 3, p. 24) and how to assess the societal value case of port projects. It is difficult to assess the societal value creation of a project ex-ante. Given the uncertainty of societal value creation, mechanisms to reduce the risks of misallocating public funding are relevant.
Public funding efficiency despite insufficient information The core risk associated with public funding is the misallocation of investment, i.e. putting public money in infrastructure projects that do not create sufficient value for users and society at large to justify the use of public funds. This risk is relevant as the value creation cannot always be accurately predicted. For instance, the use of port infrastructure is subject to uncertain factors such as the general development of the economy and trade flows, the competitiveness of the port vis-à-vis competing ports and trends in maritime logistics. In addition, cost benefit analysis generally tends to overestimate benefits and underestimate costs*. This leads to a risk of inefficient use of public funds, which can be reduced through the following mechanisms (which may not be applicable in all cases):
• Providing a funding mix in which loans are an important component, as loans lead to financial scrutiny of the project and place the risks with the managing body, reducing the risk of excessively optimistic assumptions in the business case.
• Develop a uniform approach to cost-benefit analysis (this item is further detailed in chapter 7).
• Splitting an investment project into various phases, potentially with loan commitments that are conditional to achievement of demand related performance criteria.
• Taking a step-by-step approach to infrastructure development, where planning processes and funding are secured but the final investment decision is tied to trustworthy information about the demand, for instance through contracts with a launching customer.
* Flyvbjerg, B. (2007). Policy and planning for large-infrastructure projects: problems, causes, cures. Environment and Planning B: Planning and Design, 34(4), 578-597.
A transparent and uniform set of EU funding mechanisms with a considerable budget would be preferable to a variety of national arrangements for funding investments in port infrastructure, which could risk to distort the market due to different national policies and which could lead to ‘policy competition’ between countries aiming to increase the competitiveness of their ports 41.
41. Even though state aid rules provide limitations to Member State funding of port infrastructure.


Port Investments Study 201830

Port Investments Study 201831
4 INVESTMENT NEEDS AND INVESTMENT PRIORITIES OF EUROPEAN PORTS
This section analyses the investment needs and priorities of European ports. It provides a detailed and reliable qualitative overview of those investment needs and priorities of European ports 42. The information in this section is based on the responses given by European seaports managing bodies to the survey conducted for the purpose of this study in December 2017 (hereafter Port investments survey). The survey explicitly focuses on broadly defined port infrastructure investments.
Investments in superstructure (such as cranes, warehouses, and industrial plants) are not included as such investments are generally made by specialised private companies and, in any case, on a commercial basis. This is why, in general, there is no compelling argument for public funding of such investments.
The managing bodies of all EU core ports were asked to provide data, while a selection of managing bodies of comprehensive ports was also approached. The number of responding ports is provided in the table below.
TABLE 4: SUMMARY OF RESPONSES TO THE SURVEY
Replies from EU core ports 51 out of 104 core ports
Replies from EU comprehensive ports 22 out of 225 comprehensive ports 43
Member states of which replies were obtained 18 out of 24 member states with maritime ports
Number of submitted investment projects 396 (on average more than 5 projects per port)
Source: Port investments survey
The responding seaports cover over 61% of the total cargo throughput in the EU 44. Given this high rate of responses, the survey results can be deemed representative of the total EU ports industry. In line with the survey approach, no data on individual ports is reported. The report does show the results split up in core and comprehensive ports.
The EU ports were requested to provide data on a maximum of 10 investment projects they foresee in the period 2021 – 2027. A database was created containing the information available on the total 396 investment projects identified in the survey. The number of projects submitted per port managing body was more than five. The investment projects included in the database are in different stages of maturity, as shown in figure 4.
42. This report does not aim to provide a complete overview of all (potential) investment projects in all European ports, as this is both practically impossible (all 330+ ports would have to provide data) and it would suggest that for all ports, investments can be perfectly planned, while in reality investments emerge in response to new market dynamics.. 43. Including two ports located in the EU outermost regions. 44. The coverage rises to close to over 68% if the UK ports throughput is excluded. Partly due to ‘Brexit’, no survey replies from the UK were received. It can be said that the survey results provide a ‘Post Brexit’ overview of EU port investment needs.

Port Investments Study 201832
FIGURE 4: PLANNING STAGE OF THE 396 SUBMITTED PROJECTS
0 20 40 60 80 100 120 140 160 180
Project being implemented
Studies finished as well as permits granted (i.e. project
can start immediately)
Studies finished, clarity on funding structure and governance; request for permits submitted
Studies finished, no clarity on funding structure and
governance of the project
Relevant studies started but not finished
Initial ideaPl
anni
ng st
age
Number of projects
Source: Port investments survey
Figure 4 shows a balanced mix of investment projects, with projects in (partial) realisation, others ready for execution, as well as projects in the study and idea phase. The port managing body gives higher importance to more mature projects than to projects in the study and idea phase.
The database provides a strong basis to understand the investment needs of the EU ports. Figure 5 shows the distribution of investment projects for the 12 investment categories distinguished in chapter 2 45.
FIGURE 5: PERCENTAGE OF PROJECTS SUBMITTED PER PORT INFRASTRUCTURE CATEGORY
Other 8%
Sites for port related logistics and manufacturing 3%Infrastructure for reducing environment footprint 1%
Intermodal/multimodal terminals 5%
ICT/digital infrastructure 4%
Maritime access 8%
Equipment en superstructure 8%
Energy-related infrastructure 7%
Rail transport connection 7%
Road transport connection 4%
Infrastructure for smooth transport flows 8%
Basic infrastructure 37%
Inland waterway transport connection 1%
Source: Port investments survey

Port Investments Study 201833
Table 5 shows the average importance attached to the different infrastructure investment categories.
TABLE 5: PORT INFRASTRUCTURE PROJECTS AVERAGE RANK 46
Maritime access 3.1
Intermodal/multimodal terminals 3.4
Basic infrastructure 3.6
Rail transport connection 3.7
Sites for port related logistics and manufacturing 4.3
Infrastructure for smooth transport flows 4.3
Inland waterway transport connection 4.5
Equipment and superstructure 4.7
Energy-related infrastructure 4.8
Infrastructure for reducing environment footprint 4.8
ICT/digital infrastructure 5.5
Road transport connection 5.8
Source: Port investments survey
Based on figure 4 and table 5, the following conclusions can be drawn. First, investments for the construction or upgrade of basic infrastructure continue to be the major type of infrastructure investment making up 37,4% of all projects in ports. In addition, these projects are generally ranked as the third most important category of infrastructure investments 47. Second, on top of the basic port infrastructure investments, port managing bodies see the need to undertake additional investments in an array of different categories, ranging from energy related infrastructure to sites for logistics and manufacturing and road, rail and inland waterway connections 48 and digital infrastructure.
Commodities for which basic port infrastructure is planned
The ports indicated the commodities for which investments in basic port infrastructure were made/planned. Figure 6 illustrates the results, with a distinction between core and comprehensive ports.
45. The category ‘other’ consists of investment needs that were not classified in one of the 12 pre-defined categories. Examples of ‘other’ investments in port infrastructure include: company buildings, development of inland port facilities and investments to improve the port-city interface. 46. The importance was expressed by the ranking of their investment projects by the port managing bodies. Thus, port managing bodies that submitted 10 projects made a ranking from 1 to 10, those that submitted 6 projects made a ranking from 1 to 6.47. If the total foreseen investment value in each of the categories is compared, basic infrastructure even is more dominant: close to 40% of the total estimated investment value of around 32 €billion concerns basic port infrastructure. The second largest category in this approach is infrastructure for smooth transport flows within the port, with a share of more than 11%. 48. Obviously only in ports with access to waterways. This explains a lower average rank for these projects.
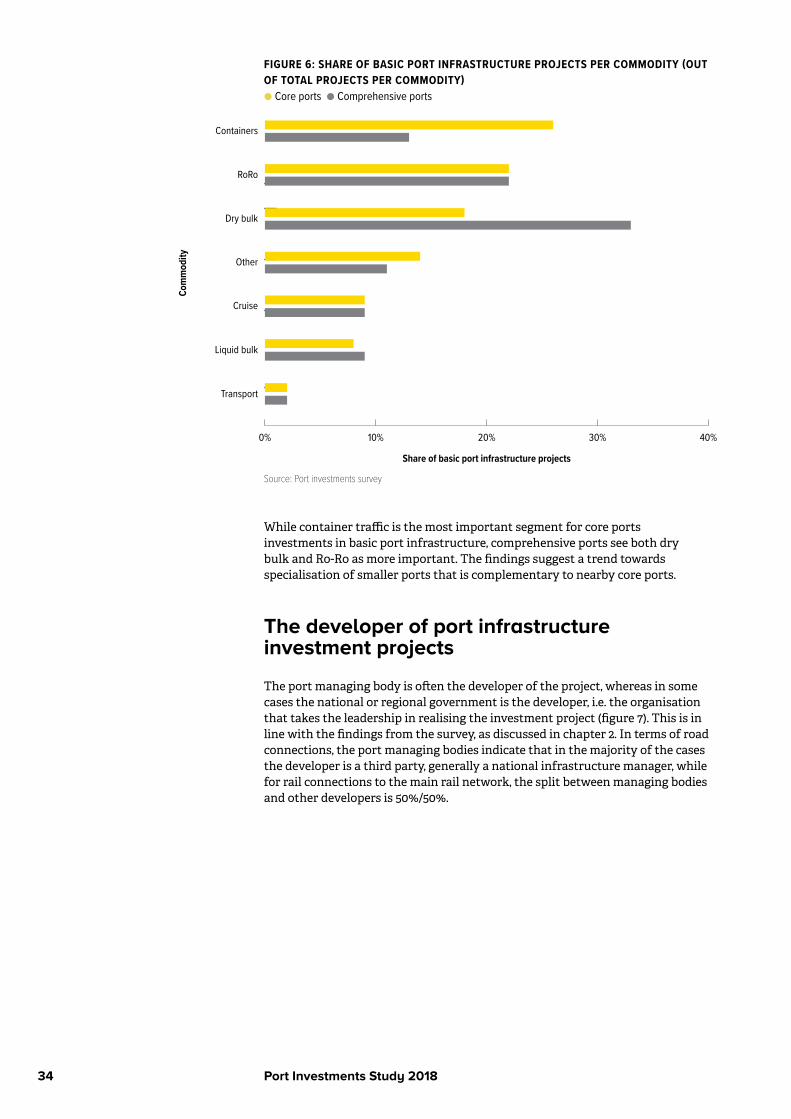
Port Investments Study 201834
FIGURE 6: SHARE OF BASIC PORT INFRASTRUCTURE PROJECTS PER COMMODITY (OUT OF TOTAL PROJECTS PER COMMODITY)● Core ports ● Comprehensive ports
0% 10% 20% 30% 40%
Transport
Liquid bulk
Cruise
Other
Dry bulk
RoRo
Containers
Com
mod
ity
Share of basic port infrastructure projects
Source: Port investments survey
While container traffic is the most important segment for core ports investments in basic port infrastructure, comprehensive ports see both dry bulk and Ro-Ro as more important. The findings suggest a trend towards specialisation of smaller ports that is complementary to nearby core ports.
The developer of port infrastructure investment projects
The port managing body is often the developer of the project, whereas in some cases the national or regional government is the developer, i.e. the organisation that takes the leadership in realising the investment project (figure 7). This is in line with the findings from the survey, as discussed in chapter 2. In terms of road connections, the port managing bodies indicate that in the majority of the cases the developer is a third party, generally a national infrastructure manager, while for rail connections to the main rail network, the split between managing bodies and other developers is 50%/50%.
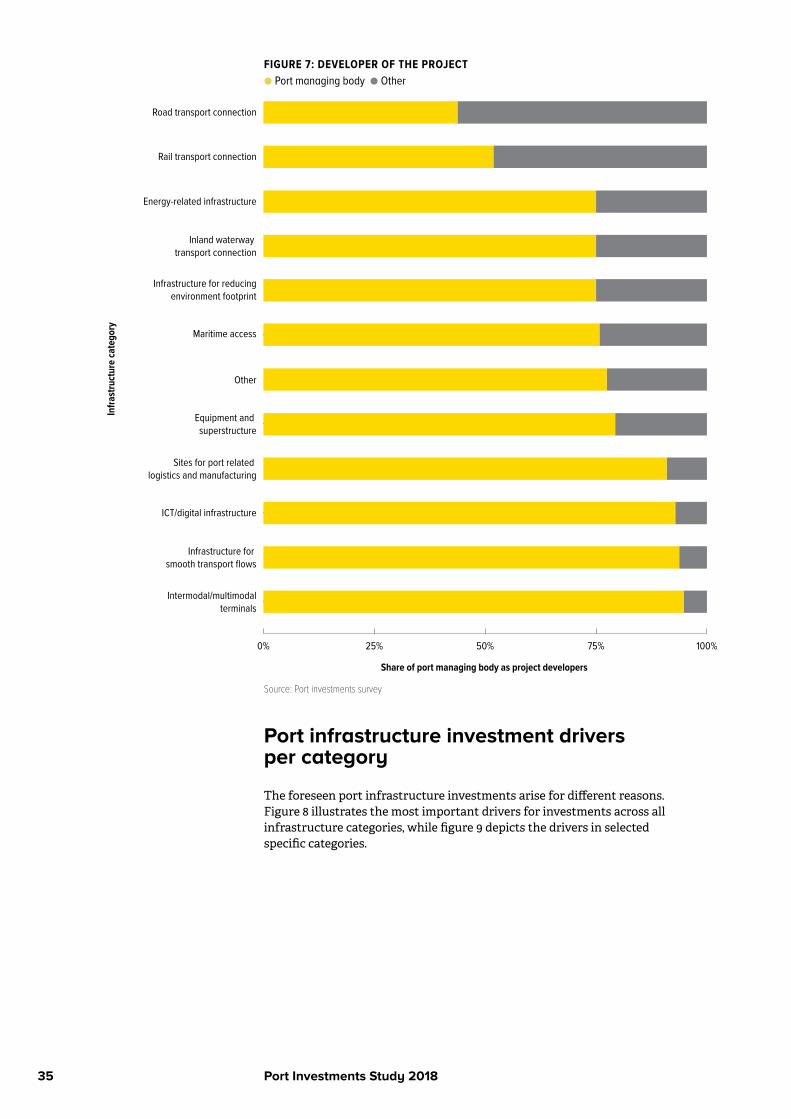
Port Investments Study 201835
FIGURE 7: DEVELOPER OF THE PROJECT● Port managing body ● Other
0% 25% 50% 75% 100%
Intermodal/multimodalterminals
Infrastructure for smooth transport flows
ICT/digital infrastructure
Sites for port related logistics and manufacturing
Equipment and superstructure
Other
Maritime access
Infrastructure for reducingenvironment footprint
Inland waterway transport connection
Energy-related infrastructure
Rail transport connection
Road transport connectionIn
frast
ruct
ure
cate
gory
Share of port managing body as project developers
Source: Port investments survey
Port infrastructure investment drivers per category
The foreseen port infrastructure investments arise for different reasons. Figure 8 illustrates the most important drivers for investments across all infrastructure categories, while figure 9 depicts the drivers in selected specific categories.

Port Investments Study 201836
FIGURE 8: RELEVANCE OF INVESTMENT DRIVERS
0% 25% 50% 75% 100%
Expected growth of trade flows
Increasing size of vessels
Pollution mitigation
Decarbonisation of economy and associated
energy transition
Societal pressure and policies for a modal shift
Increasing pressure to develop port infra outside the center
to enable urban development
Expected growth of cruise passenger volumes
Expected growth offerry passenger volumes
Increased digitalisationof transport chains
Frequency of identified driver
Inve
stm
ent d
river
Source: Port investments survey
Investments are usually necessary because of several drivers. The expected increase in trade flows continues to be an important driver of investment needs. This expectation is in line with forecasts that suggest trade growth by UNCTAD and a range of advisory firms 49. In addition, the EU corridor studies also generally forecast growth in trade volumes. In addition to trade growth, drivers such as scale increases of ships or the requirements to improve the environmental performance and decarbonisation generate investment needs in ports.
49. See UNCTAD’s Review of Maritime Transport 2017, which includes an overview of forecasts of advisory firms at page 16.
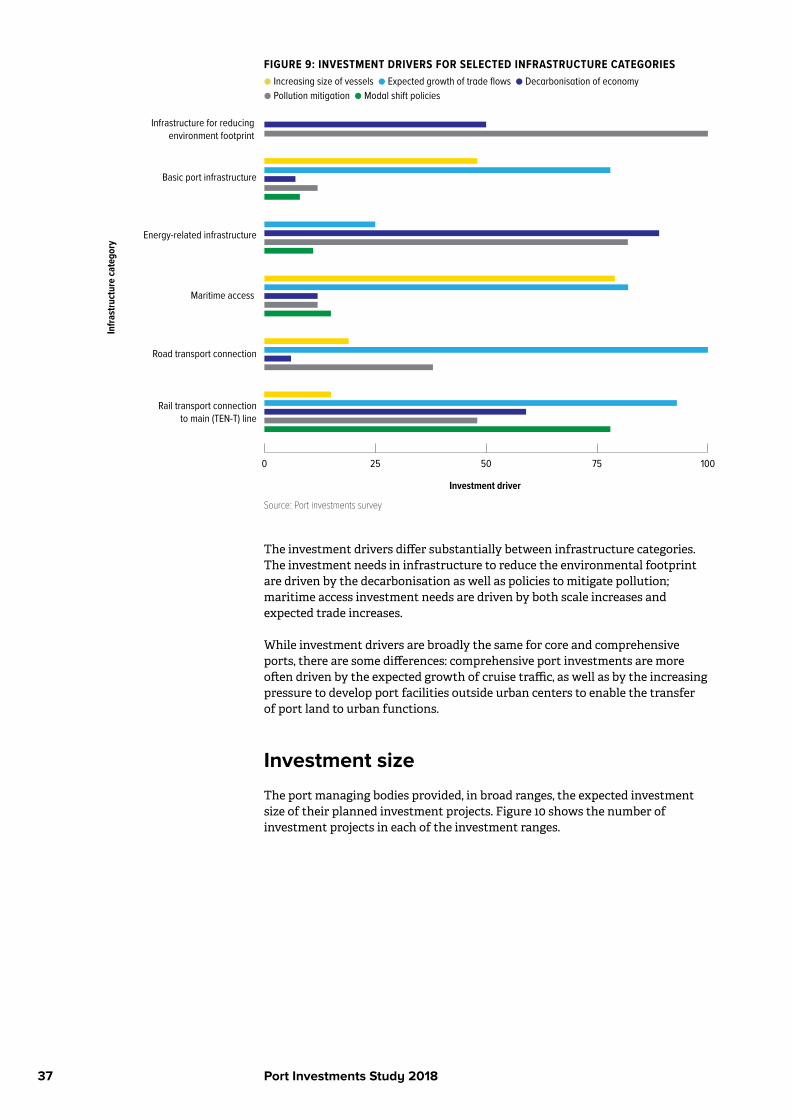
Port Investments Study 201837
FIGURE 9: INVESTMENT DRIVERS FOR SELECTED INFRASTRUCTURE CATEGORIES● Increasing size of vessels ● Expected growth of trade flows ● Decarbonisation of economy ● Pollution mitigation ● Modal shift policies
0 25 50 75 100
Rail transport connectionto main (TEN-T) line
Road transport connection
Maritime access
Energy-related infrastructure
Basic port infrastructure
Infrastructure for reducing environment footprint
Investment driver
Infra
stru
ctur
e ca
tego
ry
Source: Port investments survey
The investment drivers differ substantially between infrastructure categories. The investment needs in infrastructure to reduce the environmental footprint are driven by the decarbonisation as well as policies to mitigate pollution; maritime access investment needs are driven by both scale increases and expected trade increases.
While investment drivers are broadly the same for core and comprehensive ports, there are some differences: comprehensive port investments are more often driven by the expected growth of cruise traffic, as well as by the increasing pressure to develop port facilities outside urban centers to enable the transfer of port land to urban functions.
Investment size
The port managing bodies provided, in broad ranges, the expected investment size of their planned investment projects. Figure 10 shows the number of investment projects in each of the investment ranges.

Port Investments Study 201838
FIGURE 10: NUMBER OF PROJECTS PER INVESTMENT RANGE
0 40 80 120 160
<20
20 – 50
50 – 100
100 – 200
>200
Inve
stm
ent r
ange
(€ m
illion
)
Number of projects
Source: Port investments survey
The estimate of the size of the investment pipeline of the ports that provided data is around 32 €billion 50 until 2027. If we exclude UK from the analysis, the ports that replied represent over 68% of EU throughput. An extrapolation based on throughput allows for a rough estimate of the investment pipeline of all EU-27 seaports excluding the British ones at around 48 €billion, or around 5 €billion per year during the period 2018 – 2027.
50. This estimate is obtained by multiplying the average of each category (e.g. 10 €million for the category 0 – 20 €million) with the number of projects submitted in the survey. For the category >200 €million we assumed an average investment level of 300 €million. The shortcomings of taking the average is acknowledged, but there is no solid basis for assuming another distribution of the average investment values. .
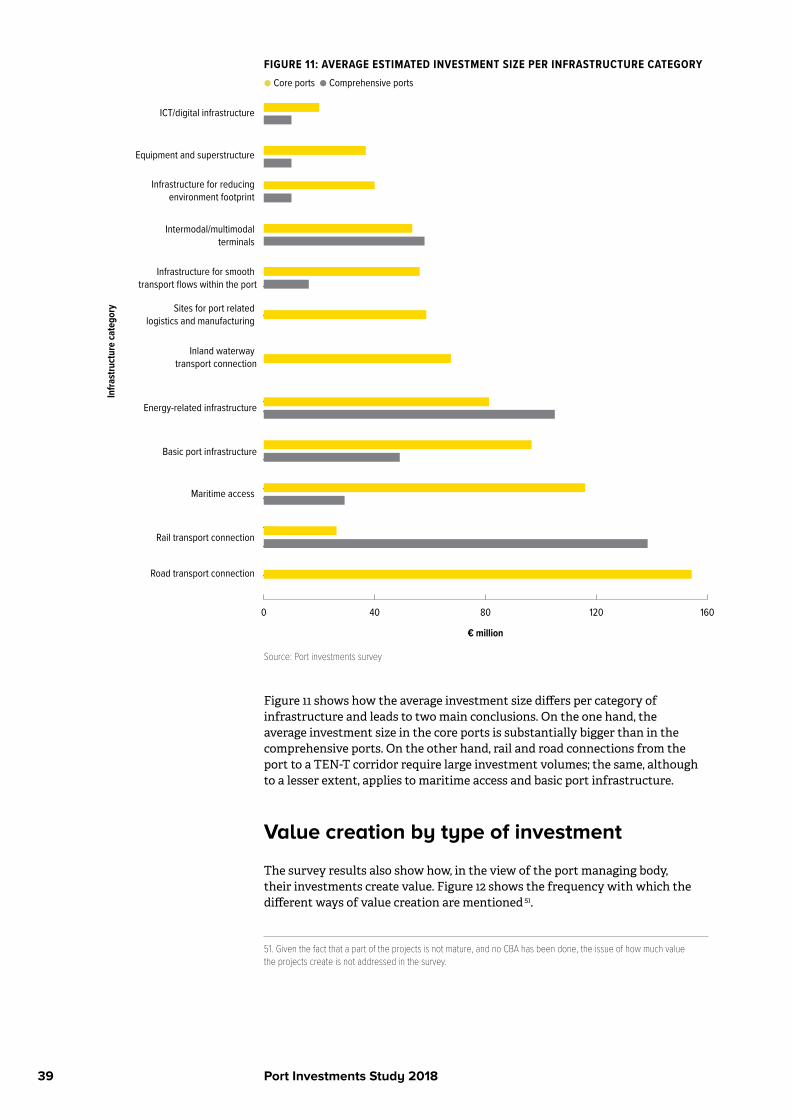
Port Investments Study 201839
FIGURE 11: AVERAGE ESTIMATED INVESTMENT SIZE PER INFRASTRUCTURE CATEGORY ● Core ports ● Comprehensive ports
0 40 80 120 160
Road transport connection
Rail transport connection
Maritime access
Basic port infrastructure
Energy-related infrastructure
Inland waterway transport connection
Sites for port related logistics and manufacturing
Infrastructure for smooth transport flows within the port
Intermodal/multimodal terminals
Infrastructure for reducing environment footprint
Equipment and superstructure
ICT/digital infrastructure
€ million
Infra
stru
ctur
e ca
tego
ry
Source: Port investments survey
Figure 11 shows how the average investment size differs per category of infrastructure and leads to two main conclusions. On the one hand, the average investment size in the core ports is substantially bigger than in the comprehensive ports. On the other hand, rail and road connections from the port to a TEN-T corridor require large investment volumes; the same, although to a lesser extent, applies to maritime access and basic port infrastructure.
Value creation by type of investment
The survey results also show how, in the view of the port managing body, their investments create value. Figure 12 shows the frequency with which the different ways of value creation are mentioned 51.
51. Given the fact that a part of the projects is not mature, and no CBA has been done, the issue of how much value the projects create is not addressed in the survey.
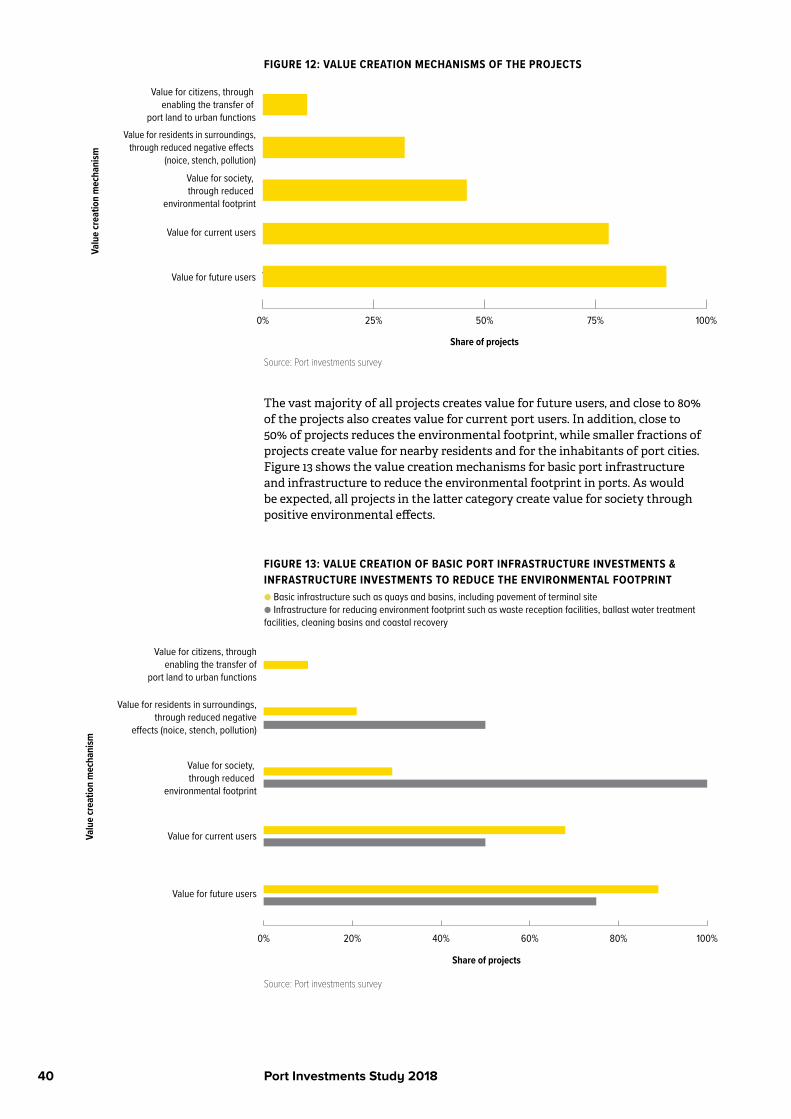
Port Investments Study 201840
FIGURE 12: VALUE CREATION MECHANISMS OF THE PROJECTS
0% 25% 50% 75% 100%
Value for future users
Value for current users
Value for society, through reduced
environmental footprint
Value for residents in surroundings, through reduced negative e�ects
(noice, stench, pollution)
Value for citizens, through enabling the transfer of
port land to urban functions
Share of projects
Valu
e cr
eatio
n m
echa
nism
Source: Port investments survey
The vast majority of all projects creates value for future users, and close to 80% of the projects also creates value for current port users. In addition, close to 50% of projects reduces the environmental footprint, while smaller fractions of projects create value for nearby residents and for the inhabitants of port cities. Figure 13 shows the value creation mechanisms for basic port infrastructure and infrastructure to reduce the environmental footprint in ports. As would be expected, all projects in the latter category create value for society through positive environmental effects.
FIGURE 13: VALUE CREATION OF BASIC PORT INFRASTRUCTURE INVESTMENTS & INFRASTRUCTURE INVESTMENTS TO REDUCE THE ENVIRONMENTAL FOOTPRINT● Basic infrastructure such as quays and basins, including pavement of terminal site ● Infrastructure for reducing environment footprint such as waste reception facilities, ballast water treatment facilities, cleaning basins and coastal recovery
0% 20% 40% 60% 80% 100%
Value for future users
Value for current users
Value for society, through reduced
environmental footprint
Value for residents in surroundings,through reduced negative
e�ects (noice, stench, pollution)
Value for citizens, throughenabling the transfer of
port land to urban functions
Share of projects
Valu
e cr
eatio
n m
echa
nism
Source: Port investments survey
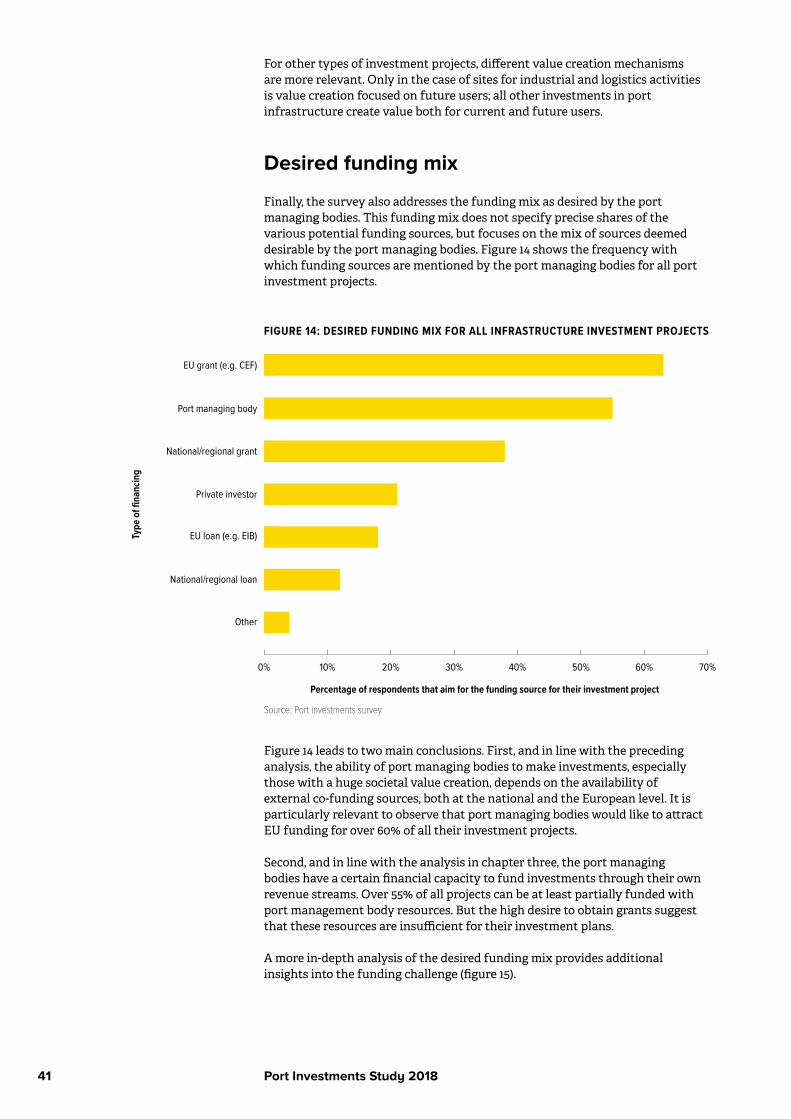
Port Investments Study 201841
For other types of investment projects, different value creation mechanisms are more relevant. Only in the case of sites for industrial and logistics activities is value creation focused on future users; all other investments in port infrastructure create value both for current and future users.
Desired funding mix
Finally, the survey also addresses the funding mix as desired by the port managing bodies. This funding mix does not specify precise shares of the various potential funding sources, but focuses on the mix of sources deemed desirable by the port managing bodies. Figure 14 shows the frequency with which funding sources are mentioned by the port managing bodies for all port investment projects.
FIGURE 14: DESIRED FUNDING MIX FOR ALL INFRASTRUCTURE INVESTMENT PROJECTS
0% 10% 20% 30% 40% 50% 60% 70%
Other
National/regional loan
EU loan (e.g. EIB)
Private investor
National/regional grant
Port managing body
EU grant (e.g. CEF)
Percentage of respondents that aim for the funding source for their investment project
Type
of fi
nanc
ing
Source: Port investments survey
Figure 14 leads to two main conclusions. First, and in line with the preceding analysis, the ability of port managing bodies to make investments, especially those with a huge societal value creation, depends on the availability of external co-funding sources, both at the national and the European level. It is particularly relevant to observe that port managing bodies would like to attract EU funding for over 60% of all their investment projects.
Second, and in line with the analysis in chapter three, the port managing bodies have a certain financial capacity to fund investments through their own revenue streams. Over 55% of all projects can be at least partially funded with port management body resources. But the high desire to obtain grants suggest that these resources are insufficient for their investment plans.
A more in-depth analysis of the desired funding mix provides additional insights into the funding challenge (figure 15).

Port Investments Study 201842
FIGURE 15: DESIRED FUNDING MIX FOR SELECTED INFRASTRUCTURE CATEGORIES● EU grant (e.g. CEF) ● EU loan (e.g.EIB) ● National/regional grant ● National/regional loan ● Private investor ● Port managing body
0 10 20 30 40 50 60 70 80 90 100
Sites for port relatedlogistics and manufacturing
activities in the port area
Energy-relatedinfrastructure
Basic portinfrastructure
Infrastructure for reducingenvironment footprint
Percentage of respondents that aim for the funding source for their investement project
Infra
stru
ctur
e ca
tego
ry
Source: Port investments survey
Figure 15 shows substantial differences between infrastructure categories: port managing bodies are less able 52 to invest in energy-related infrastructure, while they carry a larger share of investments in port-related manufacturing and logistics sites themselves. Furthermore, for infrastructure aiming at the reduction of the environmental footprint, the port managing bodies aim at obtaining grants for funding, not loans. For the largest infrastructure category, basic port infrastructure, ports use various types of funding. Figures 14 and 15 also show that port managing bodies seek grants more compared to loans. Finally, the survey results show the relation between the value creation mechanisms and the desired funding mix: managing bodies aspire to get public funding for projects with societal value creation. Port managing bodies have particularly high expectations regarding European grants for energy-related infrastructures, which generally reduce the environmental footprint.
52. In some cases, the institutional set-up of port managing bodies may not allow them to invest in energy infrastructure. In addition, they may not be able to develop a revenue stream in relation to such infrastructure, making investments practically unviable.


Port Investments Study 201844
Port Investments Study 201845
5 EU PORT POLICIES AND INSTRUMENTS FOR FINANCING INVESTMENTS IN PORT INFRASTRUCTURE
The investment capacity of port managing bodies
The previous section demonstrates that there are huge investment needs in Europe’s seaports, which are determined by the challenges faced by the ports industry. Most of EU’s port managing bodies have a substantial investment capacity. Based on a review of available annual reports and financial accounts, the annual investment capacity of the port managing bodies in the EU, based on current operations, has been estimated at around 2,2 €billion 53 for the EU-27 (in line with the investment needs estimate, which also excluded the UK). That is about half of the yearly investment needs (around 5 €billion according to the survey) 54.
A rough estimate of the investment capacity of EU’s port managing bodiesThe port managing bodies develop projects using public funds and own resources as well as loans (table 3, p. 26). A rough estimate of the investment capacity of the European port managing bodies can be made, based on publicly available data on investment in the past periods. However, this information is only available for a moderate number of core ports. We have collected investment data of 12 EU core ports with publicly available financial data for three years. The average annual investments of these port managing bodies, expressed in relation to the throughput of the ports involved was 0,65 € per tonnes of throughput for the weighted average (i.e. the averages of the ports of Rotterdam, Antwerp and Hamburg receive a higher weight) and 0,89 € per tonnes of throughput for the unweighted average. For the port managing bodies for which data has been collected, investments during the three years amounted to 2,4 €billion, and the throughput to 3,7 billion tonnes. This shows the substantial investment capacity of the EU port managing body. Extrapolating the weighted average of the investment per tonnes of throughput to the EU-28 excluding the UK, leads to an estimate of the annual investment capacity of around 2,2 €billion per year.
* Flyvbjerg, B. (2007). Policy and planning for large-infrastructure projects: problems, causes, cures. Environment and Planning B: Planning and Design, 34(4), 578 – 597.
53. We acknowledge that the estimate is imperfect: ports may invest less than their investment capacity, while they also may have invested more than their ‘autonomous’ capacity precisely because they have received grants and/or loans. Throughput volume data of 2015 were used from Eurostat (Eurostat, 2018, available at http://appsso.eurostat.ec.europa.eu/nui/show.do?dataset=mar_mg_aa_cwhd&lang=en). 54. It is important to note that in general and across all types of infrastructure, the executed investments are substantially lower than the initially foreseen investment needs. The analysis of projects with CEF grants shows that a significant amount of them are not implemented (on time) or in its totality. This is due, in part, to planning modifications that may lead to smaller projects, phasing of projects and/or postponement.
Port Investments Study 201846
An overview of EU instruments for financing investments in port infrastructure
The EU budget includes dedicated funds to support common policies. The European Structural and Investment Funds, devoted to job creation and to a sustainable and healthy European economy and environment has two funds that are basically aimed at reducing the wealth gap among the regions of the Union through the provision of grants: the European Regional Development Fund (ERDF) and the Cohesion Fund (CF). These multisector funds are accompanied by some sector-specific funds, such as the Connecting Europe Facility (CEF) supporting Trans-European Networks. The potential of these EU instruments for port investment financing are briefly explained:
The European Regional Development Fund (ERDF) finances infrastructure projects that are essentially defined by Member States and regions through their Operational Programmes. These are prepared by the beneficiaries, who also propose the projects to be financed by these programmes. However, programmes require an initial approval from the Commission services and projects are only financed once these services give a final acceptance. The grant may cover up to 50% of the project cost, requiring thus a strong contribution from national and/or regional budgets. Given the long tradition of this funding method and the modest amounts devoted to port investments 55, ERDF is not discussed further here 56.
The Connecting Europe Facility (CEF), the successor of the TEN (transport and energy) budget line, supports the development of high-performing, sustainable and efficiently interconnected trans-European networks in the fields of transport, energy and digital services. In the case of transport, its focus is on missing links of the Core Network, in particular those that are cross-border and on horizontal priorities such as traffic management systems. CEF Transport also supports innovation to improve the use of infrastructure, reduce the environmental impact of transport, enhance energy efficiency and increase safety.
In addition to grants, the CEF offers financial support to projects through innovative financial instruments such as guarantees and project bonds, usually in combination with EIB loans (see EFSI), mostly oriented to raise private sector investment in infrastructure and to incentivise the participation of other public-sector actors. These projects involving private partners are eligible to specific “Blending Calls”, through which the CEF offers both grants and other support for these mixed ventures.
Whilst the responsibility for defining policies and priorities falls on DG MOVE, most of the CEF (27,4 €billion out of 30,4 €billion), is technically implemented through INEA. For transport, INEA manages 22,4 €billion out of the 24,05 €billion allocated to the sector; the remaining 1,65 €billion are directly managed by DG MOVE. About 80% of the available money, corresponding to projects approved by Member States, was allocated in the two first years (i.e. the 2014 and 2015 calls), leaving relatively small amounts for the next calls. Given the large oversubscription in 2014 – 2016, as well as for the Blending Call of 2017, it is clear that the programme is insufficient to fulfil the co-financing requirements of Member States. The particularities of the Facility and the limited weight of port projects in it are discussed in the next chapter.
55. Most of the ERDF funds should be devoted to its priorities: Innovation and research; the digital agenda; support for SMEs; and the low-carbon economy. This means that, in particular for more developed regions, traditional infrastructure projects are, in most cases, non-eligible. 56. This overview also excludes Horizon 2020, as this program is oriented towards R&D, not towards investments in port infrastructure.

Port Investments Study 201847
The Cohesion Fund (CF) is a more recent fund, established in 1994 to assist those Member States with a Gross National Income per capita below the 90% of the EU average to join the Monetary Union. After the successive enlargements of the Union, it is now a fund that aims at reducing economic and social disparities through the financing of projects supporting the development of trans-European networks and the improvement of the environment.
The maximum amount to be granted by the CF is 85% of the public net contribution to the project 57. The requests to the CF originate at national level and are analysed and eventually approved by the Commission.
The countries benefitting from the CF for the 2014 – 2020 period are Bulgaria, Croatia, Cyprus, the Czech Republic, Estonia, Greece, Hungary, Latvia, Lithuania, Malta, Poland, Portugal, Romania, Slovakia and Slovenia. Most of them will probably still be recipients of the Fund for the next 2021 – 2027 period. The amount of 63,4 €billion allocated in the current period will be affected by the ongoing negotiations on the EU budget and the Brexit negotiations.
The CF can only be used to finance investments in transport and in projects that benefit the environment (including energy and transport). The transport component is devoted to finance projects being part of the trans-European networks and may be used as grants for port investments, particularly when they are included in priority projects, notably the nine TEN-T Corridors and the MoS horizontal priority. The assignment of an important part of the CF to the Connecting Europe Facility (CEF), which has reached 11,3 €million, in current prices, for the period 2014 – 2020 (80 to 85% to priority projects), means that port projects in Cohesion Countries, may obtain grants directly through the CF or through the CEF. In the first case DG REGIO (through shared management with the Member State) would be responsible, whilst INEA manages the CEF. This arrangement will most probably continue for the period 2021 – 2027, as it is a convenient way to ensure the quality of the projects to be financed (INEA’s management of CEF is discussed in more detail in this chapter).
The component of the CF assigned to environmental projects may also include certain port projects. The requirement is that they are clearly devoted to the improvement of the environment. Energy efficiency, renewable energy or the development of rail connections are types of projects that are also eligible to this component of the CF. The co-funding rates for grants are listed in table 6.
57. This public net contribution is the “financial gap” that is equal to the negative Net Present Value (NPV) of the cost of the project less the discounted net revenues (income generated by the project minus operating and maintenance costs) during the life cycle of the project, less the discounted residual value.
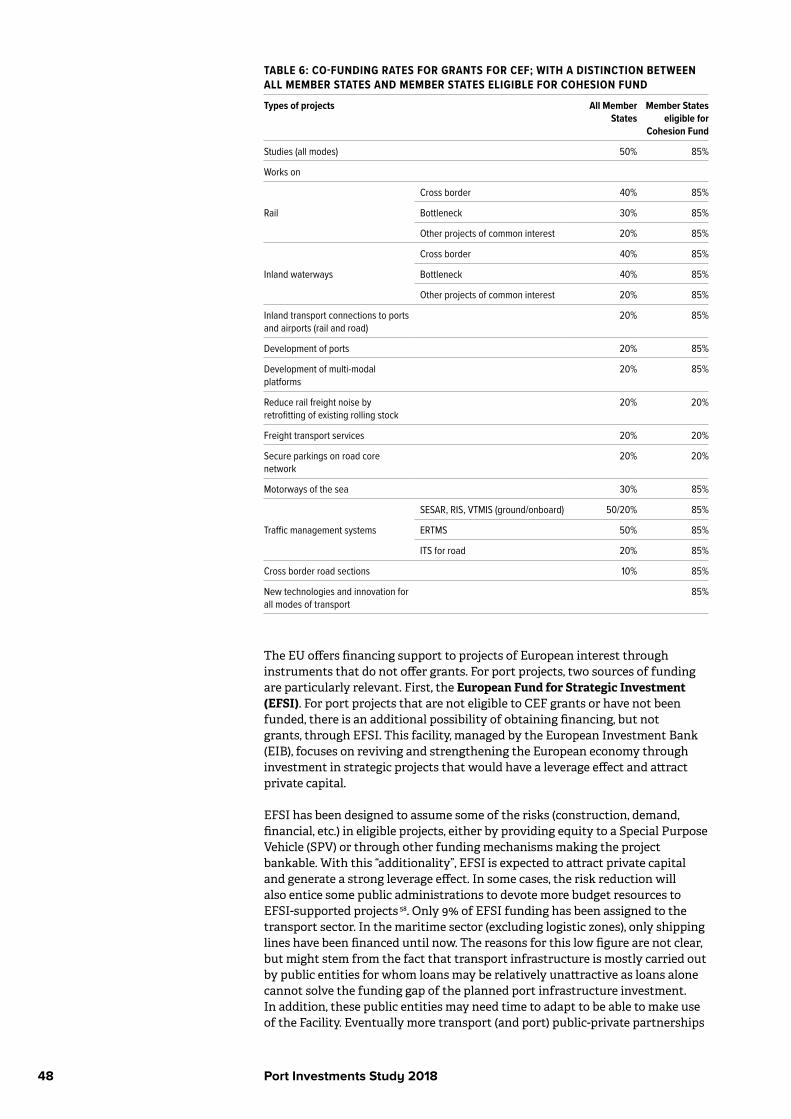
Port Investments Study 201848
TABLE 6: CO-FUNDING RATES FOR GRANTS FOR CEF; WITH A DISTINCTION BETWEEN ALL MEMBER STATES AND MEMBER STATES ELIGIBLE FOR COHESION FUND
Types of projects All Member States
Member States eligible for
Cohesion Fund
Studies (all modes) 50% 85%
Works on
Rail
Cross border 40% 85%
Bottleneck 30% 85%
Other projects of common interest 20% 85%
Inland waterways
Cross border 40% 85%
Bottleneck 40% 85%
Other projects of common interest 20% 85%
Inland transport connections to ports and airports (rail and road)
20% 85%
Development of ports 20% 85%
Development of multi-modal platforms
20% 85%
Reduce rail freight noise by retrofitting of existing rolling stock
20% 20%
Freight transport services 20% 20%
Secure parkings on road core network
20% 20%
Motorways of the sea 30% 85%
Traffic management systems
SESAR, RIS, VTMIS (ground/onboard) 50/20% 85%
ERTMS 50% 85%
ITS for road 20% 85%
Cross border road sections 10% 85%
New technologies and innovation for all modes of transport
85%
The EU offers financing support to projects of European interest through instruments that do not offer grants. For port projects, two sources of funding are particularly relevant. First, the European Fund for Strategic Investment (EFSI). For port projects that are not eligible to CEF grants or have not been funded, there is an additional possibility of obtaining financing, but not grants, through EFSI. This facility, managed by the European Investment Bank (EIB), focuses on reviving and strengthening the European economy through investment in strategic projects that would have a leverage effect and attract private capital.
EFSI has been designed to assume some of the risks (construction, demand, financial, etc.) in eligible projects, either by providing equity to a Special Purpose Vehicle (SPV) or through other funding mechanisms making the project bankable. With this “additionality”, EFSI is expected to attract private capital and generate a strong leverage effect. In some cases, the risk reduction will also entice some public administrations to devote more budget resources to EFSI-supported projects 58. Only 9% of EFSI funding has been assigned to the transport sector. In the maritime sector (excluding logistic zones), only shipping lines have been financed until now. The reasons for this low figure are not clear, but might stem from the fact that transport infrastructure is mostly carried out by public entities for whom loans may be relatively unattractive as loans alone cannot solve the funding gap of the planned port infrastructure investment. In addition, these public entities may need time to adapt to be able to make use of the Facility. Eventually more transport (and port) public-private partnerships
Port Investments Study 201849
(PPPs) may enter the EFSI pipeline. A particular mechanism of EFSI, the use of Investment Platforms to finance projects that, due to their small size cannot be individually handled by CEF or by the EIB, may have potential to increase port financing within EFSI (text box, p. 78).
Given the fact that EFSI has been functioning well, an extension (EFSI 2.0) has recently been approved to expand the total investment target from 315 €billion to 500 €billion. Continuity in the future EU Agenda for 2021 – 2027 can be expected. The focus of the Fund may move towards projects with a longer perspective, such as PPPs for infrastructure. Some port projects, such as rail links to the international hinterland or with a clear focus on the development of the Single Market, as well as protection works, required to increase resilience to climate change will be considered a priority for the new EFSI for the period 2021 – 2027) 59.
The second option for non-grant (i.e. loan) financial support is the European Investment Bank (EIB). EIB is the International Financing Institution (IFI) with the highest lending amount (74,7 €billion in 2016) among all IFIs, 87% of it in the EU. It occupies a key role in funding those projects in the region requiring long-term and/or adapted financing that commercial banks are not ready to provide, at least without the complementary funds lent by the EIB. The EIB is covering a capital market gap through a limited contribution to the project (up to 50% of its cost) and by doing so it pulls investors and commercial banks to participate in ventures of EU interest. It is under this label that port projects, notably those that are part of the development of the TEN-T network, are financed, although other eligibility criteria, for instance regional development or environment improvement, can also be used.
The traditional approach to project financing of the EIB is slowly changing towards playing a more proactive role in EU policies, in particular regarding the promotion of economic activity, the creation of employment and the movement towards a knowledge economy. This translates in a greater predisposition to adopt higher risks in their traditional lending activity and in providing more support to private project promoters adopting innovation or challenging the established markets. The EIB often assumes risks in tandem with the European Commission, notably through the specific financial instruments for SMEs and for research and development and the financing of PPPs (see EFSI).
Practically all investments in ports are eligible to EIB financing because they comply with EU policies. Those included in the TEN-T networks or located in convergence regions (as defined by DG REGIO) are, by definition, eligible. Even projects in small non-TEN-T ports located in more developed regions may be acceptable if they can show strong innovative content or aim to solve environmental concerns. The main potential advantages of the EIB financing of a project can be summarised as:
58. The leverage effect was expected to result in a total investment amount between 330 and 415 €billion by 2018. In Mid-December 2017, the sum financed by the EIB group (EIB & European Investment Fund, supporting SMEs) was 51,1 €billion (39,2 €billion in EIB loans) for project costs of 256 €billion, or 81% of the 315 €billion target that was established. 59. In EFSI 2.0 more emphasis is already placed on projects that contribute to climate action as well as on projects (including services) involving cross-border infrastructure investments that have been specifically identified as providing additionality (i.e. projects that would not have happened without EFSI support).

Port Investments Study 201850
1. the provision of an important amount of the funding needs, that may reach 50% of the total cost of the project (which includes components, such as contingencies and interest during construction that are not easily included in the calculation of EU grants);2. lending at the lowest interests in the market, as it is a non-profit AAA institution obtaining the best conditions in the money market;3. the possibility to adapt the loan to the specific requirements of the project 60. 4. the flexibility that arises from the joint analysis with the promoter to make sure that the financial structure is sustainable and that the project will be completed, as the objective of the EIB is not to make profits, but to support projects of EU interest.
The EU financing instruments described above are summarised in table 7.
TABLE 7: SUMMARY OVERVIEW OF EU FINANCING INSTRUMENTS
EU financing instruments for ports
Loan/grant Coverage Observations
ERDF (not included in this study)
Grant Convergence regions Not very relevant for non-convergence regions
CF Grant Cohesion countries 85% of financial gap
CEF Grant (mostly) Priority projects Ports, esp. in priority corridors
EFSI
Equity, loans and guarantees
High-leverage projects in priority areas, with risks and/or insufficient private profitability that prevent bankability
Potential for public and private investors, notably in cross-border and resilience to climate change projects
EIB Loans (mostly) Most port projects eligible(also non TEN-T)
Quality requirements
60. The EIB can offer loan tenures that are not offered by commercial banks and that are particularly well adapted to infrastructure projects with long-life cycles. It also offers grace periods that are often needed by projects with a long construction phase.


Port Investments Study 201852
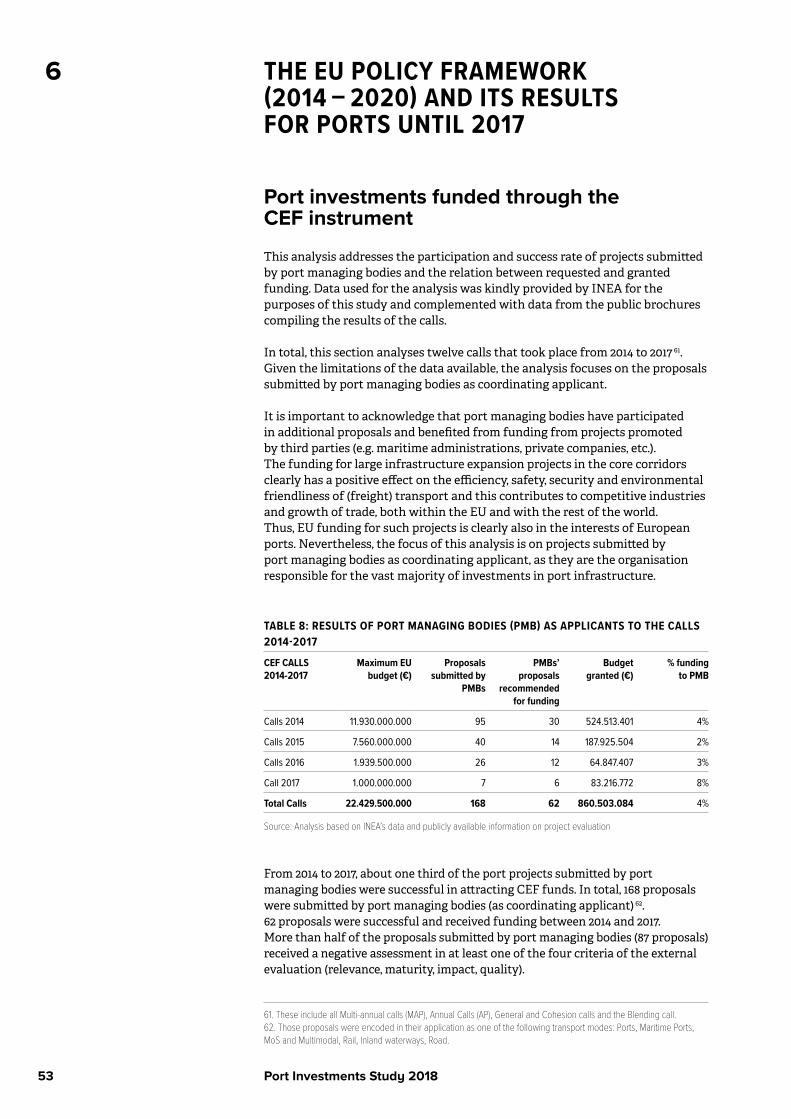
Port Investments Study 201853
6 THE EU POLICY FRAMEWORK (2014 – 2020) AND ITS RESULTS FOR PORTS UNTIL 2017
Port investments funded through the CEF instrument
This analysis addresses the participation and success rate of projects submitted by port managing bodies and the relation between requested and granted funding. Data used for the analysis was kindly provided by INEA for the purposes of this study and complemented with data from the public brochures compiling the results of the calls.
In total, this section analyses twelve calls that took place from 2014 to 2017 61. Given the limitations of the data available, the analysis focuses on the proposals submitted by port managing bodies as coordinating applicant.
It is important to acknowledge that port managing bodies have participated in additional proposals and benefited from funding from projects promoted by third parties (e.g. maritime administrations, private companies, etc.). The funding for large infrastructure expansion projects in the core corridors clearly has a positive effect on the efficiency, safety, security and environmental friendliness of (freight) transport and this contributes to competitive industries and growth of trade, both within the EU and with the rest of the world. Thus, EU funding for such projects is clearly also in the interests of European ports. Nevertheless, the focus of this analysis is on projects submitted by port managing bodies as coordinating applicant, as they are the organisation responsible for the vast majority of investments in port infrastructure.
TABLE 8: RESULTS OF PORT MANAGING BODIES (PMB) AS APPLICANTS TO THE CALLS 2014-2017
CEF CALLS 2014-2017
Maximum EU budget (€)
Proposals submitted by
PMBs
PMBs’ proposals
recommended for funding
Budget granted (€)
% funding to PMB
Calls 2014 11.930.000.000 95 30 524.513.401 4%
Calls 2015 7.560.000.000 40 14 187.925.504 2%
Calls 2016 1.939.500.000 26 12 64.847.407 3%
Call 2017 1.000.000.000 7 6 83.216.772 8%
Total Calls 22.429.500.000 168 62 860.503.084 4%
Source: Analysis based on INEA’s data and publicly available information on project evaluation
From 2014 to 2017, about one third of the port projects submitted by port managing bodies were successful in attracting CEF funds. In total, 168 proposals were submitted by port managing bodies (as coordinating applicant) 62. 62 proposals were successful and received funding between 2014 and 2017. More than half of the proposals submitted by port managing bodies (87 proposals) received a negative assessment in at least one of the four criteria of the external evaluation (relevance, maturity, impact, quality).
61. These include all Multi-annual calls (MAP), Annual Calls (AP), General and Cohesion calls and the Blending call. 62. Those proposals were encoded in their application as one of the following transport modes: Ports, Maritime Ports, MoS and Multimodal, Rail, Inland waterways, Road.

Port Investments Study 201854
Only 19 proposals (11%) were not granted funding due to budgetary constraints despite being positively assessed by external experts and by the Commission. In total, port managing bodies requested 2,5 €billion between 2014 and 2017. They were granted 860 €million, 35% of the total requested. This represents 4% of the EU funding available between 2014 and 2017.
Figures of available EU budget in table 8 also show the frontloading of the CEF budget in 2014 and 2015. This early distribution facilitates the full spending of the funds during the established period and the re-use of recouped budget in the final years. However, a more balanced distribution of the budget during the funding period would fit better with the (dynamic) nature of project generation and the complexity of project development and maturity.
Participation and results per call for port managing bodies
The table below details the results per multi-annual (MAP) and annual (AP) calls per year 63.
TABLE 9: RESULTS OF PORT MANAGING BODIES (PMB) AS APPLICANTS TO THE CALLS 2014-2017
CEF CALLS Maximum EU budget
available (€)
Proposals submitted by
PMB
Successful proposals
Funding granted (€)
Ratio Funding granted to PMBs
/ total available funding
Calls 2014
MAP Call 1 6.000.000.000 37 16 350.665.218 6%
MAP Call 2 250.000.000 4 1 1.950.000 1%
MAP Call 3 750.000.000 19 8 97.823.385 13%
MAP Call 4 Cohesion
4.000.000.000 5 2 52.659.767 1%
AP Call 5 930.000.000 30 3 21.415.030 2%
Total Calls 2014 11.930.000.000 95 30 524.513.401 4%
Calls 2015
MAP Call General 6.470.000.000 29 7 20.924.491 0,3%
MAP Call Cohesion
1.090.000.000 11 7 167.001.013 15%
Total Calls 2015 7.560.000.000 40 14 187.925.504 2%
Calls 2016
MAP Call General 650.000.000 13 6 25.699.540 4%
MAP Call Cohesion
849.500.000 7 5 38.505.737 5%
AP General 250.000.000 5 1 642.130 0,3%
AP Cohesion 190.000.000 1 0 0 0%
Total Calls 2016 1.939.500.000 26 12 64.847.407 3%
Call 2017 1.000.000.000 7 6 83.216.772 8%
Source: Analysis based on INEA’s data and publicly available information on project evaluation
63. Table 9 includes General and Cohesion calls. A split between both is detailed in Appendix 2. It is noteworthy that in the period 2014 - 2017, CF money represented about one third of the total CEF funds allocated to port authorities’ projects, even though participation by port managing bodies in Cohesion calls has been limited. This is partly due to the priority given by Cohesion Member States to other transport modes, notably rail. The relatively large share of Cohesion funds in total amount of grants to port authorities is partly due to the fact that projects in Cohesion calls are entitled to up to 85% funding, substantially higher than co-funding rates for General calls (e.g. 20% for works).
Port Investments Study 201855
In 2014, 681 out of 735 proposals received by INEA (for all transport modes) with a total requested funding of 32,6 €billion were considered eligible. Port managing bodies submitted 95 proposals (as coordinating applicant). 30 of these proposals were successful and received funding, while 65 proposals were unsuccessful, 51 of which due to a negative external evaluation and 14 due to budgetary constraints.
In 2015, 406 out of 427 proposals received by INEA were considered eligible and were evaluated. Port managing bodies submitted 40 proposals, 14 proposals were successful; 23 proposals did not pass the external technical evaluation and 3 proposals were excluded due to budgetary constraints.
In 2016, port managing bodies submitted 26 proposals. 12 proposals were successful and 14 were unsuccessful, 12 due to a negative external technical evaluation and 2 due to budgetary constraints.
In 2017, the only call was a CEF Transport Blending call (first cut-off) with an indicative budget of 1 €billion. Only projects with total costs in excess of 10 €million were eligible. Studies could not be funded. Only maritime ports of the core network were eligible. INEA received 68 proposals (all transport modes) out of which 65 were considered eligible. Seven proposals were submitted by Port managing bodies (as coordinating applicant), of which 6 proposals were successful, consisting of 5 core port projects and 1 MOS project. One proposal did not pass the external technical evaluation. Participation of ports was lower than in previous calls due to the complexity and novelty of the Blending Call 64. The rate of success of the proposals by port authorities in this call was good compared to the other modes and previous calls.
The number of proposals submitted by port authorities has been decreasing since 2014. This is in accordance with the frontloading of CEF budget in the 2014 call and the consequent decrease of the available budget.
An analysis was made of the reasons for failure of port proposals on the basis of the short summary provided in the public brochures of INEA 65. Most of the port managing bodies proposals not retained for funding failed in more than one of the four criteria used in the evaluation (relevance, maturity, impact and quality). Low quality was very often a reason for rejection together with proposals not being able to prove the relevance of the project in relation to the call or the socio-economic effects of the project and the EU leverage effects (the relevance and impact criteria).
64. This finding is based on interviews with more than 10 port managing bodies. 65. See https://ec.europa.eu/inea/sites/inea/files/20170629_cef_tran_brochure_superfinal.pdfhttps://ec.europa.eu/inea/sites/inea/files/inea_cef_brochure_web_superfinal_a.pdfhttps://ec.europa.eu/inea/sites/inea/files/cef_blending_call_brochure_alltogether_20171205_final_web.pdf.

Port Investments Study 201856
CEF funding for Comprehensive ports Under the TEN-T policy, comprehensive ports have had limited possibilities to obtain CEF funds. The challenge for comprehensive ports has been to prove the EU relevance of these investments since they are not considered part of the core network corridors. One option has been to cooperate with core ports on Motorways of the Sea projects, as demonstrated by two examples.
• In 2016, CEF funding was granted to upgrade the maritime cargo route between the ports of Hanko (Finland) and Rostock (Germany). The comprehensive port of Hanko received funding for the reconstruction of an existing terminal area, the enlargement of a pier and preparatory works for storing, handling of trailers and relocation of the road on the pier. The project in the core port of Rostock consisted of adapting two ro-ro berths and building additional terminal areas for handling and storage of freight. The project was granted 4,3 €million.
• In the 2017 Blending call, the ports of Civitavecchia (Italy, a comprehensive port) and Barcelona (Spain, a core port) received CEF funding to upgrade the Barcelona-Civitavecchia Motorway of the Sea (MoS) link. The project was granted 4,3 €million to build a ro/pax pier in the comprehensive port of Civitavecchia and to upgrade an existing pier and a ro-ro/pax ramp in Barcelona and to convert its rail terminal to UIC standards.
Funding received and requested by port managing bodies
Successful projects received on average 75% of the requested funding (table 10). The Commission recommended granting less than the requested funding for about half of the projects. Only in some cases, information is available on the causes for reducing the funding requested in the proposals. From the interviews with relevant agents, two typical causes have emerged: first the eligibility of only part of the project, and second diverging calculations of the financial gap on which the corresponding percentage is applied to determine the amount of the grant.
TABLE 10: REQUESTED FUNDING VERSUS RECOMMENDED FUNDING
CEF CALLS 2014-2017
Requested funding (All proposals)
Requested funding (Successful pro-
posals)
Recommended funding (successful
proposals)
RATIO Funding requested
/ granted for suc-cessful proposals
Calls 2014 1.282.563.993 655.818.580 524.513.401 80%
Calls 2015 404.050.837 261.057.378 187.925.504 72%
Calls 2016 211.240.516 117.640.216 64.847.407 55%
Call 2017 568.515.711 113.316.718 83.216.772 73%
Total Calls 2.466.371.057 1.147.832.893 860.503.083 75%
Source: Analysis based on INEA’s data and publicly available information on project evaluation

Port Investments Study 201857
Port managing bodies’ proposals per transport mode
In around one third of the proposals, port managing bodies applied with projects that were not related to maritime transport, but to inland transport infrastructure such as rail connections or multimodal terminals. Maritime transport projects however represented 68% of the port authorities’ proposals and have concentrated 81% of the funding granted to them (as coordinating applicant).
TABLE 11: PORT MANAGING BODIES’ PROPOSALS PER TRANSPORT MODE
Mode Eligible proposals Successfulproposals
Budget granted (€) Share of the total funding to port
managing bodies
Rail transport 9 5 79.845.138 9%
Maritime transport 115 47 698.861.391 81%
Multimodal transport 33 7 70.897.334 11%
Road transport 4 1 2.857.887 1%
Inland waterways 7 2 8.041.333 7%
Air transport 0 0 0 0
TOTAL 168 62 860.503.083
Source: Analysis based on INEA’s data and publicly available information on project evaluation
Other proposals in maritime transport
Port managing bodies also benefited from maritime transport projects submitted by other entities. Examples include Member States that submitted proposals for locks and maritime access. In 2014 – 2017, in the area of maritime transport, 105 additional proposals were submitted to the CEF calls by participants such as Member States administrations or other public or private entities. In total 37 were successful and received 263 €million.
TABLE 12: MARITIME TRANSPORT PROPOSALS
CEF CALLS 2014-2017 Eligible proposals Successful proposals Budget granted (€)
Calls 2014 46 24 183.560.610
Calls 2015 44 11 74.186.092
Calls 2016 13 2 5.344.500
Calls 2017 2 0 0
Total Calls 105 37 263.091.202
Source: Analysis based on INEA’s data and publicly available information on project evaluation
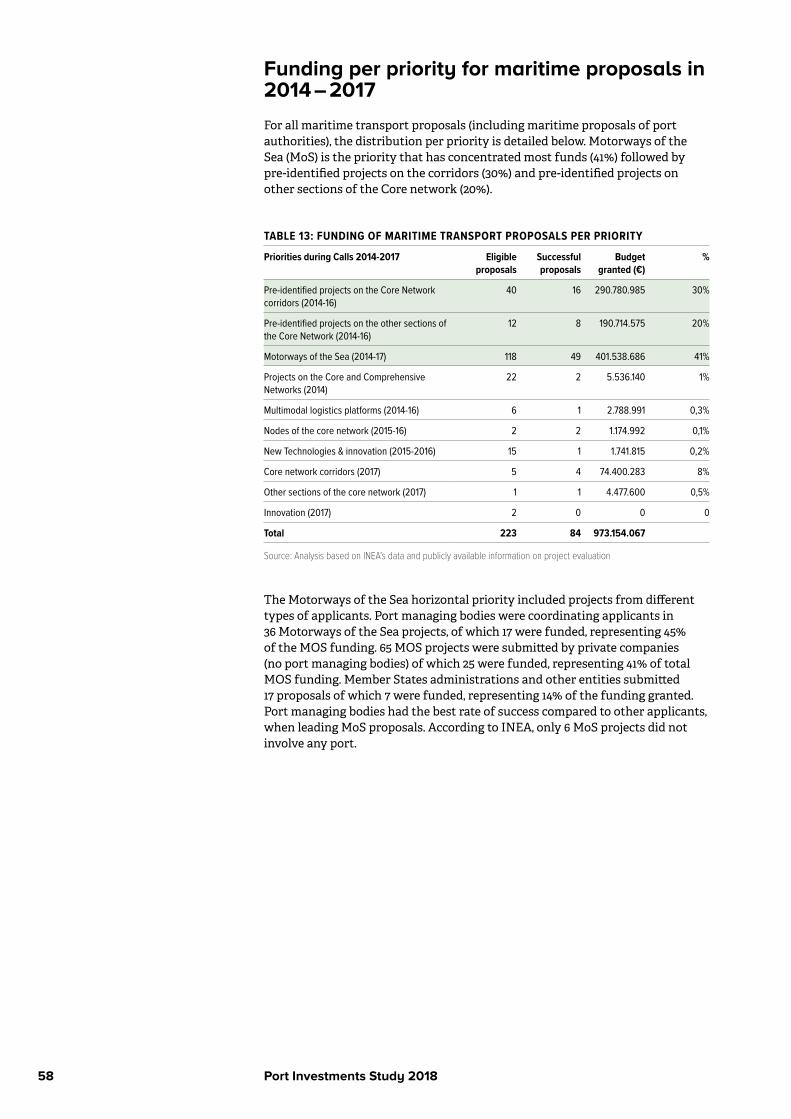
Port Investments Study 201858
Funding per priority for maritime proposals in 2014 – 2017
For all maritime transport proposals (including maritime proposals of port authorities), the distribution per priority is detailed below. Motorways of the Sea (MoS) is the priority that has concentrated most funds (41%) followed by pre-identified projects on the corridors (30%) and pre-identified projects on other sections of the Core network (20%).
TABLE 13: FUNDING OF MARITIME TRANSPORT PROPOSALS PER PRIORITY
Priorities during Calls 2014-2017 Eligible proposals
Successful proposals
Budget granted (€)
%
Pre-identified projects on the Core Network corridors (2014-16)
40 16 290.780.985 30%
Pre-identified projects on the other sections of the Core Network (2014-16)
12 8 190.714.575 20%
Motorways of the Sea (2014-17) 118 49 401.538.686 41%
Projects on the Core and Comprehensive Networks (2014)
22 2 5.536.140 1%
Multimodal logistics platforms (2014-16) 6 1 2.788.991 0,3%
Nodes of the core network (2015-16) 2 2 1.174.992 0,1%
New Technologies & innovation (2015-2016) 15 1 1.741.815 0,2%
Core network corridors (2017) 5 4 74.400.283 8%
Other sections of the core network (2017) 1 1 4.477.600 0,5%
Innovation (2017) 2 0 0 0
Total 223 84 973.154.067
Source: Analysis based on INEA’s data and publicly available information on project evaluation
The Motorways of the Sea horizontal priority included projects from different types of applicants. Port managing bodies were coordinating applicants in 36 Motorways of the Sea projects, of which 17 were funded, representing 45% of the MOS funding. 65 MOS projects were submitted by private companies (no port managing bodies) of which 25 were funded, representing 41% of total MOS funding. Member States administrations and other entities submitted 17 proposals of which 7 were funded, representing 14% of the funding granted. Port managing bodies had the best rate of success compared to other applicants, when leading MoS proposals. According to INEA, only 6 MoS projects did not involve any port.
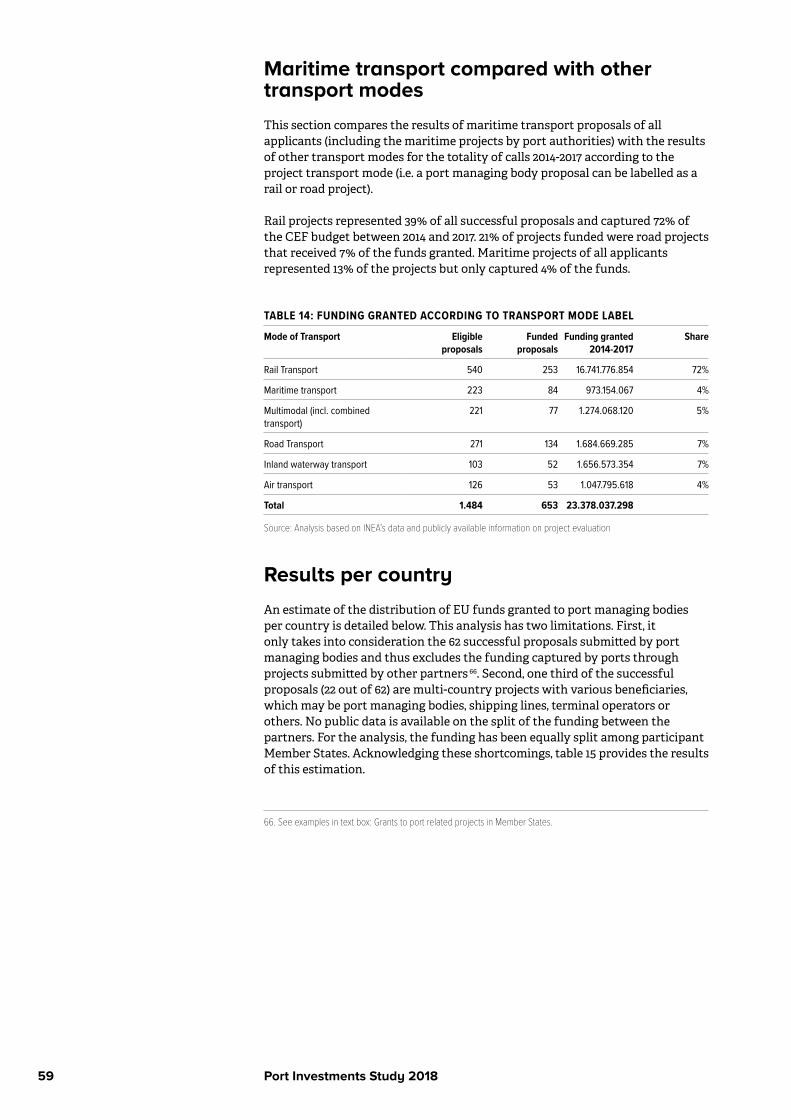
Port Investments Study 201859
Maritime transport compared with other transport modes
This section compares the results of maritime transport proposals of all applicants (including the maritime projects by port authorities) with the results of other transport modes for the totality of calls 2014-2017 according to the project transport mode (i.e. a port managing body proposal can be labelled as a rail or road project).
Rail projects represented 39% of all successful proposals and captured 72% of the CEF budget between 2014 and 2017. 21% of projects funded were road projects that received 7% of the funds granted. Maritime projects of all applicants represented 13% of the projects but only captured 4% of the funds.
TABLE 14: FUNDING GRANTED ACCORDING TO TRANSPORT MODE LABEL
Mode of Transport Eligible proposals
Funded proposals
Funding granted 2014-2017
Share
Rail Transport 540 253 16.741.776.854 72%
Maritime transport 223 84 973.154.067 4%
Multimodal (incl. combined transport)
221 77 1.274.068.120 5%
Road Transport 271 134 1.684.669.285 7%
Inland waterway transport 103 52 1.656.573.354 7%
Air transport 126 53 1.047.795.618 4%
Total 1.484 653 23.378.037.298
Source: Analysis based on INEA’s data and publicly available information on project evaluation
Results per country
An estimate of the distribution of EU funds granted to port managing bodies per country is detailed below. This analysis has two limitations. First, it only takes into consideration the 62 successful proposals submitted by port managing bodies and thus excludes the funding captured by ports through projects submitted by other partners 66. Second, one third of the successful proposals (22 out of 62) are multi-country projects with various beneficiaries, which may be port managing bodies, shipping lines, terminal operators or others. No public data is available on the split of the funding between the partners. For the analysis, the funding has been equally split among participant Member States. Acknowledging these shortcomings, table 15 provides the results of this estimation.
66. See examples in text box: Grants to port related projects in Member States.

Port Investments Study 201860
TABLE 15: ESTIMATE OF FUNDING GRANTED TO PORT MANAGING BODIES PER COUNTRY
Country 67 2014 2015 2016 2017 Total projects Share 2014-2017
France 155.761.026 539.880 0 0 156.300.906 18%
Poland 13.238.184 118.713.559 477.870 19.914.950 152.344.563 18%
Croatia 30.222.600 32.841.238 35.205.931 0 98.269.768 11%
Spain 72.871.645 7.424.352 647.500 2.169.444 83.112.941 10%
Italy 18.956.743 5.380.450 1.415.650 39.546.444 65.299.287 8%
Netherlands 59.892.118 0 321.065 0 60.213.183 7%
UK 44.368.443 0 0 0 44.368.443 5%
Ireland 38.518.056 0 0 4.477.600 42.995.656 5%
Sweden 22.412.874 0 8.699.685 10.388.333 41.500.893 4%
Finland 17.925.000 0 8.742.500 6.720.000 33.387.500 2%
Slovenia 13.655.743 1.743.533 0 0 15.399.276 2%
Estonia 14.650.000 0 0 0 14.650.000 1%
Germany 8.692.050 0 2.410.685 0 11.102.735 1%
Romania 0 10.791.706 0 0 10.791.706 1%
Greece 0 5.308.783 1.415.650 0 6.724.433 1%
Portugal 4.123.485 2.322.672 0 0 6.446.157 1%
Lithuania 5.097.621 0 0 0 5.097.621 0,4%
Denmark 1.452.070 0 1.890.000 0 3.342.070 0,4%
Cyprus 2.675.743 0 441.920 0 3.117.663 0,3%
Bulgaria 0 2.859.330 0 0 2.859.330 0,3%
Malta 0 0 2.857.887 0 2.857.887 0,3%
Belgium 0 0 321.065 0 321.065 0,04%
Latvia 0 0 0 0 0 0
TOTAL 524.515.415 187.927.519 64.849.423 83.218.789 860.503.083
Source: Analysis based on INEA’s data and publicly available information on project evaluation
Keeping in mind the caveats mentioned before, it can be noted that the distribution of grants over countries is uneven and some ports have received a large share of the funding, while in other countries with large EU core ports, the funding granted to the port managing bodies is very limited. This may partially be related to the differences in port governance, as some port managing bodies are responsible for a larger set of port infrastructure investments than others — and thus more likely to apply and receive grants.
67. Port managing bodies from cohesion countries (such as Poland and Croatia) benefited from higher co-funding rates (85%) of the CF in CEF calls.
Port Investments Study 201861
Grants to port-related projects in Member States The figures in table 15 do not include the projects submitted by maritime administrations, private port operators or other private or public entities. Belgium, where port authorities received less than 1% of the total funding granted to port authorities, is a good example to illustrate the relevance of grants to other organisations for ports:
The Albert Canal in Belgium, which connects the ports of Antwerp and Liege, has received 74 €million in 2014 and 27 €million in 2017 in proposals from the Flemish government.
The Port of Zeebrugge in Belgium was granted 1,6 €million in 2015 to improve its multimodal logistic platform of the port of Zeebrugge, in order to accommodate long freight trains based on a proposal from Infrabel S.A., the Belgian rail infrastructure manager.
In 2014, the New Lock in Terneuzen received 48,1 €million of CEF based on an application from the Flemish government. This grant also is beneficial for Port of Ghent and Zeeland Seaports (now merged into North Sea Port).
The table below provides the number of successful proposals submitted by port managing bodies as coordinating applicant per country and per year. The number of projects does not reflect the funds assigned to each Member State. In some countries, high amounts resulted from many successful projects (e.g. France); while in others (e.g. Netherlands), the funding was concentrated mostly in one project.
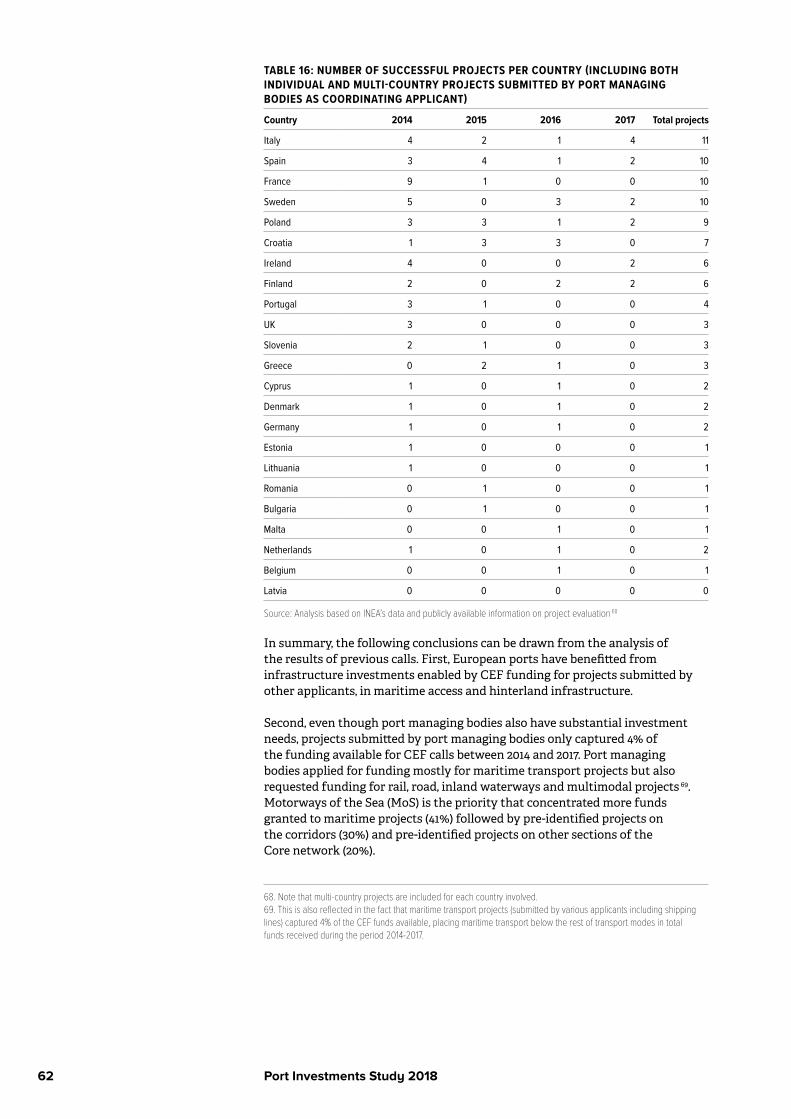
Port Investments Study 201862
TABLE 16: NUMBER OF SUCCESSFUL PROJECTS PER COUNTRY (INCLUDING BOTH INDIVIDUAL AND MULTI-COUNTRY PROJECTS SUBMITTED BY PORT MANAGING BODIES AS COORDINATING APPLICANT)
Country 2014 2015 2016 2017 Total projects
Italy 4 2 1 4 11
Spain 3 4 1 2 10
France 9 1 0 0 10
Sweden 5 0 3 2 10
Poland 3 3 1 2 9
Croatia 1 3 3 0 7
Ireland 4 0 0 2 6
Finland 2 0 2 2 6
Portugal 3 1 0 0 4
UK 3 0 0 0 3
Slovenia 2 1 0 0 3
Greece 0 2 1 0 3
Cyprus 1 0 1 0 2
Denmark 1 0 1 0 2
Germany 1 0 1 0 2
Estonia 1 0 0 0 1
Lithuania 1 0 0 0 1
Romania 0 1 0 0 1
Bulgaria 0 1 0 0 1
Malta 0 0 1 0 1
Netherlands 1 0 1 0 2
Belgium 0 0 1 0 1
Latvia 0 0 0 0 0
Source: Analysis based on INEA’s data and publicly available information on project evaluation 68
In summary, the following conclusions can be drawn from the analysis of the results of previous calls. First, European ports have benefitted from infrastructure investments enabled by CEF funding for projects submitted by other applicants, in maritime access and hinterland infrastructure.
Second, even though port managing bodies also have substantial investment needs, projects submitted by port managing bodies only captured 4% of the funding available for CEF calls between 2014 and 2017. Port managing bodies applied for funding mostly for maritime transport projects but also requested funding for rail, road, inland waterways and multimodal projects 69. Motorways of the Sea (MoS) is the priority that concentrated more funds granted to maritime projects (41%) followed by pre-identified projects on the corridors (30%) and pre-identified projects on other sections of the Core network (20%).
68. Note that multi-country projects are included for each country involved. 69. This is also reflected in the fact that maritime transport projects (submitted by various applicants including shipping lines) captured 4% of the CEF funds available, placing maritime transport below the rest of transport modes in total funds received during the period 2014-2017.

Port Investments Study 201863
Third, the distribution of grants to port managing bodies is uneven, over time and between Member States. 61% of the funding granted to port authorities was allocated already in 2014 and raised to 83% in 2015 (in line with other modes). Funding in 2016 and 2017 represented only 17% of all funding granted to port authorities between 2014 and 2017. Six countries concentrated 72% of the funding granted to port authorities between 2014 and 2017. While in some cases the funding was distributed among a number of projects, in other cases a few large projects received a large share of the total funding to port authorities.
Port investments funded through the EIB
The European Investment Bank has been financing infrastructure since its creation in 1957. Port projects have always been a part of its activity (figure 16). Port infrastructure is, in principle, eligible to EIB loans because ports are essential to achieve two of the main original objectives of the European Union: market integration and convergence. Market integration is being facilitated by the development of Trans-European Transport Networks supporting the Single Market, of which ports are an essential component of TEN-T. On the other hand, ports are critical infrastructures for the economic progress of less-developed peripheral regions. Port investments may thus continue to attract EIB loans. The EIB loans to the maritime and ports sector in the period 2007-2017 are shown either in total (Figure 16) or per country (Figures 17 and 18, for clarity, the data is presented in two graphics).
FIGURE 16: EIB ACTIVITY IN THE MARITIME SECTOR ● All maritime ● Ports
0 500 1000 1500 2000
2016
2015
2014
2013
2012
2011
2010
2009
2008
2007
€ million
Source: based on publicly available information from EIB
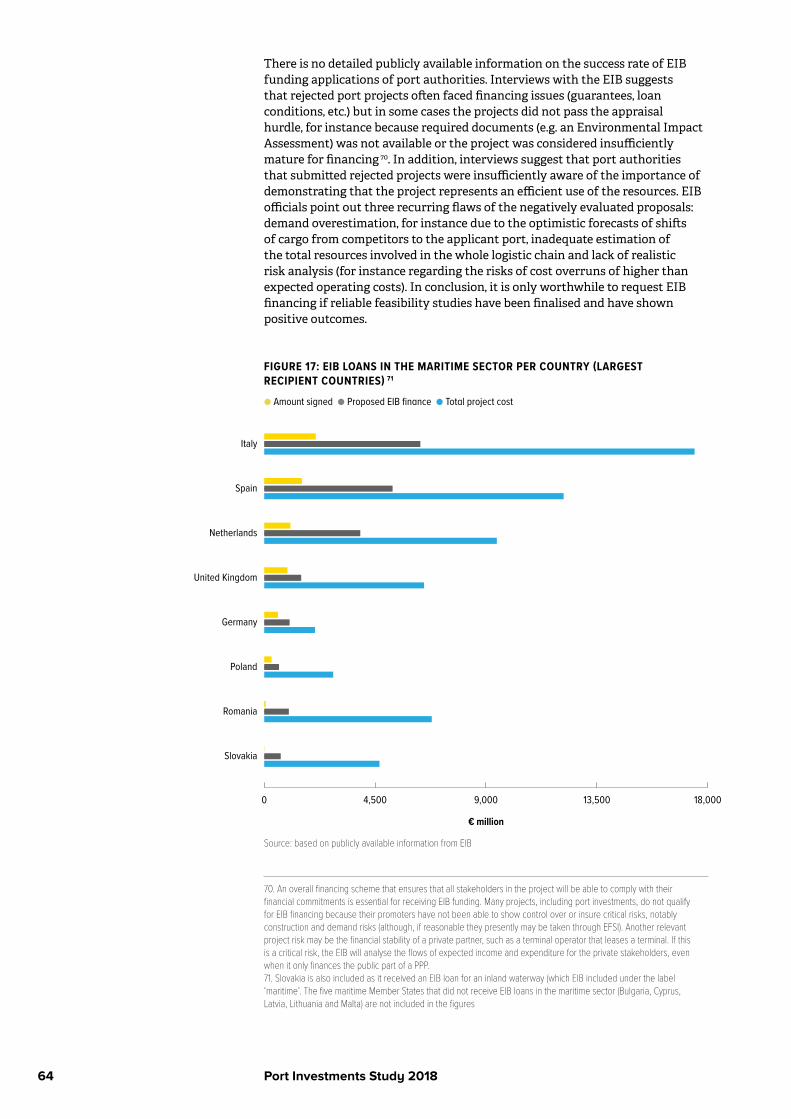
Port Investments Study 201864
There is no detailed publicly available information on the success rate of EIB funding applications of port authorities. Interviews with the EIB suggests that rejected port projects often faced financing issues (guarantees, loan conditions, etc.) but in some cases the projects did not pass the appraisal hurdle, for instance because required documents (e.g. an Environmental Impact Assessment) was not available or the project was considered insufficiently mature for financing 70. In addition, interviews suggest that port authorities that submitted rejected projects were insufficiently aware of the importance of demonstrating that the project represents an efficient use of the resources. EIB officials point out three recurring flaws of the negatively evaluated proposals: demand overestimation, for instance due to the optimistic forecasts of shifts of cargo from competitors to the applicant port, inadequate estimation of the total resources involved in the whole logistic chain and lack of realistic risk analysis (for instance regarding the risks of cost overruns of higher than expected operating costs). In conclusion, it is only worthwhile to request EIB financing if reliable feasibility studies have been finalised and have shown positive outcomes.
FIGURE 17: EIB LOANS IN THE MARITIME SECTOR PER COUNTRY (LARGEST RECIPIENT COUNTRIES) 71
● Amount signed ● Proposed EIB finance ● Total project cost
0 4,500 9,000 13,500 18,000
Slovakia
Romania
Poland
Germany
United Kingdom
Netherlands
Spain
Italy
€ million
Source: based on publicly available information from EIB
70. An overall financing scheme that ensures that all stakeholders in the project will be able to comply with their financial commitments is essential for receiving EIB funding. Many projects, including port investments, do not qualify for EIB financing because their promoters have not been able to show control over or insure critical risks, notably construction and demand risks (although, if reasonable they presently may be taken through EFSI). Another relevant project risk may be the financial stability of a private partner, such as a terminal operator that leases a terminal. If this is a critical risk, the EIB will analyse the flows of expected income and expenditure for the private stakeholders, even when it only finances the public part of a PPP. 71. Slovakia is also included as it received an EIB loan for an inland waterway (which EIB included under the label ‘maritime’. The five maritime Member States that did not receive EIB loans in the maritime sector (Bulgaria, Cyprus, Latvia, Lithuania and Malta) are not included in the figures

Port Investments Study 201865
FIGURE 18: EIB LOANS IN THE MARITIME SECTOR PER COUNTRY (SMALLEST RECIPIENT COUNTRIES)● Amount signed ● Proposed EIB finance ● Total project cost
0 250 500 750 1,000
Sweden
Greece
Denmark
Slovenia
Portugal
Ireland
Croatia
Estonia
Finland
France
Belgium
€ million
Source: based on publicly available information from EIB
Port investments funded through the EFSI instrument
EFSI has virtually not been used for port investments, as only two port projects for a total of 175 €million have been approved so far. EFSI is managed by the EIB and essentially follows the same appraisal procedure of a traditional EIB project, although the financial sustainability is even more important in the appraisal, because the Fund is taking higher risks than traditional EIB loans and this implies that these risks must be carefully assessed.

Port Investments Study 201866

Port Investments Study 201867
7 THE EVALUATION PROCESSES FOR EU FINANCIAL INSTRUMENTS
This section provides an overview of the evaluation process of proposals of the main EU instruments (identified in the previous section), and specifically the role of the EU added value in the evaluation.
Selection and award criteria for CEF
The process to evaluate applications to grants from the CEF consists of the following steps:
• Step 1: Assessment of formal requirements, selection criteria and compliance with EU regulations 72.
• Step 2: External evaluation: assessment of the compliant proposals by technical experts, based on pre-established criteria.
• Step 3: Final selection process by a committee of DG MOVE and INEA, based on the evaluation, but also paying attention to the following issues:
• Balanced development of the network• Complementarity with other actions (projects) in CEF and other EU instruments and programs (e.g. Horizon 2020).• Comparative European added value
• Step 4: A list of recommended projects is submitted to the Member States and the European Parliament for final approval.
Selection and award criteria for EIB and EFSI
The evaluation process for the EIB is summarised in figure 19 and also applies to projects presented to EFSI, with one additional step, the approval of the EFSI Investment Committee, composed of independent experts. For typical EIB loans, an initial eligibility check will establish if the project could be taken into account. EIB eligibility criteria are wider than those applied in EU grant programmes. In the case of ports belonging to the TEN-T networks, eligibility is generally not problematic. Investment projects must comply with technical quality requirements, including reasonable costs, show an adequate socioeconomic profitability and comply with EU requirements regarding the environment, bidding procedures, etc. On financing aspects, the EIB will require financial sustainability and adequate guarantees from the borrower 73. For EFSI projects, including the risk adoption, the analysis of the business plan and the potential failures is obviously more complete and checked both by the EIB management and the EFSI Investment Committee before the financing is approved.
72. Relevant regulations include Directive 2011/92/EU on Environmental Impact Assessment, Directive 2001/42/EC on Strategic Environmental Assessment, impact on Natura 2000 locations, compatibility with state aid regulation, and public procurement. The eligibility to CEF is also assessed in phase 1. 73. Public administrations may provide securities that can be assimilated to State guarantees. Private promoters will be required to provide high-quality corporate or bank guarantees. They are necessary because the EIB is usually not charging for risk. When certain risks are assumed (as it is increasingly the case), it charges higher interest rates and introduces some security covenants in the loan contract. These operations are currently mostly handled through EFSI.

Port Investments Study 201868
FIGURE 19: THE PROJECT CYCLE FOR AN EFSI PROJECT
STEP 1 Proposal
STEP 7 Repayment
STEP 5 Disbursement STEP 4 Signature
STEP 6 Monitoring and reporting
Projects promoters presentproposal to EIB directly
STEP 2 EIB Appraisal
STEP 3 EIB Approval
• financial• economic• social• environmental• and technical assessment
• EIB Management Committee• Investment Committee
assessment and approval• Final approval by EIB
Board of Directors
EFSIPROJECT
CYCLE
Source: EIB (2018). See https://ec.europa.eu/commission/sites/beta-political/files/investment-plan-eu-wide-state-of-play-july2016_en_0.pdf
The assessment of the EU added value
The assessment of the EU added value is an important part of the evaluation of proposals, especially under CEF. However, there is no defined way to quantify, or even qualitatively assess, EU added value. European added value is additional to the value created by investments for individual Member States. The subsidiarity principle entails that the EU should only contribute to policy development and project support in areas where an EU role is necessary to ensure a smooth and fruitful overall development of the Common Market, including its social and environmental aspects. This can be translated into “actions producing a clear EU added value”, which may result from different factors, including greater effectiveness or better coordination. In the case of port infrastructure projects, there are some specific EU policies that establish the framework in which such added value can be more easily identified:
1. The first factor in considering EU added value in port infrastructure investment is the need for efficiency in the use of resources. It is relevant here to indicate that the socioeconomic profitability of the project, measured through a cost-benefit analysis (CBA), must consider the whole EU society, eliminating any discrimination in terms of nationality. Some redistribution effects (as some of those included in the points below), should not, in principle, justify projects with negative CBA.
2. The development of trans-European networks in which the core ports, in particular, play a key role, will facilitate movement across the EU and with third countries, and generate economic development through better access to the markets and the elimination of barriers to free trade. Thus, the reduction of logistic costs through a more efficient and sustainable European multimodal transport network is considered as EU added value. Given their role as entry and exit points of European countries, ports by nature contribute to a more efficient European multimodal transport network.
3. The EU regional development policy puts emphasis on transport infrastructure as a necessary condition for economic growth. Many peripheral and maritime regions, islands in particular 74, are convergence regions and ports are essential for their critical maritime links.
74. Some islands have a particular status within the Union due to their ultra-periphericity.
Port Investments Study 201869
4. The neighbourhood policy aiming at having good relationships with the countries surrounding the EU depends very much on transport connections with them. In many cases such connections are maritime, and ports therefore play a critical role in facilitating the movement of persons and goods with neighbouring countries, in particular across the Mediterranean and the Black Sea.
5. The protection/improvement of the environment, notably through the avoidance of negative coastal impacts and sea pollution, the reduction of air pollutants and CO2 emissions within the port area but also supporting the reduction of emissions from maritime transport through the supply of cleaner fuels to ships (e.g. Onshore Power Supply, LNG, hydrogen) is also considered European added value.
6. The EU pays particular attention to the circular economy and to the transition towards sustainable energy and energy independence. The role of ports is critical for the transition to a low carbon economy where energy availability is secured. They are not only important for LNG imports but also for the supply of renewable energy materials (such as windmill blades) and for the production of renewable electricity within the port area. In addition, ports are likely to play an important role in the development of efficient methods to bring the energy (products) from offshore wind ashore.
7. Projects presenting particular experimental or innovative characteristics could be deemed to contribute to the common policy of making the EU a major player in the world in terms of technology. There are many port investments that will profit from new technologies, not only in the traditional digital economy sectors of telecommunications, automation, energy optimisation, etc. but also in construction and operation of port infrastructure and equipment.
8. Macroeconomic stability, particularly within the Euro Area, depends on the reduction of public debt on Member States’ accounts. The EU, as shown by the EFSI initiative, supports private participation to complement public investment in infrastructure as a way to reduce the debt burden. In ports, PPPs can be developed; with European added value through a contribution to the EU goal of public debt reduction.
Various types of port infrastructure projects can create European added value as outlined above and summarised in table 17.
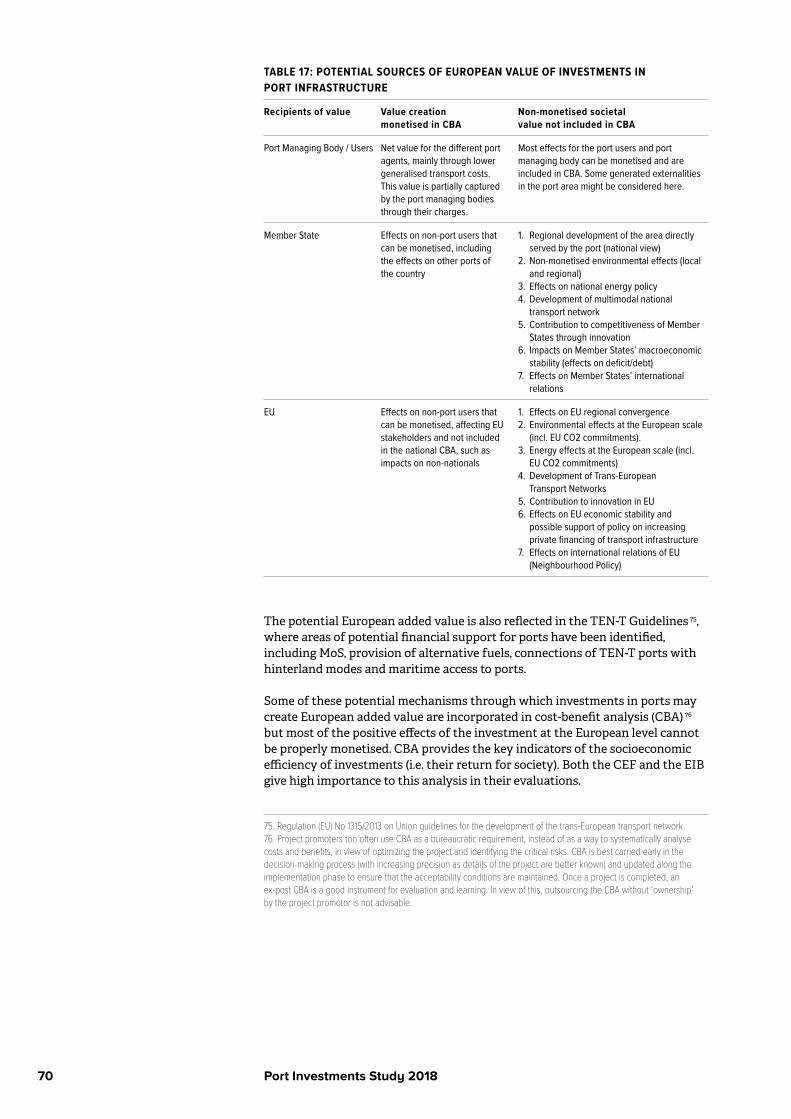
Port Investments Study 201870
TABLE 17: POTENTIAL SOURCES OF EUROPEAN VALUE OF INVESTMENTS IN PORT INFRASTRUCTURE
Recipients of value Value creation monetised in CBA
Non-monetised societal value not included in CBA
Port Managing Body / Users Net value for the different port agents, mainly through lower generalised transport costs. This value is partially captured by the port managing bodies through their charges.
Most effects for the port users and port managing body can be monetised and are included in CBA. Some generated externalities in the port area might be considered here.
Member State Effects on non-port users that can be monetised, including the effects on other ports of the country
1. Regional development of the area directly served by the port (national view)
2. Non-monetised environmental effects (local and regional)
3. Effects on national energy policy4. Development of multimodal national
transport network5. Contribution to competitiveness of Member
States through innovation 6. Impacts on Member States’ macroeconomic
stability (effects on deficit/debt)7. Effects on Member States’ international
relations
EU Effects on non-port users that can be monetised, affecting EU stakeholders and not included in the national CBA, such as impacts on non-nationals
1. Effects on EU regional convergence 2. Environmental effects at the European scale
(incl. EU CO2 commitments).3. Energy effects at the European scale (incl.
EU CO2 commitments)4. Development of Trans-European
Transport Networks5. Contribution to innovation in EU 6. Effects on EU economic stability and
possible support of policy on increasing private financing of transport infrastructure
7. Effects on international relations of EU (Neighbourhood Policy)
The potential European added value is also reflected in the TEN-T Guidelines 75, where areas of potential financial support for ports have been identified, including MoS, provision of alternative fuels, connections of TEN-T ports with hinterland modes and maritime access to ports.
Some of these potential mechanisms through which investments in ports may create European added value are incorporated in cost-benefit analysis (CBA) 76 but most of the positive effects of the investment at the European level cannot be properly monetised. CBA provides the key indicators of the socioeconomic efficiency of investments (i.e. their return for society). Both the CEF and the EIB give high importance to this analysis in their evaluations.
75. Regulation (EU) No 1315/2013 on Union guidelines for the development of the trans-European transport network.76. Project promoters too often use CBA as a bureaucratic requirement, instead of as a way to systematically analyse costs and benefits, in view of optimizing the project and identifying the critical risks. CBA is best carried early in the decision-making process (with increasing precision as details of the project are better known) and updated along the implementation phase to ensure that the acceptability conditions are maintained. Once a project is completed, an ex-post CBA is a good instrument for evaluation and learning. In view of this, outsourcing the CBA without ‘ownership’ by the project promotor is not advisable.
Port Investments Study 201871
However, there is currently no standard methodology for CBA’s. While a methodology endorsed by DG region is recommended, other methodologies are also admitted. This leads to differences in CBA methods, the impact of which cannot be fully assessed by the CBA expert, given the limited time available for their assessment. CBA is especially complex for investments in port infrastructure, given the diversity of infrastructure investments (the 12 types of port infrastructure identified previously) and the resulting wide range of potentially relevant benefits for society, such as for enabling a waterfront transition, reducing road congestion, increasing energy efficiency, strengthening the economic structure of regions accelerating the energy transition, and contributing to trade relations with EU’s neighbours.
In order to make informed choices on allocating public funding to investment projects, specific port guidelines, based on those of DG REGIO and on those elaborated by some Member States — Spain has recently produced a relevant document — could help to better assess costs and benefits and to allow a proper comparison among proposals.
More clarity on the approach and methods of measuring EU added value is an important part of such an approach. Some effects through which projects create EU value (as outlined above) cannot be objectively monetised and incorporated into the CBA. A project with negative monetised CBA could still be justified by non-monetised factors of societal value, including the qualitative or strategic value for Europe. A mechanism whereby investment proposals could be categorised in terms of EU added value would be a step forward. This would then be a powerful criterion (alongside others, including eligibility conditions) to be used by the European Commission to distribute grants in a way that is more coherent with the stated policies of the EU. The wider the diversity of projects, the more difficult it is to use one harmonised method. In this sense, it would be easier to define an adequate indicator of the EU added value specifically for port investments which is able to factor in non-monetary dimensions 77.
The process of applying for EU funds
This section provides the main conclusions of an assessment of the process of applying for EU funds from the perspective of applicants. This section is based on interviews (ports 78, INEA, DG MOVE) and ESPO’s position on the mid-term review of CEF.
• Potential applicants stress the importance of sufficient time between the (provisional) call text and the submission date for projects. In this period, ports can explore (partly with DG MOVE and INEA) whether their investment ideas/projects fit in the call priorities and therefore have sufficient success chances. Direct contact with INEA or DG MOVE at this stage is considered very useful 79. Sufficient preparation time is needed given the complexity of many investment projects, including securing commitment from potential users and developing partnerships, for instance with other ports or the private sector. Applicants wish that priorities are defined with as much detail as possible.
77. However, such a port specific method should be aligned with evaluation methods of other transport modes, otherwise some modes may be disadvantaged. 78. Interviews were performed with 9 port authorities’ experts across EU Member States, from both core and comprehensive ports. Most of them had applied multiple times to CEF calls and had obtained both positive and negative outcomes. 79. Applicants consider the call info days or other events dedicated to help/train applicants (online participation is also possible) as very useful. In these events, potential applicants meet DG Move and INEA staff as well as other potential partners. For first time applicants call documents are considered complex. This applies especially for the Blending call because it had new elements, such as the required financial analysis.
Port Investments Study 201872
• Member States are in charge of the completion and implementation of the Trans-European Networks, and thus Member State endorsement is an appropriate method to secure country-level support for large scale investment projects. It is however suggested that a distinction should be made between the types of projects for which Member State endorsement is required (i.e. large scale competitive projects) and smaller scale proposals mainly aimed at, for instance, increasing energy-efficiency or data-exchange in ports which should not require Member States validation.
• The preparation of a proposal often requires specialist consultants, especially given the need for a CBA. As this causes substantial costs for the applicant, a two-phase approach (like under H2020 or Interreg), or one or more consultation rounds may be worth considering, as this would help in reducing the costs associated with making proposals.
• The technical evaluation is generally considered fair. However, when a proposal is negatively assessed, applicants would benefit from direct and more detailed feedback. While INEA sends a full evaluation report to Members States, this information does not automatically or formally reach the applicants.
• The port managing bodies call for more transparency as regards how the selection of projects is performed during the internal evaluation by the Commission (i.e. existence of quotas per Member State or mode of transport). In addition, more transparency (and accessibility) of the characteristics of all received proposals would allow better evaluation of the call results by all stakeholders.
• The port managing bodies argue that the reduction of the funding requested (which was the case in about half of all successful proposals of port managing bodies) goes against the logic of closing the funding gap, as a reduction of the grant implies that the project remains financially not feasible.
• Finally, while the port managing bodies recognise the need for clear contractual agreements, infrastructure projects, and port projects in particular, often need adaptation to changing market conditions. The grant procedures would benefit from more flexibility regarding modifications to the investment project.


Port Investments Study 201874

Port Investments Study 201875
SUMMARY: TOWARDS EFFECTIVE MECHANISMS TO SUPPORT INVESTMENT PRIORITIES IN PORTS
This final chapter draws the main conclusions of this report. In addition, recommendations regarding the alignment of the administrative process for EU funding/financing with the port industry needs are made.
The diversity of port investments
First, the analysis of port infrastructure investment projects as submitted by the port managing bodies shows a very diverse range of investment projects, including investments in logistics sites, energy infrastructure and connections to inland transport modes (figure 20).
FIGURE 20: PROJECTS SUBMITTED BY PORT INFRASTRUCTURE INVESTMENT CATEGORY
Other 8%
Sites for port related logistics and manufacturing 3%Infrastructure for reducing environment footprint 1%
Intermodal/multimodal terminals 5%
ICT/digital infrastructure 4%
Maritime access 8%
Equipment en superstructure 8%
Energy-related infrastructure 7%
Rail transport connection 7%
Road transport connection 4%
Infrastructure for smooth transport flows 8%
Basic infrastructure 37%
Inland waterway transport connection 1%
Source: Ports investments survey
The case for investments in basic port infrastructures
Second, as demonstrated by figure 20 investments in basic port infrastructure continue to be the main investment category. These projects generally aim at various commodities, most often containers and Ro-Ro, both commodities which are expected to grow according to forecasts commissioned by the European Union. On top of these investments, port managing bodies see the necessity to execute a broad range of other projects.
8
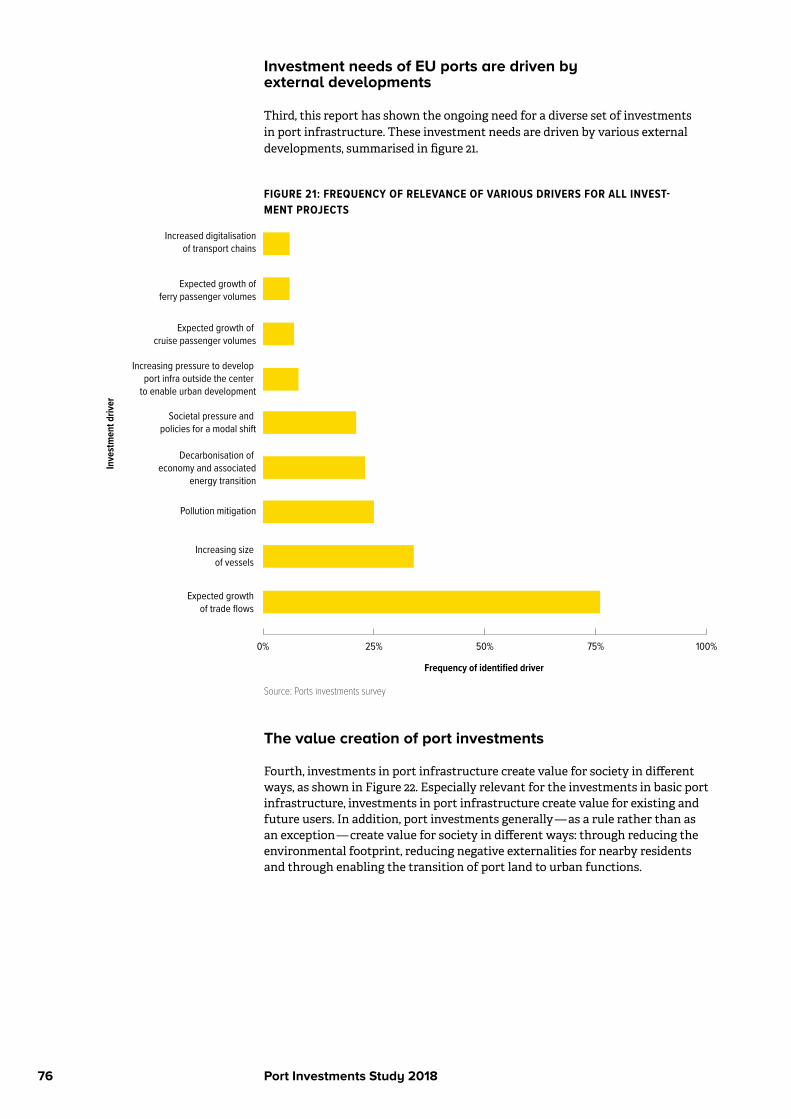
Port Investments Study 201876
Investment needs of EU ports are driven by external developments
Third, this report has shown the ongoing need for a diverse set of investments in port infrastructure. These investment needs are driven by various external developments, summarised in figure 21.
FIGURE 21: FREQUENCY OF RELEVANCE OF VARIOUS DRIVERS FOR ALL INVEST-MENT PROJECTS
0% 25% 50% 75% 100%
Expected growth of trade flows
Increasing size of vessels
Pollution mitigation
Decarbonisation of economy and associated
energy transition
Societal pressure and policies for a modal shift
Increasing pressure to develop port infra outside the center
to enable urban development
Expected growth of cruise passenger volumes
Expected growth offerry passenger volumes
Increased digitalisationof transport chains
Frequency of identified driver
Inve
stm
ent d
river
Source: Ports investments survey
The value creation of port investments
Fourth, investments in port infrastructure create value for society in different ways, as shown in Figure 22. Especially relevant for the investments in basic port infrastructure, investments in port infrastructure create value for existing and future users. In addition, port investments generally — as a rule rather than as an exception — create value for society in different ways: through reducing the environmental footprint, reducing negative externalities for nearby residents and through enabling the transition of port land to urban functions.

Port Investments Study 201877
FIGURE 22: VALUE CREATION MECHANISMS OF THE PROJECTS
0% 25% 50% 75% 100%
Value for future users
Value for current users
Value for society, through reduced
environmental footprint
Value for residents in surroundings, through reduced negative e�ects
(noice, stench, pollution)
Value for citizens, through enabling the transfer of
port land to urban functions
Share of projects
Valu
e cr
eatio
n m
echa
nism
Source: Ports investments survey
The case for EU funding for port investments
Fifth, despite their own investment capacity, port managing bodies partially rely on external funding to execute investments in port infrastructure. While port managing bodies have a mechanism in place to partially capture the value their investments create for port users (port dues and land lease fees), port managing bodies have no mechanisms to capture societal value creation. As a consequence, the business case for the port managing body may be negative, while the ‘value case’ for society of these projects is positive. For such types of investments ('type 4' projects in Figure 23), port managing bodies face a funding gap.
FIGURE 23: INVESTMENT PROJECTS FRAMEWORK
Negative
Nega
tive
PositiveSocietal value case
Hurdle rate for public funding
Hurdle rate for port m
anaging body
Posit
iveFi
nanc
ial b
usin
ess c
ase
for
the
port
man
agin
g bo
dy
Case for not granting permits (not common in ports)
No case to make investment Case for public funding
Case for investment, no public funding need
1. 2.
3. 4.

Port Investments Study 201878
The past use of EU instruments by ports
Sixth, the case for public funding of port infrastructure and transport infrastructure in general is reflected in the development of EU funding and financing instruments (CEF, EFSI, EIB). Ports have also been active in submitting proposals for financing in all of these instruments. From 2014 to 2017, about one third (62 of 168) of the port projects were successful in attracting CEF funds, while almost half of the proposals submitted by port authorities (87 proposals) received a negative evaluation and 19 proposals were not granted funding due to budgetary constraints despite being positively assessed by external experts and by the Commission.
In total, port authorities requested 2,5 €billion between 2014 and 2017. They were granted 860 €million, 35% of the total requested. The 860 €million represents 4% of the EU funding available between 2014 and 2017.
A platform as arrangement for funding port investments of medium size?A potentially relevant option to increase funding for small and medium size investments is the creation of a “Port Investment Platform”. Such an investment Platform (IP) could receive equity from EFSI and participate in funding medium-sized projects that, due to their size, would not be compliant, as individual projects, with the investment amounts required to obtain CEF grants or direct EIB loans. The IP would “package” projects in order to present them to the CEF as investment programmes that would comply with the size conditions to apply for the grants. On the other hand, through EFSI, the IP would be eligible to receive a credit line from the EIB. The IP would convey the loan conditions of the Bank to the different projects to be financed. The EIB would essentially treat the IP as an intermediary bank. If the IP demonstrates the capacity to control project quality and follows strict awarding and monitoring procedures, the EIB would delegate to the IP all the responsibilities for project selection and follow up. The concept of an IP open to EU ports, similar to the Accessibility Ports Infrastructure (Spain) already financed by EFSI, looks attractive. However, the feasibility of developing such an IP would require more detailed analysis.
The right mix of funding instruments for port investments
Seventh, in line with the societal value creation of investments in port infrastructure, the survey results show that the capacity to execute investments by port managing bodies continues to depend on the availability of public funding mechanisms. The development of port managing bodies towards autonomous, commercially operating and self-financing organisations (generally under government ownership), enables a greater use of blended financing instruments, but grants remain a key element in securing that investments that create value for society can be made. This reduces the risks associated with providing grants alone, such as overly optimistic demand forecasts and politically motivated port infrastructure investments with limited societal value creation.
Port Investments Study 201879
Clarity on the relevance of EU added value in the evaluation and methods to assess EU added value
Eighth, clarity on the relevance of EU added value in the evaluation and methods to assess EU added value would enable a better comparison between projects and thus better grant allocation decisions. The effects of specific port projects on the achievement of EU policy objectives seem an obvious factor to take into account when distributing EU grant money to the sector. The basis for a method to provide a multicriteria estimate of EU added value is suggested. It could be developed for port projects alongside similar ones for other transport modes to allow proper comparisons. This indicator, alongside those specific of the relevant programme, would improve the fairness in the distribution of grants.
Further alignment of grant allocation processes with the port industry needs
Ninth, the grant-allocation processes in relation to applying for financial support to investments in port infrastructure are overall regarded as good. The INEA support in the preparation stage is considered valuable, the evaluation is generally considered fair. The three main suggestions for improvement are first, a more balanced distribution of available resources over time. While the benefits of frontloading are acknowledged, the dynamic nature of port development implies that it is impossible to time the availability of mature projects in line with the EU’s budget allocation. Second, more transparency regarding the final selection of projects by the committee of DG MOVE and INEA (i.e. the role, if any of quotas per Member State or mode of transport) is desirable. Third, the ports would benefit substantially from more flexibility to modify proposals after funding has been granted, based for instance on modifications of customerrequirements.


Port Investments Study 201881
THE AUTHORS
Dr. Peter de Langen is the owner and principal consultant of PLA and visiting professor at Copenhagen Business School. He has 20+ years of project experience in 100+ projects on port strategy and port development. From 2007 to 2013, Peter worked at Port of Rotterdam Authority, department Corporate Strategy. His academic work is widely red and cited, see scholar.google.com/citations?user=qEvczEoAAAAJ&hl=en
Dr. Mateu Turró is currently a consultant on transport and logistics and professor of Transport at the Polytechnic University of Catalonia (UPC) in Barcelona. He has more than 40 years of experience in the transport sector. Until 2009 he was an Associate Director in the Projects Directorate of the European Investment Bank, responsible for the evaluation of transport and urban projects. Port projects represent a substantial percentage of the long list of projects he appraised at the EIB. Prof. Turró wrote a book on planning and financing trans-European transport networks and has assisted the Commission on several occasions. Presently he advises INEA on project selection.
Martina Fontanet is currently a consultant. She has 15+ years of experience in the ports industry, among others as a policy advisor at ESPO. Before that, Martina worked in Shanghai for two years as a research associate for the Port of Barcelona Chair of Logistics at the China Europe International Business School (CEIBS). Previously, she worked four years as a transport consultant in Barcelona.
Jordi Caballé is an economist working as a consultant at Ports & Logistics Advisory since 2013. He is also a PhD researcher at the University of Málaga (Spain). He is an economist with more than 12 years of experience in finance and enterprise consulting. He worked as an auditor for several years and has in-depth understanding of tax regulations as well as business development and project execution.

Port Investments Study 201882
REFERENCES
Clark, X., Dollar, D., & Micco, A. (2004). Port efficiency, maritime transport costs, and bilateral trade. Journal of development economics, 75(2), 417-450.
ESPO (2016) Trends in EU ports governance, available at https://www.espo.be/media/Trends_in_EU_ports_governance_2016_FINAL_VERSION.pdf.
European Commission (2013) Europe's Seaports 2030: Challenges Ahead, available at http://europa.eu/rapid/press-release_MEMO-13-448_en.htm.
European Commission (2013) European ports: an engine for growth available at https://ec.europa.eu/transport/modes/maritime/news/2016-06-27-ports_en.
European Commission (2017) Delivering TEN-T; Facts and Figures, available at http://www.connectingeu.eu/documents/Delivering_TEN_T.pdf.
European Commission (2006) Communication from the Commission on a European Programme for Critical Infrastructure Protection, available at http://eur-lex.europa.eu/legal-content/EN/TXT/PDF/?uri=CELEX:52006DC0786&from=EN.
European Commission (2017) Communication from the Commission on Delivering on low-emission mobility A European Union that protects the planet, empowers its consumers and defends its industry and workers, available at http://eur-lex.europa.eu/legal-content/EN/TXT/?uri=CELEX:52017DC0675.
Eurostat (2018) Maritime passengers embarked and disembarked in all ports available at http://appsso.eurostat.ec.europa.eu/nui/show.do?dataset=mar_mp_aa_cph&lang=en.
EIB (2018) the investment plan for Europe state of play, available at https://ec.europa.eu/commission/sites/beta-political/files/investment-plan-eu-wide-state-of-play-july2016_en_0.pdf.
Flyvbjerg, B. (2007). Policy and planning for large-infrastructure projects: problems, causes, cures. Environment and Planning B: Planning and Design, 34(4), 578-597.
International Port Community System association (2018) Port Community Systems available at http://www.ipcsa.international.
Portugal-Perez, A., & Wilson, J. S. (2012). Export performance and trade facilitation reform: Hard and soft infrastructure. World Development, 40(7), 1295-1307.
Port investments survey (2017), executed by Peter de Langen, Martina Fontanet Jordi Caballé and Mateu Turró, with the support of ESPO.
UNCTAD (2018) Review of Maritime Transport 2017, available at http://unctad.org/en/pages/PublicationWebflyer.aspx?publicationid=1890.

Port Investments Study 201883
APPENDIX 1: EU CORE PORTS PER CORRIDOR
The table below compiles the core network ports belonging to the nine network corridors according to the Regulation (EU) No 1316/2013 establishing the Connecting Europe Facility, the corridor work plans and the TENtec corridor maps.
Corridor EU core ports
Atlantic (8 seaports)
Algeciras, Sines, Lisbon, Leixoes (Porto), Bilbao, Bordeaux, Rouen, Le Havre
Baltic – Adriatic (8 seaports)
Ravenna, Venice, Trieste, Koper, Szczecin/Swinoujscie, Gdynia/Gdansk
Mediterranean (13 seaports)
Algeciras, Sevilla, Cartagena, Valencia, Tarragona, Barcelona, Marseille/Fos-sur-Mer, Venice, Ravenna, Koper, Trieste, Rijeka
North Sea – Baltic (14 seaports)
Amsterdam, Rotterdam, Moerdijk, Nort Sea Port (Vlissingen, Terneuzen), Antwerp, Wilhelmshaven, Bremerhaven, Bremen, Hamburg, Klaipeda, Ventspils, Riga, Tallin, Helsinki
North Sea – Mediterranean (21 seaports)
Cork, Dublin, Belfast, Glasgow, Edinburgh, Liverpool, Southampton, Felixtowe/Harwich, London, Dover, Calais, Dunkirk, Zeebrugge, Antwerp, North Sea Port (Ghent, Vlissingen, Terneuzen), Moerdijk, Rotterdam, Amsterdam, Marseille/Fos-sur-Mer
Orient/East – Med (12 seaports)
Limassol, Heraklion, Pireaus, Patras, Igoumenitsa, Thessaloniki, Burgas, Wilhelmshaven, Bremen, Bremerhaven, Hamburg, Rostock
Rhine – Alpine (7 seaports)
Zeebrugge, Antwerp, North Sea Port (Ghent, Vlissingen, Terneuzen), Moerdijk, Rotterdam, Amsterdam, Genoa
Rhine – Danube (2 seaports)
Constanta, Galati
Scandinavian – Mediter-ranean(29 seaports)
Valletta/Marsaxlokk, Augusta, Palermo, Gioia Tauro, Taranto, Bari, Naples, Cagliari, Livorno, Ancona, La Spezia, Rostock, Hamburg, Bremen, Bremerhaven, Wilhelmshaven, Lübeck, Copenhagen, Malmö, Trelleborg, Gothenburg, Stockholm, Turku/Naantali, Helsinki, Hamina/Kotka.
EU core ports not connected to a corridor:
Oostende, Shannon-Foynes (Limerick), A Coruña, Gijón, Las Palmas, Huelva, Palma de Mallorca, Santa Cruz (Tenerife), Nantes Saint-Nazaire, Luleå, Aarhus, Bristol, Cardiff/Newport, Grimsby/Immingham, Milford Haven and Teesport

Port Investments Study 201884
APPENDIX 2: THE SPLIT BETWEEN GENERAL AND COHESION CALLS
During the period from 2014 to 2017, Cohesion funds represented about one third of the total CEF funds allocated to port authorities’ projects.
Participation by port authorities in Cohesion calls has been limited, notably in the most important Cohesion call in terms of funding (2014) with five proposals and only two successful. Similarly, only two MoS proposals were submitted to Cohesion calls. According to interviews with port managing bodies, Member States in Cohesion countries favoured rail projects at the expense of port projects.
While port authorities from Cohesion countries benefited mostly from the Cohesion envelope, they also accessed funds from the General envelope. Projects in Cohesion calls are entitled to up to 85% funding compared to lower co-funding rates for General calls (e.g. 20% for works).
Calls 2014-2017 Max EU budget Eligible proposals Successful proposals
Recommended Funding
General Call 2014 7.930.000.000 90 28 471.853.633
General Call 2015 6.470.000.000 29 7 20.924.491
General Call 2016 900.000.000 18 7 26.341.670
Blending Call 2017 1.000.000.000 7 6 83.216.772
Total General Calls 16.300.000.000 144 48 602.336.565
Cohesion Call 2014 4.000.000.000 5 2 52.659.767
Cohesion Call 2015 1.090.000.000 11 7 167.001.013
Cohesion Call 2016 1.039.500.000 8 5 38.505.737
Total Cohesion Calls 6.129.500.000 24 14 258.166.518
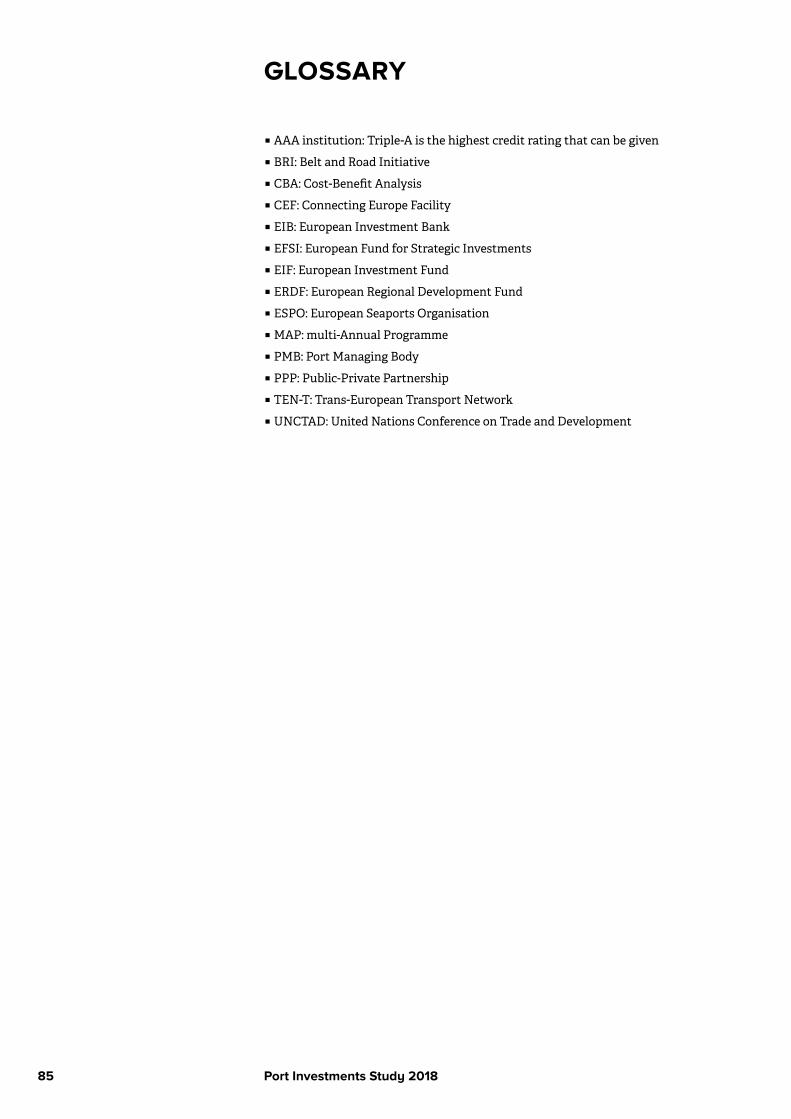
Port Investments Study 201885
GLOSSARY
• AAA institution: Triple-A is the highest credit rating that can be given
• BRI: Belt and Road Initiative
• CBA: Cost-Benefit Analysis
• CEF: Connecting Europe Facility
• EIB: European Investment Bank
• EFSI: European Fund for Strategic Investments
• EIF: European Investment Fund
• ERDF: European Regional Development Fund
• ESPO: European Seaports Organisation
• MAP: multi-Annual Programme
• PMB: Port Managing Body
• PPP: Public-Private Partnership
• TEN-T: Trans-European Transport Network
• UNCTAD: United Nations Conference on Trade and Development

EUROPEAN SEA PORTS ORGANISATION Treurenberg 6B – 1000 Brussel / BruxellesT +32 (0)2 736 34 63F +32 (0)2 736 63 25E [email protected]
ESPO