Embed Size (px)
Citation preview

The Information Society IndexEmerging Virtual
Have and Have Not Countries
The Information Society IndexEmerging Virtual
Have and Have Not Countries
Wilford H. Welch
World Times Inc.
Stanford University
December 1, 1999
Can All Societies Really Catch up?Can All Societies Really Catch up?
N. America
LatinAmerica WesternEurope East.
Europe,Mid. East,Africa
Asia Pacific
0%
10%
20%
30%
40%
50%
60%
N. America
LatinAmerica WesternEuropeEast.
Europe,Mid. East,Africa
Asia Pacific
Population
GDP
IT Expenditure
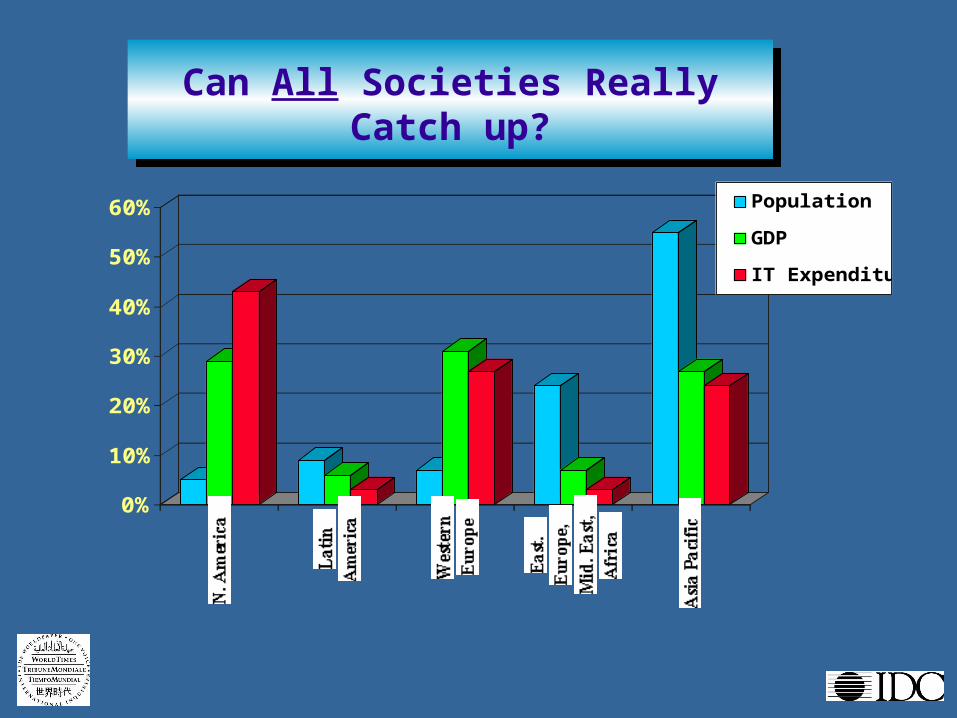
Information Societies Must Have Four Legs
InformationSociety
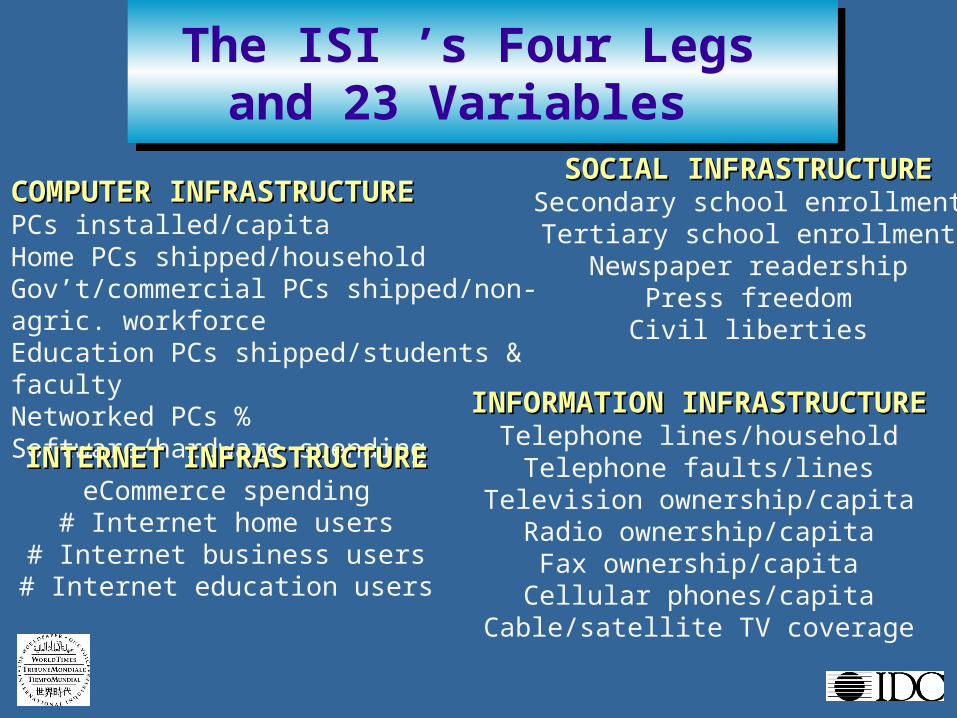
The ISI ’s Four Legs and 23 Variables
The ISI ’s Four Legs and 23 Variables
SOCIAL INFRASTRUCTURESOCIAL INFRASTRUCTURESecondary school enrollment
Tertiary school enrollmentNewspaper readership
Press freedomCivil liberties
INFORMATION INFRASTRUCTUREINFORMATION INFRASTRUCTURETelephone lines/household
Telephone faults/linesTelevision ownership/capita
Radio ownership/capitaFax ownership/capitaCellular phones/capita
Cable/satellite TV coverage
COMPUTER INFRASTRUCTURECOMPUTER INFRASTRUCTUREPCs installed/capitaHome PCs shipped/householdGov’t/commercial PCs shipped/non-agric. workforceEducation PCs shipped/students & facultyNetworked PCs %Software/hardware spending
INTERNET INFRASTRUCTUREINTERNET INFRASTRUCTUREeCommerce spending# Internet home users
# Internet business users# Internet education users
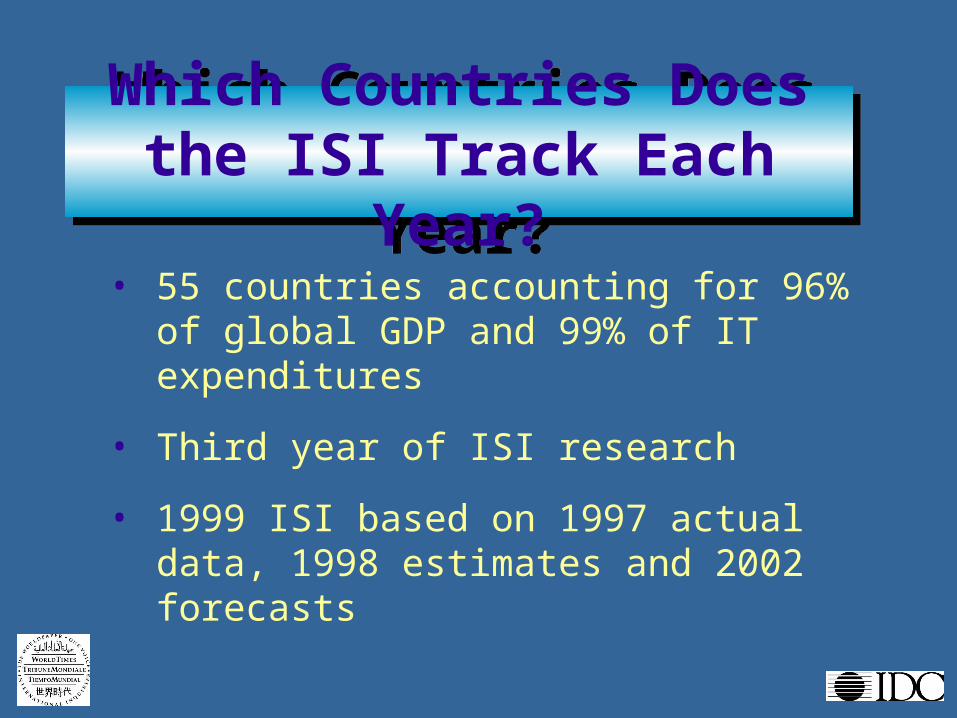
Which Countries Does the ISI Track Each Year?
Which Countries Does the ISI Track Each Year?
• 55 countries accounting for 96% of global GDP and 99% of IT expenditures
• Third year of ISI research
• 1999 ISI based on 1997 actual data, 1998 estimates and 2002 forecasts
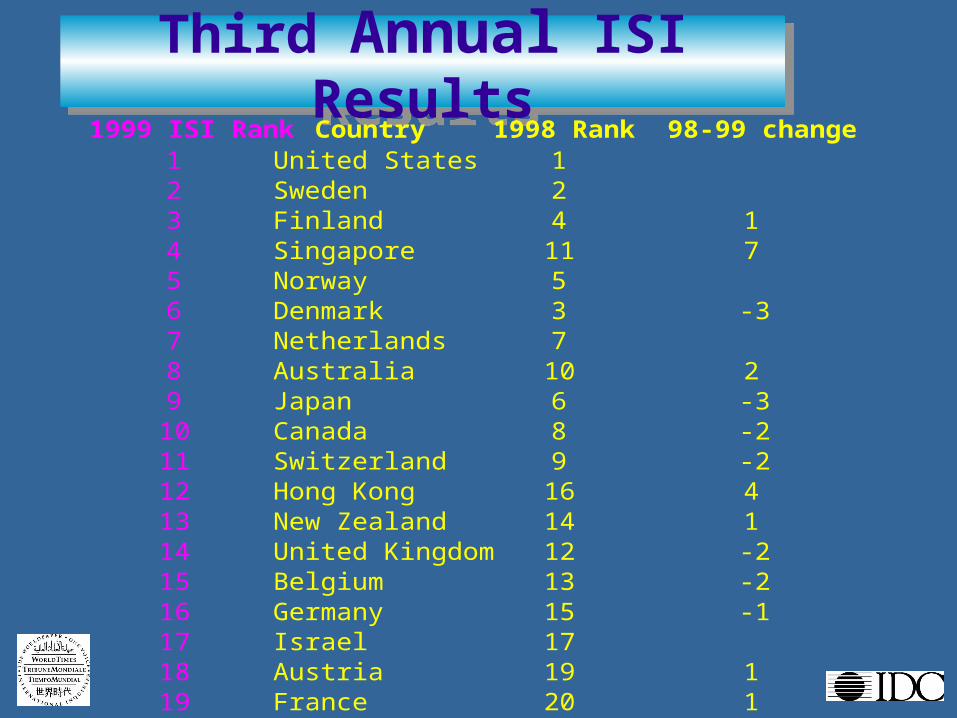
Third Annual ISI ResultsThird Annual ISI Results1999 ISI Rank Country 1998 Rank 98-99 change
1 United States 1 2 Sweden 2 3 Finland 4 14 Singapore 11 75 Norway 5 6 Denmark 3 -37 Netherlands 7 8 Australia 10 29 Japan 6 -310 Canada 8 -211 Switzerland 9 -212 Hong Kong 16 413 New Zealand 14 114 United Kingdom 12 -215 Belgium 13 -216 Germany 15 -117 Israel 17 18 Austria 19 119 France 20 1

Third Annual ISI ResultsThird Annual ISI Results1999 ISI Rank Country 1998 Rank Change
20 Korea 18 -221 Taiwan 22 122 Ireland 21 -123 Italy 24 124 Spain 23 -125 Portugal 26 126 Hungary 25 -127 Greece 28 128 Czech Rep 27 -129 Argentina 2930 Poland 3031 UAE 33 232 Chile 31 -133 Bulgaria 32 -134 Malaysia 3435 Romania 3536 Costa Rica 37 137 South Africa 36 -138 Venezuela 39 139 Panama 40 140 Russia 38 -2

Third Annual ISI ResultsThird Annual ISI Results1999 ISI Rank Country 1998 Rank Change
41 Brazil 4142 Ecuador 46 443 Mexico 42 -144 Colombia 47 345 Thailand 43 -246 Philippines 45 -147 Turkey 44 -348 Saudi Arabia 49 149 Peru 48 -150 Jordan 5051 Egypt 5152 India 5253 China 5354 Indonesia 5455 Pakistan 55
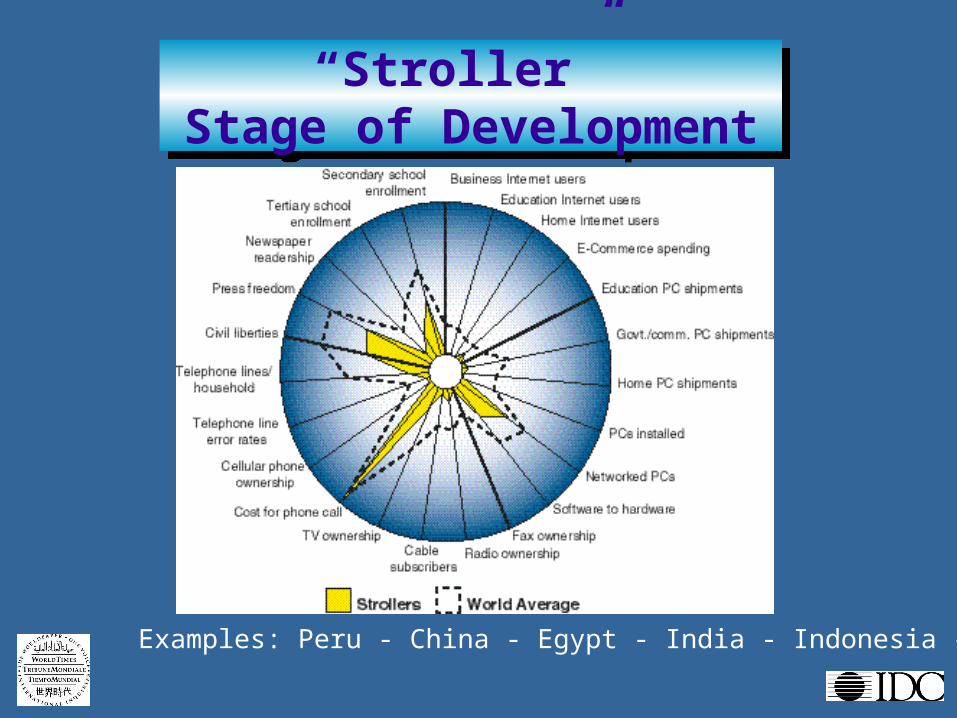
“Stroller” Stage of Development
“Stroller” Stage of Development
Examples: Peru - China - Egypt - India - Indonesia -
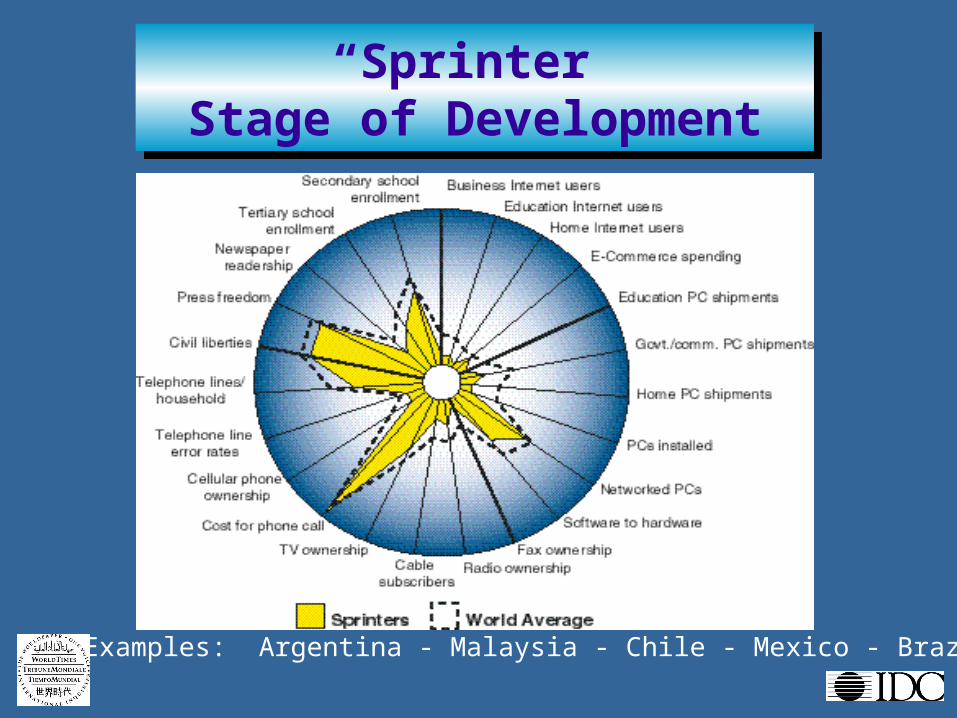
“Sprinter”Stage of Development
“Sprinter”Stage of Development
Examples: Argentina - Malaysia - Chile - Mexico - Brazil - Ecuador
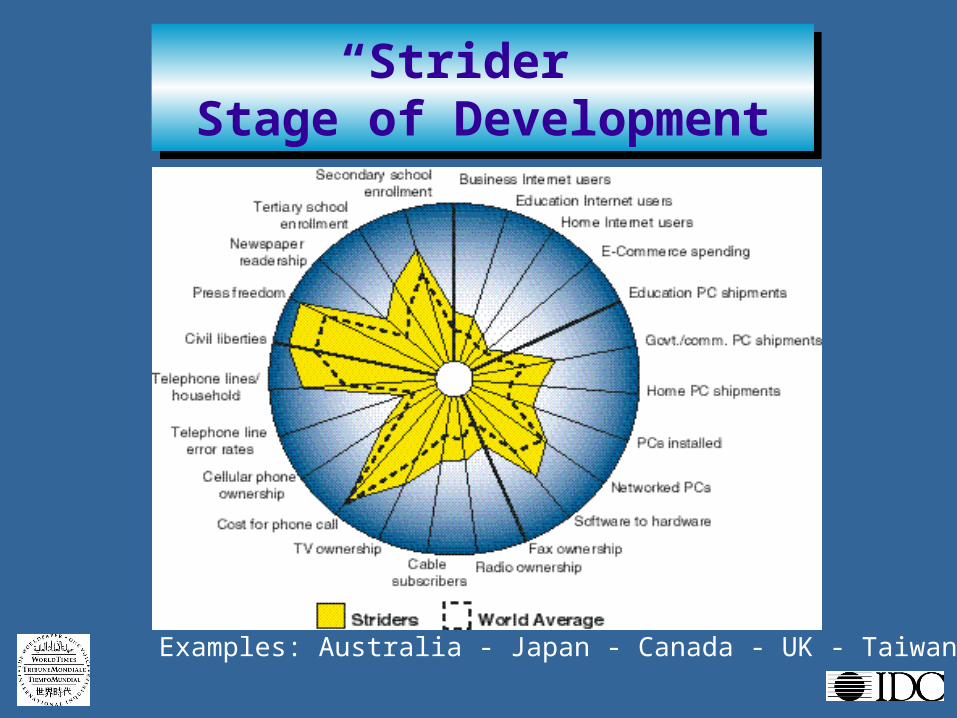
“Strider” Stage of Development
“Strider” Stage of Development
Examples: Australia - Japan - Canada - UK - Taiwan
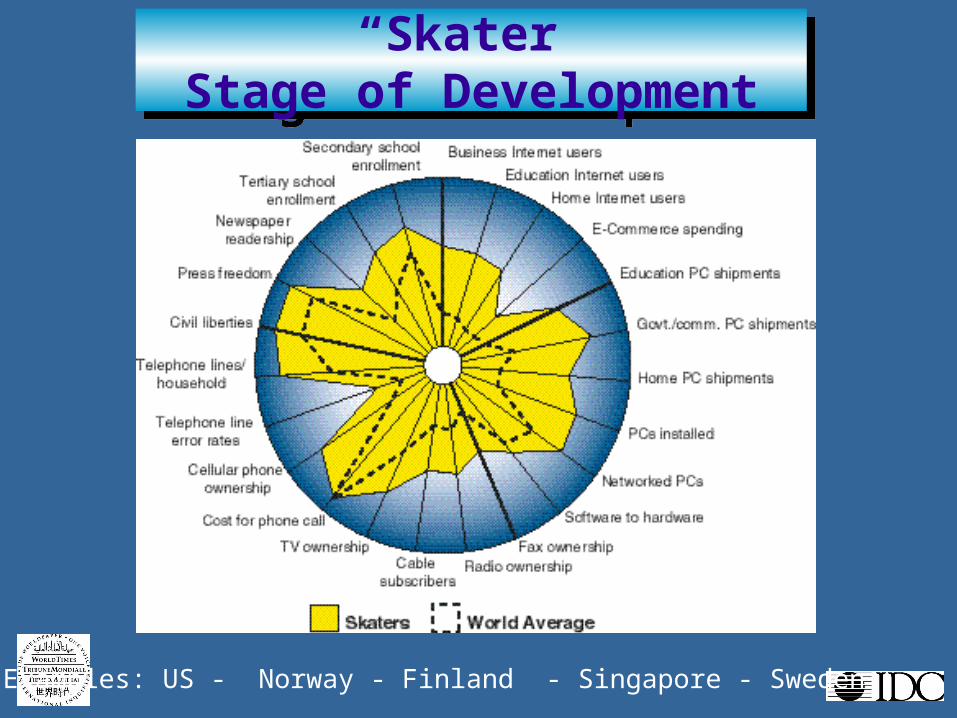
“Skater”Stage of Development
“Skater”Stage of Development
Examples: US - Norway - Finland - Singapore - Sweden

In Conclusion, the Reality is: The Gaps are WideningIn Conclusion, the Reality is: The Gaps are Widening
• Gap 1: US and the rest of the world
• Gap 2: Between the Striders and Sprinters
• Gap 3: Between the 55 ISI countries and the 150 other countries of the world with 40% of the population, 4% of GDP and less than 1% of IT $
• Gap 4: Gaps within developing countries

What are the real drivers? What are the real drivers?
• Proximity to major information society such as the US (e.g. Canada, Israel in terms of political/economic patronage
• Distance (e.g. Australia forced by need for internal and external communications)
• Political will and effective execution (e.g. Singapore)
In Conclusion, Where Should Countries and Companies Invest?
In Conclusion, Where Should Countries and Companies Invest?
• Sustained investment in all four infrastructures is key to a society’s development, as is political will
• Focusing on the US and other fast growing major markets is the obvious strategy for vendors; but consider:
• - the early adopters
• - designing products to meet the needs of the poorer countries which are currently being overlooked