Embed Size (px)
Citation preview


The information in this document has been obtained by Turkiye Is Bankasi A.S. (“Isbank”) fromsources believed to be reliable, however, Isbank cannot guarantee the accuracy,completeness , or correctness of such information. This document has been issued forinformation purposes only. The financial reports and statements announced by Isbank to theinformation purposes only. The financial reports and statements announced by Isbank to thepublic and the relevant corporations are accepted to be the sole material. Isbank does notaccept any liability whatsoever for any direct or consequential loss arising from any use ofthis document or its contents due to the misleading information in this document. Allestimations contained in this document are the opinions of Isbank and can be subject top jchange without notice. This document can not be interpreted as an advice to the investorsand Isbank can not be held responsible for the results of investment decisions made onaccount of this document. This document has been issued specially to the person, whom thedocument is concerned and may not be reproduced, distributed or shared with third partiesy p , pfor any purpose.
Page 2
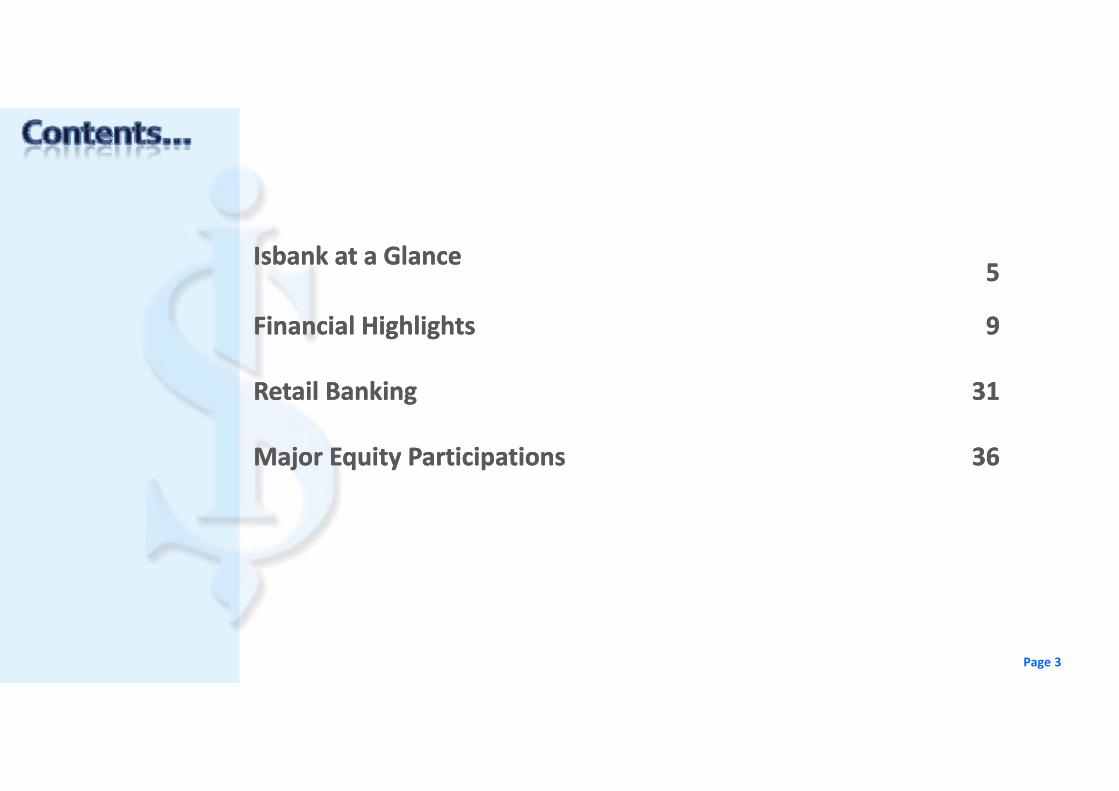
Isbank at a GlanceIsbank at a Glance55
Financial HighlightsFinancial Highlights 99
Retail BankingRetail Banking 3131Retail BankingRetail Banking 3131
Major Equity ParticipationsMajor Equity Participations 3636
Page 3

Financial HighlightsFinancial Highlights 99
Retail BankingRetail Banking 3131gg
Major Equity ParticipationsMajor Equity Participations 3636
Page 4

Stocks are quoted at ISE and also traded at LSE in the form 30.4%30.4%
AtaturkAtaturk SharesShares
Free Float Free Float
of GDR
Largest stake owned by employees via pension fund
1,104 domestic branches country‐wide (Largest among
private banks), and 15 international branches
28.1%28.1%41.5%41.5%
AtaturkAtaturk SharesSharesIsbankIsbank Pension Fund Pension Fund
3,861 ATMs (Largest ATM network in the country) and
1,056 Internet Banking Terminals for customers
13 Isbank Branches in Northern Cyprus
HO + 11 Isbank GmbH Branches in Germany –
Bank Subsidiary
1 Isbank Branch in London, UK.
1 Isbank GmbH Branch in Amsterdam, the Netherlands
1 Branch in Manama, Bahrain
1 Isbank GmbH Branch in Paris, France
1 Representative Office 1 Isbank GmbH Branch in1 Representative Office in Shang‐hai, China
1 Isbank GmbH Branch in Zurich, Switzerland
1 Representative Office in Cairo, Egypt
Page 5

Page 6

Market Share(%)
2010 H1
Rank(2)
Total Assets(1) 14.2 1st
Loans(1) Total Loans 13.3 1st
TRY Loans 12.9 1st
FX Loans 14.2 3rd
Consumer Loans 11.1(3) 1st
Deposits(1) TRY Deposits 14.4 1st
FX Deposits 15.3 2nd
Demand Deposits(4) 16 2 1stDemand Deposits(4) 16.2 1st
Total Deposits 14.7 1st
Retail Products Volume of Debit Cards 15.6 1st
Number of POS 14.5 3rd
Acquiring Volume 13.2 4th
Number of Credit Cards 11.0 3rd
Issuing Volume 13.6 3rd
Page 7
Capital Markets Mutual Funds 22.3 1st
1) Market share calculations are based on BRSA data excluding participation banks. 2) Ranking among private‐sector banks.3) Market share calculation is based on BRSA data that include overdraft accounts.4) Bank deposits are excluded.

Isbank at a Glance 5
Retail Banking 31Retail Banking 31
Major Equity Participations 36
Page 8

Loans (TRY Loans (TRY mnmn.).)Loans (TRY Loans (TRY mnmn.).)Total Total AssetsAssets (TRY (TRY mnmn.).)Total Total AssetsAssets (TRY (TRY mnmn.).)
47.610 48.33557.019
80 18197.552
113.223123.953
29.81833.980
2006 2007 2008 2009 2010 H1
75.205 80.181
2006 2007 2008 2009 2010 H1 2006 2007 2008 2009 2010 H12006 2007 2008 2009 2010 H1
DepositsDeposits (TRY (TRY mnmn.).)DepositsDeposits (TRY (TRY mnmn.).) ShareholdersShareholders’ ’ EquityEquity (TRY (TRY mnmn.).)ShareholdersShareholders’ ’ EquityEquity (TRY (TRY mnmn.).)
46.399 48.533
63.53972.177
80.403
9.41010.604
9.449
13.494 14.315
2006 2007 2008 2009 2010 H1 2006 2007 2008 2009 2010 H1Page 9

15% 10%C h & B k
(TRY mn.) 2009 2010 H1 Change
C h & k 93 2 330 28%
AssetAsset CompositionCompositionAssetAsset CompositionComposition
35%37%
15% Cash & Banks
Securities
Cash & Banks 17,193 12,330 ‐28%
Securities (Net) 39,290 45,583 16%
Loans 48,335 57,019 18%
P ti i ti (N t) 5 031 5 038
43% 46%
Loans
Participations
Participations (Net) 5,031 5,038 ‐
Fixed Assets (Net) 1,922 1,892 ‐2%
Other Assets 1,452 2,091 44%
Total Assets 113 223 123 953 9%
3% 3%4% 4%
2009 2010 H1
Fixed & Other Assets
LoansLoans / / AssetsAssetsLoansLoans / / AssetsAssetsInterest Earning Interest Earning AssetsAssets */ */ Total AssetsTotal AssetsInterest Earning Interest Earning AssetsAssets */ */ Total AssetsTotal Assets
Total Assets 113,223 123,953 9%
40% 42%49%
43% 46%90% 90%93%
89% 90%
Page 102006 2007 2008 2009 2010 H12006 2007 2008 2009 2010 H1
*Starting from 2009, FX reserve requirements are not included in interest earning assets.

Loans / Loans / DepositsDepositsLoans / Loans / DepositsDepositsLoanLoan PortfolioPortfolio QoQQoQ (TRY mn.)(TRY mn.)LoanLoan PortfolioPortfolio QoQQoQ (TRY mn.)(TRY mn.)
50.28439 757
57.019 67,0%70,9%77,1% 73,8%
50,5%65,1%
35.300
14.984
39.757
17.262
TRY FX Total 2010 Q1 2010 Q2
50,5%
2009 2010 H1Loans/Deposits TRY Loans/TRY Deposits FX Loans/FX Deposits2010 Q1 2010 Q2
TRY / FX TRY / FX MixMix of Loansof LoansTRY / FX TRY / FX MixMix of Loansof Loans
25% 26% 31% 29% 30%
Loans/Deposits TRY Loans/TRY Deposits FX Loans/FX Deposits
57.019
LoanLoan PortfolioPortfolio YtDYtD (TRY mn.)(TRY mn.)LoanLoan PortfolioPortfolio YtDYtD (TRY mn.)(TRY mn.)
75% 74% 69% 71% 70%
25% 26% 31% 29% 30%
34.435
13.900
48.33539.757
17.262
57.019
2006 2007 2008 2009 2010 H1TRY FX
Page 11
TRY FX Total 2009 2010 H1

5454%% comprisedcomprised ofof retailretail ConsumerConsumer LoansLoans (TRY (TRY mnmn.).)ConsumerConsumer LoansLoans (TRY (TRY mnmn.).)Total Total LoansLoansTotal Total LoansLoans
21% 20%
……5454%% comprisedcomprised ofof retailretailandand SMESME loansloans..
ConsumerConsumer LoansLoans (TRY (TRY mnmn.).)ConsumerConsumer LoansLoans (TRY (TRY mnmn.).)
Retail Loans
10,202 11,436
25% 25%
9% 9%1%
Consumer
Overdraft
Retail Loans29%
General Purpose Consumer Loans
50%50% 50%50%
46%
Overdraft
Credit CardsAuto Loans88%% 6%6%
44% 46% SME*
CorporateHousing Loans
44%44%42%42%
2009 2010 H1
2009 2010 H1Page 12
*SME definition includes companies with;
Turnover < USD30.000.000 and Credit Limit < USD10.000.000

ManagementManagement of of NPLsNPLsManagementManagement of of NPLsNPLsNPL NPL RatioRatioNPL NPL RatioRatio100100%% NPLNPL provisioningprovisioning
5,1% 5,1%
6,1%5,4% 5,4%
4,8%
sincesince 20032003……
2,5%1,4%
4,2%
0,5% 0,6%0,0%
485
695
31481
,
Coverage Coverage Coverage Coverage
09 Q1 09 Q2 09 Q3 09 Q4 10 Q1 10 Q2
368 4
315
258
188 207
214
374
237
259297
161
57 78
‐1
TRY mn.
100,0%122,2%
132,4%
5 7
09 Q1 09 Q2 09 Q3 09 Q4 10 Q1 10 Q2
Additions to NPLs Recoveries Net NPL Formation‐ NPL Formation Rate*
T
Cash Provisions Adj. Coverage(1) Full Coverage(2)(1) Adjusted value of collaterals + loan loss provisions (2) Book value of collaterals + loan loss provisions
Page 13
* Net NPL Formation (annualized) / Average Loans

NPL NPL BreakdownBreakdownNPL NPL BreakdownBreakdownNPL NPL RatioRatio by by LoanLoan CategoriesCategoriesNPL NPL RatioRatio by by LoanLoan CategoriesCategories
10,2%
5 4%
10,0%
67%83%
4,2%5,4%
3,7%4,8%
Consumer Credit Cards Total Loans
33%17% 6% 4% 3%
83% 94% 96% 97%
PerformingPerforming LoanLoan GroupsGroupsPerformingPerforming LoanLoan GroupsGroups
Consumer Credit Cards Total Loans2009 2010 H1 2006 2007 2008 2009 2010 H1
Restructured Other NPLs
96,8%
3,2%
I. Group Loans II. Group Loans Page 14

BreakdownBreakdown of of SecuritiesSecurities PortfolioPortfolioBreakdownBreakdown of of SecuritiesSecurities PortfolioPortfolio Total Total PortfolioPortfolio (TRY(TRY mnmn.).)Total Total PortfolioPortfolio (TRY(TRY mnmn.).)
FX Floating;
TRY Discount &
39.290
45.583
TRY Floating; 36 9%
FX Floating; 7,1% Fixed ;
36,1%
FX Discount & Fixed ; 19 9%
26.31924.326 24.981
36,9% 19,9%
2006 2007 2008 2009 2010 H1
Average durations are
0 85 f TRY S iti67 % of Securities are Available for Sale
3.30 years for FX Securities
0.85 years for TRY SecuritiesGovernment bonds and treasury bills constitute92% of total portfolio.
Page 15
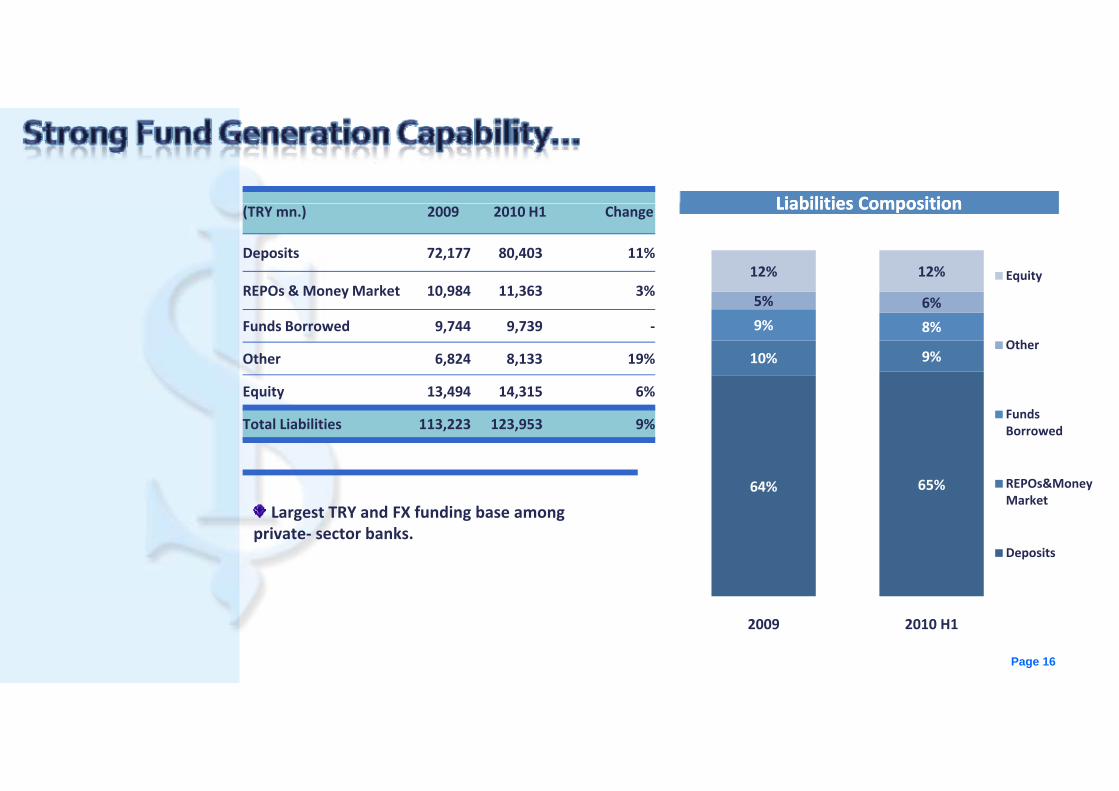
LiabilitiesLiabilities CompositionCompositionLiabilitiesLiabilities CompositionComposition(TRY mn.) 2009 2010 H1 Change
Deposits 72,177 80,403 11%
REPOs & Money Market 10,984 11,363 3%
LiabilitiesLiabilities CompositionCompositionLiabilitiesLiabilities CompositionComposition
5% 6%
12% 12% Equity
Funds Borrowed 9,744 9,739 ‐
Other 6,824 8,133 19%
Equity 13,494 14,315 6%
10% 9%
9% 8%
5% 6%
Other
Equity 13,494 14,315 6%
Total Liabilities 113,223 123,953 9%
64% 65%
Funds Borrowed
REPOs&Money 64%Market
Deposits
Largest TRY and FX funding base amongprivate‐ sector banks.
2009 2010 H1
Page 16

ll i di ti di t ff
FX DepositsTRY Deposits 72 177
...... aa clearclear indicatorindicator ofofcustomercustomer trusttrust.. DepositDeposit BaseBase (TRY (TRY mnmn.).)DepositDeposit BaseBase (TRY (TRY mnmn.).)
80,403
TRY Deposits 72,177
63,539
48,53338%
33%
39%
36%
36%
48,53346,399
67%
61%
64%64%
62%67%
2006 2007 2008 2009 2010 H1
Page 17

Market Market SharesSharesMarket Market SharesSharesDepositsDeposits QoQQoQ (TRY mn.)(TRY mn.)DepositsDeposits QoQQoQ (TRY mn.)(TRY mn.)
75.564 80.40313 5% 14,4%
15,9% 15,3%14,3% 14,7%
48.802
26.762
53.874
26.529
TRY FX Total
4,1%
13,5%9,9%
6,8%
,
2000 2009 2010 H1TRY FX Total2010 Q1 2010 Q2
Largest market share in TRY and total deposits
TRY Deposits FX Deposits Total Deposits
DepositsDeposits YtDYtD (TRY mn.)(TRY mn.)DepositsDeposits YtDYtD (TRY mn.)(TRY mn.)
g pamong private‐sector banks.
15% YtD growth in TRY Savings Deposits.
TRY Savings Deposits account for 43.1% of totaldeposits.44.672
72.17753.874
80.403
Page 18
27.505 26.529
TRY FX Total2009 2010 H1

makemake significantsignificant
12,169
DemandDemand DepositsDeposits ((TRY TRY mnmn.).)DemandDemand DepositsDeposits ((TRY TRY mnmn.).) Share Share of of DemandDemand DepositsDeposits in Total in Total DepositsDeposits2010 H12010 H1
Share Share of of DemandDemand DepositsDeposits in Total in Total DepositsDeposits2010 H12010 H1
……makemake significantsignificantcontributioncontribution toto lowerlower costcost ofoffundingfunding..
11,259
7,6787,991
8,788
60%63% 84,9%
47% 55%54%
15,1%
2006 2007 2008 2009 2010 H1
53%45%
46% 40% 37%
Demand Deposits Other Deposits
TRY FX
Page 19

No. No. Of Investment Accounts (000)Of Investment Accounts (000)No. No. Of Investment Accounts (000)Of Investment Accounts (000)Client Assets (TRYClient Assets (TRY mnmn.).)Client Assets (TRYClient Assets (TRY mnmn.).)...... hashas reachedreached aa remarkableremarkable ( )( )( )( )(( ))(( ))totaltotal ofof TRYTRY 122122 billionbillion..
7.498 8.074
107,320121,823
On‐Balance Shee
70,488 79,821
90,617
4.630 5.231
6.158
67%66%
etOS
66%61%
70%
18% 15% 13%2006 200 2008 2009 20 0
9% 10%6%
Off‐Balance
Sheet7%9%
6%
18% 11%2006 2007 2008 2009 2010 H1
18%6%
18%
6%6%
Deposits Fixed Income Mutual Funds Equities
2006 2007 2008 2009 2010 H1
Page 20

RegulatoryRegulatory Capital (TRY Capital (TRY mnmn.).)RegulatoryRegulatory Capital (TRY Capital (TRY mnmn.).)CapitalCapital AdequacyAdequacyCapitalCapital AdequacyAdequacyHHighigh CARCAR supportsupportss balancebalance
,4%
6,7%
18,0%
18,3%
17,6%
17,4%
5,9%
6,3%
16,8%
17,0%
6,2%
6,3%
HHighigh CARCAR supportsupportss balancebalancesheetsheet growthgrowth goinggoingforwardforward……
854
2.14
6
13.148
13.963
14.258
15.023
.143
1.88
4
2.31
4
12.933
13.136
14.048
15 1 1 1
15 16 1 1 16 16
2009 Q1 2009 Q2 2009 Q3 2009 Q4 2010 Q1 2010 Q2
10.8 12 1
11.
11 1 1 1
2009 Q1 2009 Q2 2009 Q3 2009 Q4 2010 Q1 2010 Q2CAR Tier I Ratio
FreeFree EquityEquity vs. vs. Total Total ShareholdersShareholders’ ’ EquityEquity (TRY (TRY mnmn.).)FreeFree EquityEquity vs. vs. Total Total ShareholdersShareholders’ ’ EquityEquity (TRY (TRY mnmn.).)Isbank ranked 103rd in the Banker magazine’s “Top 1000 World
Banks” survey based on banks’ consolidated financial statements
Regulatory Capital Tier I Capital
as at 31.12.2009.
Isbank ranked 288th in the 2009 list of annual “Forbes Global2000”.9.410
10.6049.449
13.494 14.315
4.848 5.828 5.551
8.973 9.859
2006 2007 2008 2009 2010 H1Shareholders' Equity Free Equity*
Page 21*Free Equity = Shareholders’ Equity – (Non‐Financial Participations + Fixed Assets)

OperatiOperatingng Income CompositionIncome CompositionOperatiOperatingng Income CompositionIncome Composition(TRY mn.) 2010 Q1 2010 Q2 Change QoQ
N I INet Interest Income 1,254 1,133 ‐10%
Net Fees & Comm. from Banking Serv. 319 315 ‐1%
Net Trading Gains/Losses 126 115 ‐9%
Dividends Received 111 255 130% 15% 14%
57% 52%NII
Net Commissions
Released Provisions 351 317 ‐10%
Gains on Asset Sales 7 20 186%
Other Operating Income 25 19 ‐24%
Total Operating Income 2,193 2,174 ‐1%
22% 29%6% 5%
15%
2010 Q1 2010 Q2
Net Trading Income
Other Income
Allocation of Allocation of OperatOperatinging IncomeIncomeAllocation of Allocation of OperatOperatinging IncomeIncomePersonnel Expenses 336 481 43%
Running Costs 184 235 28%
Depreciation & Amortization 51 50 ‐2%
Other Operating Expenses 97 91 ‐6%42% 41%
Net Profit
Total Operating Expenses 668 857 28%
Operating Profit 1,525 1,317 ‐14%
Loan Loss Provisions 273 182 ‐33%
Other Provision Charges 137 89 ‐35%
8%11%
28% 20%
42% 41%Total Provision Charges
Adm. Expenses
Total Provision Charges(Excluding Tax Provisions)
410 271 ‐34%
Tax Provisions 201 158 ‐21%
Net Income 914 887 ‐3%
7% 6%15% 22%8%
2010 Q1 2010 Q2
Personnel Expenses
Other Operating Expenses
Page 22

OperatOperatinging Income CompositionIncome CompositionOperatOperatinging Income CompositionIncome Composition(TRY mn.) 2009 H1 2010 H1 Change YoY
Net Interest Income 2 310 2 387 3%Net Interest Income 2,310 2,387 3%
Net Fees & Comm. from Banking Serv. 609 634 4%
Net Trading Gains/Losses 277 241 ‐13%
Dividends Received 322 366 14%
56% 55%
NII
Net Commissions
Released Provisions 334 668 100%
Gains on Asset Sales 16 28 75%
Other Operating Income 59 43 ‐27%
Total Operating Income 3,927 4,367 11%
19% 24%10%
6%16% 15%
2009 H1 2010 H1
Net Trading Income
Other Income
AllocationAllocation ofof OperatiOperatingng IncomeIncomeAllocationAllocation ofof OperatiOperatingng IncomeIncomePersonnel Expenses 732 817 12%
Running Costs 375 418 11%
Depreciation & Amortization 98 101 3%
Other Operating Expenses 138 189 37%
T t l O ti E
2009 H1 2010 H1
35% 41%Net Profit
Total Operating Expenses 1,343 1,525 14%
Operating Profit 2,583 2,842 10%
Loan Loss Provisions 706 455 ‐36%
Other Provision Charges 208 227 9%
Total Provision Charges10% 10%
31% 24%
41%Total Provision Charges
Adm. Expenses
Personnel Total Provision Charges(Excluding Tax Provisions)
914 682 ‐25%
Tax Provisions 298 359 20%
Net Income 1,370 1,802 32%
5% 6%19% 19%
2009 H1 2010 H1
Expenses
Other Operating Expenses
Page 23

GrossGross CommissionCommission IncomeIncome (TRY (TRY mnmn.).)GrossGross CommissionCommission IncomeIncome (TRY (TRY mnmn.).)FeesFees and and CommissionsCommissions ReceivedReceived ((GrossGross))FeesFees and and CommissionsCommissions ReceivedReceived ((GrossGross))...... supportedsupported byby superiorsuperiorretailretail andand corporatecorporateretailretail andand corporatecorporatefranchisefranchise..
9% 12%
8% 8% Non Cash Loans
Credit Appraisal
662 689
17%22%
Mutual Fund Man. And Other Inv.Acc.Fees 2009 H1 2010 H1
CommissionCommission IncomeIncome CoverageCoverageCommissionCommission IncomeIncome CoverageCoverage42%32%
Credit Cards
Fund Transfer
83 2%
13% 14%
6% 7%5% 5%
Account Keeping Fees
Other
45,3%41,5%
83,2% 77,6%
2009 H1 2010 H1
Other
2009 H1 2010 H1Net Comm.Income/Operating Expenses Net Comm.Income/Personnel Expenses Page 24

NIMNIMNIMNIMAverage SpreadAverage SpreadAverage SpreadAverage Spread
8,5%6,6%
1,6% 1,3%
5,8%4,9%
6,4% , 1,3%
2009 2010 H1
TRY FX Blended
6,4%
5,5%
2,4%1,7%
8,1% 7,7%
5,9% 5,6%
Adj. NIMAdj. NIMAdj. NIMAdj. NIM (1)
2009 2010 H1
TRY FX 2,3%1,5%
,
(1) Adjusted for Securities Trading Gains / Losses and Foreign Exchange Gains / Losses Page 25
2009 2010 H1
TRY FX Blended

CostCost vs. vs. IncomeIncome (TRY (TRY mnmn.).)CostCost vs. vs. IncomeIncome (TRY (TRY mnmn.).)Cost / Cost / IncomeIncomeCost / Cost / IncomeIncome
42,0%36,7%
45,2%
34,0% 34,9%3.927
4.367
2006 2007 2008 2009 2010 H1
1.343 1.525
2009 H1 2010 H1Cost Income
Cost StructureCost StructureCost StructureCost StructureCostCost vs. vs. AssetsAssetsCostCost vs. vs. AssetsAssets
7% 7%4% 4%
7% 8% Other
2,7%
2 6%
2,9% 2,9%
54% 54%
28% 27%7%
SDIF Fees
Depreciation
Administrative 2,6%
2009 H1 2010 H1Cost/Av. Assets Cost/Av. IEA
2009 H1 2010 H1
ExpensesStaff Cost
Page 26

ROAAROAAROAAROAAROAEROAEROAEROAE
33,7%3,0%
2 5%
17 0%
20,7%
25,9%22,2%
24,3%
21,6%
28,8%
1,6%
2,2%
1,7%
2,3%
1 5%1,7%
2,0%
2,5%
11,9%
17,0%15,1%
1,5%1,4%
2006 2007 2008 2009 2010 H1 2006 2007 2008 2009 2010 H12006 2007 2008 2009 2010 H1
ROAE ROAE*
2006 2007 2008 2009 2010 H1
ROAA ROAA*
* Banking business (Excluding equity participations portfolio)Page 27

MarketMarket CapCap Comparison (Comparison (TRYTRY mnmn ))MarketMarket CapCap Comparison (Comparison (TRYTRY mnmn )) Earnings & PayoutEarnings & Payout RatioRatioEarnings & PayoutEarnings & Payout RatioRatio
32.7% 32.1% 36.1% 34.6%
32.4%**23,2%
20.311 19 45022.376
Market Market CapCap. . Comparison (Comparison (TRY TRY mnmn.).)Market Market CapCap. . Comparison (Comparison (TRY TRY mnmn.).) Earnings & Payout Earnings & Payout RatioRatioEarnings & Payout Earnings & Payout RatioRatio
1.7021 509
2.37217.972
11.342
19.450
635
9561.109
1.509
2006 2007 2008 2009 2010 H1Isbank is included in the following indices:
2004 2005 2006 2007 2008 2009
Isbank is included in the following indices:
• ISE‐100
• ISE‐30
• ISE‐Bank Index
• Merrill Lynch Global Banks Index
Payout Ratio (*)• Morgan Stanley MSCI Equity Index
• Dow Jones Turkey Titans 20 Index
• Dow Jones Turkey 15 Equally Weighted Index
Net Profit (TRY billion)* Dividend / Net Profit** 2008 Payout includes both cash and bonus shares. 10.96 % of net income is distributed in cash. Page 28

Rating Outlook
Global Scale
Long Term Counter Party Credit BB Positive
Rating Outlook
Long Term FC IDR BBB‐ Stable
Long Term LC IDR BBB‐ Stableg y
Long Term Certificate of Deposits BB ‐
Short Term Counter Party Credit B ‐
Short Term Certificate of Deposits B ‐
National Scale
g
Short Term FC IDR F3 ‐
Short Term LC IDR F3 ‐
National Long Term AAA (tur) StableNational Scale
Long Term National trAA ‐
Short Term National trA‐1 ‐
Individual C ‐
Support 3 ‐
Support Rating Floor BB ‐
Rating Outlook
Bank Financial Strength C‐ StableLong Term FC Deposits Ba3 Positiveg p Ba3 Positive
Long Term LC Deposits Baa2 Stable
Short Term FC Deposits Not Prime ‐Short Term LC Deposits P‐2 ‐ Page 29

Isbank at a Glance 5
Financial Highlights 9
Major Equity Participations 36
Page 30

16 different products for different customer segments97,445 merchant firms and 188,306 chains are included in loyalty
programme.The number of cards reached 7.9 million, 5 million of which are
issued to Bank’s own customersissued to Bank s own customers.The first bank in Turkey which has made an agreement with the world’s
fourth largest payment system JCB
((TTRYRY millionmillion)) 2009 H12009 H1 2010 H12010 H1 ChangeChange
Issuing Volume 13,825 15,088 9%
Issuing Volume Market Share 14% 14% ‐
Acquiring Volume 12,516 13,940 11%
Acquiring Volume Market Share 14% 13% ‐1
Balance 4 749 5 128 8%Balance 4,749 5,128 8%
Number of Credit Cards (000) 5,073 5,043 ‐1%
Number of P.O.S. Terminals 272,638 260,023 ‐5%
* According to Interbank Card Center data Page 31

IsbankIsbank dominatesdominates thethemarketmarket beingbeing thethe marketmarketmarket,market, beingbeing thethe marketmarketleaderleader inin mutualmutual fundsfunds..
Page 32

Number of InvestorsNumber of InvestorsNumber of InvestorsNumber of InvestorsMutual Funds (TMutual Funds (TRYRY mnmn.).)Mutual Funds (TMutual Funds (TRYRY mnmn.).)...... 3232 typestypes ofof mutualmutual fundsfundsd i dd i d ff diff tdiff t i ki kdesigneddesigned forfor differentdifferent riskriskappetitesappetites..
4.523 5.140 5.1656.776 6.771
552.346 582.249 590.000646.754 685.388
2006 2007 2008 2009 2010 H1 2006 2007 2008 2009 2010 H1
126
IncomeIncome FromFrom Funds (Funds (TRYTRY mnmn.).)IncomeIncome FromFrom Funds (Funds (TRYTRY mnmn.).)With 8 equity (A type), 24 fixed income (B type) mutual
funds and more than 685 thousand investors, Isbank mutual funds are the most preferred ones in the sector
115126
17,4%18,3%
funds are the most preferred ones in the sector.
Revenue from mutual funds is the second largest contributor to commissions income.
2009 H1 2010 H1
Income Share in Total Fee Income
22% market share in mutual funds.
Page 33

AutomatedAutomated Bill Bill PaymentsPaymentsAutomatedAutomated Bill Bill PaymentsPaymentsPayrollPayroll AccountsAccountsPayrollPayroll AccountsAccounts...... supportedsupported byby payrollpayrollaccountsaccounts andand billbill paymentpayment
6.660
8.35911.997
10.706
yyyyyyyyp yp yagreementsagreements..
6.435.3126.057.811
2009 H1 2010 H1Amount (TRY million)
2009 H1 2010 H1Amount (TRY million) Number of Payments
Number of payroll accounts is 1.195.238 as of 30.06.2010.
Automated bill payments and payroll accounts are important sources for low cost demand deposits.
Payroll accounts create significant cross selling opportunities.
Page 34
Isbank at a Glance 5
Financial Highlights 9
Retail Banking 31Retail Banking 31
Page 35

......asas oneone ofof thethe biggestbiggestggggconglomeratesconglomerates inin TurkeyTurkey..
Page 36

SectoralSectoral BreBreaakdownkdownSectoralSectoral BreBreaakdownkdown
15 4%9,2% 12,4%
50,9%49,1%
Other
Financial Non‐Financial
26,3%
15,4%
23,7% Non‐financial Financial
TRY 4 8
TelecomOther
InsuranceGlass
Financial Ins.
Banks
13,0%TRY 4.8billion
Financial Ins.
35 5%Listed Non ‐ Listed
As ofAs of JuneJune 20102010, Isbank has , Isbank has 2525 participations. participations.
35,5%
64,5%
TRY 4.8billionSince the end of 2002, Since the end of 2002, a a total oftotal of 4747 participations haparticipations has s been divesbeen divestedted..
Share of Share of participationsparticipations in total in total assetsassets is 4.1% as of the is 4.1% as of the endend of of JuneJune2010.2010.
Non‐listed Listed
Page 37

A leading flat glass glassware glass packaging soda
General InformationGeneral InformationGeneral InformationGeneral Information Market/Market/ProductionProduction Shares Shares (%)(%)Market/Market/ProductionProduction Shares Shares (%)(%)2 3
IsbankIsbank ((6644 %%) ) IsbankIsbank ((6644 %%) )
A leading flat glass, glassware, glass packaging, sodaash and chromium chemicals producer in the domesticmarket.
Backed by its vision, Şişecam expands its productionoperations into neighboring countries.
Turkey2 Europe World3
Flat Glass 69.0 12.6 3 3.7
Glassware 68.3 2 25.0 3 9.0
Glass Packaging 89 0 7 4 3 3 4
Financial InformationFinancial Information ((CConsolidatedonsolidated, IFRS), IFRS)Financial InformationFinancial Information ((CConsolidatedonsolidated, IFRS), IFRS)USD (Million) 2010/06 2009/12
Total Assets 4.219 4.442
Glass Packaging 89.0 7.4 3 3.4
Glass Fibre 58.0 5.6 2 1.9
Soda Ash 85.0 8.3 2 3.2
Chromium 92 0 51 0 2 26 0
1. Includes exports and sales from production abroad.
2. Market shares including Turkey. For Soda Ash, European market doesnot include Russia and Ukraine.
3 Production/capacity shares
Shareholders’ Equity 2.481 2.465
Net Sales 1.347 2.357
International Sales 1 612 1. 111
Gross Profit 393 570
Chemicals492.0 51.0 2 26.0
3. Production/capacity shares.
4. Chromium chemicals are based on Basic Chromium Sulphate.EBITDA 314 446
38

TheThe GroupGroup obtainsobtains efficiencyefficiency andand spreadsspreadsll kk bbitsits operationaloperational riskrisk byby positioningpositioning itsits
productionproduction facilitiesfacilities inin thethe fastfast growinggrowingneighbouringneighbouring countriescountries..
Flat GlassGlasswareGlass PackagingGlass PackagingChemicals
39

İşbank* 18.63% Turk Telekom 81.37%
AveaAvea hashas beenbeen createdcreated throughthrough thethe mergermerger ofof AriaAria andand AycellAycell inin FebruaryFebruary 20042004..
AveaAvea brandbrand hashas beenbeen successfullysuccessfully launchedlaunched inin JuneJune 20042004..
AfterAfter thethe mergermerger,, duedue toto thethe integrationintegration ofof 22 GSMGSM networksnetworks,, notnot onlyonly tthehe coveragecoverage andand efficiencyefficiencyhavehave increasedincreased significantlysignificantly,, butbut alsoalso substantialsubstantial operationaloperational synergiessynergies havehave beenbeen createdcreated..
SinceSince thethe mergermerger datedate,, overover $$ 22 billionbillion hashas beenbeen investedinvested inin thethe technologicaltechnological infrastructureinfrastructure ofofAveaAvea andand numnumerouserous innovativeinnovative productsproducts andand servicesservices havehave beenbeen introducedintroduced toto thethe TurkishTurkish marketmarket ..
AveaAvea hashas acquiredacquired 33GG LicenseLicense inin NovemberNovember 20082008 forfor €€ 214214millionmillion andand hashas startedstarted toto provideprovide 33GG
servicesservices asas ofof JulyJuly 20092009..
AveaAvea hashas 1111,,55 millionmillion subscriberssubscribers andand aproximatelyaproximately %% 1919 marketmarket shareshare,, asas ofof JuneJune 20102010..
İşİşbank’sbank’s standstand‐‐alonealone andand riskrisk groupgroup shareshare inin AveaAvea paidpaid upup capitalcapital isis 1313..8686%% andand 1818..6363%%respectivelyrespectively..
Page 40*Total *Total shareshare of of Bank’sBank’s Risk Risk GroupGroup

Company NameField of
A ti itBank’s Direct Share(%)
Risk Group
Assets
(USD 000)
Shareholders’Equity Market
Share (%)Basis for Market Share
Activity Share(%)Share (%) (USD 000)
(USD 000)Share (%)
Türkiye Sınai Kalkınma Bankası A.Ş. Investment Bank 40.52 50.79 4,596,537 707,613 25.15 Total Assets
İşbank GmbH Banking 100.00 100.00 881,792 84,384 N/A
Anadolu Anonim Türk Sigorta Şirketi Insurance 35.53 57.31 1,143,225 478,616 11.73 Premium Income
Anadolu Hayat Emeklilik A.Ş. Private Pension 62.00 83.00 2,996,378 255,085 16.78 Premium Income
Milli Reasürans T.A.Ş. Reinsurance 76.64 77.06 977,832 466,291 25 (2) Premium Income
İş Yatırım Menkul Değerler A.Ş. Brokerage House 65.65 72.14 1,606,057(1) 327,118(1) 6.76 Transaction Volume
Yatırım Finansman Menkul Değerler A.Ş. Brokerage House ‐ 98.51 288,657 35,355 2.15 Transaction Volume
İş Yatırım Ortaklığı A.Ş. Trust Company ‐ 29.12 144,021 143,579 32.42 NAV
İş Portföy Yönetimi A.Ş. Portfolio Mngt. ‐ 100.00 39,872 30,234 23.73 Funds UnderManagement
İş Finansal Kiralama A.Ş. Leasing 27.79 57.70 869,162 265,037 9.6 Transaction Volumeş Ş g
İş Factoring Finansman Hizmetleri A.Ş. Factoring ‐ 100.00 213,606 28,575 1.19 Transaction Volume
İş Gayrimenkul Yatırım Ortaklığı A.Ş. REIT 42.23 57.67 639,488 602,901 22.6 Market Value
İş Girişim Sermayesi Yatırım Ortaklığı A.Ş. Risk Venture ‐ 57.67 84,424(1) 83,124(1) ‐
TOTAL 14 481 051 3 507 912TOTAL 14,481,051 3,507,912
(1) Consolidated amount(2) Milli Reasürans T.A.Ş. is the sole Turkish reinsurance company operating in Turkish insurance sector with a market share of 25%. The rest 75% is shared by foreign reinsurance companies.
Page 41

SüleymanSüleyman HH.. ÖzcanÖzcanHeadHead ofof InvestorInvestor RelationsRelations DivisionDivisionPhonePhone :: ++ 9090 212212 316316 1616 0202
SüleymanSüleyman HH.. ÖzcanÖzcanHeadHead ofof InvestorInvestor RelationsRelations DivisionDivisionPhonePhone :: ++ 9090 212212 316316 1616 0202PhonePhone :: 9090 212212 316316 1616 0202EE‐‐mailmail :: suleymansuleyman..ozcan@[email protected] :: 9090 212212 316316 1616 0202EE‐‐mailmail :: suleymansuleyman..ozcan@[email protected]
AlperAlper TurgalTurgalAssistantAssistant ManagerManager ofof InvestorInvestor RelationsRelations DivisionDivisionAlperAlper TurgalTurgalAssistantAssistant ManagerManager ofof InvestorInvestor RelationsRelations DivisionDivisionAssistantAssistant ManagerManager ofof InvestorInvestor RelationsRelations DivisionDivisionPhonePhone :: ++ 9090 212212 316316 1616 1010‐‐1111 // 316316 3030 3636EE‐‐mailmail :: alperalper..turgal@[email protected]
AssistantAssistant ManagerManager ofof InvestorInvestor RelationsRelations DivisionDivisionPhonePhone :: ++ 9090 212212 316316 1616 1010‐‐1111 // 316316 3030 3636EE‐‐mailmail :: alperalper..turgal@[email protected]
Page 42