Embed Size (px)
Citation preview
Vol.:(0123456789)1 3
Rock Mechanics and Rock Engineering https://doi.org/10.1007/s00603-018-1492-3
ORIGINAL PAPER
The Influence of Water Saturation on the Short- and Long-Term Mechanical Behavior of Red Sandstone
S. B. Tang1 · C. Y. Yu1 · M. J. Heap2 · P. Z. Chen1 · Y. G. Ren1
Received: 9 October 2017 / Accepted: 23 April 2018 © Springer-Verlag GmbH Austria, part of Springer Nature 2018
AbstractThe presence of water greatly influences time-dependent rock deformation. An understanding of how water can affect the time-dependent mechanical behavior of rock is important when assessing the long-term stability of geotechnical projects. While the previous studies have performed brittle creep experiments on oven-dry or fully-saturated rocks, we report here on a study designed to better understand brittle creep at different levels of saturation. We performed brittle creep experiments on oven-dry samples of red sandstone (Hunan province, China) and samples of the sandstone pre-immersed in water for different durations (from 2 to 8 days). These samples were deformed at a constant stress in one of either two conditions: dry or submerged in water. Before performing creep experiments, we first performed a series of water absorption and constant stress rate experiments to guide the stresses required for our creep tests and to assist with their interpretation. Our creep experiments show that immersion in water greatly increased the minimum creep strain rate and greatly shortened the time-to-failure when compared to the dry state. In detail, the minimum creep strain rate and time-to-failure increased and decreased, respectively, as pre-immersion duration increased from 4 to 6 days, but did not change as the duration was further increased to 8 days. We attribute this to the saturation of microcracks between 4 and 6 days (i.e., water imbibition was complete, or close to completion, following 6 days). We also show that oven-dry samples deformed at a constant stress underwater fail at stresses much lower than oven-dry samples deformed under dry conditions, due to the imbibition of water during deforma-tion. Samples pre-immersed in water, but deformed in the dry condition were characterized by lower strain rates and longer time-to-failure than those pre-immersed in water and deformed underwater. Our explanation for this is that, due to the avail-ability of water, crack tips can remain hydrated when the sample is deformed underwater, thus increasing the efficacy of stress corrosion cracking. The relationships and data provided herein inform on the long-term stability of engineering structures.
Keywords Brittle creep · Water · Red sandstone · Time-to-failure
1 Introduction
Rock exhibits both instantaneous (short-term) and time-dependent (long-term) irreversible deformation when it sub-jected to stresses above the threshold stress required to form new microcracks (Paterson and Wong 2005). The presence
of fluids is well known to reduce the strength of rock due to a combination of mechanical and chemical processes (Baud et al. 2000). Mechanically, fluids can reduce rock strength by reducing the effective pressure. Chemically, rock strength can be reduced through (1) a reduction in surface free energy (Rehbinder et al. 1948), (2) reactions between the pore fluid and certain minerals within the rock, such as the reaction between water and clays (Hawkins and McConnell 1992; Baud et al. 2000; Masuda 2001; Duda and Renner 2013), and (3) the increased efficiency of subcritical crack growth mechanisms (Atkinson 1984; Atkinson and Meredith 1987). Due to the time-dependency of subcritical crack growth, the chemical influence of pore fluids on rock deformation strongly depends on the timescale under consideration.
Time-dependent deformation is typically studied in the laboratory by performing constant stress (creep)
* S. B. Tang [email protected]
1 State Key Laboratory of Coastal and Offshore Engineering, Dalian University of Technology, Dalian 116024, People’s Republic of China
2 Géophysique Expérimentale, Institut de Physique de Globe de Strasbourg (UMR 7516 CNRS, Université de Strasbourg/EOST), 5 rue René Descartes, 67084 Strasbourg Cedex, France
S. B. Tang et al.
1 3
experiments. When rock is held under a constant stress, the strain rate as a function of time first decelerates, and then, if the stress is high enough, the strain rate accelerates and the sample fails (Brantut et al. 2013). This decelerating-accelerating phenomenology (the brittle “creep curve”) has been observed for many rock types, including sandstone (Baud and Meredith 1997; Ngwenya et al. 2001; Heap et al. 2009b; Brantut et al. 2014a), limestone (Brantut et al. 2014b; Nicolas et al. 2017), granite (Kranz et al. 1982; Lockner 1993; Fujii et al. 1999), tuff (Ye et al. 2015), basalt (Heap et al. 2011), and shale (Sone and Zoback 2014; Rybacki et al. 2017). Creep experiments on sandstone in the duc-tile regime—“compactant creep”—are characterized by a reduction in porosity and deceleration in axial strain rate (i.e., there is no accelerating creep) (Heap et al. 2015). Brit-tle creep experiments are often defined by the minimum strain rate achieved during deformation at constant stress. The minimum creep strain rate is extremely sensitive to the differential stress and an increase of a few MPa can result in order-of-magnitude increases to the minimum creep strain rate (Brantut et al. 2013). It is thought that the accelera-tion to failure occurs once a critical microcrack density has been reached (Kranz and Scholz 1977; Baud and Meredith 1997; Heap et al. 2009a). The micromechanical mechanism promoting such time-dependent behavior is considered to be stress corrosion cracking, a mechanism that describes rock–fluid interactions that occur between the strained atomic bonds at the crack tips and a chemically active pore fluid (Atkinson 1984; Atkinson and Meredith 1987; Brantut et al. 2013). Stress corrosion cracking is also thought to be the mechanism responsible for compactant creep in sand-stones (Heap et al. 2015; Tang et al. 2018).
Several studies have investigated the influence of water on stress corrosion cracking and brittle creep. For exam-ple, experiments on single cracks using the double-torsion
method have shown, for a variety of rock types, that slow crack growth can be orders of magnitude faster in the pres-ence of water (Waza et al. 1980; Nara et al. 2011, 2012, 2013). The study of Kranz et al. (1982) showed that time-to-failure in Westerly granite during triaxial creep experiments is significantly reduced in the presence of water. Lui et al. (2015) found that creep in low-grade metamorphic slate was enhanced as moisture content increased in uniaxial creep experiments. Despite the number of studies on brittle creep (Brantut et al. 2013), the vast majority performed experi-ments on either water-saturated or oven-dry samples; there are relatively few studies conducted on rock with different levels of saturation.
In practical rock engineering, such as the rock slopes of a hydroelectric power station or the pillars and mining rooms in deep mining engineering, the saturation level of the rock will vary depending on the stage of development and usage of the power station or mine. For example, the rock slopes will be relatively dry prior to the construction of hydropower station (Fig. 1a), and when the station is in operation, the slope-forming rocks will be in contact with water (Fig. 1b). The rock within deep mines will be saturated prior to mining (the rock is below the water table), dry during mining (the water table is lowered as water is pumped from the mine and the mine is ventilated), and saturated once more when the mining is discontinued (when water is no longer pumped from the mine). The flooding of the mining rooms has been known to result in roof failure and mine collapse. The water table in geothermal reservoirs will also vary over time as rates of injection and extraction change during exploita-tion. A better understanding of the long-term stability of engineering structures, therefore, requires a detailed under-standing of the time-dependent deformation of rock under different levels of saturation and under different conditions (dry or in contact with water).
Fig. 1 Rock slope in a dried and b soaked water condition during the construction and operation of a hydroelectric power station (example of Xiluodu hydropower station in Sichuan, China)
The Influence of Water Saturation on the Short- and Long-Term Mechanical Behavior of Red…
1 3
We report herein on an experimental study that explores the time-dependent deformation of red sandstone from Hunan Province (China). We first performed a series of water absorption and uniaxial constant stress rate experi-ments (on dry samples and samples pre-immersed in water for several days) to guide our time-dependent brittle creep experiments. Uniaxial brittle creep experiments were then performed on oven-dry samples and samples pre-immersed in water for several days (from 2 to 8 days). These experi-ments were performed in one of either two conditions: dry or submerged in water. Finally, the implications of these data on the long-term stability of engineering structures are discussed.
2 Experimental Materials and Procedure
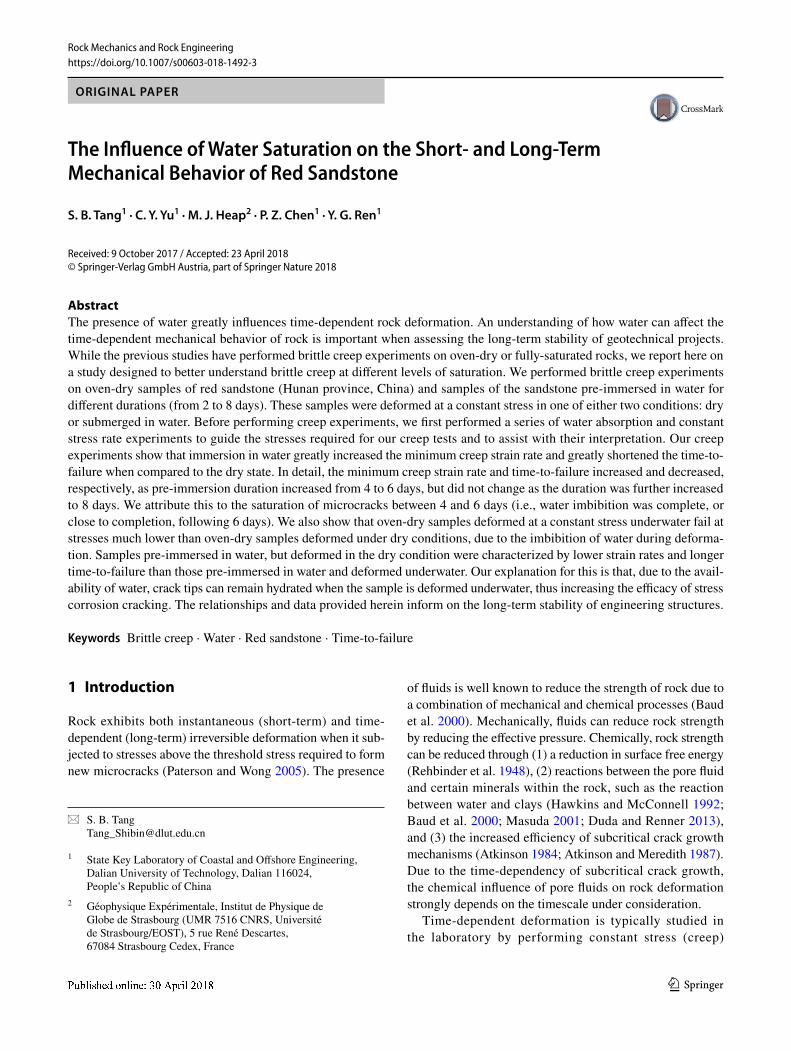
Red sandstone—widely distributed in Hunan province, China—was selected as the rock type for this study (Fig. 2). In the Hunan province, the water sensitivity of such rock is considered the main reason for landslides that occur during or following rain. The constituent minerals (proportion) of red sandstone are quartz (65.6%), plagioclase (22.7%), cal-cite (9.8%), and other clay minerals (less than 2%). The dry density varies between 2250 and 2300 kg/m3, and the natu-ral water content (the water content of the in-situ material) varies between 2.6 and 2.9%. The average porosity of our samples, calculated using the skeletal (connected) sample
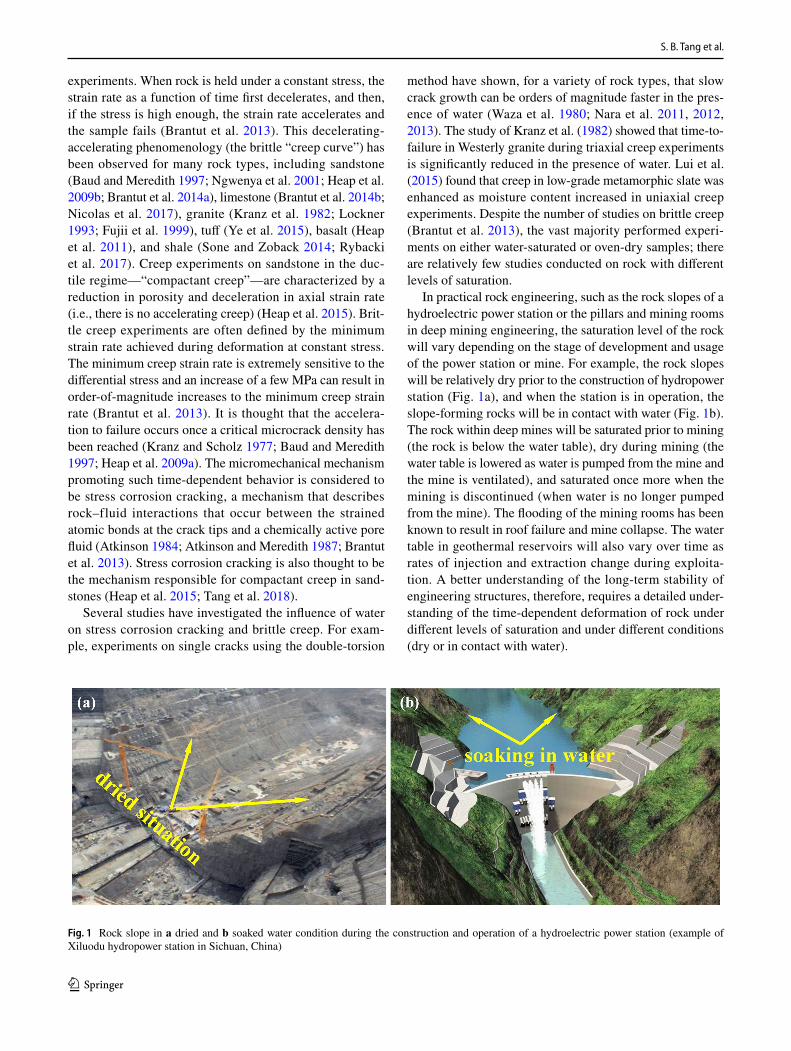
volume given by a gas pycnometer and the mass and dimen-sions of the sample, is 11.6%. The permeability of the red sandstone used in this study was measured using the steady-state method using water as the pore fluid. Permeability was measured on a cylindrical sample (100 mm in height and 50 mm in length) under a confining pressure of 5 MPa and an axial stress of 5 MPa. We used a pressure gradient of 1 MPa and calculated permeability using Darcy’s law (see Heap et al. (2017) for a detailed description of the equations used). The permeability of the red sandstone studied herein is 6.26 × 10⁻¹¹ m2. Optical and scanning electron microscope (SEM) images are provided in Fig. 3. These images show that the largest grain size is about 0.15 mm and that most grains are 0.04–0.1 mm in diameter; the average grain size is about 0.08 mm. We also note that there are no obvious pre-existing fractures in the intact red sandstone (Fig. 3).
A number of cylindrical samples of red sandstone, 100 mm in height and 50 mm in diameter, were cored from the same block and in the same direction (see Fig. 2). The sample end-faces were made parallel to within 1/100 mm. This procedure produced samples with almost the same physical properties, providing a high level of replication under controlled laboratory test conditions (Fig. 2). Figure 2 also shows that the red sandstone studied herein does not contain any obvious bedding or laminations: it has a very homogenous texture.
First, we performed uniaxial compressive strength experi-ments (UCS) on samples of red sandstone with different
Fig. 2 Photos of red sandstone samples. The height and diameter of each sample is 100 and 50 mm, respectively

S. B. Tang et al.
1 3
levels of water saturation (oven-dry and pre-immersed in water for different durations) under dry conditions. In these experiments, the samples were loaded to failure at a constant loading rate of 0.05 kN/s. The “oven-dry” samples were dried in an oven at 110 °C until their mass was constant (lasting about 2 days), and then coated with paraffin and a waterproofing membrane (to prevent the ingress of atmos-pheric moisture). The “pre-immersed in water” samples were pre-immersed in water for different durations (from 2 to 8 days), after which they were taken out of the water and coated with paraffin and a waterproofing membrane (to prevent desaturation). The constant stress rate experiments were performed not only to understand the influence of water content on the short-term mechanical properties, but also to determine the creep stress for the time-dependent deforma-tion tests. The static Young’s modulus was also determined for each of the UCS tests.
We then performed uniaxial brittle creep experiments on dried samples and samples pre-immersed in water for dif-ferent durations (prepared as explained above). Experiments were either performed under dry conditions or submerged in water. The creep experiments consisted of two steps: (1) the sample was first loaded at a constant loading rate of 0.05 kN/s to a pre-ascribed target stress and (2) the sample was allowed to deform at the pre-ascribed stress (held con-stant) for an extended period of time. Since the creep strain rate has been observed to evolve during a brittle creep exper-iment (Brantut et al. 2014a), we calculate here the creep strain rate (i.e., simply the strain for a given time interval) for the duration of the experiments, rather than simply reporting the minimum creep strain rate. An environmental chamber was used for the submerged experiments, consisting of a
rigid steel base, a polymethyl methacrylate (PMMA) cham-ber wall, and a steel plate (as shown in Fig. 4). The environ-mental chamber was placed within the uniaxial load frame. For the creep tests performed underwater, the sample was first placed in the chamber, and then, the chamber was filled with water. The sample was then deformed at a constant stress according to the two steps mentioned above. For the submerged experiments, the samples were not coated with paraffin and a waterproofing membrane (to allow water imbibition during the experiment). The creep test was then performed as described above.
Fig. 3 a Optical microscopic image (in cross-polarized light) and b scanning electron microscope (SEM) image of the red sandstone used in this study
Fig. 4 Schematic diagram of the long-term loading machine used in this study

The Influence of Water Saturation on the Short- and Long-Term Mechanical Behavior of Red…
1 3
A displacement transducer (resolution of 1.5‰ F.S.) recorded the axial displacement of the sample during experi-mentation, which was converted to axial strain using the sample length. Measurements of displacement were cor-rected to account for the displacement of the load train (pis-tons, endcaps, etc.). A load cell recorded (resolution if 3‰ F.S.) the axial load, which was converted to stress using the sample radius. It should be noted that for each type of experiment, the number of tested samples was not less than three to eliminate problems that may arise due to sample variability. In this study, we treat compressive stresses and strains as positive. Table 1 shows the experimental scheme for the tests performed for this study.
Before performing the deformation experiments, we first performed water absorption tests on four samples of red sandstone. The mass of natural samples was measured first. The samples were then dried in the oven at 110 °C until their masses were constant. When the samples returned to ambient temperature, they were placed into a container filled with deionized water (shown in Fig. 5a) under room pres-sure and temperature conditions. Their mass was measured every half an hour during the first 10 h of soaking and then once every hour using an electronic balance with a high precision to understand the time-dependent water absorp-tion process. This water absorption method is the same as that reported by Çobanoğlu et al. (2009), Wong and Jong (2014), and Zhou et al. (2016). The total time the four sam-ples were immersed was 2, 4, 6, and 8 days, respectively
(these samples are referred to as Sp#1, Sp#2, Sp#3, and Sp#4, respectively). Water absorption (wt) for a given time is defined here as “the mass of water absorbed by a material immersed in water at successive time intervals (i.e., the rate of water absorption), expressed as a percentage of the dry mass of the sample”, given as:
where Mt is the mass of the sample immersed in water at time t and M0 is the mass of the oven-dry sample.
3 Results
3.1 Water Absorption Test
The water absorption curves for the four red sandstone sam-ples are shown in Fig. 5b. It can be seen that a high rate of water absorption occurred in each sample during the initial stage of soaking (< 50 h), after which the water absorption
(1)wt=
(
Mt−M
0
)
∕M0× 100%
Table 1 Experimental scheme to test of the effect of water on the time-dependent deformation and long-term mechanical behavior of red sandstone
Experimental types Condition of experiments
UCS Dried specimens (Sp#Dry-UCS)Wet specimens (Sp#Wet-UCS) Pre-immersed in water for 2 days Pre-immersed in water for 4 days Pre-immersed in water for 6 days Pre-immersed in water for 8 days
Creep tests Dried specimen (Sp#Dry-Creep)Wet specimens (Sp#Wet-Creep) Pre-immersed in water for 2 days Pre-immersed in water for 4 days Pre-immersed in water for 6 days Pre-immersed in water for 8 days
Soaking specimens (Sp#Soaking-Creep) Dried specimens Pre-immersed in water for 2 days Pre-immersed in water for 4 days Pre-immersed in water for 6 days Pre-immersed in water for 8 days
0.0
0.5
1.0
1.5
2.0
2.5
3.0
3.5
0 25 50 75 100 125 150 175 200
Wat
er a
bsor
ptio
n, w
t(%
)
Time (h)
immersed 2d (Sp#1)
immersed 4d (Sp#2)
immersed 6d (Sp#3)
immersed 8d (Sp#4)
specimen water
(a)
(b)
Fig. 5 a Schematic illustration of the water absorption measurement with the sample completely immersed in water. b Water imbibition curves (water absorption as a function of time) for four samples of red sandstone immersed in water
S. B. Tang et al.
1 3
rate decreased with time. After about 4 days, the wet mass of the samples was at a near constant value, between ~ 3.34 and ~ 3.45%. Figure 5b also indicates that the water absorption for the four samples was approximately similar at any given time. For example, the water absorption for Sp#1-Sp#4 were, respectively, 2.4171, 2.6278, 2.5417, and 2.6553% when immersed in water for 24 h (Fig. 5b). The similarity in the water absorption curves for the four samples highlights that red sandstone is a relatively homogeneous rock. The final values of water absorption for the samples were 2.9741, 3.3440, 3.3672, and 3.5423% for samples Sp#1, Sp#2, Sp#3, and Sp#4, respectively (Fig. 5b).
3.2 Constant Stress Rate Experiments Under Dry Conditions
3.2.1 Constant Stress Rate Experiments on Dried Samples Under Dry Conditions
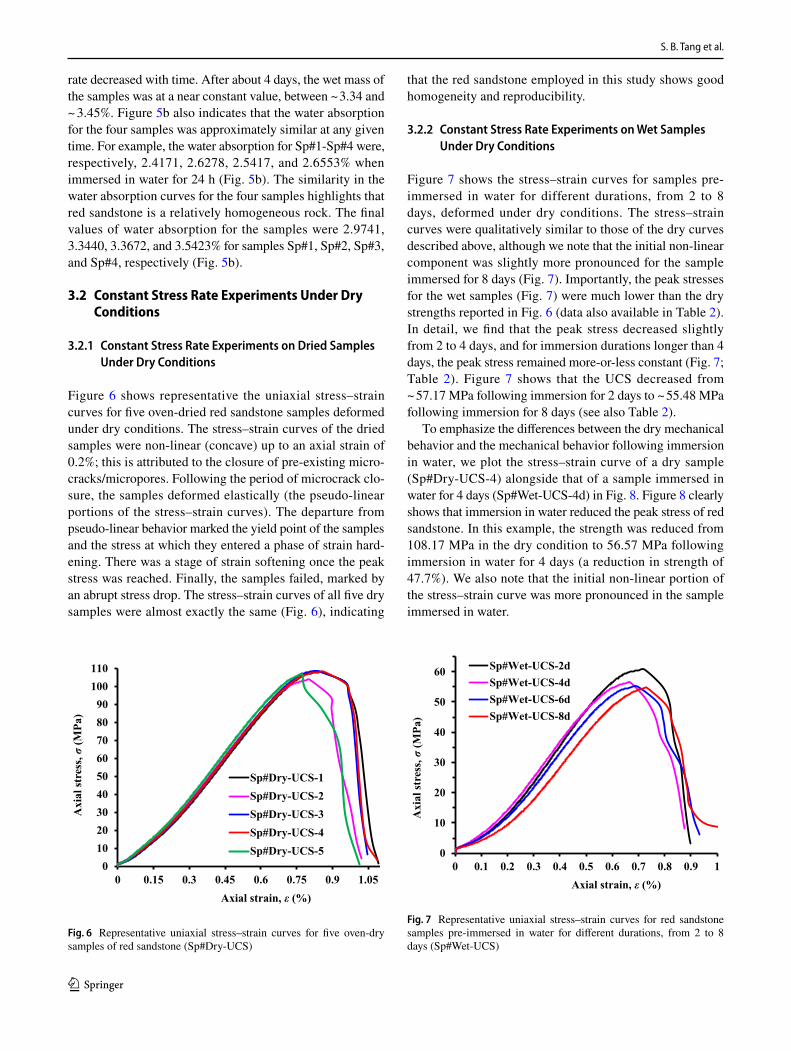
Figure 6 shows representative the uniaxial stress–strain curves for five oven-dried red sandstone samples deformed under dry conditions. The stress–strain curves of the dried samples were non-linear (concave) up to an axial strain of 0.2%; this is attributed to the closure of pre-existing micro-cracks/micropores. Following the period of microcrack clo-sure, the samples deformed elastically (the pseudo-linear portions of the stress–strain curves). The departure from pseudo-linear behavior marked the yield point of the samples and the stress at which they entered a phase of strain hard-ening. There was a stage of strain softening once the peak stress was reached. Finally, the samples failed, marked by an abrupt stress drop. The stress–strain curves of all five dry samples were almost exactly the same (Fig. 6), indicating
that the red sandstone employed in this study shows good homogeneity and reproducibility.
3.2.2 Constant Stress Rate Experiments on Wet Samples Under Dry Conditions
Figure 7 shows the stress–strain curves for samples pre-immersed in water for different durations, from 2 to 8 days, deformed under dry conditions. The stress–strain curves were qualitatively similar to those of the dry curves described above, although we note that the initial non-linear component was slightly more pronounced for the sample immersed for 8 days (Fig. 7). Importantly, the peak stresses for the wet samples (Fig. 7) were much lower than the dry strengths reported in Fig. 6 (data also available in Table 2). In detail, we find that the peak stress decreased slightly from 2 to 4 days, and for immersion durations longer than 4 days, the peak stress remained more-or-less constant (Fig. 7; Table 2). Figure 7 shows that the UCS decreased from ~ 57.17 MPa following immersion for 2 days to ~ 55.48 MPa following immersion for 8 days (see also Table 2).
To emphasize the differences between the dry mechanical behavior and the mechanical behavior following immersion in water, we plot the stress–strain curve of a dry sample (Sp#Dry-UCS-4) alongside that of a sample immersed in water for 4 days (Sp#Wet-UCS-4d) in Fig. 8. Figure 8 clearly shows that immersion in water reduced the peak stress of red sandstone. In this example, the strength was reduced from 108.17 MPa in the dry condition to 56.57 MPa following immersion in water for 4 days (a reduction in strength of 47.7%). We also note that the initial non-linear portion of the stress–strain curve was more pronounced in the sample immersed in water.
0102030405060708090
100110
0 0.15 0.3 0.45 0.6 0.75 0.9 1.05
Axi
al st
ress
, σ(M
Pa)
Axial strain, ε (%)
Sp#Dry-UCS-1Sp#Dry-UCS-2Sp#Dry-UCS-3Sp#Dry-UCS-4Sp#Dry-UCS-5
Fig. 6 Representative uniaxial stress–strain curves for five oven-dry samples of red sandstone (Sp#Dry-UCS)
0
10
20
30
40
50
60
0 0.1 0.2 0.3 0.4 0.5 0.6 0.7 0.8 0.9 1
Axi
al st
ress
, σ(M
Pa)
Axial strain, ε (%)
Sp#Wet-UCS-2dSp#Wet-UCS-4dSp#Wet-UCS-6dSp#Wet-UCS-8d
Fig. 7 Representative uniaxial stress–strain curves for red sandstone samples pre-immersed in water for different durations, from 2 to 8 days (Sp#Wet-UCS)

The Influence of Water Saturation on the Short- and Long-Term Mechanical Behavior of Red…
1 3
Figure 9a, b shows the relationships between UCS and Young’s modulus and water absorption, respectively. The results indicate that both the UCS and Young’s modulus decreased significantly as water absorption increased (up
to a maximum water absorption of ~ 3.5%). For example, the UCS and Young’s modulus of the sample with 3.595% water absorption were about 51.98 and 64.81% of the dried sample, respectively. Figure 9a shows that UCS is particu-larly sensitive to water absorption. For example, a modest increase in water content from 0.5 to 1.5% reduced the UCS from ~ 90 to ~ 70 MPa (Fig. 9a). The relationships between water absorption and UCS and Young’s modulus can be described by exponential equations (the R2 value is much closer to unity than for other fits, such as a power law) of the form:
where σc(wt) and E(wt) are the UCS (unit: MPa) and Young’s modulus (unit: GPa), wt is the water absorption (unit: %), a1,
(2)�c
(
wt
)
= a1e−b
1wt + c
1
(3)E(
wt
)
= a2e−b
2wt + c
2
Table 2 Uniaxial compressive strength and the elastic modulus for samples deformed following different durations immersed in water
Specimen number Time UCS/MPa Young’s modulus/GPa
Tested Average Tested Average
UCS-0-1 0.0 108.48 106.74 16.81 16.86UCS-0-2 103.81 16.65UCS-0-3 108.22 16.99UCS-0-4 108.17 16.82UCS-0-5 106.77 17.05UCS-1-1 1 h 85.49 85.80 13.99 14.04UCS-1-2 86.1 14.09UCS-4-1 4 h 75.41 74.16 13.6 13.68UCS-4-2 72.91 13.75UCS-2-1 2 days 55.76 58.96 10.96 11.64UCS-2-2 60.66 11.93UCS-2-3 60.46 12.02UCS-2-4UCS-4-1 4 days 55.66 55.31 11.23 11.35UCS-4-2 53.69 11.34UCS-4-3 56.57 11.48UCS-6-1 6 days 54.98 55.70 11.11 11.21UCS-6-2 55.43 11.45UCS-6-3 56.7 11.08UCS-8-1 8 days 53.59 55.48 10.79 10.93UCS-8-2 58.19 11.27UCS-8-3 54.66 10.73
0
20
40
60
80
100
0 0.1 0.2 0.3 0.4 0.5 0.6 0.7 0.8 0.9 1 1.1
Axi
al st
ress
, σ(M
Pa)
Axial strain, ε (%)
Sp#Dry-UCS-4
Sp#Wet-UCS-4d
Fig. 8 Uniaxial stress–strain curves for a dry sample and a sample pre-immersed in water for 4 days
40
50
60
70
80
90
100
110
-0.5 0 0.5 1 1.5 2 2.5 3 3.5 4
UC
S, σ
c(MPa
)
Water absorpton, wt(%)
σc=55.21exp(-0.7502wt)+51.6R2=97.55%
Experimental data
Fitted curve
10
11
12
13
14
15
16
17
-0.5 0 0.5 1 1.5 2 2.5 3 3.5 4
Youn
g's m
odul
us. E
(GPa
)
Water absorpton, wt(%)
E=6.183exp(-0.6847wt)+10.62R2=97.69%
Experimental data
Fitted curve
(b)
(a)
Fig. 9 Relationship between water absorption and a uniaxial com-pressive strength and b Young’s modulus of red sandstone. The scat-ter in these data is due to the natural variability of samples cored from the same block of material
S. B. Tang et al.
1 3
b1, and c1 are constants for the UCS relationship (Eq. (2)), and a2, b2, and c2 are constants for the Young’s modulus relationship (Eq. 3). The strength and Young’s modulus at zero water content are simply given by a1 + c1 and a2 + c2, and the strength and Young’s modulus following prolonged immersion in water are c1 and c2, respectively. The param-eters b1 and b2 are dimensionless constants defining the rate of strength and Young’s modulus loss with increasing water absorption. The determined constants of a1, b1, and c1 are 55.21, − 0.7502, and 51.6, respectively, and the constants a2, b2, and c2 are 6.183, − 0.6847, and 10.62, respectively. The parameters b1 and b2 characterize the sensitivity of UCS and Young’s modulus, respectively, to the level of water absorption.
3.3 Brittle Creep Experiments Under Dry Conditions
3.3.1 Brittle Creep Experiments on Dried Samples Under Dry Conditions
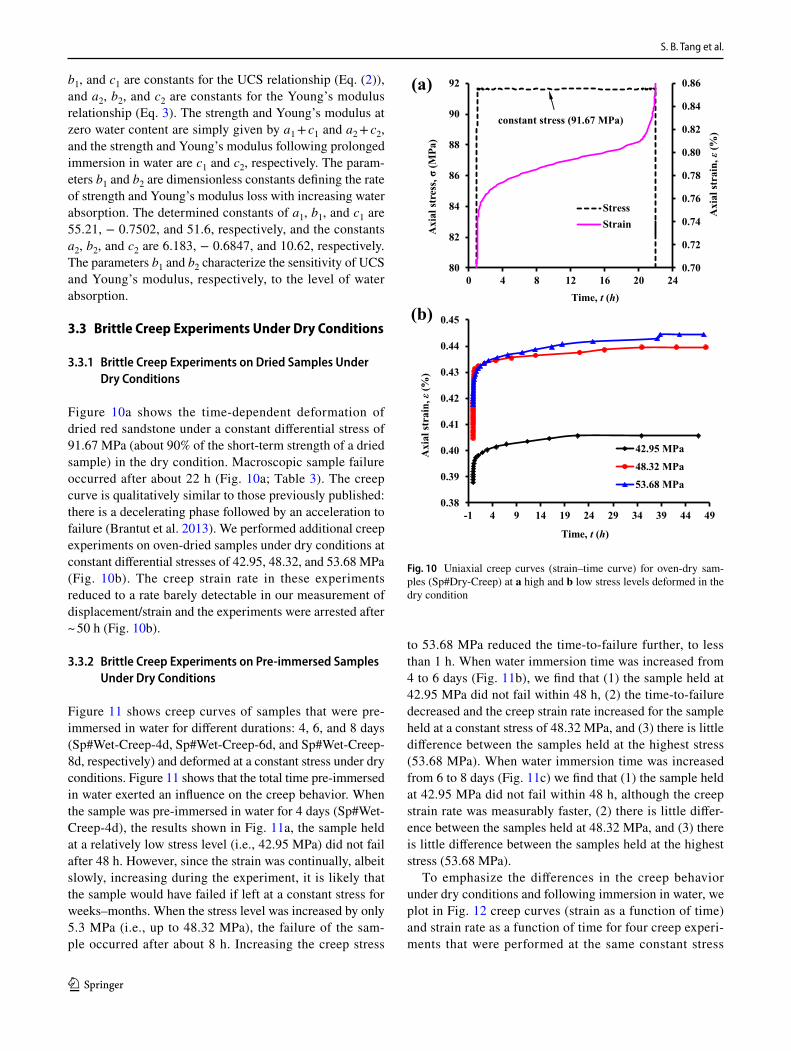
Figure 10a shows the time-dependent deformation of dried red sandstone under a constant differential stress of 91.67 MPa (about 90% of the short-term strength of a dried sample) in the dry condition. Macroscopic sample failure occurred after about 22 h (Fig. 10a; Table 3). The creep curve is qualitatively similar to those previously published: there is a decelerating phase followed by an acceleration to failure (Brantut et al. 2013). We performed additional creep experiments on oven-dried samples under dry conditions at constant differential stresses of 42.95, 48.32, and 53.68 MPa (Fig. 10b). The creep strain rate in these experiments reduced to a rate barely detectable in our measurement of displacement/strain and the experiments were arrested after ~ 50 h (Fig. 10b).
3.3.2 Brittle Creep Experiments on Pre-immersed Samples Under Dry Conditions
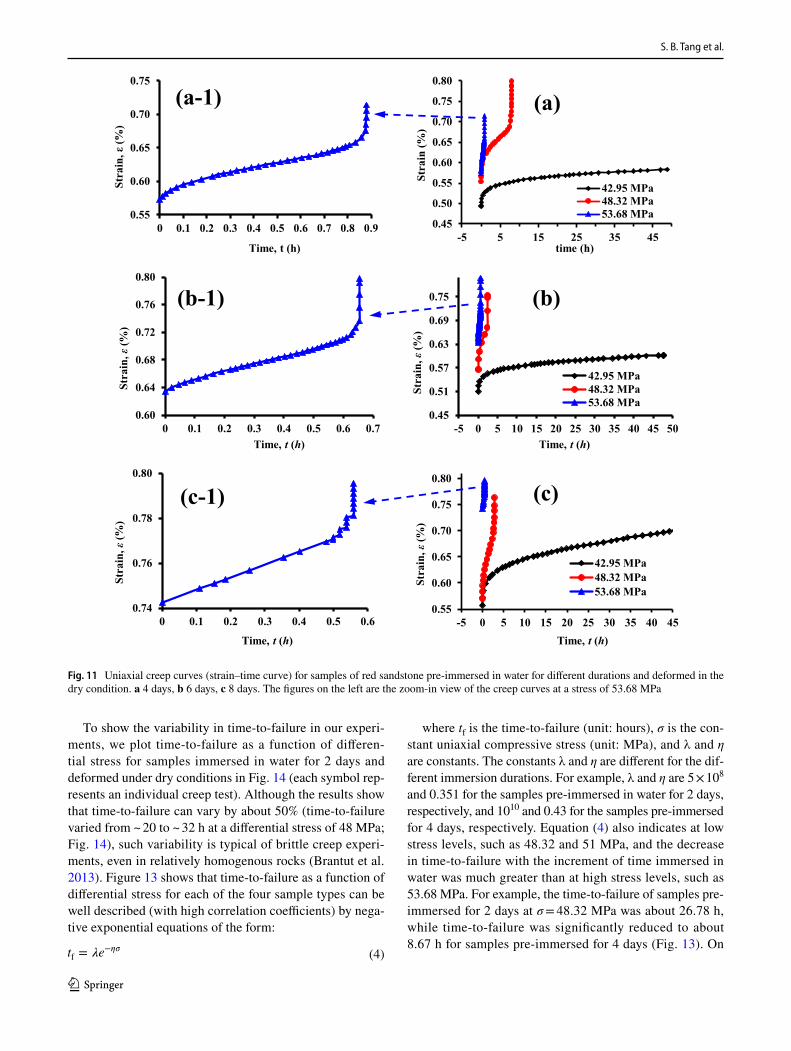
Figure 11 shows creep curves of samples that were pre-immersed in water for different durations: 4, 6, and 8 days (Sp#Wet-Creep-4d, Sp#Wet-Creep-6d, and Sp#Wet-Creep-8d, respectively) and deformed at a constant stress under dry conditions. Figure 11 shows that the total time pre-immersed in water exerted an influence on the creep behavior. When the sample was pre-immersed in water for 4 days (Sp#Wet-Creep-4d), the results shown in Fig. 11a, the sample held at a relatively low stress level (i.e., 42.95 MPa) did not fail after 48 h. However, since the strain was continually, albeit slowly, increasing during the experiment, it is likely that the sample would have failed if left at a constant stress for weeks–months. When the stress level was increased by only 5.3 MPa (i.e., up to 48.32 MPa), the failure of the sam-ple occurred after about 8 h. Increasing the creep stress
to 53.68 MPa reduced the time-to-failure further, to less than 1 h. When water immersion time was increased from 4 to 6 days (Fig. 11b), we find that (1) the sample held at 42.95 MPa did not fail within 48 h, (2) the time-to-failure decreased and the creep strain rate increased for the sample held at a constant stress of 48.32 MPa, and (3) there is little difference between the samples held at the highest stress (53.68 MPa). When water immersion time was increased from 6 to 8 days (Fig. 11c) we find that (1) the sample held at 42.95 MPa did not fail within 48 h, although the creep strain rate was measurably faster, (2) there is little differ-ence between the samples held at 48.32 MPa, and (3) there is little difference between the samples held at the highest stress (53.68 MPa).
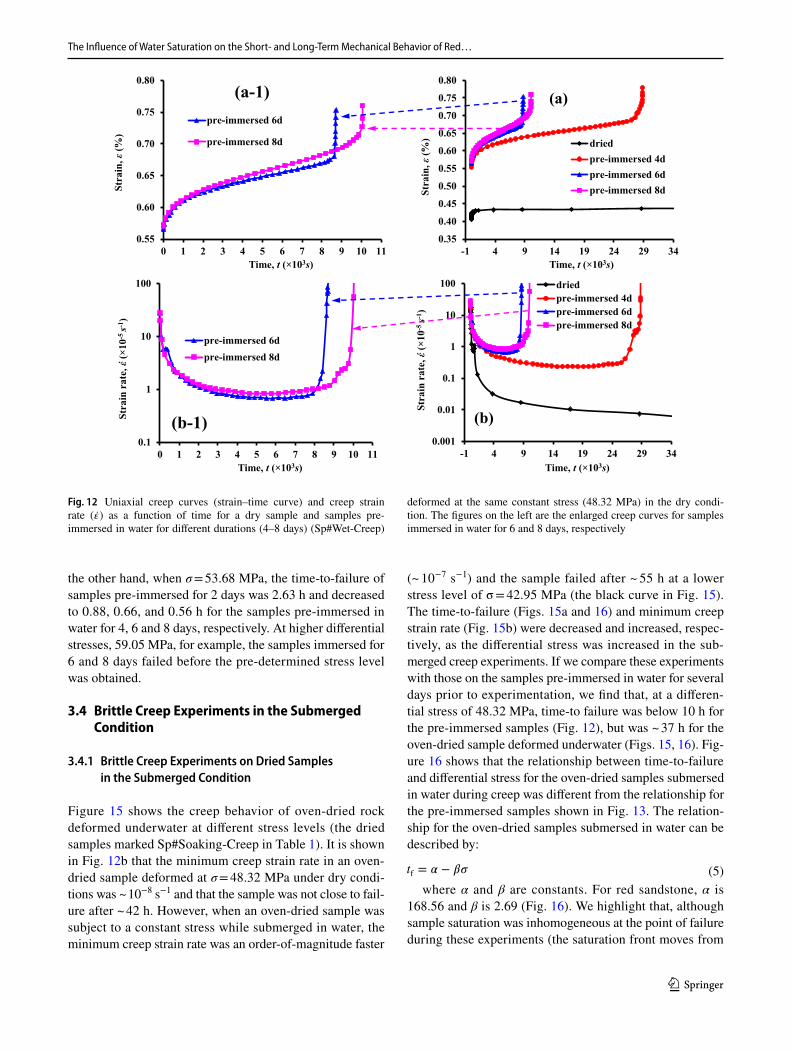
To emphasize the differences in the creep behavior under dry conditions and following immersion in water, we plot in Fig. 12 creep curves (strain as a function of time) and strain rate as a function of time for four creep experi-ments that were performed at the same constant stress
0.70
0.72
0.74
0.76
0.78
0.80
0.82
0.84
0.86
80
82
84
86
88
90
92
0 4 8 12 16 20 24
Axi
al st
rain
, ε(%
)
Axi
al st
ress
, σ(M
Pa)
Time, t (h)
StressStrain
constant stress (91.67 MPa)
(a)
0.38
0.39
0.40
0.41
0.42
0.43
0.44
0.45
-1 4 9 14 19 24 29 34 39 44 49
Axi
al st
rain
, ε(%
)
Time, t (h)
42.95 MPa
48.32 MPa
53.68 MPa
(b)
Fig. 10 Uniaxial creep curves (strain–time curve) for oven-dry sam-ples (Sp#Dry-Creep) at a high and b low stress levels deformed in the dry condition
The Influence of Water Saturation on the Short- and Long-Term Mechanical Behavior of Red…
1 3
(48.32 MPa). The data plotted in Fig. 12 are for an oven-dry sample and for samples immersed in water for 4, 6, and 8 days. We also plot the time-to-failure for experiments performed at different constant stresses on oven-dry sam-ples and samples pre-immersed in water in Fig. 13 (each symbol represents the average of three samples). Fig-ure 13a includes all the data, while Fig. 13b only shows the data in the red dashed square in Fig. 13a to more clearly show the trend of the data. We first highlight the substan-tial difference between the creep behavior in the dry state and following immersion in water (Figs. 12, 13). Time-to-failure (Fig. 13) and the minimum creep strain rate
(Fig. 12b) decreased and increased dramatically, respec-tively, following immersion in water (when compared to the dry state). We also find that time-to-failure and the minimum creep strain rate were decreased and increased, respectively, when the immersion time increased from 4 to 6 days, but there was little to no change in the creep behavior between the samples immersed for 6 and 8 days (Figs. 12, 13). The strain rate curves as a function of time (Fig. 12b) show that the creep strain rate during the experi-ments was never constant: it first decreased to a minimum and then increased (as observed previously in creep exper-iments on sandstone, see Brantut et al. 2014a).
Table 3 Creep stress and time-to-failure for the creep experiments (dry, wet, and “soaking”) performed for this study
Creep test condition Pre-immersed time (day)
Creep stress (MPa)
Time-to-failure (h)
Dry condition (Sp#Dry-Creep) 0 91.67 21.945Wet condition (Sp#Wet-Creep) 2 48.32 26.777
51.00 7.80253.68 2.63256.37 1.06259.05 0.655
4 48.32 8.86851.00 3.12453.68 0.883
6 48.32 4.07851.00 1.05653.68 0.656
8 48.32 3.67451.00 0.87553.68 0.559
Soaking condition (Sp#Soaking-Creep) 0 42.95 55.34848.32 36.22451.00 30.28153.68 22.77959.05 11.678
2 42.95 48.68248.32 15.99051.00 4.32553.68 1.176
4 42.95 31.44548.32 3.84251.00 1.77853.68 0.109
6 42.95 17.78948.32 1.08651.00 0.38553.68 0.056
8 42.95 16.60848.32 0.57651.00 0.24353.68 0.059
S. B. Tang et al.
1 3
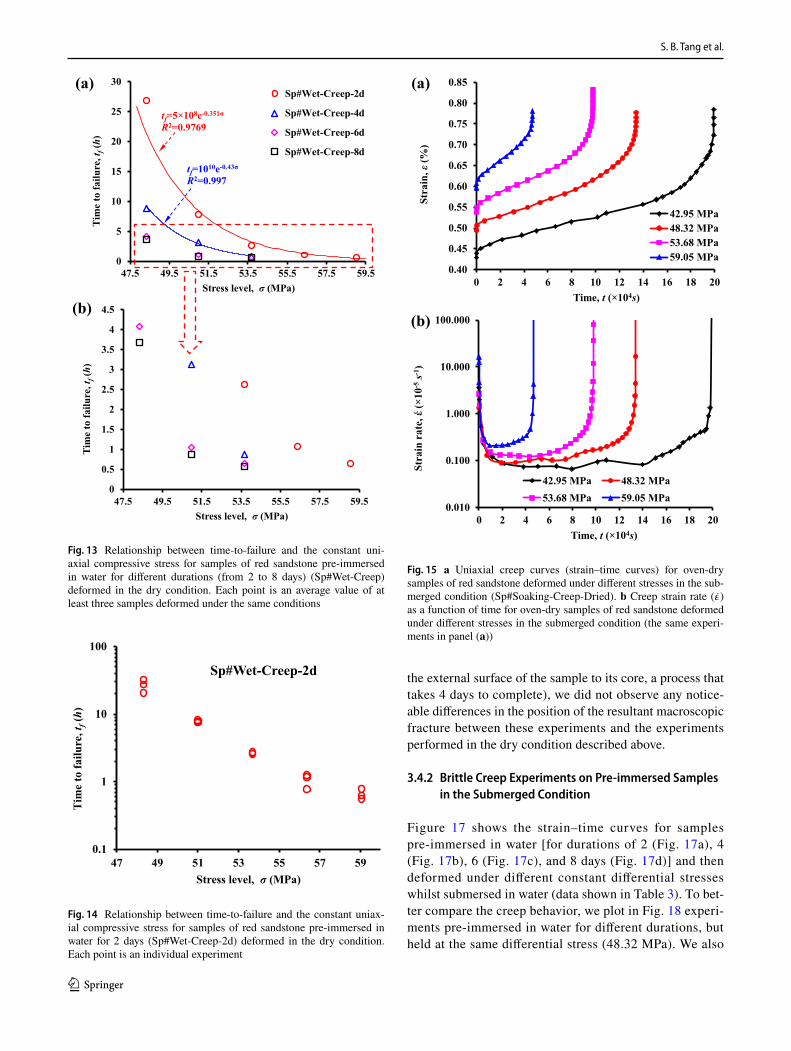
To show the variability in time-to-failure in our experi-ments, we plot time-to-failure as a function of differen-tial stress for samples immersed in water for 2 days and deformed under dry conditions in Fig. 14 (each symbol rep-resents an individual creep test). Although the results show that time-to-failure can vary by about 50% (time-to-failure varied from ~ 20 to ~ 32 h at a differential stress of 48 MPa; Fig. 14), such variability is typical of brittle creep experi-ments, even in relatively homogenous rocks (Brantut et al. 2013). Figure 13 shows that time-to-failure as a function of differential stress for each of the four sample types can be well described (with high correlation coefficients) by nega-tive exponential equations of the form:
(4)tf= �e−��
where tf is the time-to-failure (unit: hours), σ is the con-stant uniaxial compressive stress (unit: MPa), and λ and η are constants. The constants λ and η are different for the dif-ferent immersion durations. For example, λ and η are 5 × 10⁸ and 0.351 for the samples pre-immersed in water for 2 days, respectively, and 1010 and 0.43 for the samples pre-immersed for 4 days, respectively. Equation (4) also indicates at low stress levels, such as 48.32 and 51 MPa, and the decrease in time-to-failure with the increment of time immersed in water was much greater than at high stress levels, such as 53.68 MPa. For example, the time-to-failure of samples pre-immersed for 2 days at σ = 48.32 MPa was about 26.78 h, while time-to-failure was significantly reduced to about 8.67 h for samples pre-immersed for 4 days (Fig. 13). On
0.55
0.60
0.65
0.70
0.75
0 0.1 0.2 0.3 0.4 0.5 0.6 0.7 0.8 0.9
Stra
in, ε
(%)
Time, t (h)
(a-1)
0.45
0.50
0.55
0.60
0.65
0.70
0.75
0.80
-5 5 15 25 35 45
Stra
in (%
)
time (h)
(a)
42.95 MPa48.32 MPa53.68 MPa
0.60
0.64
0.68
0.72
0.76
0.80
0 0.1 0.2 0.3 0.4 0.5 0.6 0.7
Stra
in,ε
(%)
Time, t (h)
(b-1)
0.45
0.51
0.57
0.63
0.69
0.75
-5 0 5 10 15 20 25 30 35 40 45 50St
rain
,ε(%
)
Time, t (h)
(b)
42.95 MPa48.32 MPa53.68 MPa
0.74
0.76
0.78
0.80
0 0.1 0.2 0.3 0.4 0.5 0.6
Stra
in, ε
(%)
Time, t (h)
(c-1)
0.55
0.60
0.65
0.70
0.75
0.80
-5 0 5 10 15 20 25 30 35 40 45
Stra
in, ε
(%)
Time, t (h)
(c)
42.95 MPa48.32 MPa53.68 MPa
Fig. 11 Uniaxial creep curves (strain–time curve) for samples of red sandstone pre-immersed in water for different durations and deformed in the dry condition. a 4 days, b 6 days, c 8 days. The figures on the left are the zoom-in view of the creep curves at a stress of 53.68 MPa
The Influence of Water Saturation on the Short- and Long-Term Mechanical Behavior of Red…
1 3
the other hand, when σ = 53.68 MPa, the time-to-failure of samples pre-immersed for 2 days was 2.63 h and decreased to 0.88, 0.66, and 0.56 h for the samples pre-immersed in water for 4, 6 and 8 days, respectively. At higher differential stresses, 59.05 MPa, for example, the samples immersed for 6 and 8 days failed before the pre-determined stress level was obtained.
3.4 Brittle Creep Experiments in the Submerged Condition
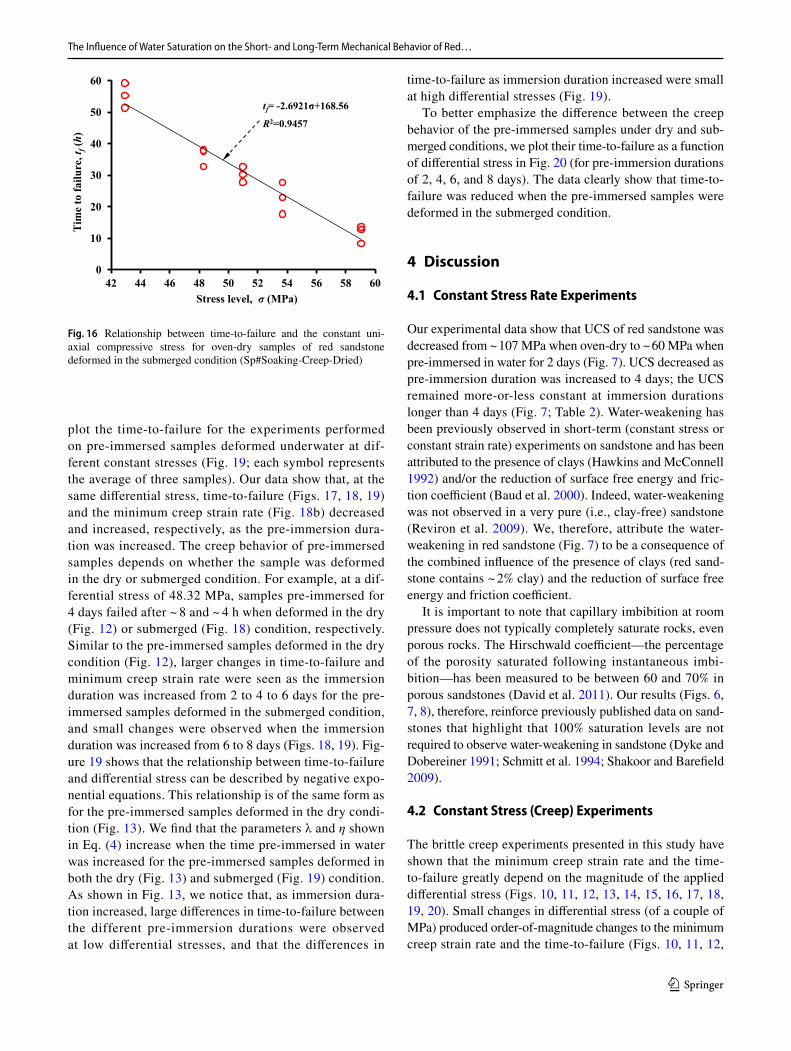
3.4.1 Brittle Creep Experiments on Dried Samples in the Submerged Condition
Figure 15 shows the creep behavior of oven-dried rock deformed underwater at different stress levels (the dried samples marked Sp#Soaking-Creep in Table 1). It is shown in Fig. 12b that the minimum creep strain rate in an oven-dried sample deformed at σ = 48.32 MPa under dry condi-tions was ~ 10−8 s−1 and that the sample was not close to fail-ure after ~ 42 h. However, when an oven-dried sample was subject to a constant stress while submerged in water, the minimum creep strain rate was an order-of-magnitude faster
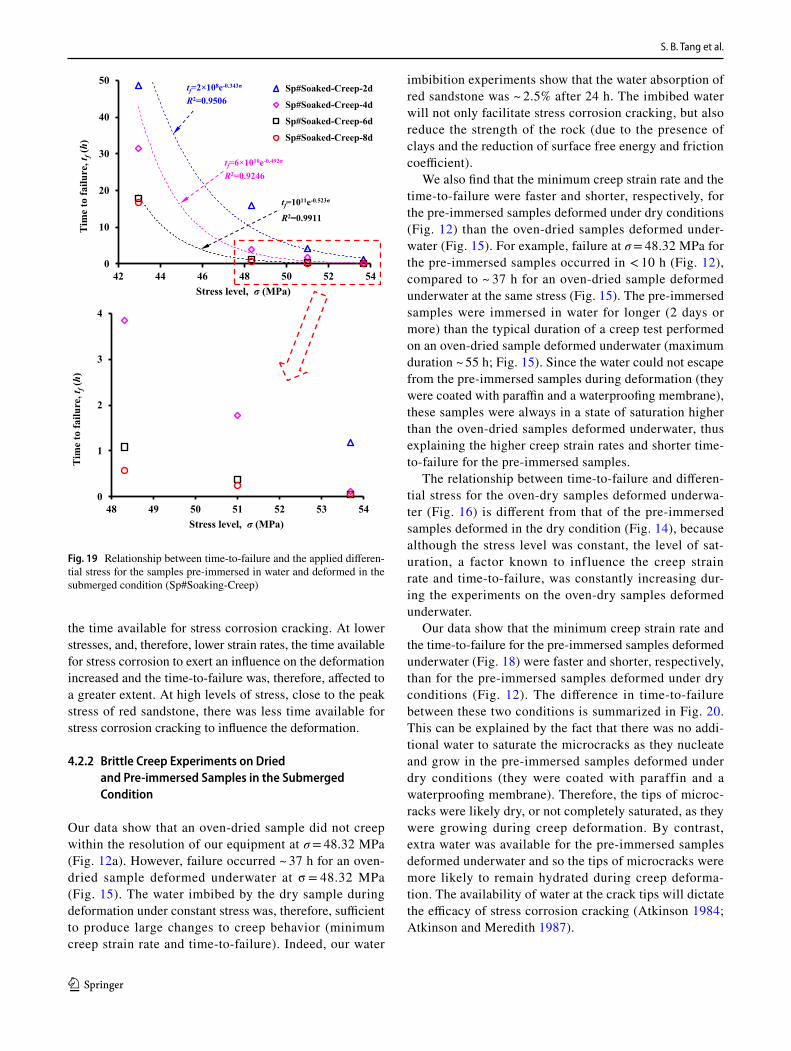
(~ 10−7 s−1) and the sample failed after ~ 55 h at a lower stress level of σ = 42.95 MPa (the black curve in Fig. 15). The time-to-failure (Figs. 15a and 16) and minimum creep strain rate (Fig. 15b) were decreased and increased, respec-tively, as the differential stress was increased in the sub-merged creep experiments. If we compare these experiments with those on the samples pre-immersed in water for several days prior to experimentation, we find that, at a differen-tial stress of 48.32 MPa, time-to failure was below 10 h for the pre-immersed samples (Fig. 12), but was ~ 37 h for the oven-dried sample deformed underwater (Figs. 15, 16). Fig-ure 16 shows that the relationship between time-to-failure and differential stress for the oven-dried samples submersed in water during creep was different from the relationship for the pre-immersed samples shown in Fig. 13. The relation-ship for the oven-dried samples submersed in water can be described by:
where α and β are constants. For red sandstone, α is 168.56 and β is 2.69 (Fig. 16). We highlight that, although sample saturation was inhomogeneous at the point of failure during these experiments (the saturation front moves from
(5)tf= � − ��
0.55
0.60
0.65
0.70
0.75
0.80
0 1 2 3 4 5 6 7 8 9 10 11
Stra
in, ε
(%)
Time, t (×103s)
(a-1)pre-immersed 6d
pre-immersed 8d
0.35
0.40
0.45
0.50
0.55
0.60
0.65
0.70
0.75
0.80
-1 4 9 14 19 24 29 34
Stra
in, ε
(%)
Time, t (×103s)
(a)
driedpre-immersed 4dpre-immersed 6dpre-immersed 8d
0.1
1
10
100
0 1 2 3 4 5 6 7 8 9 10 11
Stra
in r
ate,έ(
× 10-5
s-1)
Time, t (×103s)
(b-1)
pre-immersed 6dpre-immersed 8d
0.001
0.01
0.1
1
10
100
-1 4 9 14 19 24 29 34
Stra
in r
ate,
έ(×
10-5s-1
)
Time, t (×103s)
(b)
driedpre-immersed 4dpre-immersed 6dpre-immersed 8d
Fig. 12 Uniaxial creep curves (strain–time curve) and creep strain rate ( �̇� ) as a function of time for a dry sample and samples pre-immersed in water for different durations (4–8 days) (Sp#Wet-Creep)
deformed at the same constant stress (48.32 MPa) in the dry condi-tion. The figures on the left are the enlarged creep curves for samples immersed in water for 6 and 8 days, respectively
S. B. Tang et al.
1 3
the external surface of the sample to its core, a process that takes 4 days to complete), we did not observe any notice-able differences in the position of the resultant macroscopic fracture between these experiments and the experiments performed in the dry condition described above.
3.4.2 Brittle Creep Experiments on Pre-immersed Samples in the Submerged Condition
Figure 17 shows the strain–time curves for samples pre-immersed in water [for durations of 2 (Fig. 17a), 4 (Fig. 17b), 6 (Fig. 17c), and 8 days (Fig. 17d)] and then deformed under different constant differential stresses whilst submersed in water (data shown in Table 3). To bet-ter compare the creep behavior, we plot in Fig. 18 experi-ments pre-immersed in water for different durations, but held at the same differential stress (48.32 MPa). We also
0
5
10
15
20
25
30
47.5 49.5 51.5 53.5 55.5 57.5 59.5
Tim
e to
failu
re, t
f(h
)
Stress level, σ (MPa)
Sp#Wet-Creep-2d
Sp#Wet-Creep-4d
Sp#Wet-Creep-6d
Sp#Wet-Creep-8d
tf=5×10⁸e-0.351σ
R2=0.9769
tf=1010e-0.43σ
R2=0.997
(a)
0
0.5
1
1.5
2
2.5
3
3.5
4
4.5
47.5 49.5 51.5 53.5 55.5 57.5 59.5
Tim
e to
failu
re, t
f(h
)
Stress level, σ (MPa)
(b)
Fig. 13 Relationship between time-to-failure and the constant uni-axial compressive stress for samples of red sandstone pre-immersed in water for different durations (from 2 to 8 days) (Sp#Wet-Creep) deformed in the dry condition. Each point is an average value of at least three samples deformed under the same conditions
0.1
1
10
100
47 49 51 53 55 57 59
Tim
e to
failu
re, t
f(h
)
Stress level, σ (MPa)
Sp#Wet-Creep-2d
Fig. 14 Relationship between time-to-failure and the constant uniax-ial compressive stress for samples of red sandstone pre-immersed in water for 2 days (Sp#Wet-Creep-2d) deformed in the dry condition. Each point is an individual experiment
0.40
0.45
0.50
0.55
0.60
0.65
0.70
0.75
0.80
0.85
0 2 4 6 8 10 12 14 16 18 20
Stra
in, ε
(%)
Time, t (×104s)
(a)
42.95 MPa48.32 MPa53.68 MPa59.05 MPa
0.010
0.100
1.000
10.000
100.000
0 2 4 6 8 10 12 14 16 18 20
Stra
in r
ate,
έ(×
10-5s-1
)
Time, t (×104s)
(b)
42.95 MPa 48.32 MPa53.68 MPa 59.05 MPa
Fig. 15 a Uniaxial creep curves (strain–time curves) for oven-dry samples of red sandstone deformed under different stresses in the sub-merged condition (Sp#Soaking-Creep-Dried). b Creep strain rate ( �̇� ) as a function of time for oven-dry samples of red sandstone deformed under different stresses in the submerged condition (the same experi-ments in panel (a))
The Influence of Water Saturation on the Short- and Long-Term Mechanical Behavior of Red…
1 3
plot the time-to-failure for the experiments performed on pre-immersed samples deformed underwater at dif-ferent constant stresses (Fig. 19; each symbol represents the average of three samples). Our data show that, at the same differential stress, time-to-failure (Figs. 17, 18, 19) and the minimum creep strain rate (Fig. 18b) decreased and increased, respectively, as the pre-immersion dura-tion was increased. The creep behavior of pre-immersed samples depends on whether the sample was deformed in the dry or submerged condition. For example, at a dif-ferential stress of 48.32 MPa, samples pre-immersed for 4 days failed after ~ 8 and ~ 4 h when deformed in the dry (Fig. 12) or submerged (Fig. 18) condition, respectively. Similar to the pre-immersed samples deformed in the dry condition (Fig. 12), larger changes in time-to-failure and minimum creep strain rate were seen as the immersion duration was increased from 2 to 4 to 6 days for the pre-immersed samples deformed in the submerged condition, and small changes were observed when the immersion duration was increased from 6 to 8 days (Figs. 18, 19). Fig-ure 19 shows that the relationship between time-to-failure and differential stress can be described by negative expo-nential equations. This relationship is of the same form as for the pre-immersed samples deformed in the dry condi-tion (Fig. 13). We find that the parameters λ and η shown in Eq. (4) increase when the time pre-immersed in water was increased for the pre-immersed samples deformed in both the dry (Fig. 13) and submerged (Fig. 19) condition. As shown in Fig. 13, we notice that, as immersion dura-tion increased, large differences in time-to-failure between the different pre-immersion durations were observed at low differential stresses, and that the differences in
time-to-failure as immersion duration increased were small at high differential stresses (Fig. 19).
To better emphasize the difference between the creep behavior of the pre-immersed samples under dry and sub-merged conditions, we plot their time-to-failure as a function of differential stress in Fig. 20 (for pre-immersion durations of 2, 4, 6, and 8 days). The data clearly show that time-to-failure was reduced when the pre-immersed samples were deformed in the submerged condition.
4 Discussion
4.1 Constant Stress Rate Experiments
Our experimental data show that UCS of red sandstone was decreased from ~ 107 MPa when oven-dry to ~ 60 MPa when pre-immersed in water for 2 days (Fig. 7). UCS decreased as pre-immersion duration was increased to 4 days; the UCS remained more-or-less constant at immersion durations longer than 4 days (Fig. 7; Table 2). Water-weakening has been previously observed in short-term (constant stress or constant strain rate) experiments on sandstone and has been attributed to the presence of clays (Hawkins and McConnell 1992) and/or the reduction of surface free energy and fric-tion coefficient (Baud et al. 2000). Indeed, water-weakening was not observed in a very pure (i.e., clay-free) sandstone (Reviron et al. 2009). We, therefore, attribute the water-weakening in red sandstone (Fig. 7) to be a consequence of the combined influence of the presence of clays (red sand-stone contains ~ 2% clay) and the reduction of surface free energy and friction coefficient.
It is important to note that capillary imbibition at room pressure does not typically completely saturate rocks, even porous rocks. The Hirschwald coefficient—the percentage of the porosity saturated following instantaneous imbi-bition—has been measured to be between 60 and 70% in porous sandstones (David et al. 2011). Our results (Figs. 6, 7, 8), therefore, reinforce previously published data on sand-stones that highlight that 100% saturation levels are not required to observe water-weakening in sandstone (Dyke and Dobereiner 1991; Schmitt et al. 1994; Shakoor and Barefield 2009).
4.2 Constant Stress (Creep) Experiments
The brittle creep experiments presented in this study have shown that the minimum creep strain rate and the time-to-failure greatly depend on the magnitude of the applied differential stress (Figs. 10, 11, 12, 13, 14, 15, 16, 17, 18, 19, 20). Small changes in differential stress (of a couple of MPa) produced order-of-magnitude changes to the minimum creep strain rate and the time-to-failure (Figs. 10, 11, 12,
0
10
20
30
40
50
60
42 44 46 48 50 52 54 56 58 60
Tim
e to
failu
re, t
f(h
)
Stress level, σ (MPa)
tf= -2.6921σ+168.56
R2=0.9457
Fig. 16 Relationship between time-to-failure and the constant uni-axial compressive stress for oven-dry samples of red sandstone deformed in the submerged condition (Sp#Soaking-Creep-Dried)

S. B. Tang et al.
1 3
0.65
0.70
0.75
0.80
0.85
0.90
0 0.2 0.4 0.6 0.8 1 1.2
Stra
in, ε
(%)
Time, t (h)
(a-1)
0.40
0.50
0.60
0.70
0.80
0.90
0 10 20 30 40 50
Stra
in, ε
(%)
Time, t (h)
(a)
42.95 MPa48.32 MPa53.68 MPa
0.75
0.77
0.79
0.81
0.83
0.85
0 0.02 0.04 0.06 0.08 0.1 0.12
Stra
in, ε
(%)
Time, t (h)
(b-1)
0.55
0.60
0.65
0.70
0.75
0.80
0.85
0.90
0 5 10 15 20 25 30 35
Stra
in, ε
(%)
Time, t (h)
(b)
42.95 MPa48.32 MPa53.68 MPa
0.80
0.85
0.90
0.95
0 0.01 0.02 0.03 0.04 0.05 0.06
Stra
in, ε
(%)
Time, t (h)
(c-1)
0.550.600.650.700.750.800.850.900.95
0 3 6 9 12 15 18
Stra
in, ε
(%)
Time, t (h)
(c)
42.95 MPa48.32 MPa53.68 MPa
0.72
0.74
0.76
0.78
0.80
0.82
0.84
0 0.01 0.02 0.03 0.04 0.05 0.06
Stra
in, ε
(%)
Time, t (h)
(d-1)
0.55
0.60
0.65
0.70
0.75
0.80
0.85
0 3 6 9 12 15 18
Stra
in, ε
(%)
Time, t (h)
(d)
42.95 MPa48.32 MPa53.68 MPa
Fig. 17 Uniaxial creep curves (strain–time curves) for samples of red sandstone pre-immersed in water for different durations [for 2 (a), 4 (b), 6 (c), and 8 (d) days] under different differential stresses in the
submerged condition (Sp#Soaking-Creep). The figures on the left are the enlarged creep curves at a stress level of 53.68 MPa

The Influence of Water Saturation on the Short- and Long-Term Mechanical Behavior of Red…
1 3
13, 14, 15, 16, 17, 18, 19, 20), as observed previously in creep experiments on porous sandstones (Baud and Meredith 1997; Ngwenya et al. 2001; Heap et al. 2009a, b; Brantut et al. 2014a; Tang et al. 2018).
4.2.1 Brittle Creep Experiments on Dried and Pre-immersed Samples Under Dry Conditions
Our creep experiments under dry conditions highlight that pre-immersion in water (for even a couple of days) signifi-cantly decreased time-to-failure and significantly increased the minimum creep strain rate when compared to the dry state (Figs. 10, 11, 12), as observed previously in creep experiments on granite (Kranz et al. 1982) and thermally-shocked glass (Mallet et al. 2015). Stress corrosion crack-ing describes rock–fluid interactions that occur between the strained atomic bonds at the crack tips and a chemically active pore fluid (Atkinson 1984; Atkinson and Meredith 1987; Brantut et al. 2013). It follows, therefore, that the rate of stress corrosion cracking, and, therefore, the rate of brit-tle creep, increases in the presence of water. Indeed, the rate of subcritical crack growth in sandstone has been observed
to increase with relative humidity in double-torsion experi-ments (Nara et al. 2011).
In the experiments performed under dry conditions, the time-to-failure and minimum creep strain rate decreased and increased, respectively, as pre-immersion duration increased from 4 to 6 days (Fig. 12). As explained above, we propose that low-volume microcracks and micropores were still in the process of saturation beyond 4 days. Since stress corro-sion cracking describes rock–fluid interactions at the crack tip, it stands to reason that additional microcrack and crack tip saturation would increase the rate of stress corrosion cracking, and, therefore, the rate of brittle creep. The simi-larity in time-to-failure and minimum creep strain rate in the samples pre-immersed for 6 and 8 days (Fig. 12) suggest that the water imbibition process was complete, or close to completion, after 6 days.
The observed difference between time-to-failure at dif-ferent differential stresses in the samples pre-immersed to different durations (i.e., small differences in time-to-failure are observed between samples pre-immersed to 2 and 8 days at high levels of stress, and large differences are seen at low stress levels; Fig. 13) can be explained by the difference in
0.60
0.65
0.70
0.75
0.80
0.85
0.90
0 0.3 0.6 0.9 1.2 1.5
Stra
in, ε
(%)
Time, t (×104s)
(a-1)immersed 4d
immersed 6d
immersed 8d
0.50
0.55
0.60
0.65
0.70
0.75
0.80
0.85
0.90
0 2 4 6 8 10 12 14
Stra
in, ε
(%)
Time, t (×104s)
(a)Driedimmersed 2dimmersed 4dimmersed 6dimmersed 8d
0.1
1
10
100
0 0.3 0.6 0.9 1.2 1.5
Stra
in r
ate,
έ(×
10-5s-1
)
Time, t (×104s)
(b-1)
immersed 4d
immersed 6d
immersed 8d
0.01
0.1
1
10
100
0 2 4 6 8 10 12 14
Stra
in r
ate,
έ(×
10-5s-1
)
Time, t (×104s)
(b)Driedimmersed 2dimmersed 4dimmersed 6dimmersed 8d
Fig. 18 a Uniaxial creep curves (strain–time curves) for samples of red sandstone pre-immersed in water for different durations deformed under a differential stress of 48.32 MPa in the submerged condition (Sp#Soaking-Creep). b Creep strain rate ( �̇� ) as a function of time for
samples of red sandstone pre-immersed in water for different dura-tions deformed under a differential stress of 48.32 MPa in the sub-merged condition (Sp#Soking-Creep) [the same experiments in panel (a)]
S. B. Tang et al.
1 3
the time available for stress corrosion cracking. At lower stresses, and, therefore, lower strain rates, the time available for stress corrosion to exert an influence on the deformation increased and the time-to-failure was, therefore, affected to a greater extent. At high levels of stress, close to the peak stress of red sandstone, there was less time available for stress corrosion cracking to influence the deformation.
4.2.2 Brittle Creep Experiments on Dried and Pre-immersed Samples in the Submerged Condition
Our data show that an oven-dried sample did not creep within the resolution of our equipment at σ = 48.32 MPa (Fig. 12a). However, failure occurred ~ 37 h for an oven-dried sample deformed underwater at σ = 48.32 MPa (Fig. 15). The water imbibed by the dry sample during deformation under constant stress was, therefore, sufficient to produce large changes to creep behavior (minimum creep strain rate and time-to-failure). Indeed, our water
imbibition experiments show that the water absorption of red sandstone was ~ 2.5% after 24 h. The imbibed water will not only facilitate stress corrosion cracking, but also reduce the strength of the rock (due to the presence of clays and the reduction of surface free energy and friction coefficient).
We also find that the minimum creep strain rate and the time-to-failure were faster and shorter, respectively, for the pre-immersed samples deformed under dry conditions (Fig. 12) than the oven-dried samples deformed under-water (Fig. 15). For example, failure at σ = 48.32 MPa for the pre-immersed samples occurred in < 10 h (Fig. 12), compared to ~ 37 h for an oven-dried sample deformed underwater at the same stress (Fig. 15). The pre-immersed samples were immersed in water for longer (2 days or more) than the typical duration of a creep test performed on an oven-dried sample deformed underwater (maximum duration ~ 55 h; Fig. 15). Since the water could not escape from the pre-immersed samples during deformation (they were coated with paraffin and a waterproofing membrane), these samples were always in a state of saturation higher than the oven-dried samples deformed underwater, thus explaining the higher creep strain rates and shorter time-to-failure for the pre-immersed samples.
The relationship between time-to-failure and differen-tial stress for the oven-dry samples deformed underwa-ter (Fig. 16) is different from that of the pre-immersed samples deformed in the dry condition (Fig. 14), because although the stress level was constant, the level of sat-uration, a factor known to influence the creep strain rate and time-to-failure, was constantly increasing dur-ing the experiments on the oven-dry samples deformed underwater.
Our data show that the minimum creep strain rate and the time-to-failure for the pre-immersed samples deformed underwater (Fig. 18) were faster and shorter, respectively, than for the pre-immersed samples deformed under dry conditions (Fig. 12). The difference in time-to-failure between these two conditions is summarized in Fig. 20. This can be explained by the fact that there was no addi-tional water to saturate the microcracks as they nucleate and grow in the pre-immersed samples deformed under dry conditions (they were coated with paraffin and a waterproofing membrane). Therefore, the tips of microc-racks were likely dry, or not completely saturated, as they were growing during creep deformation. By contrast, extra water was available for the pre-immersed samples deformed underwater and so the tips of microcracks were more likely to remain hydrated during creep deforma-tion. The availability of water at the crack tips will dictate the efficacy of stress corrosion cracking (Atkinson 1984; Atkinson and Meredith 1987).
0
10
20
30
40
50
42 44 46 48 50 52 54
Tim
e to
failu
re, t
f(h
)
Stress level, σ (MPa)
Sp#Soaked-Creep-2d
Sp#Soaked-Creep-4d
Sp#Soaked-Creep-6d
Sp#Soaked-Creep-8d
tf=2×10⁸e-0.343σ
R2=0.9506
tf=6×10¹⁰e-0.492σ
R2=0.9246
tf=1011e-0.523σ
R2=0.9911
0
1
2
3
4
48 49 50 51 52 53 54
Tim
e to
failu
re, t
f(h
)
Stress level, σ (MPa)
Fig. 19 Relationship between time-to-failure and the applied differen-tial stress for the samples pre-immersed in water and deformed in the submerged condition (Sp#Soaking-Creep)

The Influence of Water Saturation on the Short- and Long-Term Mechanical Behavior of Red…
1 3
4.3 Application to Geotechnical Practices
The creep behavior of a rock mass is of crucial importance for the long-term stability of engineering practices. In terms of mining, the creep behavior of the implicated rock mass is often monitored (e.g., Reynolds and Gloyna 1961; Wang 1981; Cruden and Masoumzadeh 1987; Tang et al. 2018). A thorough understanding of creep is important in mining as it helps in the design of the mining room (Dawson and Munson 1983), the pillars (Obert 1965; King 1973), and the exca-vation of tunnels (Phienwej et al. 2007). Laboratory stud-ies of brittle creep typically perform experiments on either oven-dry or fully-saturated rock samples (e.g., Brantut et al. 2013). However, in practice, the saturation level of rock in many geotechnical practices (hydroelectric power stations, deep mines, and geothermal reservoirs, amongst others) lies somewhere between these two end-members. Here, there-fore, we have performed a suite of laboratory experiments designed to better understand brittle creep in partially-sat-urated rock. For example, in the case of deep underground mining, during which saturated rock is first dried and then re-saturated if the mine becomes flooded once mining has ceased, our data show that the creep strain rate would first decrease as rock is dried due to pumping and ventilation but would then increase significantly if the mine is flooded, significantly reducing time-to-failure. Therefore, if mining practices during resource exploitation weakened the rock or
increased the stress acting on the rock, subsequent flooding can quickly lead to roof failure and mine collapse, as often observed in abandoned mines. Our study not only highlights that the saturation level important, but also highlights the importance of the duration of rock–water interaction (imbi-bition), a factor that we strongly suggest is considered in the long-term assessments of the stability of engineering structures. The relationships, data, and empirical equations provided herein, therefore, provide valuable information on the long-term stability of engineering structures.
5 Conclusions
The salient conclusions of our study are as follows:
1. When compared to the dry state (oven-dried sam-ple deformed under dry conditions), the minimum creep strain rate and the time-to-failure increased and decreased, respectively, dramatically for samples pre-immersed in water before deformation. This is due to the enhancement of stress corrosion cracking.
2. The minimum creep strain rate and the time-to-failure increased and decreased, respectively, when the pre-immersion duration was increased from 4 to 6 days, but did not change significantly when the pre-immersion duration was further increased to 8 days. This is attrib-
Fig. 20 Time-to-failure as a function of the applied dif-ferential stress for the samples pre-immersed in water [for 2 (a), 4 (b), 6 (c), and 8 (d) days] and deformed in the dry (red circles) and the submerged (blue triangles) condition (Color figure online)
0
5
10
15
20
25
30
47 49 51 53 55 57 59Ti
me
to fa
ilure
, tf(h
)Stress level, σ (MPa)
(a) Sp#Wet-Creep-2d
Sp#Soaked-Creep-2d
0
2
4
6
8
10
47 48 49 50 51 52 53 54 55
Tim
e to
failu
re, t
f(h
)
Stress level, σ (MPa)
(b) Sp#Wet-Creep-4d Sp#Soaked-Creep-4d
0
1
2
3
4
5
47 48 49 50 51 52 53 54
Tim
e to
failu
re, t
f(h
)
Stress level, σ (Mpa)
(c) Sp#Wet-Creep-6d
Sp#Soaked-Creep-6d
0
1
2
3
4
47 48 49 50 51 52 53 54
Tim
e to
failu
re, t
f(h
)
Stress level, σ (MPa)
(d) Sp#Wet-Creep-8d Sp#Soaked-Creep-8d
S. B. Tang et al.
1 3
uted to microcrack saturation between 4 and 6 days; saturation was complete, or near completion, following 6 days.
3. An oven-dry sample deforming underwater failed at stresses far below that of an oven-dry sample deform-ing in the dry condition. For example, our data show that an oven-dried sample did not creep within the resolu-tion of our equipment at σ = 48.32 MPa. However, fail-ure occurred ~ 37 h for an oven-dried sample deformed underwater at the same applied differential stress.
4. Our data show that the minimum creep strain rate and the time-to-failure for the pre-immersed samples deformed underwater were faster and shorter, respectively, than for the pre-immersed samples deformed under dry condi-tions. Our explanation for this is that, due to the availa-ble water, crack tips remained hydrated when the sample was deformed underwater, thus increasing the efficacy of stress corrosion cracking.
5. We highlight that brittle creep experiments are typi-cally performed on either oven-dry or fully-saturated rock samples. However, in practice, the saturation level of rock in many geotechnical practices (hydroelectric power stations, deep mines, and geothermal reservoirs, amongst others) lies somewhere between these two end-members. The relationships and data provided herein, therefore, offer valuable information on the long-term stability of engineering structures.
Acknowledgements This project was financially supported by the National Basic Research Program of China (973 Program) (2014CB047100), the National Natural Science Foundation of China (51474046, U1562103), and the Fundamental Research Funds for the Central Universities (DUT17LK35). The authors additionally thank a Partenariats Hubert Curien (PHC) Cai Yuanpei grant (Grant Num-ber 36605ZB). We also knowledge the constructive comments of two anonymous reviewers.
References
Atkinson BK (1984) Subcritical crack growth in geological materials. J Geophys Res 89:4077–4114
Atkinson BK, Meredith PG (1987) The theory of subcritical crack growth with applications to minerals and rocks. Fract Mech Rock 2:111–166
Baud P, Meredith PG (1997) Damage accumulation during triaxial creep of Darley Dale sandstone from pore volumometry and acoustic emission. Int J Rock Mech Min Sci 34:24. e21-24. e10
Baud P, Zhu W, Wong TF (2000) Failure mode and weakening effect of water on sandstone. J Geophys Res 105:16371–16389
Brantut N, Heap MJ, Meredith PG, Baud P (2013) Time-dependent cracking and brittle creep in crustal rocks: a review. J Struct Geol 52:17–43
Brantut N, Heap MJ, Baud P, Meredith PG (2014a) Rate-and strain-dependent brittle deformation of rocks. J Geophys Res 119:1818–1836
Brantut N, Heap MJ, Baud P, Meredith PG (2014b) Mechanisms of time-dependent deformation in porous limestone. J Geophys Res 119:5444–5463
Çobanoğlu İ, Çelik SB, Dinçer İ, Alkaya D (2009) Core size and time effects on water absorption values of rock and cement mortar samples. Bull Eng Geol Env 68:483
Cruden DM, Masoumzadeh S (1987) Accelerating creep of the slopes of a coal mine. Rock Mech Rock Eng 20:123–135
David C, Menéndez B, Mengus JM (2011) X-ray imaging of water motion during capillary imbibition: Geometry and kinetics of water front in intact and damaged porous rocks. J Geophys Res 116:1–15
Dawson PR, Munson DE (1983) Numerical simulation of creep deformations around a room in a deep potash mine. Int J Rock Mech Min Geom Abs 20:33–42
Duda M, Renner J (2013) The weakening effect of water on the brit-tle failure strength of sandstone. Geophys J Int 192:1091–1108
Dyke CG, Dobereiner L (1991) Evaluating the strength and deform-ability of sandstones. Q J Eng Geol Hydroge, 24:123–134
Fujii Y, Kiyama T, Ishijima Y, Kodama J (1999) Circumferential strain behavior during creep tests of brittle rocks. Int J Rock Mech Min Sci 36:323–337
Hawkins AB, McConnell BJ (1992) Sensitivity of sandstone strength and deformability to changes in moisture content. Q J Eng Geol Hydroge 25:115–130
Heap MJ, Baud P, Meredith PG, Bell AF, Main IG (2009a) Time-dependent brittle creep in Darley Dale sandstone. J Geophys Res 114:1–22
Heap MJ, Baud P, Meredith PG (2009b) Influence of temperature on brittle creep in sandstones. Geophys Res Lett 36
Heap MJ, Baud P, Meredith PG, Vinciguerra S, Bell AF, Main IG (2011) Brittle creep in basalt and its application to time-depend-ent volcano deformation. Earth Planet Sc Lett 307:71–82
Heap MJ, Brantut N, Baud P, Meredith PG (2015) Time-depend-ent compaction band formation in sandstone. J Geophys Res 120:4808–4830
Heap MJ, Kushnir ARL, Gilg HA, Wadsworth FB, Reuschlé T, Baud P (2017) Microstructural and petrophysical properties of the Permo-Triassic sandstones (Buntsandstein) from the Soultz-sous-Forêts geothermal site (France). Geothermal Energy 5:26
King MS (1973) Creep in model pillars of saskatchewan potash. Int J Rock Mech Min Geom Abs 10:363–371
Kranz RL, Scholz CH (1977) Critical dilatant volume of rocks at the onset of tertiary creep. J Geophys Res 82:4893–4898
Kranz RL, Harris WJ, Carter NL (1982) Static fatigue of granite at 200 °C. Geophys Res Lett 9:1–4
Liu X, Yang C, Yu J (2015) The influence of moisture content on the time-dependent characteristics of rock material and its applica-tion to the construction of a tunnel portal. Adv Mater Sci Eng 2015:13
Lockner D (1993) Room temperature creep in saturated granite. J Geo-phys Res 98:475–487
Mallet C, Fortin J, Guéguen Y, Bouyer F (2015) Role of the pore fluid in crack propagation in glass. Mech Time Dep Mater 19:117–133
Masuda K (2001) Effects of water on rock strength in a brittle regime. J Struct Geol 23:1653–1657
Nara Y, Morimoto K, Yoneda T, Hiroyoshi N, Kaneko K (2011) Effects of humidity and temperature on subcritical crack growth in sand-stone. Int J Solids Struct 48:1130–1140
Nara Y, Morimoto K, Hiroyoshi N, Yoneda T, Kaneko K, Benson PM (2012) Influence of relative humidity on fracture toughness of rock: implications for subcritical crack growth. Int J Solids Struct 49:2471–2481
Nara Y, Yamanaka H, Oe Y, Kaneko K (2013) Influence of temperature and water on subcritical crack growth parameters and long-term strength for igneous rocks. Geophys J Int 193:47–60
The Influence of Water Saturation on the Short- and Long-Term Mechanical Behavior of Red…
1 3
Ngwenya BT, Main IG, Elphick SC, Crawford BR, Smart BG (2001) A constitutive law for low-temperature creep of water-saturated sandstones. J Geophys Res 106:21811–21826
Nicolas A, Fortin J, Regnet JB, Verberne BA, Plümper O, Dimanov A, Spiers CJ, Guéguen Y (2017) Brittle and semibrittle creep of tavel limestone deformed at room temperature. J Geophys Res 122:4436–4459
Obert L (1965) Creep in model pillars. [Salt, trona, and potash ore] Bureau of Mines ED, College Park, 29
Paterson MS, Wong TF (2005) Experimental rock deformation-the brit-tle field. Springer Science & Business Media, Berlin
Phienwej N, Thakur PK, Cording EJ (2007) Time-dependent response of tunnels considering creep effect. Int J Geomech 7:296–306
Rehbinder PA, Schreiner LA, Zhigach KF (1948) Hardness reducers in drilling (translated from Russian). Council of Scientific and Industrial Research, Melbourne, p 163
Reviron N, Reuschlé T, Bernard JD (2009) The brittle deformation regime of water-saturated siliceous sandstones. Geophys J Int 178:1766–1778
Reynolds TD, Gloyna EF (1961) Creep Measurements in Salt Mines. The 4th US Symposium on Rock Mechanics (USRMS). Univer-sity Park, Pennsylvania, American Rock Mechanics Association
Rybacki E, Herrmann J, Wirth R, Dresen G (2017) Creep of posidonia shale at elevated pressure and temperature. Rock Mech Rock Eng 50:3121–3140
Schmitt L, Forsans T, Santarelli FJ (1994) Shale testing and capillary phenomena. Int J Rock Mech Min Geom Abs 31:411–427
Shakoor A, Barefield EH (2009) Relationship between unconfined compressive strength and degree of saturation for selected sand-stones. Environ Eng Geosci 15:29–40
Sone H, Zoback MD (2014) Time-dependent deformation of shale gas reservoir rocks and its long-term effect on the in situ state of stress. Int J Rock Mech Min Sci 69:120–132
Tang S, Yu C, Tang C (2018) Numerical modeling of the time-depend-ent development of the damage zone around a tunnel under high humidity conditions. Tunn Undergr Sp Tech 76:48–63
Wang S (1981) On the mechanism and process of slope deformation in an open pit mine. Rock Mech 13:145–156
Waza T, Kurita K, Mizutani H (1980) The effect of water on the sub-critical crack growth in silicate rocks. Tectonophysics 67:25–34
Wong LNY, Jong MC (2014) Water saturation effects on the Brazilian tensile strength of gypsum and assessment of cracking processes using high-speed video. Rock Mech Rock Eng 47:1103–1115
Ye G, Nishimura T, Zhang F (2015) Experimental study on shear and creep behaviour of green tuff at high temperatures. Int J Rock Mech Min Sci 79:19–28
Zhou Z, Cai X, Cao W, Li X, Xiong C (2016) Influence of water con-tent on mechanical properties of rock in both saturation and drying processes. Rock Mech Rock Eng 49:3009–3025
Publisher’s Note Springer Nature remains neutral with regard to jurisdictional claims in published maps and institutional affiliations.