Embed Size (px)
Citation preview

How to cite this document:
Thamrin, G., Bernarto, I., & Kawata, Y. (2020). The influence of trust, satisfaction,
value, and brand image on loyalty.BISMA (Bisnis dan Manajemen),
12(April), 168-185. https://doi.org/10.26740/bisma.v12n2.p168-185
BISMA (Bisnis dan Manajemen)
Volume 12, Issue2, April 2020,168-185
ISSN 2549-7790 (Online)
ISSN 1979-7192 (Print)
DOI: 10.26740/bisma.v12n2.p168-185
https://journal.unesa.ac.id/index.php/bisma/index
The influence of trust, satisfaction, value, and brand image on
loyalty
Gandadinata Thamrin1*, Innocentius Bernarto2, and Yukichika Kawata3
1Faculty of Economics and Business, Pelita Harapan University
Jalan M.H Thamrin Blvd 1100, Lippo Karawaci, Tangerang, Banten15811,Indonesia
2 Faculty of Economics and Business, Pelita Harapan University
Jalan M.H Thamrin Blvd 1100, Lippo Karawaci, Tangerang, Banten15811,Indonesia
3 Faculty of Economics, Kindai University
4-1 Kowakae 3-chome, Higashiosaka 577-8502, Japan
Abstract
This study aims to investigate the influence of trust, satisfaction, values, and brand image
on the loyalty of MaxxCoffee. Data collection in this study was conducted using a
questionnaire given to students of Universitas Pelita Harapan as respondents. The research
design uses convenience sampling with a total sample of 249 samples. The data collection
method is utilizing questionnaires and the data is analyzed by the Partial Least Square of
Structural Equation Modeling (PLS-SEM). The findings of this study are trust, satisfaction,
and value have a positive effect on loyalty. Conversely, the brand image has no positive
effect on Maxx Coffee customers’ loyalty. The contribution of this study is providing input
to the management of Maxx Coffee to concern and maintain their trust, satisfaction, value,
and brand image of Maxx Coffee to maintain the customers’ loyalty.
Keywords: brand image; loyalty; satisfaction; trust; value.
Received: August 7, 2019; Accepted: February 10, 2020; Published: April 28, 2020
*Corresponding author
Email:[email protected]
BISMA (Bisnis dan Manajemen) Volume 12Issue2, April 2020 E-ISSN 2549-7790, P-ISSN 1979-7192
Page168-185
https://journal.unesa.ac.id/index.php/bisma/index 169
Abstrak
Penelitian ini bertujuan untuk mengetahui pengaruh kepercayaan pelanggan, kepuasan
pelanggan, nilai-nilai dan citra merek terhadap loyalitas pelanggan Maxx Coffee.
Pengumpulan data dalam penelitian ini dilakukan dengan menggunakan kuesioner yang
diberikan kepada mahasiswa Universitas Pelita Harapan sebagai responden. Desain
penelitian menggunakan convenience sampling dengan total sampel 249 sampel. Metode
pengumpulan data menggunakan kuesioner dan data dianalisis dengan Partial Least
Square dari Structural Equation Modeling(PLS-SEM). Temuan penelitian ini adalah
kepercayaan pelanggan, kepuasan, dan nilai berpengaruh positif terhadap loyalitas.
Sebaliknya, citra merek tidak berpengaruh positif terhadap loyalitas pelanggan Maxx
Coffee. Kontribusi dari penelitian ini adalah memberikan masukan kepada manajemen
Maxx Coffee untuk memperhatikan dan mempertahankan kepercayaan, kepuasan, nilai
dan citra merek mereka dari Maxx Coffee untuk menjaga loyalitas pelanggan.
Kata kunci:citra merek; kepercayaan; kepuasan; loyalitas; nilai.
INTRODUCTION
Today the growth of the coffee industry in Indonesia is increasing along with
changes in the lifestyle of the Indonesian people, especially the middle class.
According to the Indonesian Coffee Exporters Association, Indonesian demand
for coffee consumption continues to rise and coffee demand rises by 36% from
2010 to 2014 (Rikang &Dharma, 2014). Indonesia's coffee consumption is 800
grams per capita and Indonesia's total coffee demand reach 190 thousand tons
(2010) and continues to rise until the end of 2014, about 1.03 kilograms per capita
with total coffee demand about 260 thousand tons (Menperin, 2016).
Indonesia is the fourth largest coffee producer in the world (after Colombia,
Vietnam, and Brazil) with an average coffee production of 685,000 tons per year
or 8.9% of world coffee production. The Ministry of Industry has facilitated the
pace of the coffee processing industry in Indonesia and the growth of coffee shops
or coffee shops in Indonesia under PP No. 14 of 2015 about the Development
Master Plan of National Industry 2015-2035 and PP No. 18 of 2015 about income
tax-shield facilities. Therefore, under this supportive business climate, Maxx
Coffee was established in 2015 and started to sell its local coffee beans with
international flavors but with affordable prices for its customers. In 2016, their
outlets have expanded to various cities in Indonesia, such as UPH Karawaci, and
even they planned to open more than 80 outlets across Indonesia (Jelemone, 2015).
Basedon an interview with the Maxx Coffee manager, it was revealed that
60% of UPH students were expected to buy Maxx Coffee products about 2-3 times
a week. The initial research also showed that around 60% of UPH students buy
Maxx Coffee products, although only once a week. Thus, there are differences in
company expectations with facts on the ground. Furthermore, to overcome this
problem, it is important to increase UPH student loyalty as the expectations of
managers by concern on the customer values, trust, satisfaction, and brand image

Gandadinata Thamrin, Innocentius Bernarto, & Yukichika Kawata
The influence of trust, satisfaction, value, and brand image on loyalty
170 https://journal.unesa.ac.id/index.php/bisma/index
of Maxx Coffee.
The purpose of this study is to determine whether trust, satisfaction, value and
brand image have a positive effect on Macc Coffee customer loyalty. The results of
this study can provide insight to Maxx Coffee's management to increase customer
loyalty and ultimately increase total revenue as well.
Loyalty
With current technological advances, customers are increasingly smart,
aware of the price and quality of the products they want. There are a lot of product
offers with accessible and abundant information about them that enable the
customers to have many choices in determining which products and services they
want(Bowden-Everson, Dagger, & Elliott, 2013). With these choices, customers
determine their loyalty to certain products routinely and continuously at certain
periods even though other products provide lower prices (Bowden-Everson et al.,
2013). According to Griffin (2003), loyalty is closely related to the purchase cycle
(buying behavior) which goes through five stages: (1) Customer awareness of
products and services, (2) Initial purchase, (3) Evaluation after purchase, (4)
Customer decision to repurchase the product, and (5) Repeated purchase (Gultom
& Ngatno, 2020). Therefore, loyal customers are customers who make repeated
purchases regularly, buy between product lines and services, recommend products
and services to other consumers, and show immunity to what is offered from
competitors (Kinanti & Fauzi 2020). As a result, retaining customers means
increasing company performance.
Based on the previous description, Oliver (1999, p. 34) stated that “a deeply
held commitment to rebuy or repatronize a preferred product/service consistently
in the future, thereby causing repetitive same-brand or same brand-set purchasing,
despite situational influences and marketing efforts having the potential to cause
switching behavior”. In the research of Mandalis (2005), it is explained that loyalty
is built with two approaches in customer repurchase behavior such as customer
preference for the product bought (attitude approach) and customer behavior
which customer only buy a product repeatedly without their feeling. Meanwhile,
customer loyalty is developed through three stages, namely cognitive, affective,
and conative stages where the customer will be loyal first through thecognitive
aspect; then develops to become more loyal through affective aspect and finally to
become the true loyalist through conative aspect. This is in line with the consumer
behavior science that consumers usually will pass three stages of learning:
perception, attitude and behavior (Darsono, 2010; Herawati, Widodo, Isman, &
Darham(2019).
The Relationship of Trust on Loyalty
Anderson and Weitz (1989) stated that trust is a level of belief that is owned
by a person towards others which other people's beliefs will apply the same as

BISMA (Bisnis dan Manajemen) Volume 12Issue2, April 2020 E-ISSN 2549-7790, P-ISSN 1979-7192
Page168-185
https://journal.unesa.ac.id/index.php/bisma/index 171
expected by that person. It can be said that brand trust is an important basis in
building successful marketing relationships where customers have a high level of
confidence in the reliability and integrity of the company and its products
(Chinomona & Dubihlela, 2014; Morgan & Hunt, 1994).
Brand trust shows the ability of a brand to be trusted and meets the value
promised by the company to the customer and increases brand intention based on
consumer confidence inthe brand. This means that the customer confidence
towards the benefit they might gain in buying can build their satisfaction and
loyalty (Sovani, Fauzi, and Arifin, 2016).In Hasanuddin, Rachma, and Wahono
(2020) that investigated the consumer behavior of Mr. Beard Coffee, trust also
shows a positive and significant influence on customer loyalty.
Soegoto (2013) explains that the relationship between trust and emotional
bonding was built when customers entrust the company's or brand's ability to carry
out its functions. The existence of consumer expectations for product benefit will
create loyalty and brand trust. Morgant and Hunt (1994) stated that trust arises
when there is an exchange between two parties in which one party believes the
other party has integrity and reliability. Kotler and Keller (2012) explained that
the costumer compare the performance of the product with their expectations as
post purchase evaluation. At this stage, the costumers is disappointed when the
product’s performance is below their expectations; feel satisfied when product’s
performance equals to their expectations; costumers feel delighted when product’s
performance exceeds their expectations.
Meanwhile, Setyaningsih (2014) explained that the effect of perceived e-
commerce service quality on customer satisfaction, trust, and loyalty in fashion
products, proved that trust has a significant effect in increasing customer loyalty.
The research results of Puspita,Yunus,and Sulaiman(2017) shows that trust
influences positively on loyalty in the case study of Samsung users at Banda Aceh
city. Furthermore, the study of Darsono (2010) and Muzammil,Yunus, & Darsono
(2017) revealed that customer trust had a significant and positive effect on
Indihome’s customer loyalty in Banda Aceh city. Hence, based on the previous
studies above, the researchers formulated the hypothesis as follows:
H1: Trust has a positive effect on loyalty.
The Relationship of Satisfaction on Loyalty
Most managers agree that there is a positive correlation between customer
buying behavior and the results of the customer satisfaction score.The general
assumption is that an increase in a customer's satisfaction score will be followed
by an increase in the share of income spent by the customer, the company's
reference level from the other party (rate of referral) and customer willingness to
pay at a higher price (premium price) (Griffin 2003, p. 3). Lamb, Hair, and Daniel

Gandadinata Thamrin, Innocentius Bernarto, & Yukichika Kawata
The influence of trust, satisfaction, value, and brand image on loyalty
172 https://journal.unesa.ac.id/index.php/bisma/index
(2005) explained that customer satisfaction is the fulfillment of customer
expectations of a product. Consumer satisfaction is important that have a specific
benefit impact to maintain products in the market as well as to gain wider market
share so that the company can increase its profits (Chinomona & Sandada. 2013;
Listyawati, 2019; Muzammil,Yunus, & Darsono, 2017; Setyaningsih, 2014).
According to Rangkuti (2004), companies need to know, understand, and
measure customer satisfaction for fulfilling customer expectations, customer
relationships, customer referrals, and customer recovery. Customer satisfaction
means the customer's response to the evaluation of perceived discrepancies
between the actual performance of the product felt and customer expectations;
customer satisfaction is an emotional reaction to customer evaluation of the
experience of products or services (Farida, 2010; Laila, Rachma, & Priyono
(2017). Meanwhile, Irawan (2003) said there are at least three reasons why
companies need to measure their customer satisfaction: increasing
competitiveness, more and more companies which increase their costs,
investments, and resources to prioritize customer satisfaction programs and put it
as a measurement of company goal achievement and performance, and changes in
customer expectations from time to time that encourages companies to conduct
research and make decisions for the future.
Moreover, Gerson (2004) stated that customer satisfaction is customers
satisfying feeling if their expectations can be met, even exceeding their
expectations. Every time, a customer evaluates the quality of service and goods,
and how their satisfaction has influenced their loyalty. Customer satisfaction
affects customer buying behavior. If customer satisfaction is high toward products
or services, they will become loyal customers for those products or services.
A research conducted by Kurniawati, Suharyono, & Kusumawati (2014) and
Tjahjaningsih (2013) show that customer satisfaction gives a positive value to
loyalty. The creation of a harmonious relationship between customers and
companies will make repeat purchases and create customer loyalty and word of
mouth promotion that gives benefit to the company. Hence, it can be concluded
that customer satisfaction is built from customer experience when using the
product that influences customer loyalty, repeat purchases, and recommendation
of products to other customers. This is also reinforced by research from Bernarto
and Patricia (2017) that customer satisfaction has a positive effect on customer
loyalty and trust. Thus, this study hypothesizes that:
H2: Satisfaction has a positive effect on loyalty.
The Relationship of Value and Loyalty
Yoeti (2005) explains that company customers are potential customers who
buy goods and services that can satisfy their needs by paying attention to the value
they will receive. Kotler and Armstrong (2008) explain that marketing is a
BISMA (Bisnis dan Manajemen) Volume 12Issue2, April 2020 E-ISSN 2549-7790, P-ISSN 1979-7192
Page168-185
https://journal.unesa.ac.id/index.php/bisma/index 173
managerial and social process in which individuals or organizations get what they
need and want through the means of exchange and value creation with others. A
company's value is an overall customer evaluation of the usefulness of the product
or service based on the assumption of what is obtained and given by the customer
(Bernarto & Patricia, 2017).
Soegoto (2013) added that the terminal, instruments, or goals and objectives
where the behavior achieved by the company is a valuable company value. The
effect of the relationship between value and loyalty is the customer's experience
in interacting with several objects giving characteristics that appear in relative
preferences (personal, comparative, and situational) where the value obtained by
the customer is higher the customer gives loyalty and profits to the company
(Barnes,2000; Gale, 2004). The research of Bernarto and Patricia (2017) and
Soegoto (2013) stated that if the customer's perception about the value of a quality
product is relatively higher than that of a competitor's product, it will increase the
level of customer loyalty, as well as the higher value perception of the customer,
the greater the possibility of repeat purchase. This shows the relationship between
value and customer loyalty. Hence, this study hypothesizes that:
H3: Value has a positive effect on loyalty.
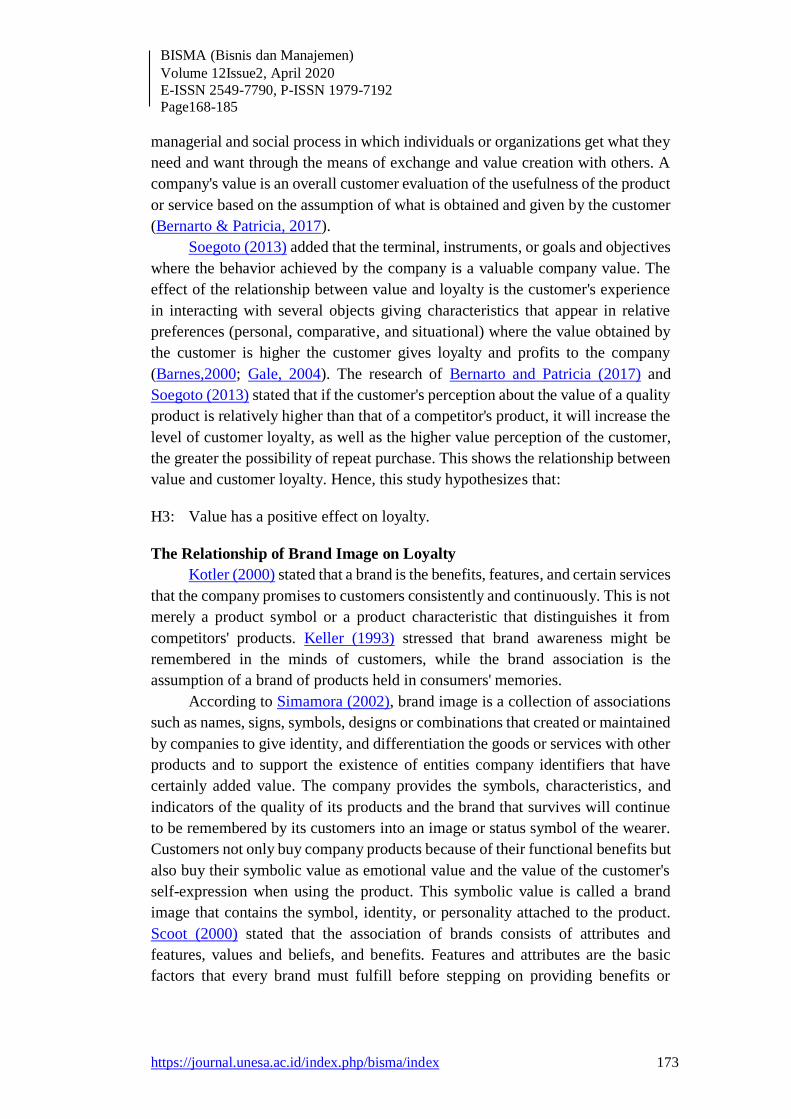
The Relationship of Brand Image on Loyalty
Kotler (2000) stated that a brand is the benefits, features, and certain services
that the company promises to customers consistently and continuously. This is not
merely a product symbol or a product characteristic that distinguishes it from
competitors' products. Keller (1993) stressed that brand awareness might be
remembered in the minds of customers, while the brand association is the
assumption of a brand of products held in consumers' memories.
According to Simamora (2002), brand image is a collection of associations
such as names, signs, symbols, designs or combinations that created or maintained
by companies to give identity, and differentiation the goods or services with other
products and to support the existence of entities company identifiers that have
certainly added value. The company provides the symbols, characteristics, and
indicators of the quality of its products and the brand that survives will continue
to be remembered by its customers into an image or status symbol of the wearer.
Customers not only buy company products because of their functional benefits but
also buy their symbolic value as emotional value and the value of the customer's
self-expression when using the product. This symbolic value is called a brand
image that contains the symbol, identity, or personality attached to the product.
Scoot (2000) stated that the association of brands consists of attributes and
features, values and beliefs, and benefits. Features and attributes are the basic
factors that every brand must fulfill before stepping on providing benefits or

Gandadinata Thamrin, Innocentius Bernarto, & Yukichika Kawata
The influence of trust, satisfaction, value, and brand image on loyalty
174 https://journal.unesa.ac.id/index.php/bisma/index
values or beliefs because the quality of products, services, and sources of human
power (attributes and features) determine the success of the brand.
Pramudyo (2012) explained that customer satisfaction and loyalty depend
on the role of brand image in increasing consumers’ perceptions and expectations
about the goods or services offered. Furthermore, the repurchase decision is
significantly influenced by the company's image and customers prefer to avoid
risk and have a better product brand image. On the other hand, customers will be
helped by a good brand image of a product when customers make purchasing
decisions and transactions which have a positive influence and makes consumers
loyal to the product. Thus, in this study, we hypothesize as stated in H4. The
framework for thinking of this study is linking the role of the construct of trust,
satisfaction, values, and brand image to loyaltyas shown in Figure 1.
H4: Brand image has a positive effect on loyalty.
Figure 1. Research Framework
METHODS
The research method uses quantitative methods by testing the correlation of
the hypothesis model (Bernarto and Patricia, 2017). The data obtained were
processed by the PLS-SEM statistical program to observe the causality of the
construct at a certain time and not on changes at a certain period.
Data Collection and Sampling
This research model connects the role of trust, satisfaction, value, and brand
image to the loyalty of Maxx Coffee customers. In this case, the researchers
conducted a survey and questionnaire to the target population in this study, namely
students majoring in management, majoring in hotel management and tourism
businesses, and UPH medical staff who visited Maxx Coffee. Maxx Coffee was
established in the university environment in Karawaci, Banten, Indonesia. The
sampling technique is convenience sampling which the number of samples or
respondents is 249 respondents. Profile of respondents obtained from 249

BISMA (Bisnis dan Manajemen) Volume 12Issue2, April 2020 E-ISSN 2549-7790, P-ISSN 1979-7192
Page168-185
https://journal.unesa.ac.id/index.php/bisma/index 175
respondents who filled out the questionnaire distributed, where the results were 80
respondents who participated were men and 169 respondents were women. The age
range of respondents is divided into three categories: 17-19 years (117 people), 20-
22 years (128 people), and 23-25 years (4 people). Meanwhile, most respondents
visit the shop about 1-2 times per month (80%) and 89% did not come to Maxx
Coffee for the first time in UPH, most respondents visited the last 3 weeks (65%),
most came in morning (58%), and choose to come with friends (81.9%) with the
main reason for the visiting coffee shop is doing the work and gathering with
friends. The complete information about the profile of respondents can be seen in
table 1.
Data Analysis and Hypothesis Testing Techniques
Table 1. Respondent Profile Category Respondent (Percentage)
Gender: Male
32
Female 68
Age:
17-19 47
20-22 51
23-25 2
Visit per month:
1-2 times 80
3-4 times 12
More than 4 times 8
Visit time:
Breakfast time 4
Lunch time 58
Supper time 27
Dinner time 11
Visit with:
Alone 13
Couple 3
Friends/Colleagues 82
Family 2
Visit purpose:
Eating/Drinking 14 Hangout with friends 44 Enjoying private leisure time 6 Doing assignment 36
Source: Data Processed
The research method uses a statistical tool Partial Least Square Structure
Equation Modeling (PLS-SEM) with the Smart PLS 3.0 program (Ghozali & Latan,
2015). Questionnaire items in the Trust construct were adapted from He, Li, and
Harris (2012); Pi and Huang (2011); Shpetim (2012). The items of satisfaction
construct were adapted from Shpetim (2012). The items of trust construct were
adapted from He et al. (2012);Yang and Peterson (2004). Meanwhile, the items for

Gandadinata Thamrin, Innocentius Bernarto, & Yukichika Kawata
The influence of trust, satisfaction, value, and brand image on loyalty
176 https://journal.unesa.ac.id/index.php/bisma/index
brand images were adapted from Kaihatu (2012);Kurniawati, Suharyono, and
Kusumawati (2014). Then, the items for customer loyalty were adapted from Pi and
Huang (2011) and Shpetim (2012). The measurement of items uses five Likert scale
sizes from size 1 to 5 which means that size 1 = strongly disagree, size 2 = disagree,
size 3 = neutral, size 4 = agree, and size 5 = totally agree.
RESULT AND DISCUSSION
Validity Test and Reliability Test
Table 2. Measurement Model Evaluation
Construct and item Outer loading ρ value
Value (AVE=0.571, CR=0.888)
V1 I got more benefit in Maxx Coffee 0.743 0.000
V2 I got what I want in Maxx Coffee 0.737 0.000
V3 Price fits with the benefit I got from Maxx Coffee 0.694 0.000
V4 I feel happy with the benefit I got from Maxx Coffee 0.808 0.000
V5 I enjoyed Maxx Coffee menu 0.797 0.000
V6 I could easily remembering about Maxx Coffee product 0.749 0.000
Satisfaction (AVE=0.583, CR=0.874)
P1 Compared to other coffee shop, I am satisfied with
Maxx Coffee service
0.721 0.000
P2 Based on my experience, I am satisfied with Maxx
Coffee shop
0.820 0.000
P3 I am satisfied with Maxx Coffee service 0.730 0.000
P4 I am satisfied with Maxx Coffee menu variation 0.753 0.000
P5 I am satisfied with Maxx Coffee products 0.787 0.000
Trust (AVE=0.650, CR=0.901)
T1 I believe that Maxx Coffee employees tried their best to
serve me
0.586 0.000
T2 Maxx Coffee shop deserved to get my trust 0.868 0.000
T3 Maxx Coffee shop is a reliable coffee shop 0.896 0.000
T4 Maxx Coffee shop upholds honesty 0.831 0.000
T5 Maxx Coffee shop upholds trustworthiness 0.813 0.000
Brand Image (AVE=0.635, CR=0.834)
M1 I think Brand ‘Maxx Coffee’ is easy to remembered 0.573 0.000
M2 I think ‘a green owl head’ logo is strongly reminds me
about the brand image of Maxx Coffee
0.903 0.000
M3 I think Maxx Coffee’s brand design (form, colour, fonts,
and logo) is interesting
0.873 0.000
Loyalty (AVE=0.538, CR=0.850)
L1 I will visit Maxx Coffee again 0.689 0.000
L2 I will recommend Maxx Coffee to my friends 0.819 0.000
L3 I will not shift to another coffee shop brands although
they offer lower price
0.511 0.000
L4 I prefer Maxx Coffee shops than the others 0.794 0.000
L5 I am proud to become Maxx Coffee customer 0.806 0.000
Note: AVE=average variance of extracted; CR=composite reliability; *=significant (on e-tailed
test, ρ<0.05).
Source: Data Processed
The instrument validity test was carried out using the Confirmatory Factor
Analysis (CFA) approach to assess patterns of relationships between one construct
and several other constructs in which each construct was built by indicators. A

BISMA (Bisnis dan Manajemen) Volume 12Issue2, April 2020 E-ISSN 2549-7790, P-ISSN 1979-7192
Page168-185
https://journal.unesa.ac.id/index.php/bisma/index 177
validity test is done by measuring the loading factor and Average Variance
Extracted (AVE). The requirements that must be met are the cut-off values of
loading factors and AVE that should be above 0.708 and 0.5 respectively (Hair et
al., 2014). AVE value about more than 0.5 means 50% of the variation of indicators
can be extracted by the construct. In other words, the number of variations of the
extracted indicator is greater than the number of error variations. Fornell-larcker
criteria identify the root value of AVE that must be above the correlation value
between constructs (Hair et al. 2014). Then, the instrument reliability test is done
by measuring composite reliability. The composite reliability values should be
above 0.7.
Table 2 shows the results of the validity test measurements for AVE range
from 0.538 to 0.650. The outer loading values for convergent validity ranges from
0.511 to 0.903. Meanwhile, the composite reliability shows 0.834 to 0.901 value.
Furthermore, the discriminant validity in Table 3 shows the results that meet the
Fornell-Larcker criteria as the root value of AVE above the correlation value
between constructs. Likewise, the measurements of AVE, the convergent validity
and, composite reliability have met the criteria.
Table 3. Fornell-Larcker Ceiteria Brand
Image
Trust Satisfaction Loyalty Value
Brand image 0.797
Trust 0.448 0.806
Satisfaction 0.515 0.703 0.763
Loyalty 0.465 0.586 0.719 0.733
Value 0.566 0.620 0.729 0.672 0.756
Source: Data Processed
The Evaluation of Structural Models
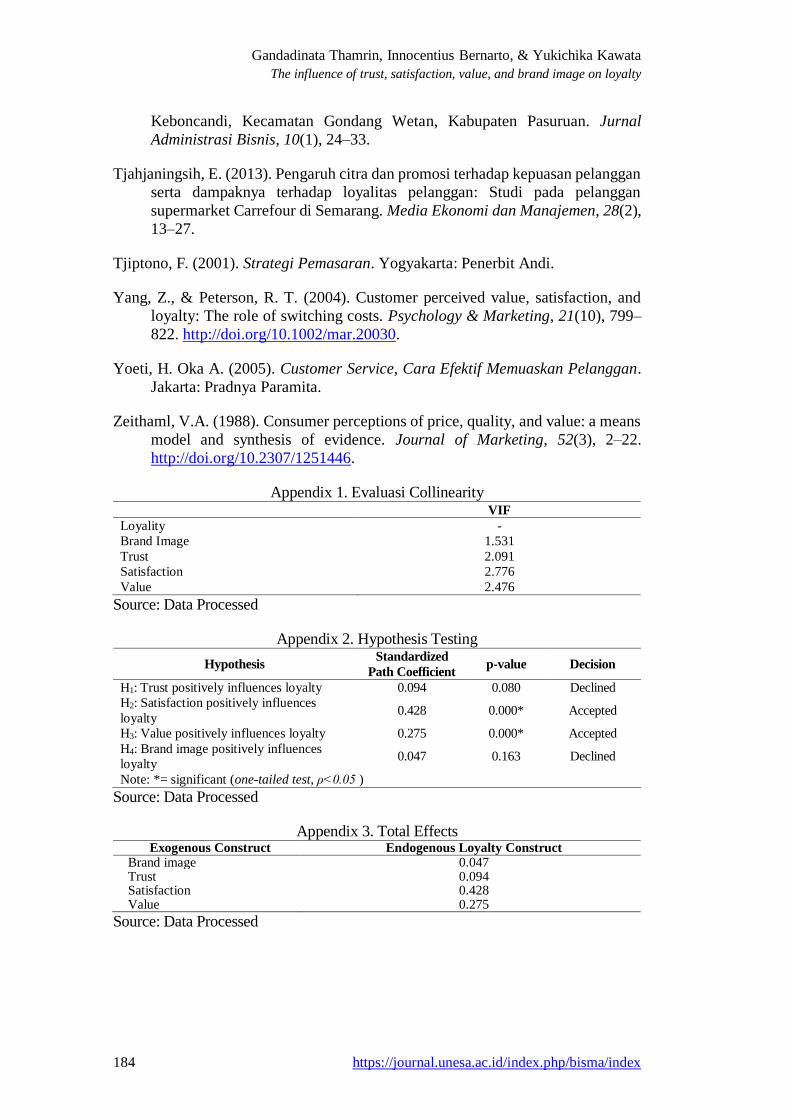
Hair et al. (2014) stated that in evaluating structural models,
multicollinearity testing must be done by looking at the value of the variance
inflation factor or VIF, about below 5 (Hair et al, 2014). If the VIF value is above
5, then there is a multicollinearity problem in the model. Appendix 1 shows that
the VIF value for all constructs is below the required value which is below 5, this
means it meets the criteria. Then, test the hypothesis by a level of significance
about 0.05 and test with a one-tailed test or tested in one direction. Appendix 2
proves that brand image and trust have no positive effect on loyalty. It can be seen
that the p-value (= 0.163) of brand image and p-value (= 0.080) of trust are above
the critical value of p-value (= 0.05). Meanwhile, other hypotheses show
satisfaction and value are also have a positive effect on loyalty with p value <0.05
(below critical value).
Moreover, Appendix 3 shows that the total effect value of the construct of
the brand image is 0.047, the value of total effects construct of confidence is
0.0094, the value of total effects construct of satisfaction is 0.428 and the value of

Gandadinata Thamrin, Innocentius Bernarto, & Yukichika Kawata
The influence of trust, satisfaction, value, and brand image on loyalty
178 https://journal.unesa.ac.id/index.php/bisma/index
total effects is 0.275 for the construct of loyalty. Based on the value of total effects,
it can be said that the value of the total effects of the construct of satisfaction
(0.428) has the greatest effect on the construct of loyalty compared to the effect of
the brand image, trust, and value on the construct of loyalty. However, based on
the hypothesis test in Appendix 2, it shows that the construct of trust and brand
image have no positive effect on loyalty. Thus, the constructs that affect loyalty
are only constructs of satisfaction and values. The evaluation R2 in Appendix 4
informs that the construct of loyalty is explained by the construct of brand image,
trust, satisfaction, and value of about 56.2%, and the remaining 43.8% is explained
by other constructs that are not included in this research model.
Discussion
The results of data processing through hypothesis testing (H1) revealed that
trust has a positive effect on loyalty, is declined. Hypothesis testing results are not
fit with the results of research from Darsono (2010), Muzammil,Yunus, & ; Puspita,
Yunus, & Sulaiman (2017), Setyaningsih (2014), Soegoto (2013); and Sovani,
Fauzi, & Arifin (2016). Nevertheless, the results of this hypothesis test are in line
with the results of studies from Hidayat and Firdaus (2014), and Safitri (2011).
Customers believe that Maxx Coffee is a trusted, honest, trustworthy, and reliable
coffee shop that serves customers well but does not guarantee customers will be
loyal. However, the management of Maxx Coffee must continue to strive to increase
customer confidence. Honesty and consistency factors (reliability) are important
factors in customer trust.
Then, the results of testing the hypothesis (H2) proved that satisfaction has a
positive effect on loyalty. This result supports the results of previous studies from
Bernarto and Patricia (2017) that satisfaction has a positive effect on loyalty.
Furthermore, the results of this hypothesis test are also consistent with studies from
Kurniawati, Suharyono, and Kusumawati (2014); Laila, Rachma, and Priyono
(2017); Listyawati (2019); Muzammil,Yunus,andDarsono(2017); Setyaningsih
(2014); Tjahjaningsih (2013) that satisfaction has a significant effect on increasing
loyalty. When customer satisfaction increases, customers will become more loyal
and trust more in the products offered by Maxx Coffee. A satisfying customer
experience with Maxx Coffee shop will increase customer satisfaction and trust. If
this can be maintained, then customers believe that Maxx Coffee shop is reliable,
trustworthy, and honestly prioritizes customer needs. Besides that, satisfied
customers will not hesitate to give testimonials to their friends that Maxx Coffee
shop is worth visiting. The large number of respondents who visit Maxx Coffee
shops with friends can be supporting evidence that customer satisfaction has an
influence on customer loyalty and trust in Maxx Coffee shops.
The next hypothesis (H3), namely the positive effect of value on loyalty, is
accepted. These results suit the research of Barnes (2000); Bernarto and Patricia
(2017); Gale (2004); Soegoto (2013), that the value brings a positive effect on

BISMA (Bisnis dan Manajemen) Volume 12Issue2, April 2020 E-ISSN 2549-7790, P-ISSN 1979-7192
Page168-185
https://journal.unesa.ac.id/index.php/bisma/index 179
loyalty. This study says that the product benefits delivered to customers can
increase the frequency of purchases. Students are having an opinion that they get
benefits that suits the price they pay and get what they want. For example, the
customer is being happy and enjoying the benefits so that students intend to visit
again and do not hesitate to recommend Maxx Coffee to their friends.
Then, based on the results of hypothesis testing (H4) shows that brand image
does not have a positive effect on loyalty. An increase or decrease in the brand
image does not have an impact on customer loyalty. The results of this test are not
supporting the results of research by Pramudyo (2012), but consistent with the
results of research by Kaihatu (2012), Kurniawati, Suharyono, and Kusumawati
(2014), Rizal, Telagawathi, Yulianthini, & Putra (2019) who showed that the brand
had no positive effect on loyalty. Students assess that the brand image of Maxx
Coffee does not guarantee that students will visit again or recommend Maxx Coffee
shops to their friends. This can be understood, considering that most of the
respondents in this study were students with an age range of 20-22 years who were
happy to try new things, including in choosing a coffee shop.
CONCLUSION
The results of the study concluded that the research conducted at Maxx
Coffee showed that of the four constructs namely trust, satisfaction, and value had
a positive effect on loyalty unless the construct of the brand image had no positive
effect on loyalty. This study has limitations in terms of characterand the number
of sampling is limited to students majoring in management, hospitality
management, and medicine at UPH because of the proximity of the location of the
coffee shop with their faculties building. Therefore, for further research, it is
suggested that the target population can be extended to other general public to a
wider location so that the management of Maxx Coffee's coffee shop can get a
general picture of customers’ perceptions of coffee shops and use it as input to
improve and develop their services. Then, the second limitation is the sampling
technique used. This research uses convenience sampling. This technique has a
limitation that is not accurate in generalizing results to the population. Thus, to get
better results for generalization to the population, it is recommended that future
studies are better to use random sampling. The limitation of this study is that it
does not include product variables from Maxx Coffee. In fact, customers visiting
Maxx Coffee are basically to buy Maxx Coffee products. Therefore, the next
research suggestion is to add product quality variable, so it can be known whether
the quality of the product has an impact on customer loyalty or not.
REFERENCES
Anderson E., & Weitz, B. (1989). Determinants of continuity in conventional
industrial channel dyads. Market Sci. 8(4), 10–23.
http://doi.org/10.1287/mksc.8.4.310.

Gandadinata Thamrin, Innocentius Bernarto, & Yukichika Kawata
The influence of trust, satisfaction, value, and brand image on loyalty
180 https://journal.unesa.ac.id/index.php/bisma/index
Barnes, G.J. (2000). Secret of Customer Relationship Management. Yogyakarta:
Penerbit Andi.
Bernarto, I., & Patricia (2017). Pengaruh perceived value, customer satisfaction dan
trust terhadap customer loyalty restoran xyz di Tangerang. Journal for
Business and Entrepreneur, 1(1), 36-49.
Bowden Everson, J.L.H., Dagger, T.S., & Elliott, G. (2013). Engaging customers
for loyalty in the restaurant industry: The role of satisfaction, trust, and
delight. Journal of Foodservice Business Research, 16(1), 52–75.
http://doi.org/10.1080/15378020.2013.761025.
Chinomona, R., & Dubihlela, D. (2014). Does customer satisfaction lead to
customer trust, loyalty and repurchase intention of local store brands? the case
of gauteng province of South Africa. Mediterranean Journal of Social
Sciences, 5(9), 23–32. http://doi.org/10.5901/mjss.2014.v5n9p23.
Chinomona, R., & Sandada, M. (2013). Customer satisfaction, trust, and loyalty as
predictors of customer intention to re-purchase South African retailing
industry. Mediterranean Journal of Social Sciences, 4(14), 437–446.
http://doi.org/10.5901/mjss.2013.v4n14p437.
Crosby, L.A, Evans, K.R.,& Cowles, D. (1990). Relationship quality in service
selling: an interpersonal influence perspective. Journal of Marketing, 54(3),
68–81. http://doi.org/10.2307/1251817.
Darsono, L. I. (2010). Hubungan perceived service quality dan loyalitas: peran trust
dan satisfaction sebagai mediator. Jurnal Bisnis Perspektif, 2(1), 43–57.
Farida, N. (2010). Pengaruh ikatan hubungan, citra perusahaan, nilai pelanggan,
kualitas dan kepuasan nasabah terhadap loyalitas nasabah bank pemerintah di
Jawa Tengah. WACANA, 13(2), 202–213.
Gale. (2004). Customer Experience Management: A Revolutionary Approach to
Connecting with Your Customer. New York: John Willey & Sons.
Gerson, R. F. (2004). Mengukur Kepuasan Pelanggan. Jakarta: Penerbit PPM.
Ghozali, I., & Latan, H. (2015). Partial Least Squares, Konsep, Tehnik dan Aplikasi
Menggunakan Program SmartPLS 3.0. Semarang: Penerbit Undip.
Griffin, J. (2003). Customer Loyalty, Menumbuhkan &Mempertahankan Kesetiaan
Pelanggan. Jakarta: Penerbit Erlangga.
Gultom, M., & Ngatno (2020). Pengaruh kualitas produk dan harga terhadap
loyalitas pelangganmelalui kepuasan konsumen smartphone Samsung di
Semarang. Jurnal Ilmu Administrasi Bisnis, 9(1), 171–172.

BISMA (Bisnis dan Manajemen) Volume 12Issue2, April 2020 E-ISSN 2549-7790, P-ISSN 1979-7192
Page168-185
https://journal.unesa.ac.id/index.php/bisma/index 181
Hair, JF., Hult, G.T.M.., Ringle, C.M.,& Sarstedt, M. (2014). A Primer on Partial
Least Squares Structural Equation Modeling (PLS-SEM). California: SAGE
Publications Inc.
Hasanuddin, Maulana Rajab., Rachma, N.,& Wahono, Budi. (2020). Pengaruh
Kualitas Produk, Kualitas Pelayanan dan Kepercayaan Pelanggan terhadap
Loyalitas Pelanggan. E-Jurnal Riset Manajemen, 9(11), 39–53.
He, H., Li, Y., & Harris, L. (2012). Social identity perspective on brand loyalty.
Journal of Business Research, 65(5), 648–657.
http://doi.org/10.1016/j.jbusres.2011.03.007.
Herawati., W. R., Isman, & Darham, W. (2019). Pengaruh harga dan kualitas
pelayanan terhadap loyalitas melalui kepuasan konsumen. Jurnal
Administrasi Sosial dan Humaniora, 3(3), 40–41.
Hidayat, D.R., & Firdaus, M.R. (2014). Analisis pengaruh kualitas layanan, harga,
kepercayaan, citra perusahaan, dan kepuasan pelanggan terhadap loyalitas
pelanggan: Studi pada pelanggan Telkom Speedy di Palangka Raya. Jurnal
Wawasan Manajemen, 2(3), 237–249.
http://dx.doi.org/10.20527/jwm.v2i3.16.
Irawan, Handi. (2003). Membedah Strategi Kepuasan Pelanggan Merek. Jakarta:
Elex Media Komputindo.
Jelemone, C. (2015). Maxx Coffee, sang burung hantu hijau penyaji kopi kopi
terbaik. Retrievedfrom:https://infomoneter.com/2015/06/12/maxx-coffee-
sang-burung-hantu-hijau-penyaji-kopi-terbaik/
Kaihatu, T. S. (2012). Kepuasan konsumen yang dipengaruhi oleh kualitas layanan
dengan brand image sebagai variabel perantara: Studi kasus pada konsumen
rumah sakit swasta di kota Surabaya. Jurnal Mitra Ekonomi dan Manajemen
Bisnis, 3(2), 200–210.
Keller, K. L. (1993). Conceptualizing, measuring and managing customerbased
brand equality. Journal of Marketing, 57(1), 1 –22.
http://doi.org/10.2307/1252054.
Kinanti, R. A. N. I., & Fauzi, A.D.H. (2020). Pengaruh experiential marketing, citra
dan customer relationship marketing terhadap loyalitas; Survey pada
pelanggan rumah makan Sederhana Jatiwaringin, Jakarta Timur. Jurnal Administrasi Bisnis, 78(1), 56-65.
Kotler, P. (2000). Marketing Management. Milenium Editions, Prentice Hall Inc.
Kotler, P., & Armstrong, G. (2008). Prinsip–Prinsip Pemasaran, jilid 1. Jakarta:
Penerbit Erlangga.

Gandadinata Thamrin, Innocentius Bernarto, & Yukichika Kawata
The influence of trust, satisfaction, value, and brand image on loyalty
182 https://journal.unesa.ac.id/index.php/bisma/index
Kotler P., Hayes, T., Bloom, P.N. (2002). Marketing Professional Service. Prentice
Hall International Press.
Kotler, P., & Keller, K.L. (2012). Marketing management. England: Pearson
Education Limited.
Kurniawati, D. Suharyono, & Kusumawati, A. (2014). Pengaruh citra merek dan
kualitas produk terhadap kepuasan dan loyalitas pelanggan: Studi pada
pelanggan KFC cabang kawi Malang. Jurnal Administrasi Bisnis, 14(2), 1–9.
Laila, U. N., Rachma, N., & Priyono, A. A. (2017). Pengaruh citra merek dan
kualitas pelayanan terhadap loyalitas dengan kepuasan sebagai variabel
intervening. Jurnal Ilmiah Riset Manajemen, 6(2), 127-150.
Lamb, C. W., Hair, J. F., & McDaniel, C. (2005). Essentials of marketing. Australia:
Thomson South-Western.
Listyawati, I. H. (2019). Pengaruh fasilitas wisata, citra destinasi dan kepuasan
terhadap loyalitas wisatawan. Jurnal Bisnis Manajemen dan Akuntansi, 6(2),
36–37.
Mandalis, A. (2005). Meraih loyalitas pelanggan. BENEFIT, 9(2), 111-119.
Menperin. (2016). Gaya Hidup Dorong Industri Kopi Tumbuh. Diambil dari
https://www.kemenperin.go.id/artikel/15421/Menperin:-Gaya-Hidup-
Dorong-Industri-Kopi-Tumbuh/.
Morgan, R.M. & Hunt, S.D (1994). The Commitment-trust theory of relationship
marketing. Journal of Marketing.58(3), 20–38.
Muzammil, A., Yunus, M., & dan Darsono, N. (2017). Pengaruh kualitas pelayanan
dan citra perusahaan terhadap loyalitas pelanggan Indihome PT Telkom
Indonesia di Banda Aceh dengan kepuasan dan kepercayaan pelanggan
sebagai variabel mediasi. Banda Aceh.Jurnal Manajemen dan Inovasi, 8(3),
104–133.
Oliver, R.L. (1999). Whence consumer loyalty?. Journal of Marketing, 63, 33-44. doi:10.2307/1252099
Pi, W., & Huang, H. (2011). Effects of promotion on relationship quality and
customer loyalty in the airline industry: The relationship marketing approach.
African Journal of Business Management.5(11), 4403–4414.
Pramudyo, A. (2012). Pengaruh citra merek terhadap loyalitas melalui kepuasan
sebagai intervening.Jurnal Bisnis, Manajemen, dan Akuntansi, 1(1), 1–16.
Puspita, R., Yunus, M, & Sulaiman. (2017). Pengaruh faktor sosial, citra merek dan
kualitas produk terhadap kepercayaan merek serta dampaknya pada loyalitas
pelanggan telepon selular: Studi kasus padapengguna Samsung di kota Banda
Aceh.Jurnal Magister Manajemen, 1(1), 46–58.

BISMA (Bisnis dan Manajemen) Volume 12Issue2, April 2020 E-ISSN 2549-7790, P-ISSN 1979-7192
Page168-185
https://journal.unesa.ac.id/index.php/bisma/index 183
Rangkuti, F. (2004). The power of brand: Tehnik Mengelola Brand Equity dan
Strategi Pengembangan Merek. Jakarta: Gramedia.
Rangkuti, F. (2006). Tehnik Mengukur dan Strategi Meningkatkan Kepuasan
Pelanggan Plus Analisis Kasus PLN JP. Jakarta: Gramedia Pustaka Utama.
Rangkuti, F. (2010). Analisis SWOT Tehnik Membedah Kasus Bisnis. Jakarta:
Gramedia.
Reast, D.F. (2005). Does trust and brand extension acceptance: The
relationship.Journal of Product & Brand Management, 14(1), 4–13.
http://doi.org/10.1108/10610420510583707.
Rikang, R., & Dharma, P. (2014). Orang Indonesia Makin Gemar Minum Kopi.
Retrieved from:https://m.tempo.co/read/news/2014/06/30/092589168/orang-
indonesia-makin-gemar-minum-kopi/.
Rizal, A. S., Telagawathi, N. L. W. S., Yulianthini, N. N., & Putra, K. E. S. (2019),
Pengaruh citra merek dan harga terhadap loyalitas pelanggan sepatu merek
Nike di Singaraja futsal. Jurnal Prospek, 1(2), 38–39.
Rust, R.T., Lemon, K.N. & Zeithaml, V.A. (2004). Return on marketing: Using
marketing: Using customer equity to focus marketing strategy. Journal of
Marketing, 68(1), 109– 127. http://doi.org/10.1509/jmkg.68.1.109.24030.
Safitri, Y. A. (2011). Kepercayaan, komitmen, komunikasi, penanganan konflik,
dan perannya terhadap kepuasan terhadap loyalitas nasabah bank BCA di
Surabaya.Journal of Business and Banking, 1(2), 117–130.
Scoot, Davis. (2000). Brand Asset Management Driving Profitable Growth through
Your Brands. San Fransisco: Jossey Bass Publisher.
Setyaningsih, O. (2014). Pengaruh persepsi kualitas pelayanan e-commerce
terhadap kepuasan pelanggan, kepercayaan dan loyalitas pada produk
fashion.Jurnal Bisnis & Manajemen, 14(2), 67–80.
Shpetim, C. (2012). Exploring the relationships among service quality, satisfation,
trust and store loyalty among retail customers. Journal of
Competitiveness.4(4), 16-35. http://doi.org/10.7441/joc.2012.04.02.
Simamora, B. (2002). Aura Merek, 7 Langkah Membangun Merek yang Kuat.
Jakarta: Gramedia Pustaka Umum.
Soegoto, A. S. (2013). Persepsi nilai dan kepercayaan terhadap kepuasan dan dampaknya terhadap loyalitas konsumen. Jurnal EMBA, 1(3), 1271–1283.
Sovani, J. T., Fauzi, A., & Arifin, Z. (2016). Pengaruh penerapan corporate social
responsibility (CSR) terhadap citra merek, kepercayaan merek dan loyalitas
merek: Survei pada masyarakat sekitar PT. Tirta Investama, desa
Gandadinata Thamrin, Innocentius Bernarto, & Yukichika Kawata
The influence of trust, satisfaction, value, and brand image on loyalty
184 https://journal.unesa.ac.id/index.php/bisma/index
Keboncandi, Kecamatan Gondang Wetan, Kabupaten Pasuruan. Jurnal
Administrasi Bisnis, 10(1), 24–33.
Tjahjaningsih, E. (2013). Pengaruh citra dan promosi terhadap kepuasan pelanggan
serta dampaknya terhadap loyalitas pelanggan: Studi pada pelanggan
supermarket Carrefour di Semarang. Media Ekonomi dan Manajemen, 28(2),
13–27.
Tjiptono, F. (2001). Strategi Pemasaran. Yogyakarta: Penerbit Andi.
Yang, Z., & Peterson, R. T. (2004). Customer perceived value, satisfaction, and
loyalty: The role of switching costs. Psychology & Marketing, 21(10), 799–
822. http://doi.org/10.1002/mar.20030.
Yoeti, H. Oka A. (2005). Customer Service, Cara Efektif Memuaskan Pelanggan.
Jakarta: Pradnya Paramita.
Zeithaml, V.A. (1988). Consumer perceptions of price, quality, and value: a means
model and synthesis of evidence. Journal of Marketing, 52(3), 2–22.
http://doi.org/10.2307/1251446.
Appendix 1. Evaluasi Collinearity VIF
Loyality -
Brand Image 1.531
Trust 2.091
Satisfaction 2.776
Value 2.476
Source: Data Processed
Appendix 2. Hypothesis Testing
Hypothesis Standardized
Path Coefficient p-value Decision
H1: Trust positively influences loyalty 0.094 0.080 Declined
H2: Satisfaction positively influences
loyalty 0.428 0.000* Accepted
H3: Value positively influences loyalty 0.275 0.000* Accepted
H4: Brand image positively influences
loyalty 0.047 0.163 Declined
Note: *= significant (one-tailed test, ρ<0.05 )
Source: Data Processed
Appendix 3. Total Effects Exogenous Construct Endogenous Loyalty Construct
Brand image 0.047 Trust 0.094 Satisfaction 0.428 Value 0.275
Source: Data Processed

BISMA (Bisnis dan Manajemen) Volume 12Issue2, April 2020 E-ISSN 2549-7790, P-ISSN 1979-7192
Page168-185
https://journal.unesa.ac.id/index.php/bisma/index 185
Appendix 4. Evaluation ofR2
R2
Loyality 0,562
Source: Data Processed