Embed Size (px)
Citation preview
The influence of the solvent on the form ation of micelles in colloidal electrolytes
I. E lectrical conductivities of sodium dodecyl su lphate in ethyl alcohol-w ater m ixtures
B y A. F. H . W a rd
College of Technology, University of Manchester
( Communicated by E. K. Rideal, F— Received 10 July 1940)
In very dilute solutions in w ater sodium dodecyl sulphate behaves as a completely dissociated electrolyte. Above a concentration c = 0-00722 n the equivalent conductance {A) falls sharply and micelles are formed. To throw light on the mechanism of micelle form ation, the variation of A w it h c has been measured in a series of m ixtures of w ater and ethyl alcohol. The curves for A against f c show a gradual transition from the type associated w ith micelle formation to a uniform curve characteristic of strong electrolytes.
Addition of alcohol decreases the tendency to form micelles. W hen there is 40% or more by weight of alcohol, micelles are no longer formed. The critical concentration first falls on addition of alcohol and then rises again.The effects of alcohol addition can be interpreted satisfactorily by considering the radius of the micelle to be equal to the length of the paraffin chain and thus to be independent of the concentration and nature of the solvent.
The energy changes involved in micelle form ation are calculated. Aggregation can occur if the interfacial energy available from the destruction of the paraffin-solvent interfaces of the ions is greater th an the work to be done against electrical repulsion. The interfacial energy is no longer the greater beyond 40% of alcohol. I t is shown th a t alcohol molecules are not in solution in the paraffin interior of the micelles in the mixed solvents, b u t are strongly adsorbed on the micelle surfaces.
The influence of regions of lowered dielectric constant around the micelles is considered. This is more im portant a t high concentrations. The final fall in A w ith highly supersaturated solutions is a ttrib u ted to the increased viscosity of the solution.
An aqueous solution of a salt, one ion of which contains a long paraffin chain, shows a normal electrical conductivity at low concentrations. That is, the equivalent conductance, when plotted against the square root of the concentration, gives a straight line, in agreement with the Onsager equation. Above a critical concentration, there is a sharp fall in the conductance. This is interpreted as being caused by micelle formation (Moilliet, Collie, Robinson and Hartley 1935). McBain (1913) originally postulated the formation of micelles to explain the rise in conductance of
[ 412 ]
on August 31, 2018http://rspa.royalsocietypublishing.org/Downloaded from
soap solutions a t higher concentrations, since in such an aggregate of ions the increased charge carried would more than counterbalance the increased viscous resistance to motion. If micelle formation is to explain a fall in conductance, the smaller ions of opposite charge (gegenions) must be assumed to be carried with the micelle in close association (Hartley I935), reducing its effective charge and decreasing the number of free gegenions. In agreement with this, several independent methods show without doubt that micelles are present above the critical concentration. Measurements of the conductances of several colloidal electrolytes with high-frequency current (Schmid and Larsen 1938) show that highly charged ions are present above the critical concentrations. Similarly, the size of the particles calculated from diffusion coefficients (Hartley and Runnicles 1938), and the solubility of organic solvents in the interior of the micelles (Hartley 1938) show, in the case of cetyl pyridinium salts, tha t micelles are present above the critical concentration. The value of the critical concentration for micelle formation depends on several factors. I t is decreased by an increase in the length of the paraffin chain, by a fall in the temperature or by added electrolytes. I t may also be altered in the presence of organic substances dissolved in the water.
The object of the present investigation was to examine in detail the mechanism by which the solvent influences micelle formation. The gradual alteration in behaviour was observed on passing from aqueous solutions in which micelles are formed to alcoholic solutions where there are no micelles. The formation of micelles was examined by measuring the equivalent conductance of the solutions. Sodium dodecyl sulphate was chosen as the solute. The absence of hydrolysis with this salt makes possible accurate measurement even in great dilution. Conductance measurements in aqueous solutions have been made by Lottermoser and Piischel (1933) and by Howell and Robinson (1936). The present author has already measured conductances in mixtures of water and ethyl alcohol with very low concentrations of the salt (Ward 1939). These measurements are now extended to the highest attainable concentrations, in some cases supersaturated solutions. The maximum concentration reached with the aqueous solutions was fifteen times that of a saturated solution.
E xperimental
ApparatusThe electrical circuit was the same as that previously used by the
author. Alternating current with a frequency of 2000 cycles was given by
The influence of the solvent on micelle formation 413
on August 31, 2018http://rspa.royalsocietypublishing.org/Downloaded from

414 A. F. H. Ward
a valve oscillator. A Tinsley non-inductive resistance box and Tinsley ratio arms formed the bridge, and similar ratio arms were used for the Wagner earth. A variable condenser in parallel with the resistance box allowed complete silence to be obtained at the null point. This was determined with a valve amplifier and telephones.
Three quartz cells with lightly platinized electrodes were used. The cell constants were measured with several solutions of Kahlbaum’s potassium chloride. The specific conductances of these were of the same order as those of the solutions for which the cells were to be used. The values of the constants were 0-7403, 0-02912 and 0-01355. A sufficient volume of solution was always used in the cell so that the cell constant no longer varied with the volume.
MaterialsThe sodium dodecyl sulphate was prepared by the action of chloro-
sulphonic acid on dodecyl alcohol and the neutralization of the resulting acid with caustic soda. The salt was purified by crystallizing from water (twice) and from alcohol (five times), and by extracting with petroleum ether for 5 hr. The temperature was always kept below 60° C to avoid decomposition. An analysis gave Na 7-973%; hydrolysable S03 27-64% (theoretical values 7-979 and 27-77 %).
Conductivity water of specific conductance about 0-5 x 10~6 reciprocal ohm was obtained by fractional condensation in a silver condenser. I t was stored in silica vessels. Absolute alcohol was purified by distillation from lime. The middle fraction was collected. A little of this was refluxed with calcium shavings for 1 day, and to the resulting gel of calcium ethoxide the rest of the alcohol was added. This was refluxed for another day and then the alcohol was distilled into a silica bottle. This specimen was extremely pure and had a specific conductance of only 0-05 x 10-6 reciprocal ohm.
The alcohol-water mixtures were made by diluting redistilled rectified spirits with conductivity water. The specific gravities were measured and the compositions found from tables. Table 1 gives the values of the percentage of ethyl alcohol by weight and the corresponding specific conductances.These mixtures will be referred to by the nearest whole number in the percentage of alcohol.
ProcedureTo measure the specific conductances of the more concentrated solutions
in the small cell, the salt and the solvent were weighed directly in the cell.
on August 31, 2018http://rspa.royalsocietypublishing.org/Downloaded from

The solution was diluted either by simply adding more solvent or by first withdrawing solution and then adding solvent by the Ostwald-Arrhenius method. All withdrawals or additions were determined by weighing. For the more dilute solutions in the larger cells the pure solvent was first weighed in the cell and its conductance measured. Then known weights of a solution of suitable concentration were added from a weight pipette of borosilicate glass. This method, due originally to Whetham (1900), gives the concentration and the solvent correction more definitely than does the dilution method. For solutions in absolute alcohol, the solubility was too small to allow the concentration to be increased by adding a more concentrated solution from the weight pipette. Consequently, suitable additions of the solid were added to the solution in the cell.
The influence of the solvent on micelle formation 415
Table 1
Alcohol % Specific Alcohol % Specificby weight conductance by weight conductance
9-91 0-33 x 10-6 mho 59-37 0-11 x lO-6 mho20-02 0-21 69-23 0-1229-78 0-16 80-15 0-1239-60 0-12 93-04 0-1049-94 0-12
All m easurem ents were made at 20 ± 0-01°.The concentrations were known originally in weight normalities. Since
comparisons must be made between solutions in solvents of different densities it is necessary to convert the concentrations to volume normalities. Below concentrations of about 0-01 n the density of the solution can be taken as being the same as that of the solvent, with a maximum error of 2 parts per 1000. But for the more concentrated solutions examined here, the densities differ appreciably from those of the pure solvents and must be known. Density measurements were therefore made with solutions in each of the solvents, over the whole concentration ranges investigated. These will be the subject of a later paper, but the values obtained are used here in the calculation of equivalent conductances.
R esults and discussion
In table 2 the values of the equivalent conductance (A) at 20° are given for various values of (c = concentration in g.-equivalents per litre). The values for very low concentrations (from 00001 to about 0*01 n ) have already been published (Ward 1939) and are not included. In order to
on August 31, 2018http://rspa.royalsocietypublishing.org/Downloaded from

416 A. F . H . W ardTable 2
W ater 9-91 % alcohol
Vc A ■sjc A0-07403 61-56 0-07347 45-120-08143 61-20 0-07679 44-580-08835 60-68 0-08172 43-740-09363 59-03 0-09226 41-100-09665 56*40 0-1320 34-410-1228 43-38 0-1655 30-670-1608 34-02 0-2006 28-300-2041 29-68 0-2420 26-650-2332 28-10 0-3087 25-360-2784 26-89 0-3613 25-050-3180 26-38 0-4402 25-440-3687 26-26 0-4742 25-740-4224 26-46 0-5193 26-110-4777 26-95 0-5832 26-730-5468 27-75 0-6313 27-200-6146 28-60 0-7119 27-700-7063 29-61 0-7836 27-760-7771 30-02 0-8474 27-580-8612 30-04 0-9656 26-380-9330 29-51 1-108 23-470-9913 28-521-052 27-101-120 25-23
39-60% alcohol 49-94 % alcohol
Vc A Vc A0-1050 23-87 0-09658 22-590-1279 23-52 0-1225 22-000-1563 23-12 0-1533 21-450-1873 22-59 0-1896 20-720-2201 22-19 0-2296 20-030-2701 21-50 0-2728 19-240-J3555 20-46 0-3251 18-490-4590 19-29 0-3806 17-800-5675 18-36 0-4124 17-420-7302 16-81 0-4792 16-600-8900 15-33 0-5937 15-301-119 12-84 0-6955 14-28
0-8254 12-930-9454 11-691-044 10-68
80-15 % alcohol 93-04% alcohol
■s/c a ' Vc A0-1146 21-15 0-1266 19-440-1432 19-80 0-1648 17-180-1882 18-19 0-2131 14-930-2389 16-63 0-2591 13-370-3042 14-96 0-2973 12-300-3852 13-170-4682 11-52
20-02 % alcohol 29-78 % alcohol
■s/c A > A0-09292 34-44 0-08414 27-350-1050 33-70 0-1103 27-110-1234 32-59 0-1203 26-970-1454 31-14 0-1343 26-650-1553 30-42 0-1450 26-400-1676 29-47 0-1892 25-330-2188 26-85 0-2451 24-130-2436 26-05 0-3059 23-140-3195 24-46 0-3991 21-920-4166 23-83 0-4912 21-210-4775 23-68 0-5332 20-980-5929 23-77 0-6339 20-630-7532 23-43 0-7761 19-540-8958 22-50 0-8884 18-761-031 21-17 1-033 17-30
59-37% alcohol 69-23% alcohol
sjc A Vc A0-1248 21-17 0-1286 20-740-1579 20-45 0-1622 19-690-1954 19-65 0-2003 18-620-2308 18-90 0-2363 17-630-2974 17-66 0-3054 16-170-3850 16-27 0-3788 14-820-5009 14-62 0-5053 12-760-6491 12-75 0-6628 10-490-8407 10-53
Absolute alcoholr
sjc A0-1156 17-380-1320 15-920-1543 14-520-1770 13-29
on August 31, 2018http://rspa.royalsocietypublishing.org/Downloaded from
save space, many values, agreeing with those given in the table, are omitted.
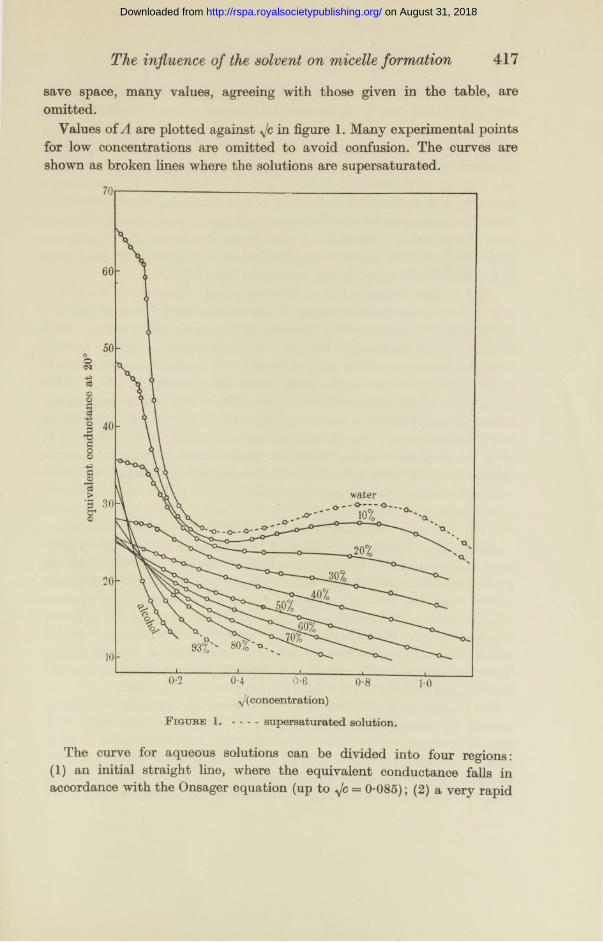
Values of A are plotted against jc in figure 1. Many experimental points for low concentrations are omitted to avoid confusion. The curves are shown as broken lines where the solutions are supersaturated.
The influence of the solvent on micelle formation 417
water
^(concentration)
F igtjbe 1. - - - - supersaturated solution.
The curve for aqueous solutions can be divided into four regions: (1) an initial straight line, where the equivalent conductance falls in accordance with the Onsager equation (up to yfc = 0-085); (2) a very rapid
on August 31, 2018http://rspa.royalsocietypublishing.org/Downloaded from

418 A. F. H. Ward
fall, reaching a minimum at Jc = 0-36; (3) a more gradual rise, to a maximum at Jc = 0-84; followed by (4) another fall, increasing in slope with increasing concentration.
When alcohol-water mixtures are used as solvents, lower values are obtained for the equivalent conductance. The values at infinite dilution (A0) first fall with increasing alcohol content (minimum at 50 % of alcohol) and then rise again. This is because of the maximum in the viscosity- concentration curve for alcohol-water mixtures. As the alcohol content rises, there is also a decrease followed by an increase in the initial slope of the linear portion of the curve. This has been interpreted by the author in terms of the Onsager theory, applied to unassociated ions.
What is more important in considering micelle formation is the alteration in the character of the curves. As alcohol is added, the rapid fall in A at the critical concentration becomes progressively less marked. With 30 % of alcohol the break in the curve is barely detectable and at 40 % of alcohol it no longer occurs. Simultaneously the maximum in the curve at higher salt concentrations becomes flatter when alcohol is added. With 20 % of alcohol the minimum and maximum have very nearly disappeared, and with 30 % of alcohol there is merely a slight decrease followed by an increase in the slope of the curve. The curves from 40 % of alcohol onwards show no unusual features. After the initial linear portions, the slopes steadily decrease with increasing salt concentration in the manner usual with concentrated salt solutions.
Sharp fall in equivalent conductanceAccording to Stokes’s law, one would expect micelle formation to cause
a rise in the equivalent conductance. Hartley (1935) explained how micelle formation could cause a fall in the equivalent conductance. The retardation of ions caused by the Coulomb forces (‘atmosphere’ effect) must increase with the charge. The mobilities will be further decreased by the inclusion of gegenions with the micelle (‘inclusion’ effect), thus decreasing both the resultant charge on the micelle and also the number of free gegenions. These two secondary effects tending to diminish A will conceal the expected increase and actually cause a fall at the critical concentration.
The manner in which these secondary effects are influenced by adding alcohol to the solvent can be considered. Addition of alcohol gives a gradual lowering of the dielectric constant and a relatively larger increase in the viscosity, up to about 40% of alcohol (see figure 2, curves 4 and 5). Onsager’s theory cannot be applied quantitatively to very highly charged ions, but it is easy to see from Onsager’s equation in which direction these
on August 31, 2018http://rspa.royalsocietypublishing.org/Downloaded from
419
alterations in dielectric constant and viscosity affect the atmosphere effect. The decrease in dielectric constant causes an increase in the atmosphere effect. The increase in viscosity causes a much bigger decrease in the effect, both by its direct action and also indirectly by decreasing On the whole, therefore, the diminution in A caused by the atmosphere effect should be smaller as alcohol is added to the solvent.
The inclusion of gegenions on to the surface of a micelle will be affected chiefly by the dielectric constant. A fall in the dielectric constant, by the addition of alcohol, should cause the gegenions to be attracted more strongly to the micelle, thus giving a bigger decrease in A. (An increased tendency towards ion association is generally found when the dielectric constant is decreased.)
Thus, the resultant alteration in A when micelles are formed at the critical concentration in alcohol mixtures will be made up from a primary increase (Stokes effect) diminished by the atmosphere and inclusion effects. The atmosphere effect will be smaller than with water and the inclusion effect larger. Now it is found experimentally that from 40 % of alcohol onwards there is no critical concentration, and the A — Jc curves are smooth. This must mean that with each mixture containing more than 40% of alcohol either there are no micelles formed or the increases and decreases in A caused by the above-mentioned effects exactly cancel each other. The latter explanation is so improbable that it can be said that the effect of increasing the alcohol content of the solvent mixture is tha t the fraction of ions which aggregate to micelles at the critical concentration is gradually decreased and falls to zero at about 40% of alcohol. As the number of micelles is thus diminished, the magnitude of the various effects produced by micelles must simultaneously become smaller, giving a progressively smaller drop in A at higher alcohol concentrations.
Critical concentrationAt the critical concentration there is equilibrium between single ions
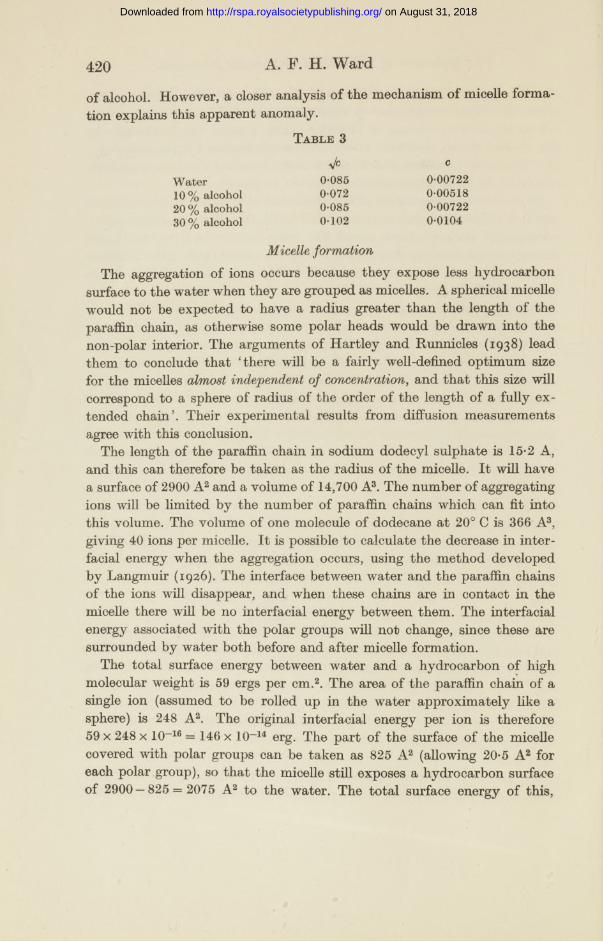
and micelles. Grindley and Bury (1929) have shown by application of the law of mass action that an appreciable increase in the number of micelles may be expected over a small increase of total concentration. If the addition of alcohol to the solutions displaces the equilibrium in the direction of single ions, one might expect that the critical concentration would be higher. Table 3 gives the values obtained for the critical concentration.
The expected increase in the critical concentration is found in the range from 10 to 30% of alcohol, but there is a fall in going from water to 10%
The influence of the solvent on micelle formation
on August 31, 2018http://rspa.royalsocietypublishing.org/Downloaded from
420 A. F. H. Ward
of alcohol. However, a closer analysis of the mechanism of micelle formation explains this apparent anomaly.
Table 3
Vc cW ater 0-085 0-0072210 % alcohol 0-072 0-0051820% alcohol 0-085 0-0072230% alcohol 0-102 0-0104
Micelle formationThe aggregation of ions occurs because they expose less hydrocarbon
surface to the water when they are grouped as micelles. A spherical micelle would not be expected to have a radius greater than the length of the paraffin chain, as otherwise some polar heads would be drawn into the non-polar interior. The arguments of Hartley and Runnicles (1938) lead them to conclude that ‘there will be a fairly well-defined optimum size for the micelles almost independent of concentration, and that this size will correspond to a sphere of radius of the order of the length of a fully extended chain’. Their experimental results from diffusion measurements agree with this conclusion.
The length of the paraffin chain in sodium dodecyl sulphate is 15-2 A, and this can therefore be taken as the radius of the micelle. I t will have a surface of 2900 A2 and a volume of 14,700 A3. The number of aggregating ions will be limited by the number of paraffin chains which can fit into this volume. The volume of one molecule of dodecane at 20° C is 366 A3, giving 40 ions per micelle. I t is possible to calculate the decrease in interfacial energy when the aggregation occurs, using the method developed by Langmuir (1926). The interface between water and the paraffin chains of the ions will disappear, and when these chains are in contact in the micelle there will be no interfacial energy between them. The interfacial energy associated with the polar groups will not change, since these are surrounded by water both before and after micelle formation.
The total surface energy between water and a hydrocarbon of high molecular weight is 59 ergs per cm.2. The area of the paraffin chain of a single ion (assumed to be rolled up in the water approximately like a sphere) is 248 A2. The original interfacial energy per ion is therefore 59 x 248 x 10~16 = 146 x 10~14 erg. The part of the surface of the micelle covered with polar groups can be taken as 825 A2 (allowing 20*5 A2 for each polar group), so that the micelle still exposes a hydrocarbon surface of 2900 — 825 = 2075 A2 to the water. The total surface energy of this,
on August 31, 2018http://rspa.royalsocietypublishing.org/Downloaded from

421
calculated per ion, is 30 x 10-14 erg. The fall in total surface energy on micelle formation is therefore 146 x 10-14 — 30 x 10~14 = 116 x 10-14 erg per ion This can be compared with the value of kT = 4x 10~14 erg.
If the interfacial energy were the only work involved in micelle formation, the Boltzmann equation would give the ratio of the number of ions united in micelles to the number of free ions = 3-9 x 10¹² JB(where Bis a constant involving the a priori probabilities of the two states). If this were so one might expect that even at great dilutions free ions would not exist. However, during micelle formation work must be done in overcoming the electrical repulsion between the ions. This cannot be calculated very definitely. The inclusion of gegenions, forming an electrical double layer round the micelle, would decrease the electrical work. The order of magnitude can be found by calculating the energy of charging of a sphere the size of the micelle with 40 electronic charges, neglecting the effect of the positive ions and assuming that the negative charges were originally separated infinitely. If the radius of the sphere of paraffin chains in the micelle is 15-2 A, it is reasonable to allow an extra 3 A for the polar groups, giving 18-2 A as the radius of the charged sphere. If the micelle is surrounded by water of dielectric constant 80 the calculated energy of charging is 3T6 x 10~14 erg per ion. This is of the same order as the interfacial energy. I t is impossible to say exactly how much the positive ions will cause this value for the electrical energy to be diminished, without knowing the number and disposition of the included gegenions. To take an extreme case, if a number of gegenions, equal to the number of negative ions, formed a layer at a distance 3 A farther from the centre than that of the negative ions, the electrical energy would be decreased to 4-6 x 10~14 erg per ion.
There is another effect which probably causes a big increase in the electrical energy. The value of the dielectric constant used in the above calculations is that of water in bulk. The value is smaller in the immediate neighbourhood of charged ions, owing to the orientation of solvent molecules (Williams 1931). This has been indicated from conductivities of sodium dodecyl sulphate at greater dilutions (Ward 1939). Sack (1927) has calculated the lowering of dielectric constant near a univalent ion in water, the value being very small within 3 or 4 A and gradually rising to 80 at about 15 A from the ion. This ‘pocket’ of lower dielectric constant occupies a greater volume the higher the valency of the ion, the radius being multiplied by Jz for a 2-valent ion. The size of the ion, as distinct from its charge, has an inappreciable effect. On the assumption that this is still true for a micelle, with 40 charges, the region of lower dielectric
The influence of the solvent on micelle formation
on August 31, 2018http://rspa.royalsocietypublishing.org/Downloaded from

422 A. F. H. Ward
constant would, extend to about 95 A from the micelle. At the critical concentration in water the distance between ions of the same sign is 61 A. If all the negative ions were to be aggregated to micelles at this concentration, their separation would be 209 A. Whether or not this estimate of the size of the region of lowered dielectric constant can be relied on accurately, it is clear that at, and above, the critical concentration it must be an appreciable fraction of the volume of the solvent near the micelles. Thus the true value of the electrical energy in micelle formation must be considerably greater than the approximate value estimated above, and may be nearer to the value of the interfacial energy.
I t is probable that the values for interfacial and electrical energy are not very different. Below the critical concentration the energy that would be obtained from the destruction of the paraffin-water interfaces is insufficient to overcome the electrical repulsions. Above the critical concentration, the ions are not so distant from each other initially and less work has to be done against the electrical forces in forming micelles. The interfacial energy is now sufficient to do this. Supporting evidence for this view is given below in considering the effects of alcohol addition. I t is known that the addition of even small concentrations of ions, particularly multivalent ions, to the solution has a considerable effect in promoting micelle formation (Powney and Addison 1937).
Micelle formation in presence of alcoholSince the size of the micelle is controlled fundamentally by the length
of the paraffin chain it should be the same in water-alcohol mixtures as in water. However, as is shown below, the charge may be different. The main difference in the micelle caused by the presence of alcohol in the solvent is that some alcohol molecules may be included in the micelle. This could occur in two ways: (1) dissolved in the paraffin interior, (2) adsorbed along the paraffin-water interface of the micelle.
No data appeared to be available on the solubility of alcohol in higher paraffins from alcohol-water mixtures. Experiments were therefore made by shaking medicinal paraffin (freed from polar impurities with Fuller’s earth) with two alcohol-water mixtures containing 10 and 30% of alcohol respectively. The alcohol which dissolved in the paraffin was extracted with water and estimated colorimetrically with concentrated sulphuric acid and potassium dichromate. Values for the partition coefficient from the two solutions were in agreement:
Concentration of alcohol in paraffin~F\------ 7— T---F-7 7— ------ 7-------- = 0*0044Concentration of alcohol in water
on August 31, 2018http://rspa.royalsocietypublishing.org/Downloaded from

(concentrations being expressed per unit volume) at 20° C. The amount of alcohol dissolved in a single micelle from the 10% alcohol mixture can be calculated from this to be 0-085 molecule. I t is clear, therefore, that the solubility of alcohol in the interior of the micelles can be neglected.
To find how much alcohol is adsorbed on the surface of the micelles, and to calculate the change in interfacial energy on micelle formation, it is desirable to know how the interfacial tension between a hydrocarbon
The influence of the solvent on micelle formation 423
2--40
% a Icohol
F igure 2. V ariation with percentage alcohol of interfacial energy (curve 2) and electrical energy (curve 3) (scale on left), interfacial tension (curve 1), dielectric constant (curve 4) and viscosity (curve 5) (scales on right).
surface and an alcohol- water mixture depends on the percentage of alcohol. Since this information was not already available, the interfacial tension was measured at 20° C by the method of Harkins and Brown (1919) between medicinal paraffin and various alcohol-water mixtures. The results are shown in figure 2, curve 1.
The interfacial tension first falls sharply as oriented alcohol molecules are adsorbed in the interface. With high alcohol concentrations, the interfacial tension does not alter much since the interface is nearly packed with alcohol molecules. The fraction of the interface occupied by alcohol can
Vol. 176. A. 28
on August 31, 2018http://rspa.royalsocietypublishing.org/Downloaded from
424 A. F. H. Ward
be estimated sufficiently accurately for the present purposes by taking it to be proportional to the fall in interfacial tension. These figures conform with the more rigid calculations of Schofield and Rideal (1925) on the constitution of the interface between air and alcohol-water mixtures.
When 10% of alcohol is added to the water, the interfacial tension is decreased by 41%, i.e. a fraction of 0-41 of the interface between the solvent and paraffin can be taken to be occupied by alcohol molecules. If there are n ions in the micelle, the paraffin surface is (2900— 20-5a) A2. Taking 21-6 A2 as the cross-sectional area of the polar head of the alcohol, the number of alcohol molecules adsorbed on the surface of the micelle
(2900 — 20-5a) x 0-41 = 2T6 *
The volume of the C2H5 groups of these, buried in the paraffin of the micelle,
= (2900-20-5'<n) x 0-41 x 61-3 A3 = 1.16(2900-20-5n) A3.
Since the total volume of the micelle is the same as in water (14,700 A3), the volume available to be filled by the paraffin chains of the ions = 14,700— 1-16(2900 — 20-5n) A3. This must equal 363 x n, the volume of n paraffin chains. Solving this equation gives the number of chains n = 33, and the number of alcohol molecules in the surface is 42.
In calculating the interfacial energy made available by micelle formation, the total surface energy should be used rather than the free surface energy or interfacial tension, as given in figure 2. However, the observed interfacial tension between medicinal paraffin and water (58-2 erg/crn.2) is not very different from the accepted value of 59 erg/cm.2 for the total interfacial energy between a higher paraffin and water, and the values with alcohol-water mixtures may also be assumed to be similar in the two cases. When account is taken of the original interfacial energy of the ions and the interfacial energy still possessed by the micelle, an energy of 65 x 1(> 14 erg per ion is available on micelle formation. This is a little more than half the corresponding energy with water as solvent.
Similar calculations have been made for other solvent mixtures and the results are shown in table 4.
The electrical energy in charging a sphere the size of the micelle is also given in each case for comparison. This is calculated as with water, taking the bulk value of the dielectric constant of the solvent. Figure 2 shows how the interfacial energy and the electrical energy vary with alcohol concentration (curves 2 and 3). There is a large fall in the interfacial
on August 31, 2018http://rspa.royalsocietypublishing.org/Downloaded from
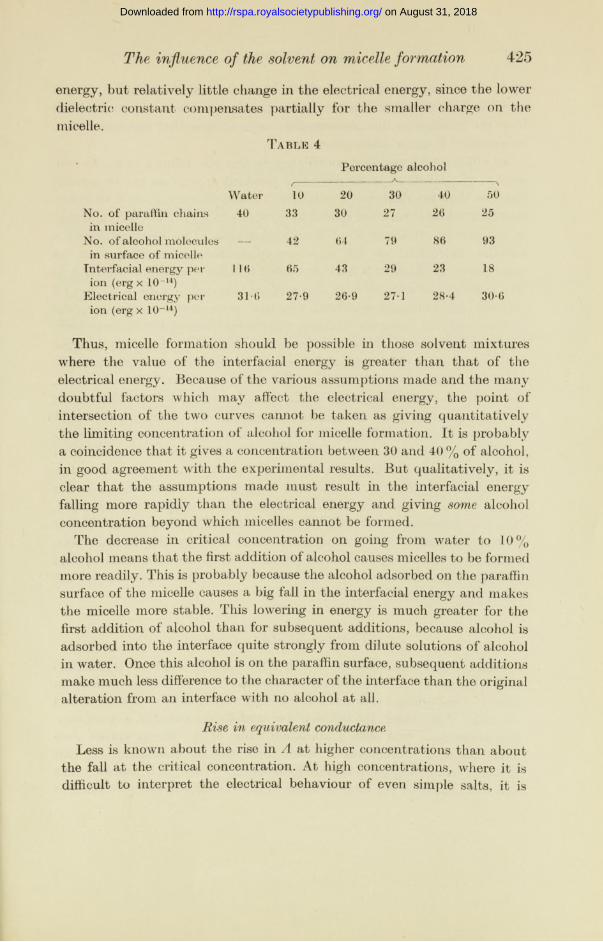
energy, but relatively little change in the electrical energy, since the lower dielectric constant compensates partially for the smaller charge on the micelle.
I 1 a b l e 4
The influence of the solvent on micelle formation 425
No. of paraffin chains in micelle
No. of alcohol molecules in surface of micelle
Tnterfacial energy per ion (erg x 10~14)
Electrical energy per ion (erg x 10~14)
Percentage alcohol
W ater 10 2040 33 30
— 42 04
1 10 65 43
31-6 27-9 20-9
30 40 5027 20 25
79 80 93
29 23 18
27-1 28-4 30-6
Thus, micelle formation should be possible in those solvent mixtures where the value of the interfacial energy is greater than that of the electrical energy. Because of the various assumptions made and the many doubtful factors which may affect the electrical energy, the point of intersection of the two curves cannot be taken as giving quantitatively the limiting concentration of alcohol for micelle formation. It is probably a coincidence that it gives a concentration between 30 and 40% of alcohol, in good agreement with the experimental results. But qualitatively, it is clear that the assumptions made must result in the interfacial energy falling more rapidly than the electrical energy and giving some alcohol concentration beyond which micelles cannot be formed.
The decrease in critical concentration on going from water to 10% alcohol means that the first addition of alcohol causes micelles to be formed more readily. This is probably because the alcohol adsorbed on the paraffin surface of the micelle causes a big fall in the interfacial energy and makes the micelle more stable. This lowering in energy is much greater for the first addition of alcohol than for subsequent additions, because alcohol is adsorbed into the interface quite strongly from dilute solutions of alcohol in water. Once this alcohol is on the paraffin surface, subsequent additions make much less difference to the character of the interface than the original alteration from an interface with no alcohol at all.
Rise in equivalent conductanceLess is known about the rise in A at higher concentrations than about
the fall at the critical concentration. At high concentrations, where it is difficult to interpret the electrical behaviour of even simple salts, it is
on August 31, 2018http://rspa.royalsocietypublishing.org/Downloaded from

426 A. F. H. Ward
impossible to say exactly what effects would be caused by highly charged micelles. There is no reason to suppose that gegenions would be desorbed from the micelles in this concentration region, since they are assumed to be adsorbed in more dilute solutions.
An effect which possibly contributes to this rise follows from the conception of pockets of lower dielectric constant around an ion or micelle. Suppose that the dielectric constant in the neighbourhood of a 40-valent micelle in water is very low indeed up to about 25 A (= ^40 x 4 A) and rises to a value of 80 about 95 A from the micelle. The distances between micelles, calculated on the approximation that all negative ions are aggregated, would be 209 A at <Jc = 0-085 (critical concentration), 80 A at *Jc = 0-36 (minimum), 46 A at ^c — 0-84 (maximum) and 36 A at <Jc = 1-2 (highest concentration reached). As the concentration increases, the pockets of lower dielectric constant from neighbouring micelles will overlap, causing a greater lowering of dielectric constant. This gives a bigger fall in A than would be calculated using the bulk value of the dielectric constant, since both atmosphere and inclusion effects are enhanced. However, when the dielectric constant of a part of the solvent near an ion is at the smallest possible value, overlapping with a similar part of the field of another ion can cause no further decrease. Thus, a t higher concentrations and small distances between the micelles, the decrease in A from atmosphere and inclusion effects is relatively not so great as a t low concentrations. Hartley (1939) has suggested the smoothing of the irregularities in the concentration of gegenions to explain the rise in A. Now the gegenions would tend to be concentrated in the pockets of lower dielectric constant, and consequently when these overlap at high concentrations, the irregularities of distribution of the gegenions would decrease. This phenomenon would therefore make more pronounced the effect suggested by Hartley.
Final fall in equivalent conductance
With alcohol-rich solvents, the sodium dodecyl sulphate crystallized very readily if the concentration exceeded the saturation value. In mixtures containing much water it was very easy to obtain supersaturated solutions. With water, the solution was actually saturated at a concentration lower than that with a minimum value of A. Measurements were made up to a concentration fifteen times that of saturation. In this region A was falling quite rapidly with concentration. I t is probable that this was caused by the large increase in the viscosity of the solution. The
on August 31, 2018http://rspa.royalsocietypublishing.org/Downloaded from
427
more concentrated solutions were like syrup, a normal solution having a viscosity of about twenty times that of water. The viscosity increase is quite sufficient to explain the final fall in A.
The influence of the solvent on micelle formation
R eferences
Grindley, J . and Bury, C. R . 1929 J . Chem. pp. 679-684.H arkins, W. D. and Brown, F. E. 1919 JChem. Soc. 41 , 499-524. H artley, G. S. 1935 Trans. Faraday Soc. 31, 31-50.
— 1938 J . Chem. Soc. pp. 1968-1975.— 1939 Kolloidzschr. 88, 22-40.
H artley, G. S. and Runnicles, D. F. 1938 Proc. Roy. Soc. A, 168, 420-439.Howell, O. R . and Robinson, H. G. B. 1936 Proc. Roy. Soc. A, 155, 386-406. Langmuir, I. 1926 A lexander’s Colloid Chemistry, 1, 525-546.Lotterm oser, A. and Piischel, F. 1933 Kolloidzschr. 63, 175-192.McBain, J . W. 1913 Trans. Faraday Soc. 9, 99-101.Moilliet, J . L., Collie, B., Robinson, C. and H artley, G. S. 1935 Trans. Faraday
Soc. 31 , 120-129.Powney, J . and Addison, C. C. 1937 Trans. Faraday Soc. 33, 1253-1260.Sack, H . 1927 Phys. Z . 28 , 199-210.Schmid, G. and Larsen, E . C. 1938 Z. Elektrochem. 44 , 651-658.Schofield, R. K. and Rideal, E . K. 1925 Proc. Roy. Soc. A, 109, 57-77.W ard, A. F. H. 1939 J . Chem. Soc. pp. 522-530.W hetham , W. C. D. 1900 Phil. Trans. A, 194, 321-360.Williams, J . W. 1931 Chem. Rev. 8, 303-319.
on August 31, 2018http://rspa.royalsocietypublishing.org/Downloaded from