Embed Size (px)
Citation preview

1990 Technical Gazette 27, 6(2020), 1990-2000
ISSN 1330-3651 (Print), ISSN 1848-6339 (Online) https://doi.org/10.17559/TV-20190222101126 Preliminary communication
The Influence of Temperature Changes on Concrete Pavement
Miloš ŠEŠLIJA, Nebojša RADOVIĆ, Goran JEFTENIĆ*, Anka STARČEV-ĆURČIN, Igor PEŠKO, Slobodan KOLAKOVIĆ
Abstract: The paper deals with the influence of temperature changes on concrete pavement. Due to differences in temperature on the upper and the lower surface of a concrete slab, the bending stress is created, resulting in concrete slab deformation. During the process of heating, the difference in temperature between the upper and the lower surface of pavement is created as a result of heat conduction. The upper surface has a tendency to expand (tense), whereas the lower one does not alter its dimensions, which results in generating the bending stress. Concrete pavement is most commonly placed in zones with extremely heavy traffic load as well as at bus stops. The analysis was carried out at bus stops in the city of Novi Sad for three different types of slab thickness. The thickness of slabs was 20, 22 and 24 cm. The testing was conducted in the longitudinal and transverse direction of the concrete pavement, both in the middle and on the edge of a slab. During the analysis of results, a conclusion was drawn that the concrete slabs were of different dimensions and thickness, and that they were placed on different subgrade reactions. The maximum values of stress were recorded in the middle of a concrete slab, in slabs whose thickness amounted to 24 cm, while the minimum stresses were identified in slabs which were 20 cm thick. The paper presents the stresses of concrete slabs, caused by changes in temperature, which depend on the subgrade reaction and dimensions of concrete slabs. Keywords: concrete pavement; stresses; temperature changes 1 INTRODUCTION
Road infrastructure presents one of the most valuable assets of a society and serves as an indicator of the national economy development [1]. In the Republic of Serbia, pavements are predominantly made of asphalt concrete. Asphalt pavements have their advantages compared to cement-concrete pavements. Stiff pavements are considerably more expensive to construct, hence their application in our country is very rare and is conditioned by a technical-economic analysis, in order to determine whether their application is justified or not. In the city of Novi Sad, an initiative was launched to replace the asphalt concrete pavement, i.e. flexible pavements at bus stops, with the new pavement constructed as stiff pavement with a cement-concrete surface [2].
Review of other literature data reveals that this was usually achieved by modeling of concrete slabs with dowels, to which the traffic load and temperature change were added. Zidri et al. [3] modeled the layers of pavement structure on which a concrete slab was placed. The load was applied by tyres, both in the middle and on the edge of a slab. The model was done in the software package ABAQUS 6.7, and it involved modeling of two 7 × 4 m slabs, mutually connected by dowels. They analysed the load stresses on the upper and the lower surface of a concrete slab. The aim was to make it possible to apply the software in modeling of this type of pavement structure, as well as to outline the logical results obtained after the adding of traffic load. Chai et al. [4] analysed the concrete pavement by applying the finite element method, the influence of temperature changes and traffic load. They presented the average daily and nightly temperatures which they used in modelling slabs and determining stress afterwards. They analysed the impact of load over a period of time, i.e. the way in which the slabs will behave between the years 2007 and 2070. Some authors [5] studied the retaining of heat in slabs. They used broken glass as an addition to concrete, in order to equalize as much as possible the temperature on the top and the bottom of a concrete slab. They made a concrete mixture of class C30/37, with a different proportion of glass in concrete (0,
9, 19 and 31%). This research was conducted in order to reduce the incidence of cracks in concrete slabs caused by temperature changes. Vineethraj et al. [6] analysed the influence of the rate of temperature penetration through concrete of various thickness. Samples were made in the form of smaller slabs of different thickness, with sensors for measuring temperature installed at the bottom, in the middle and on the top surface of a concrete slab.The slabs were made out of pure cement, with the addition of silica dust. By analysing the results, it was concluded that the concrete slabs having the thickness of 250 and 300 mm have approximately the same results in both mixtures, while the slabs with thickness of 150 and 200 mm are marked by a significant difference in results for all tested layers, ranging between 20 to 30% compared with a representative pure mixture without the addition of silica dust. The majority of authors examined the impact of temperature changes on asphalt concrete [7-9].
This paper provides the analysis of stresses on concrete slabs of various dimensions, thickness and different values of subgrade reaction coefficients. The analysis was performed on concrete slabs placed at bus stops, where the frequency of traffic is exceptionally high. 2 STRESSES IN CONCRETE SLABS
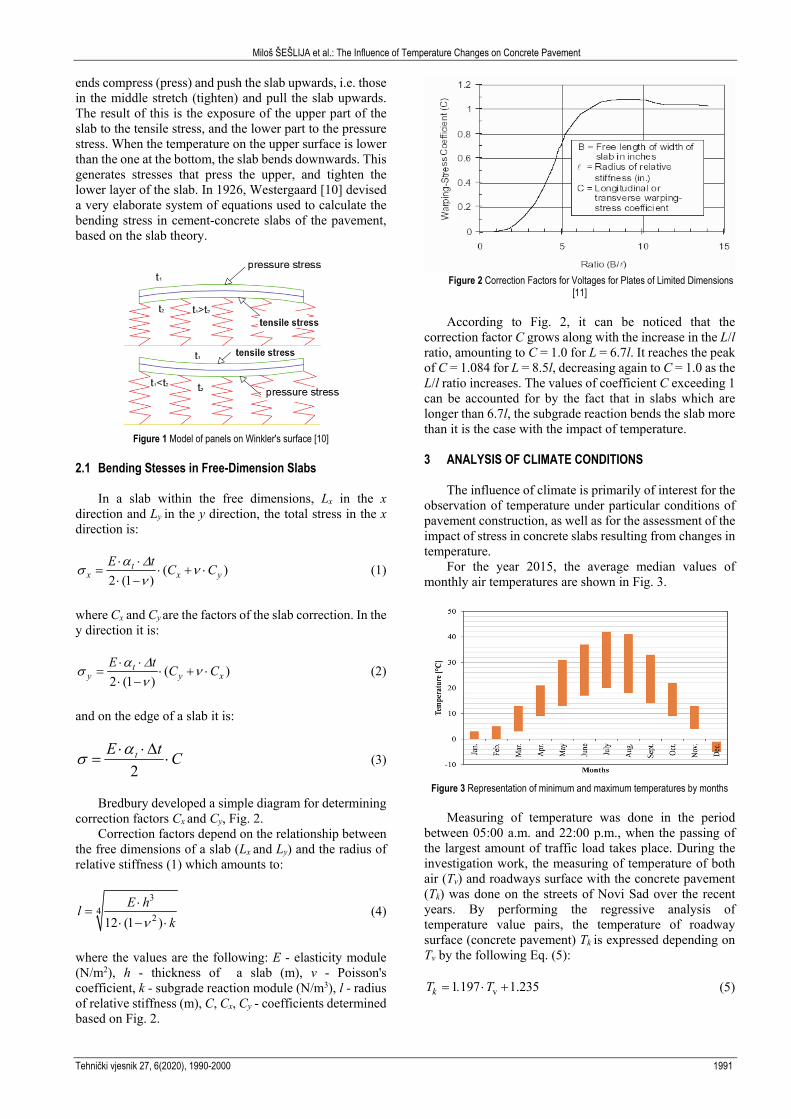
Bending stresses vary due to temperature differences between the top and the bottom layers of a concrete slab. Unless proven differently by measuring, it is reasonable to expect the maximum temperature gradient of between 0.055 and 0.077 °C/mm during the day, and about a half of this value during the night. The tests have shown that the difference in temperature between the top and the bottom layers of a slab reaches its maximum during April and May, when the highest number of bendings occurs in a year [10]. The explanation of bending stress is shown using a theory developed by Winkler, the behaviour of a slab on an elastic subgrade. Such subgrade consists of a series of springs attached to a slab, as is shown in Fig. 1.
When the temperature on the surface of a slab exceeds the one at the bottom, the fibers above the neutral axis elongate and the slab bends upwards. The springs at the
Miloš ŠEŠLIJA et al.: The Influence of Temperature Changes on Concrete Pavement
Tehnički vjesnik 27, 6(2020), 1990-2000 1991
ends compress (press) and push the slab upwards, i.e. those in the middle stretch (tighten) and pull the slab upwards. The result of this is the exposure of the upper part of the slab to the tensile stress, and the lower part to the pressure stress. When the temperature on the upper surface is lower than the one at the bottom, the slab bends downwards. This generates stresses that press the upper, and tighten the lower layer of the slab. In 1926, Westergaard [10] devised a very elaborate system of equations used to calculate the bending stress in cement-concrete slabs of the pavement, based on the slab theory.
Figure 1 Model of panels on Winkler's surface [10]
2.1 Bending Stesses in Free-Dimension Slabs
In a slab within the free dimensions, Lx in the x direction and Ly in the y direction, the total stress in the x direction is:
( )2 (1 )
tx x y
E tC C
(1)
where Cx and Cy are the factors of the slab correction. In the y direction it is:
( )2 (1 )
ty y x
E tC C
(2)
and on the edge of a slab it is:
CtE t
2
(3)
Bredbury developed a simple diagram for determining
correction factors Cx and Cy, Fig. 2. Correction factors depend on the relationship between
the free dimensions of a slab (Lx and Ly) and the radius of relative stiffness (1) which amounts to:
3
4212 (1 )
E hl
k
(4)
where the values are the following: E - elasticity module (N/m2), h - thickness of a slab (m), ν - Poisson's coefficient, k - subgrade reaction module (N/m3), l - radius of relative stiffness (m), C, Cx, Cy - coefficients determined based on Fig. 2.
Figure 2 Correction Factors for Voltages for Plates of Limited Dimensions
[11]
According to Fig. 2, it can be noticed that the correction factor C grows along with the increase in the L/l ratio, amounting to C = 1.0 for L = 6.7l. It reaches the peak of C = 1.084 for L = 8.5l, decreasing again to C = 1.0 as the L/l ratio increases. The values of coefficient C exceeding 1 can be accounted for by the fact that in slabs which are longer than 6.7l, the subgrade reaction bends the slab more than it is the case with the impact of temperature. 3 ANALYSIS OF CLIMATE CONDITIONS
The influence of climate is primarily of interest for the observation of temperature under particular conditions of pavement construction, as well as for the assessment of the impact of stress in concrete slabs resulting from changes in temperature.
For the year 2015, the average median values of monthly air temperatures are shown in Fig. 3.
Figure 3 Representation of minimum and maximum temperatures by months
Measuring of temperature was done in the period
between 05:00 a.m. and 22:00 p.m., when the passing of the largest amount of traffic load takes place. During the investigation work, the measuring of temperature of both air (Tv) and roadways surface with the concrete pavement (Tk) was done on the streets of Novi Sad over the recent years. By performing the regressive analysis of temperature value pairs, the temperature of roadway surface (concrete pavement) Tk is expressed depending on Tv by the following Eq. (5):
v1 197 1.235kT . T (5)

Miloš ŠEŠLIJA et al.: The Influence of Temperature Changes on Concrete Pavement
1992 Technical Gazette 27, 6(2020), 1990-2000
After the research was completed, the coefficient amounting to 0.983 was obtained, classifying the correlation into the group of very strong correlations. The testing was carried out over the period of three years during the months of May or June, and provided the temperatures from different locations, which made the basis for the Eq. (5). 4 ANALYSIS OF STRESS IN CONCRETE SLABS
The staring parameter in dimensioning of the concrete pavement is the width of a concrete slab. The considered slab widths are 2.50, 3.00, 3.50 and 4.00 m. The proportion between the length and width of a slab was adopted taking into consideration the fact that the smallest total influences of the effect of temperature occur when l/b = 0.8 - 1.2.
The subgrade reaction coefficient underneath the concrete slabs was determined based on the falling weight method, whereupon the values of the module were calculated, and the values of subgrade reaction were obtained, ranging from 100 to 300 MPa/m. The values which were taken here were reduced in advance, due to the certainty of calculation of stress in concrete slabs resulting from temperature. Examination of concrete slabs was
performed at bus stops in the city of Novi Sad, where the parameters of concrete slabs were adopted and shown in Tab. 1.
Table 1 Concrete plate parameters adopted Description of position Values Load on one point 47 kN Diameter load 10.9 cm Length of slab 2.0 - 4.8 m Plate width 2.5 - 4.0 m Length of plate:plate width 1:0.8 - 1:1.2 Plate thickness 20 - 24 cm Concrete quality MB 40 Elasticity module 34000 MPa Temperature gradient (Δt) 65-72 °C/m Thermal coefficient 1×10⁻⁵ 1/°C
Calculation of stress in a concrete slab was performed
for different slab widths (20, 22 and 24 cm), as well as for three different values of the subgrade reaction coefficient (k = 100, 200 and 300 MPa/m). Relevant values of stress caused by temperature changes in the characteristic points within a concrete slab in the longitudinal and transverse direction (on the edge and in the middle of a slab) were calculated.
Figure 4 Thickness plate 20 cm
Miloš ŠEŠLIJA et al.: The Influence of Temperature Changes on Concrete Pavement
Tehnički vjesnik 27, 6(2020), 1990-2000 1993
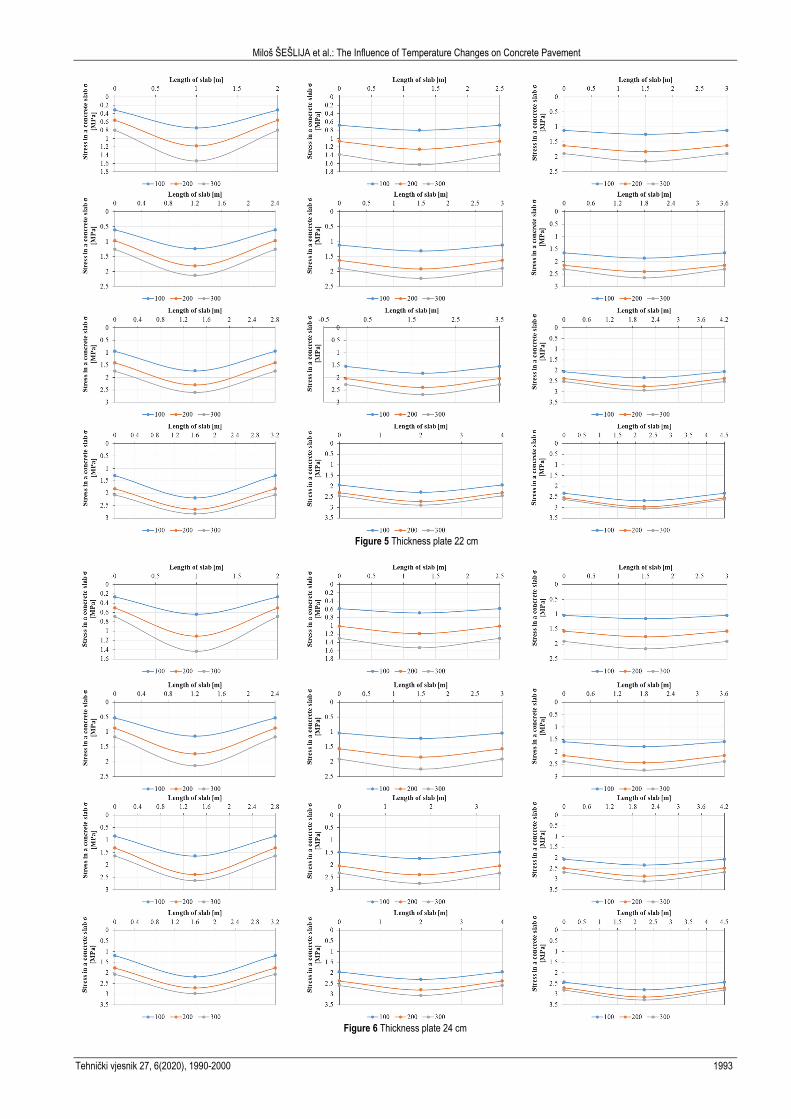
Figure 5 Thickness plate 22 cm
Figure 6 Thickness plate 24 cm

Miloš ŠEŠLIJA et al.: The Influence of Temperature Changes on Concrete Pavement
1994 Technical Gazette 27, 6(2020), 1990-2000
5 RESULTS AND DISCUSSION 5.1 Results
The overview of stress generated by temperature differences for different lengths and widths of a slab, as well as for different subgrade reactions, is shown in Fig. 4, Fig. 5 and Fig. 6. Fig. 4 presents a 20 cm thick concrete slab, where it can be observed that the lower subgrade reaction results in lower levels of stress caused by temperature changes, i.e. the increase in the subgrade reaction leads to increased values of stress in concrete slabs. When 2.5 m long slabs are concerned, a considerable difference in stress values for various subgrade reactions is noticed, whereas a > 2.5 m slab shows a smaller difference in temperature–caused stress values in the cases of 200 and 300 MPa/m subgrade reactions. For the subgrade reaction of 100 MPa/m, substantially lower levels of stress are noticed for all slab dimensions.
Fig. 5 illustrates the stress caused by temperature for 22 cm thick concrete slabs. The presentation of results is the same as that of Fig. 4. The result comments are the same as in the case of 20 cm thick concrete slabs. Slabs of up to 2.5 m feature noticable differences in stress resulting from different subgrade reactions to concrete slabs, whereas the > 2.5 m slabs are marked by the reduced stress difference caused by temperature in the cases of those placed on 200 and 300 MPa/m subgrade reaction.
Fig. 6 presents various dimensions of concrete slabs, all of which have the thickness of 24 cm. Subgrade reactions on which these slabs are placed are 100, 200 and 300 MPa/m. By analysing the presented data, the same observations were made as in the case of 20 and 22 cm slabs, the only difference relating to the fact that the increased thickness of a slab results in a reduced level of
stress. This is theoretically realistic, as a slab counteracts the temperature-generated bending stress relying on its own weight. The values of stress reduction range between 2 and 10%, which is a small difference when the analysed thickness is observed. 5.2 Discussion
The dependence between the stress and the length of a slab for different subgrade reactions is shown in Fig. 7, Fig. 8 and Fig. 9. The pictures provide the equation, along with the value of correlation coefficient which gives data regarding the reliability of the assigned correlation. Fig. 7 analyses the aforementioned dependence for 20 cm thick slabs. The stresses were analysed in the middle and on the edge of a slab. It is observed that the reliable dependence is achieved by a polynomial function. The highest value of the correlation coefficient was achieved in concrete slabs which are loaded in the centre, with the subgrade reaction of 300 MPa/m, where the value is close to the ideal correlation, i.e. it is calculated to amount to 0.999. The same value is obtained in the case of a slab with the subgrade reaction of 200 MPa/m, whereas the coefficient for the value of 100 MPa/m was 0.998. For the stresses analysed on the edges of concrete slabs, the values of the coefficient are variable, i.e. the maximum value was reached in concrete slabs placed on the subgrade reaction of 100 MPa/m. The coefficient values vary from 0.905 to 0.911. A greater dissipation of results for the stress was noticed in the cases of slabs loaded on the edge, compared to those loaded in the centre.
Figure 7 Dependence between the stress and the length of slabs for thickness of 20 cm
Figure 8 Dependence between the stress and length of slabs for thickness of 22 cm

Miloš ŠEŠLIJA et al.: The Influence of Temperature Changes on Concrete Pavement
Tehnički vjesnik 27, 6(2020), 1990-2000 1995
Fig. 8 shows the dependence between the stress and the length of slabs which have the thickness of 22 cm. The polynomial function was established and is reliable for stresses placed in the centre and on the edges of a slab. The coefficient values for concrete slabs in which the stresses were analysed in the centre show that the best coefficient was obtained in slabs placed on the 100 MPa/m subgrade. In the case of slabs in which the stresses were analysed on the edge, the maximum stress was also reached in concrete slabs placed on the 100 MPa/m subgrade, whereas the lowest value was obtained for the 300 MPa/m subgrade.
Fig. 9 outlines the dependence which has already been mentioned, but was carried out for the 24 cm thick slabs. Extending the length of a slab, the stress in the centre increases, which is not the case with the stress on the edge of the slab. In other words, by increasing the slab dimensions, the stresses in some parts decrease, as is shown in Fig. 9 right. Reliable polynomial correlations were achieved for both analysed stresses, i.e. for the stress in the middle (Fig. 9 left) caused by temperature and the stress on the edge (Fig. 9 right).
Figure 9 Dependence between the stress and length of slabs for thickness of 24 cm
Figure 10 Dependence between the satress and length of slabs for subgrade reaction of 100 MPa/m
Figure 11 Dependence between the stress and length of slabs for subgrade reaction of 200 MPa/m
Fig. 10 shows the established dependence between the
stress and the length of a slab for the same subgrade reaction, but for slabs of different thickness. With an increase in the length of a slab, the value of stress in the middle of the slab grows (Fig. 10 right). A reliable polynomial correlation was established, in which the values of the coefficient belong to the group of very strong correlations. Large dissipation of results was noticed in 20
cm thick slabs, when calculating the stress on the edge. It can be seen that the coefficient values are lower compared to slabs of different thickness.
Fig. 11 illustrates the same dependence as Fig. 10, except for the fact that the analysed results in this case were those for the 200 MPa/m subgrade. The values of correlation coefficient belong to the group of very strong correlations for concrete slabs whose stresses were

Miloš ŠEŠLIJA et al.: The Influence of Temperature Changes on Concrete Pavement
1996 Technical Gazette 27, 6(2020), 1990-2000
analysed in the middle (Fig. 11 left) and on the edge of the slab (Fig. 11 right). A polynomial correlation was established. The values of stress in the middle of the slab increase in line with the slab length increase, whereas they do not grow on the edges if the slab dimensions increase, as it is observed in Fig. 11 right. The maximum coefficients were obtained in 20 cm thick slabs, while the minimum value was achieved in the 22 cm thick slab for the stresses in the middle of the slab. At the same time, the minimum value in the 24 cm thick slabs was obtained for stresses on the edge of the slab. Fig. 12 outlines the dependence
between the stress and slab lengths for different thickness, placed on the subgrade of 300 MPa/m load capacity. Reliable polynomial correlations were established. By increasing the dimensions of slabs, the stress in the middle of a slab increases, whereas the stress on the edges features a dissipation of results. By observing the values of the correlation coefficient, it is noticeable that all the values can be classified as very strong correlation. The maximum value of coefficients was reached in a 20 cm thick concrete slab, whereas the minimum values were obtained in slabs which are 22 cm thick.
Figure 12 Dependence between the stress and length of slabs for subgrade reaction of 300 MPa/m
Following the overall analysis, 108 stresses placed in
the centre and 108 of those placed on the edge of a concrete slab were done. In other words, the total of 216 stresses for various dimensions of slabs, as well as for different values of subgrade reactions were performed. In addition to the analysed data, the statistical data processing of stresses in the concrete slabs was carried out. Stresses called tensile
stresses were analyzed, as shown in Fig. 1. In addition to the analyzed data, a statistical analysis of the data on stress in concrete slabs was made, i.e. the following figures show histograms for all types of bases and for all thicknesses of concrete slabs.
Histograms, which are defined for the slab center on a base of 100 MPa/m, are shown in Fig. 13.
Figure 13 Histograms of stress defined for the slab center, subgrade reaction of 100 MP/m for thicknesses of: a) 20 cm, b) 22 cm and c) 24 cm
Approximate uniformity with mean values is
observed, while the stress proportion over 2.0 MPa is quite common in slabs that are 22 cm and 24 cm thick. The slabs that are 20 cm thick have much smaller stress proportion which exceeds 2.0 MPa as it can be seen in Fig. 13.
Histograms of stresses determined for the edge of the concrete slab, which are located on subgrade reaction of
100 MPa/m, are given in Fig. 14. According to the figure, it is observed that there is a much higher frequency of stresses over 2 MPa at the edge of the slab than in the middle. In addition, the slab in thickness of 24 cm indicates that there are stresses reaching a value greater than 3 MPa, which is heavy load on the edge of the slab due to temperature.

Miloš ŠEŠLIJA et al.: The Influence of Temperature Changes on Concrete Pavement
Tehnički vjesnik 27, 6(2020), 1990-2000 1997
Figure 14 Histograms of stress defined for the edge of the slab on subgrade reaction of 100 MPa/m for thicknesses of: a) 20 cm, b) 22 cm and c) 24 cm
Fig. 15 shows the stress histograms in the center of the
slab for 200 MPa/m of subgrade reaction. Mean values are approximately the same for all three types of slab thicknesses. The frequency is significant for stress of about 1.75 MPa for slabs that are 20 and 22 cm thick, while
stresses higher than 2.5 MPa are quite common for slabs that are 22 and 24 cm thick. A frequency of 2.5 MPa is observed twice in 22 cm thick slabs, namely three times for 24 cm thick slabs.
Figure 15 Histograms of stress defined for the slab center, subgrade reaction of 200 MPa/m for thicknesses of: a) 20 cm, b) 22 cm and c) 24 cm
Figure. 16 Histograms of stress defined for the edge of the slab on subgrade reaction of 200 MPa/m for thicknesses of: a) 20 cm, b) 22 cm and c) 24 cm

Miloš ŠEŠLIJA et al.: The Influence of Temperature Changes on Concrete Pavement
1998 Technical Gazette 27, 6(2020), 1990-2000
Figure 17 Histograms of stress defined for the slab center, subgrade reaction of 300 MPa/m for thicknesses of: a) 20 cm, b) 22 cm and c) 24 cm
Fig. 16 shows histograms defining stresses at the edge
of the slab for 200 MPa/m of subgrade reaction. It is observed that mean values are approximately the same, the difference is seen only at the second decimal place. Twelve samples were analyzed for all slabs. Stresses that are set up during a day reach up to 3.0 MPa for slabs that are 22 and 24 cm thick.
Analyzed stresses in the center of the slab, which are located on the subgrade reaction of 300 MPa/m, are shown in histograms given in Fig. 17. The histogram shows a high frequency of stress ranging from 2 to 2.8 MPa. There are
stresses that are 3 MPa on a slab that is 24 cm thick. Mean values for all three types of slab thickness are different and a constant increase in the mean value of stress is observed.
Fig. 18 shows histograms of stress made for the edges of the slab which are on subgrade reaction of 300 MPa/m. An increase in the mean values of slab stresses is observed, as well as a uniform frequency of stresses ranging from 1.5 to 2.0 MPa on slabs in thickness of 20 and 22 cm. There is also a uniform frequency of stress on slabs that are 22 and 24 cm thick, ranging from 2.0 to 3.0 MPa.
Figure 18 Histograms of stress defined for the edge of the slab on subgrade reaction of 300 MPa/m for thicknesses of: a) 20cm, b) 22cm and c) 24cm
The following values were used in the analysis:
- Minimum values, - Maximum values, - Mean values, - Standard deviation (StDev), and - Coefficient of Variation (CV).
The statistical values are presented in Tab. 2. Calculation of the arithmetic mean (mean values) of a sample is done according to the Eq. (6):
n
xx
n
ii
1 (6)
where the following values are: x - arithmetic mean of n test results, xi - the value of each individual sample of n results, n - number of samples.

Miloš ŠEŠLIJA et al.: The Influence of Temperature Changes on Concrete Pavement
Tehnički vjesnik 27, 6(2020), 1990-2000 1999
Calculation of the value of the standard deviation (StDev) is done by using the Eq. (7):
2
1
( )n
ii
x x
n
(7)
where elements are as follows: σ - standard deviation, x - aritmetic mean of n test results, xi - the value of each individual sample of n results, n - number of samples.
The coefficient of variation (CV) is determined by using the Eq. (8), where the standard deviation needs to be calculated prior to this.
xCV
(8)
where the elements are the following: CV - the coefficient of variation of the tested property, σ - standard deviation, x - arithmetic mean of n test results.
Table 2 Statistical values for stress in the midle and edge of concrete slab Subgrade reaction /
MPa/m Load Plate thickness d / cm min / MPa max / MPa Average / MPa StDev CV
100
center 20 0.38 2.23 1.33 0.58 0.44 22 0.32 2.33 1.30 0.62 0.48 24 0.27 2.44 1.25 0.67 0.54
edge 20 0.80 2.58 1.72 0.58 0.34 22 0.75 2.69 1.69 0.63 0.37 24 0.64 2.80 1.64 0.69 0.42
200
center 20 0.64 2.37 1.70 0.53 0.31 22 0.56 2.55 1.71 0.62 0.36 24 0.50 2.71 1.70 0.69 0.40
edge 20 1.30 2.76 2.16 0.49 0.22 22 1.18 2.97 2.18 0.58 0.27 24 1.11 3.13 2.20 0.66 0.30
300
center 20 0.86 2.39 1.88 0.47 0.25 22 0.80 2.63 1.94 0.56 0.29 24 0.69 2.81 1.96 0.66 0.34
edge 20 1.60 2.80 2.36 0.41 0.17 22 1.54 3.06 2.45 0.51 0.21 24 1.44 3.28 2.50 0.61 0.24
Statistical processing of data enables us to determine the deviation from the arithmetic mean of the set, as well as whether the presentation of variability belongs to a homogeneous or heterogeneous set (KV < 0.30 homogenous set, KV > 0.30 heterogeneous set), i.e. whether the variability is considerably lower than its own arithmetic mean. After the result analysis was completed, it is noticeable that the standard deviation meets most of the conditions when the bending stresses resulting from temperature changes are compared. The values of the coefficient of variation are variable depending on the reaction of the subgrade a slab is placed on, as well as on the slab dimensions. By increasing the subgrade reaction, what is obtained is that the coefficients of variation mainly belong to the group of the homogeneous set, which is the case when the stresses are located on the edge of a slab. Conversely, when it comes to stresses located in the centre of a slab, the coefficient of variation belongs to the heterogeneous set. For concrete slabs placed on the subgrade reaction of 100 MPa/m, the obtained coefficient of variation for stresses in the centre and on the edge is heterogeneous, i.e. the variability is higher than its own arithmetic mean. By increasing the subgrade reaction, the obtained stresses are higher on concrete slabs by 90 to 120% for the same slab thickness. 6 CONCLUSIONS
This paper analyzes temperatures during the period from April to May, since the highest numbers of slab bending occur during this time of the year, due to changes in temperature during the day. Eq. (1) and Eq. (2) for the
center of the slab, or Eq. (3) for the edge of the slab were used to calculate stresses at the center and at the edge of the slab. In total, 108 different tests were carried out on different types of slabs, as well as different types of subgrade reaction. Stresses called tensile stresses have been analyzed. Based on the results presented, the following can be concluded: - Concrete slabs of up to 2.5 m in length show a considerable difference in the stresses for the slabs placed on three different subgrades, i.e. for those slabs longer than 2.5 m the difference in stresses analysed for the 200 and 300 MPa/m subgrade is substantially lower; - By increasing the thickness of a slab, the stresses get significantly lower, as the concrete counteracts with its own weight, preventing the bending of the slab due to temperature changes; - Minimum stresses were recorded on the concrete slabs placed on the subgrades of 100 MPa/m, whereas the maximum levels were recorded on the 300 MPa/m subgrade; - By establishing the correlation and presenting the results, it was concluded that the values of the coefficient of correlation belong to the group of very strong correlations, i.e. that the reliable polynomial correlation was achieved for the given results; - Statistical data processing indicated a greater difference in stresses between the minimum and maximum values. The values of the standard deviation in most cases meet the conditions when determining the bending stresses of concrete slabs caused by temperature changes. The values of the coefficient of variation are changeable and depend on the subgrade reaction, dimensions of concrete

Miloš ŠEŠLIJA et al.: The Influence of Temperature Changes on Concrete Pavement
2000 Technical Gazette 27, 6(2020), 1990-2000
slabs, as well as their thickness. In the majority of cases the coefficient of variation belongs to the homogeneous set for stresses placed on the edge of a slab, while the stresses located in the middle belong to the heterogeneous group. For concrete slabs placed on the subgrade reaction of 100 MPa/m, the values of the coefficient of variation for stresses located both in the center and on the edge belong to the heterogeneous group, i.e. the stresses are not homogeneous.
Generally speaking, the stresses in the carriageway structure that are caused by a cyclic change in temperature are a direct consequence of the change in volume because all materials are susceptible of change and mutual correlation of all layers contributes to it. If these stresses are so large that materials are not able to withstand them, there will be damages in the carriageway structure. However, during the testing of different concrete slab thickness with different subgrade reaction properties, we found that concrete slabs can withstand stresses that occur due to temperature changes in the slab. Acknowledgements
The authors extend their thanks to the Ministry of Science and Technology Development of the Republic of Serbia for its assistance, within the Technology Project TR 36017, in the realisation of the research entitled: Study of possible uses of waste and recycled materials in concrete composites with the assessment of environmental impacts, aimed at promoting sustainable civil engineering in Serbia, a part of which is presented in this paper. 7 REFERENCES [1] Radović, N., Šešlija, M., & Peško, I. (2013).
Expertprojectanalyses in the process of road maintenance management, Građevinar, 65 (7), 641-652.
https://doi.org/10.14256/JCE.833.2013 [2] Šešlija, M., Malešev, M., & Radonjanin, V. (2013).
Karakteristična oštećenja krutih kolovoznih konstrukcija na autobuskim stajalištima i mogućnost sanacija, Ocena stanja, održavanja i sanacija građevinskih objekata i naselja, Borskojezero, Srbija, 99-108.
[3] Zdiri, M., Abriak, N., Neji, J., & Ben Ouezdou, M. (2009). Modelling of the Stresses and Strains Distribution in an RCC Pavement Using the Computer Code "Abaqus", Electronic Journal of Structural Engineering, 9, 37-44.
[4] Chai, G., Staden, R., Guan, H., & Yew-Chaye, L. (2012). Impact of climate related changes in temperature on concrete pavement: A Finite Element Study, 25th ARRB Conference – Shaping the future: Linking policy, research and outcomes, Perth, Australia, 1-12.
[5] Burak Pancar, E. & Vefa Akpinar, M. (2016). Temperature Reduction of Concrete Pavement Using Glass Bead Materials, International Journal of Concrete Structures and Materials, 10 (1), 39-46. https://doi.org/10.1007/s40069-016-0130-2
[6] Math, B., Sheregar, A., & Kavitha, G. (2015). Study of temperature differential concrete slabs of varying slab thickness in different regions, European Journal of Applied Engineering and Scientific Research, 4 (2), 35-43.
[7] Hribar, D., Tušar, M., Hofko, B., & Blab, R. (2013). Influence of start temperature on tensile stress testing of restrained asphalt concrete specimens, Građevinar, 65 (11), 987-992. https://doi.org/10.14256/JCE.927.2013
[8] Matić, B., Matić, D., Sremac, S., Radović, N., & Viđikant, P. (2014). A model for the pavement temperature prediction at specified depth using neural networks, Metalurgija, 53 (4), 665-667.
[9] Leischner, S., Wellner, F., Canon Falla, G., Oeser, M., & Wang, D. (2016). Design of Thin Surfaced Asphalt Pavements, Procedia Engineering, 143, 844-853. https://doi.org/10.1016/j.proeng.2016.06.138
[10] Cvetanović, A. & Banić, B. (2007). Pavement design, Belgrade, Academic thought (in Serbian)
[11] See https://www.pavementinteractive.org/reference-desk/design/structural-design/rigid-pavement-response/
Contact information: Miloš ŠEŠLIJA, PhD, Civ. Eng., Assistant Professor University of Novi Sad, Faculty of Technical Sciences, Department of Civil Engineering and Geodesy, Trg Dositeja Obradovica 6, 21000 Novi Sad, Republic of Serbia E-mail: [email protected] Nebojša RADOVIĆ, PhD, Civ. Eng., Associate Professor University of Novi Sad, Faculty of Technical Sciences, Department of Civil Engineering and Geodesy, Trg Dositeja Obradovica 6, 21000 Novi Sad, Republic of Serbia E-mail: [email protected] Goran JEFTENIĆ, MSc, Civ. Eng., Teaching Assistant (Corresponding author) University of Novi Sad, Faculty of Technical Sciences, Department of Civil Engineering and Geodesy, Trg Dositeja Obradovica 6, 21000 Novi Sad, Republic of Serbia E-mail: [email protected] Anka STARČEV-ĆURČIN, PhD, Civ. Eng., Assistant Professor University of Novi Sad, Faculty of Technical Sciences, Department of Civil Engineering and Geodesy, Trg Dositeja Obradovica 6, 21000 Novi Sad, Republic of Serbia E-mail: [email protected] Igor PEŠKO, PhD, Civ. Eng., Associate Professor University of Novi Sad, Faculty of Technical Sciences, Department of Civil Engineering and Geodesy, Trg Dositeja Obradovica 6, 21000 Novi Sad, Republic of Serbia E-mail: [email protected] Slobodan KOLAKOVIĆ, PhD, Civ. Eng., Assistant Professor University of Novi Sad, Faculty of Technical Sciences, Department of Civil Engineering and Geodesy, Trg Dositeja Obradovica 6, 21000 Novi Sad, Republic of Serbia E-mail: [email protected]