Embed Size (px)
Citation preview
International Journal of Scientific and Research Publications, Volume 5, Issue 6, June 2015 1 ISSN 2250-3153
www.ijsrp.org
The Influence of Strategic Management Practices on Performance of Private Construction Firms in Kenya
Paul Kamau Waweru *, Dr. Jane Omwenga **
* Master of Business Administration, Jomo Kenyatta University of Agriculture and Technology ** Supervisor, Jomo Kenyatta University of Agriculture and Technology
Abstract- This study sought to investigate the influence of strategic management practices on the performance of private construction firms in Kenya. Studies have shown that world construction markets are at a tipping point already with 52% of all construction activity in emerging markets today. This is expected to increase to 63% by 2025, with China and India contributing most to growth in emerging markets. A report published by Deloitte further expounds that the East African region is turning the heads of investors, construction firms and multi-national corporations. This research was carried out on three private construction firms namely; First Acres Construction, Blue Urban Construction and Nipsan Construction Company. A total sample of 68 respondents formed the sampling frame. The researcher chose simple random sampling as a sampling technique. Primary data was collected using pre-determined questionnaires. The study used questionnaires containing closed ended, open ended, multiple choice and dichotomous questions. Likert scale questions were also used since the responses were easily quantifiable and subjective to computation. The study used both primary and secondary data. Secondary data was cited from library resources and organizational process assets such as company project reports. Statistical Package for the Social Sciences (SPSS) was used as a platform for data analysis. Data analysis was done to generate a view of how the objectives of the study were satisfied. This was done using descriptive statistics, which saw the usage of frequency tables, measures of central tendency, percentage charts, distribution tables and bar graphs. Through this study, it was established that all three construction firms have employed strategic management practices which in turn increases performance. The research carried out on this study led to identification of the crucial aspects of strategic management practices that will facilitate better management and overcome prevalent obstacles within the market players within the construction industry therefore enhance achievement of the core business objectives within the construction firms and spearhead growth and performance. Recommendations to the study were made and as well as other areas that stand to benefit from this study, were also identified. Index Terms- Architectural Competency, Corporate Branding, Stakeholders, Strategy.
I. INTRODUCTION 1.1 Background of the study ccording to Bryson (2010), strategic management can be
perceived as a structured process that engages all levels of an organization with the ultimate intention to map out a mission that defines the organization, illuminate a shared vision of the organization's trajectory and in particular, involve the structure of long term goals and objectives which encompasses financial growth and stakeholder appreciation while maintaining moral and ethical considerations in the decision making process. Wheelen and Hunger (2006) looks at strategic management as a set of managerial decisions and actions that determines the long-term performance of a firm. Literature shows that from 1980 onwards, the field of strategic management has progressed and transitioned from its primary domain in business into other disciplines. The ultimate goal however is a clear direction and increased performance within the organization. As stated by Nag et al. (2007), this includes the major intended and emergent initiative taken by senior management in utilizing organizational resources to enhance performance, while mitigating the pressures of the external environment. This brings to the fore-front the correlation between strategic management and strategy. As Johnson, Scholes and Whittington (2007) elaborate, strategy gives an organization the direction and visual scope that yields benefit both in operational efficiencies and financial targets and sustains the charted mission and vision of the organization within a challenging environment. Importance of strategic management in the construction industry is validated by its requirement for better performance. Technology, communication, and market advances are fundamentally changing the global perspectives of time, distance, and socio-economic boundaries. With the emergence of knowledge experts and industry innovations, the construction industry has undergone a tremendous dynamic trend that complement design and project construction work in almost any location, therefore having a direct influence on competition and market share. This therefore necessitates the need for the adoption of strategic management practices within construction firms while factoring in the concept of knowledge workers and domain experts, new markets and the use of information technology. According to Yates (2007), construction firms should transition from an indigenous business approach within their local conditions of operation and embrace a global perspective that is characterised by benchmarks and innovative processes that increase efficiency. As expounded by Blair (2009), construction firms are increasingly being called upon to revisit and revise their strategy in-order to leverage against a volatile market. 1.1.1 Strategic Management Process According to Carpenter & Sanders (2009), the strategic management process involves four distinct elements namely; environmental scanning, strategy formulation, strategy
A

International Journal of Scientific and Research Publications, Volume 5, Issue 6, June 2015 2 ISSN 2250-3153
www.ijsrp.org
implementation and strategy evaluation. Essentially, the strategic management process is a continuous motion of anticipating, recognizing, evaluating, resolving, controlling, documenting and learning from previous experiences in order to sustain the overall viability of the project or venture (Ibbs, Wong & Kwak, 2001; Arain and Low, 2005). Johnson and Scholes (2008), stress that organizations that use strategy seek to leverage against competitors and other external influence by configuring and using their superior resources to fulfill stakeholder expectations. Dye and Sibony (2007) support that a well thought out approach to the strategic management process is a key factor to the success and growth within the organization as well as contributing to higher satisfaction levels among those involved within the process. The first step within this process is the determination and clear structure of the company's mission and vision which defines the fundamental reason of existence of the firm and its trajectory. A strong mission statement together with situational analysis tools facilitates the formulation of a competitive strategy enabling long term commitment to all stakeholders. This results in a superior strategy that is geared towards innovation and organizational re-engineering which transforms the firm into a market leader (Hamel, 2000). The analysis stage follows, which is critical to information gathering in order to accomplish the organization's vision. This is where the needs of the organization are made explicit and identification of initiatives that will help in the growth of the firm is done. This stage is complemented by the formulation of strategy. As iterated by Johnson, Scholes and Whittington (2007), strategy gives an organization the direction and visual scope that yields benefit both in operational efficiencies and financial targets and sustains the charted mission and vision of the organization within a challenging environment. The succeeding stage involves implementation of strategy. This involves action, where all stakeholders in particular internal are made aware of their responsibilities and duties in alignment to the overall goal. Finally, the concluding stage involves structuring evaluation and control measures and defining parameters that can be used to gauge performance and attainment of targets while providing action plans for corrective measures. It is important to note however, that the strategic management process is a continuous motion and lobbies for continuous improvement of process and procedure as emphasized by (Arain and Low, 2005). 1.1.2 Construction Industry- Global Perspective According to a report published by PricewaterhouseCoopers (2013), world construction markets are at a tipping point already with 52% of all construction activity in emerging markets today. This is expected to increase to 63% by 2025, with China and India contributing most to growth in emerging markets. China overtook the US to become the world's largest construction market in 2010, and is expected to increase its global share from 18% today to 26% in 2025, despite an expected slowdown. A report published by EC Harris Research (2013), states that the UK construction industry has turned around to become one of the fastest growing sectors in the economy. It further elaborates that the changes in the international economy are creating new opportunities for Britain. To help boost the economic recovery, the government is doing all it can to help British businesses grow and have the aspiration, confidence and drive to compete in the
global race. This includes reforming the planning system, ensuring funding is available for key infrastructure projects and supporting the housing market through key initiatives such as the Help-to-Buy Equity Loan Scheme and the Funding for Lending Scheme (Harris, 2013). According to Canada’s National Economic Accounts statistics, the construction industry accounted for 7.8% of Alberta’s Gross Domestic Product in 2011. This industry had the third largest employment and its share of Alberta’s total employment increased from 8.4% in 2002 to 10.5% in 2012. The U.S. Department of Labor perceives that the demand for residential construction is expected to continue to grow. The demand for larger homes with more amenities, as well as for second homes, will continue to rise, especially as the baby boomers reach their peak earning years and can afford to spend more on housing. 1.1.3 Construction Industry- Local Perspective From a regional forefront, a report published by Deloitte, titled 'African Construction Trends Report 2013' states that East Africa is fast becoming a leading African region and a strategic hub of continental growth. Though historically one of the world’s poorest and least developed regions, it is fast tracking infrastructure development with countries such as Ethiopia having shown annual growth of over 10% per annum in recent years (Deloitte, 2013). The report further expounds the East African region is turning the heads of investors, construction firms and multi-national corporations. As aggressive development gains momentum, investors will rely on local governments to develop basic infrastructure such as rail, roads, healthcare facilities, housing, real estate and retail space. Closer to home, data from the Kenya National Bureau of Statistics shows that the construction industry in Kenya, emerged among the top performing sectors in the period alongside financial services and transport and communication. The sector grew by 10.7% compared to the dismal performance of 0.3% in the same period in 2010 and contributed Sh12.6 billion to the GDP in the period supported by massive road infrastructure projects currently in progress across the country (KNBS, 2011). 1.2 Statement of the Problem A report titled, 'The Kenyan Construction Industry 2011', published by Moramati Foundation in conjunction with Proinvest, cited a number of problems and challenges that plague the construction industry namely; poor staffing and management competencies at all levels of the construction firm, access to finance and poor planning of monies, absence of a unified legal and regulatory framework for all contractors, poor or non-maintenance of structures, inadequate supervision within the technical and managerial level, improper project designs by consultants, poor engagement with regulatory and legal stakeholders but to mention a few (Moramati Foundation, 2011). Developers and construction firms are grappling with inefficiencies both internal and external that have a massive impact on profitability and growth. Some of the major concerns within an internal perspective is the deployment and use of technology platforms to improve efficiency levels, cohesion and fluidity of various teams and professionals and the adoption of management strategies that focus on the core pillars of strategic management namely; strategic planning, strategic choice and strategic implementation. The problem that this study seeks to address is the poor management and lack of strategic roadmaps

International Journal of Scientific and Research Publications, Volume 5, Issue 6, June 2015 3 ISSN 2250-3153
www.ijsrp.org
within the structures of construction firms in Kenya. It takes into account the challenges faced by contractors namely poor management efficiencies and a weak approach to the use of strategic management practices within the holistic mission of the construction firms, with a view to study the influence of strategic management practices on the performance of private construction firms in Kenya. The investigation of these influences can lead to stronger management structures and create awareness on effective practices that can sustain the presence of construction entities that deliver quality and resonate with international practices now and in the long run. A sample of previous studies done within this area include Kagioglou, Cooper and Aouad (2001), who highlighted Performance Management in Construction: A Conceptual Framework, which focused on performance measurement approaches within construction firms. Although a valiant effort was made in drawing a link between the philosophies of organizational performance and modern tools of measure it was highly subjective to the implementation of the balanced scorecard as performance measurement tool within a construction framework and fell short on the holistic influence of strategic management practices within private construction firms and their consequent impact on performance. Another study carried out by Kamuiru (2013) shed light on the Elements of Project Management applied by Home Builders in the Construction of Single Family House; A Case of Ngoingwa Estate-Kiambu County. The study placed emphasis on the project management techniques and methods in the construction of a family houses by the contractors. Again, this study fell short of identifying the strategic management approaches that can be employed by contractors and developers that can strengthen the objectives of operational efficiencies, financial robustness and corporate profiling that can complement the delivery of quality homes therefore boosting the firm’s portfolio. Finally, a third study by Mungeria (2005), focused on professional teamwork and project performance in the construction industry in Kenya but did not capture a holistic approach of using strategy and the strategic management process for operational, functional and corporate level optimization of the vision and mission of the construction firms. The researcher has identified this area as deserving attention in exposing the strategic management practices employed within private construction firms and the influences that these practices have on the performance of the firm. The researcher will seek to find that this area has received little attention in literature in response to the problems show-cased in the public domain that plague the construction industry and the impact on the growth of the construction firm. This study therefore sought to investigate the strategic management practices in private construction firms in Kenya and the influence they have on the performance of the firm. 1.3 Objectives of the Study This section outlines the general objectives and specific objectives of this study. 1.3.1 General Objective
The general objective of this study was to investigate the influence of strategic management practices on the performance of private construction firms in Kenya. 1.3.2 Specific Objective The specific objectives of this study were;
1. To identify the influence of the elements of operational excellence to the performance of the construction firm.
2. To investigate the strategies employed at the business level that influence the performance of the construction firm.
3. To determine the adoptability of corporate level practices that influence the performance of the construction firm.
1.4 Research Questions
1. What are the elements of operational excellence that influence the performance of the construction firm?
2. What are the strategies employed at the business level that influence the performance construction firm?
3. What is the adoptability of corporate level practices that influence the performance of the construction firm?
1.5 Significance of the study This study sought to provide information on how strategic management practices influence to the performance of private construction firms in Kenya. The following stood to benefit this study; Private developers that seek knowledge on strong management approaches and best practices to leverage against their competitors; knowledge experts and managers within the construction industry namely; construction engineers, contractors, and human personnel at the three levels of the management within the construction firm; researchers and scholars of business strategy with a particular focus on the construction industry. 1.6 Scope of the study The building construction industry in Kenya is generally regulated by among others Engineers Registration Board (ERB) established by Cap 530 of the Laws of Kenya, the Board of Registration of Architects and Quantity Surveyors (BORAQS), established by Cap 525, the Physical Planners Act Cap 286, the Public Procurement and Disposal Act 2005, the Public Health Act Cap 242 and the National Environmental Management Authority. This study looked at three private building construction firms in Kenya and identify the strategic management practices used to gain competitive advantage and align the business objectives with the overall vision of the firms. It also identified the gaps within this industry and the challenges faced in the management of the construction firms. It sought to identify why some construction firms are doing better than others in an ever growing market of real estate development. The variables under study included; elements of operational excellence and execution strategies, business level practices and corporate level practices and the overall performance of the private construction firms. 1.7 Limitations The research suffers from the quality of the composition of the sample. By virtue of the small number of respondents from each firm, their characteristics were not sufficiently heterogeneous. The limited heterogeneity in respondents'

International Journal of Scientific and Research Publications, Volume 5, Issue 6, June 2015 4 ISSN 2250-3153
www.ijsrp.org
demographic characteristics could have affected both the nature and the extent of the responses obtained. The objective of this study was to look into the influences of strategic management practices on the performance of the construction firms. During the study, it was noted that these firms also experienced varying challenges in project management which as a subset of strategy has an implication on performance. This is an area that could not be covered due to the specific nature of the research objectives for this study. There is limited research study within the area of strategic management practice in the construction industry. Much scholarly material dealt with the issues of construction project management and operations management. This presented the researcher with a challenge in laying the foundations and structure for the literature review. The researcher encountered difficulties where some respondents felt that the information required was too confidential to be disclosed. To mitigate these effects, the respondents were given an assurance that findings would be made confidential and used only for the intended purpose.
II. LITERATURE REVIEW 2.1 Introduction This chapter takes a look at a theoretical review of strategic management practices within the construction industry. It commences by a reiteration of the challenges within the construction industry pointing towards the problem statement. It also highlights three theories that are directly related to the building and construction industry in respect to strategic management and drawn in parallel to the problem being investigated. This chapter expounds on a conceptual framework that exposes the variables under study and also highlights an empirical study which show cases the findings of previous studies done with a critique of the same. Finally, this chapter concludes with a summary and identification of research gaps. 2.2 Theoretical Review Construction is a complex array of interdependent activities that some would say is at best organized "chaos". The very nature of construction introduces challenges typically not encountered within other industries. The following traits give a lead as to why the construction industry differs from other typical industries namely; the work is often seasonal, each project is unique, the process is not as predictable, costs can vary according to conditions, it is difficult to manage and supply utilities and other resources instantaneously, success is dependent upon the quality of its people and professionals contracted to carry out the project and most projects are custom-oriented. According to Braimah and Ndekugri (2008), delays and disruption to contractor’s progress are a major source of claims and disputes in the construction industry. The matters often in dispute concern the dichotomy in responsibility for delays (i.e.) projects owner or
his contractors, partly because of the multifarious nature of the potential sources of delays and disruptions. Iyer and Jha (2005), attribute poor performance within the construction industry to conflict among project participants, ignorance and lack of knowledge, presence of poor project specific attributes and non-existence of cooperation, hostile socio economic and climatic condition, reluctance in timely decision , aggressive competition at tender stage and short bid preparation time. Historically according to Gray and Flanagan (1989), the foundation of measuring performance of construction firms was greatly influenced by the achievement of the strategic objectives in line with the level of productivity both from a management and supervision view point to a more business level approach of material usage. This study has exposed three theories namely; the resource based view, dynamic capability framework and the stakeholder theory, that encapsulate the variables under study as well as offer insight towards the influence of strategic management practices on the performance of construction firms and buffer a solution based approach to the challenges exposed within the problem statement. 2.2.1 Resource Based View Theory This theory was first authored by Wernerfelt (1984) and later reviewed by other contributors who expounded on the influence that both tangible and intangible assets have on the performance of an organisation (Crook et al., 2008). The resource based view theory magnifies the importance of internal resources within the firm and the use of these resources in formulating strategy to achieve sustainable advantage within the firms’ competitive markets (Schroeder et al. 2002). According to the RBV, a firm's internal capabilities determine the strategic choice it makes in competing in its external environment. This is in line with the influence that strategic management practices have on the performance of a firm. Closer within the context of the construction industry, the RBV is used to identify and explore man-power expertise and strategic planning systems that can help construction firms manage present construction projects and grab future business opportunities therefore increasing the firms portfolio. Capabilities, resources and knowledge acquired over time create options for future business exploration and gives a firm leverage over its competitors (Kogut and Kulatilaka, 2001). Within the context of the construction industry these may include, plant and machinery, planning and schedule templates, cost and financing models, professional consultants and knowledge workers as well as certified organizational processes and best practices. Loasby (2002) explores the view that investments in resources and capabilities are choice decisions made in the context of uncertainty and that it is the combination for these factors that make real options potentially valuable. In his earlier work, Wernerfelt (1984) highlighted four issues that the RBV addresses illustrated in the table below:

International Journal of Scientific and Research Publications, Volume 5, Issue 6, June 2015 5 ISSN 2250-3153
www.ijsrp.org
Table 2.1 : Factors of RBV
On which resources should a company diversify?
By analyzing a firm’s resources and capabilities in terms of diversification potential and/ or exploitability, a firm can determine which ones would be most favourable to utilize as a basis of corporate strategy formation.
Which resources should be developed further?
An internal analysis should identify areas of weakness within the firm and enable managers to address these issues.
What markets a firm should diversify into?
By firstly identifying internal strengths a firm is in a better position to identify markets where diversification resources can be exploited. By matching the internal resources and external opportunities the chances of a successful strategy being implemented is increased.
What type of firms other firms should acquire?
RBP identifies weak areas of a resource base as well as which resources are compatible with others. This knowledge will enable decision makers to make better informed judgments with regards to acquisitions and mergers.
Source: Wernerfelt, 1984 The argument of assets and capabilities is clarified by Galbreath (2005) who explains that assets are what a company "has" or owns while capabilities are what a company "does" both of which can form the basis for long term planning and strategic mapping resulting in economic success of the firm. To explain the combination of assets and capabilities further, Barney and Wright (1998) attempt to link the core resource of human capital and the competency levels and skill sets that the personnel bring on board. For this reason, there is a strong link between the corporate strategy of a firm and that of learning and development processes defined at the business level because as argued by Senge (1990), human resources play a crucial role in the attainment and success of a firms core objectives. The resources and capabilities possessed by a company are linked to the
business environment by the firm’s business processes such as material purchasing, product manufacturing and service providing (Ray et al. 2004). Performance of a firm whether short term or long term can be influenced by the exploitation of resources and capabilities that are deemed to be valuable and rare offering a greater advantage and provide leverage towards the attainment of the firm's strategic goals (Barney 1991). Therefore to attain competitive advantage, the approaches within the RBV help define and exploit the resources within the firm that are both valuable and rare and dictate that these resources should be both incomparable and non-substitutable in order to sustain market advantage.
Table 2.2 Resource Portfolio for a Construction Company
Resources Description Tangible Assets Physical Assets Raised financial capital
Cash on hand Financial investments Building and Land
Intangible Assets Intellectual Property assets Held-in-secret technology State of art equipment Construction Process Trademarks Designs Copyrights
Organizational assets Contracts Operating structure Culture HRM Policies
Reputational assets Company reputation Customer service reputation Product / service reputation
Capabilities of human capital Manager expertise Employee know-how External relationship
Source: J. G. Combs et al. 1999 2.2.2 Dynamic Capabilities Framework
This theory was authored by Teece (2007), who expounds that dynamic capabilities refer to the firm's ability to buffer its internal and external propensities in tandem with the changing

International Journal of Scientific and Research Publications, Volume 5, Issue 6, June 2015 6 ISSN 2250-3153
www.ijsrp.org
environment. Consensus within the field of strategic management highlights dynamic capabilities as having three core attributes namely; they are embedded within organizational processes, they are captured by the established routines within the firm and they are directed towards effecting change within the firm. Nelson and Winter (1982) offer a possible framework for integrating these attributes which align a firms resources and capabilities with its operational efficiencies. Eisenhardt & Martin (2000) also attempt to draw a correlation between the RBV and the dynamic capability framework by identifying the organizational processes and aligning them with the firm's resources to match or even stimulate market change. A firm's dynamic capabilities may also be viewed as the ability to develop new knowledge as argued by Henderson & Cockburn (1994) who apply the term, 'architectural competence' to increase competitive advantage. The holistic view point is that a firm concerned with optimal growth and performance should tie in their assets with their processes combined with a management that has the capability to
effectively coordinate and reorganize internal and external competences leading to market success. The ownership and utilization of dynamic capabilities provides the business firm with a chance to generate superior profitability over the longer run. When firms are dynamically competitive, management will be active at sensing and seizing opportunities. This will in turn require their ability to orchestrate non-tradable assets, so that they are in their first best use and so that co-specialization economies are captured. If a firm possesses resources and competences but lacks dynamic capabilities, it has a chance to make a competitive return for a short period, but superior returns cannot be sustained. Augier and Teece (2006) argues that the fundamental nature of dynamic capabilities approach is that competitive success stems from continuous development, and reconfiguration of specific assets that can leverage an organization against competition to give it a superior edge within its operating market.
Table 2.3 Dynamic Capabilities Framework
Dynamic Foundations Micro-foundations Sensing Analytical systems (and
Individual capabilities) to learn and to sense, filter, shape, and calibrate opportunities
Processes to direct internal R&D and select new technologies Processes to tap supplier and complementing innovation Processes to tap developments in exogenous science and technology Processes to identify target market segments, changing customer needs
Seizing Enterprise structures, procedures, designs, and incentives for seizing opportunities
Delineating the customer solution and the business model Selecting decision-making protocols Selecting enterprise boundaries to manage, complement and "control" Building loyalty and commitment
Transforming / Managing Threats
Continuous alignment and re-alignment of specific tangible and intangible assets
Decentralization and near decomposability Governance Co-specialization Knowledge management
Source: Teece, 2007 Dynamic capabilities, when well crafted, permit firms to achieve coordination and benefit from complementarities both from a resource and process perspective. Developing decision-making skills and organizational processes to sense and seize opportunities, is an essential managerial function which is encased within the dynamic capabilities framework. These functions can be the cornerstone of an economic approach to strategic management of the firm. Holistically, this has important implications for the choice and design of business models as well as for managing strategic change in organizations. According to Simon (2002), organizational structures can serve as reference points for effective decision making. He further adds that the dynamic capabilities theory recognizes broader behavioral and cultural foundations and accommodates more flexible organizational structures required in a dynamic market (Simon, 2002). The dynamic capability paradigm sees the firm as an incubator and repository for difficult-to-replicate co-specialized assets. Technological and other intangible assets are more central than tangible assets. Distinctive processes support the creation,
protection, and augmentation of firm-specific assets and competences. Competences reflect both individual skills and experiences as well as distinctive ways of doing things inside firms. The dynamic capabilities framework is offered as a guide to the understanding of complex business organizations and contemporary management practices in high performing enterprises. 2.2.3 Stakeholders Theory Contributors to this theory include Friedman and Miles (2002) and Phillips (2003). The Stakeholder theory offers another multi-dimensional approach for enterprise strategic management. The theory generally identifies five primary stakeholder groups for a company: three of them, shareholders, customers, and communities, define the external expectations of a company’s performance; the other two, suppliers, contractual professionals and employees, participate with the company to plan, design, implement and deliver the company’s products and services to its customers (Atkinson et al., 1997). According to Post (2002), stakeholders can be perceived as individuals that have a direct or indirect interest in the subject organization.

International Journal of Scientific and Research Publications, Volume 5, Issue 6, June 2015 7 ISSN 2250-3153
www.ijsrp.org
Historically, Freeman (1984) exposed stakeholders as those who can affect or in turn be affected the achievement of the defined objectives within an organization. Having its roots within strategic management, argument and discussions on stakeholder theory have pervaded other disciplines. Clarkson (1995); Hillman and Keim (2001) explored stakeholder theory within the confines of corporate social responsibility. Jonker and Foster (2002), investigated the application of stakeholder theory in environmental management and more recently, studies of stakeholder management within the construction industry have be explored (Bourne and Walker 2005; Crawford 2000; Elias, Jackson and Cavana 2004; Newcombe 2003). Freeman (1984) emphasizes that the primary focus of the stakeholder approach is the correlation of the business environment, management, internal and external organizational relationships and the promotion of shared interests with an aim of stimulation business growth and attainment of strategic objectives. Hill and Jones (1992) draws a relationship between the various actors of stakeholder management using a managerialist view that places the firm's management as center focus illustrated in the Stakeholder Wheel. Ideally, a firm's management should be able to conceptualize and digest the expectations of various stakeholders towards the endeavour of attaining the goals of the firm. Newcombe (2003) rationalizes that meaningful and impactful stakeholder management commences with identification of key stakeholders. He emphasizes that the efforts in aggregating the strategic importance of various stakeholder groups can aid the firm determine the best strategic approach to tie in all interested parties towards the endeavour. Mitchell, Agle and Wood (1997) attempt to classify various stakeholder parties in relation to their power, legitimacy and urgency towards the venture.
Within the confines of construction management, an important skill managers must possess is that of controlling and handling construction stakeholder expectation and keeping all on board (Vinten, 2000). Bourne and Walker (2005) expound that failure or inability to satisfy these expectations can result to project failure particularly if the major stakeholders and direct participants to the project are not managed well who consequently with greater political and financial influence can bring a project to a halt (Lim et al. 2005). Freeman and McVea (2001) bring to the forefront two approaches for managing stakeholders in relation to construction projects. They identify the 'buffering' and 'bridging' approach. These two approaches seek to mix both a barrier effect that limits the extent to which a stakeholder has influence towards the overall objectives but at the same time offers an 'olive branch' in effort to form common ground and plan of action therefore decreasing discontent within the trajectory of the firm's strategic roadmap. Hillman and Keim (2001) attempt to draw a link between the stakeholder theory and the RBV theory by indicating that a 'bridging' approach can provide additional resources to the firm and stimulate competitive advantage within the firm's operative markets. Harrison and St. John (1996) offer a summarized view of the balance between the level interest of the stakeholder and their power of influence within the firm's endeavour, through a power matrix. Stakeholder management concerns people and management of people. Individuals represent organisational needs as well as spearhead various stake holding functions. Stakeholder theory provides an understanding of how to deal with these needs and provides a channel in applying good stakeholder management practice.
2.3 Conceptual Framework

International Journal of Scientific and Research Publications, Volume 5, Issue 6, June 2015 8 ISSN 2250-3153
www.ijsrp.org
Figure 2.1: Relationship between Strategic Management Practices and Performance of Construction firms
2.3.1 Operational Excellence and Functional Strategies According to Analoui and Karami (2003), functional level strategy focuses on operational activities, management and control of automation systems and internal processes. As stated by Dess et al. (2010) the use of technology and developments within the sphere of innovation and design leads to improved outputs and service delivery to customers and end-users. Pearce and Robinson (2003) places emphasis on using available technological adaptations to induce product improvement and harmonize marketing techniques. Core functional areas within construction project management is the scheduling and coordination of work activities, resource allocation and management of scope and costing. These core components in construction management also present various challenges if not managed well. According to Krajewski & Ritzman (2002), operations management that forms the backbone to functional strategy has its core need in the control and management of processes, identification and removal of bottle-necks to map the outputs at the functional level to the strategic objectives. Therefore operational excellence within construction entities can be highlighted into various variables namely; automation and use of technology platforms, coordination and communication control, compliance, quality control and process improvement. Mintzberg (1994) highlights that the development of an operational strategy invokes core actors at the operational level
involved in the day to day activities during project execution such as site engineers, project schedulers to provide input towards technical architecture required for the development and deployment of information systems that would support the intended growth strategies for the firm. High-performing organizations seek to develop their own superior bodies of processes, which become the foundation of the firm’s standard operating procedures. This can be facilitated by creating a process map that provides a unified understanding of the process for all stakeholders and allows visibility of the entire endeavour or project and highlights areas of disconnect or gaps that may inflate the consequences of poor operation management at the functional level. 2.3.2 Business Strategy Practices Senior executives and managers involved in the development and implementation of business-level strategies are tasked with identifying the core competencies within the various functional departments of the company and combining them in a way that provides the company with the best opportunity for achieving and sustaining a competitive advantage in its chosen environment. The overall goal of business-level strategy is to protect the company’s position in its current domain and, if possible, enlarge the domain in which the company can operate with a competitive advantage. According to Pearson and Robinson (2003), business level strategies specify how the firm
• SMART
Business Strategy Practices • People / Team Management • Resource Assets and Capabilities • SWOT Analysis
• Internal Processes

International Journal of Scientific and Research Publications, Volume 5, Issue 6, June 2015 9 ISSN 2250-3153
www.ijsrp.org
will compete within its market arena strategy within the business level of a firm is mapped out to provide a blue print for competitive advantage. Hunger and Wheelen (2006) draw a link between the formulation of strategy in tandem with the market position a firm has within its segment. Harris and McCaffer (2001) expound that a firm should carry out a thorough investigation of its own processes and procedures, key areas of competence as well as potential business opportunites. A firm should exercise a SWOT analysis therefore effectively positioning themselves within their operative market. The business-level strategy includes decisions about which of the main types of organizational structure namely; functional, divisional or matrix, is best suited for successful execution of the company’s operational activities in each of its target markets. This points towards a link between the operation / functional level and the business level of a firm. In general, three factors are most relevant to the choice that must be made by the senior management team. First, as the range of products and services offered by the company expands the organizational structure must be able to provide increasing levels of control and coordination with respect to development, production and marketing activities. Second, as the company increases its focus on specific customer segments it will need an organizational structure that can quickly and efficiently satisfy the unique requirements of each segment. Finally, if and when the pace of new product development accelerates within the domains in which the company is competing, it must establish an organizational structure that facilitates the type of cross-functional coordination necessary for continuous innovation and refreshment of the company’s product line. Another key component within the business level strategy is people management. People and people processes provide great leverage for competitive advantage for any company. According to Gratton et al. (1999), people's skills and motivations stem from an entire portfolio of “people policies, procedures, and processes which serve to train, develop, and retain” consequently developed by the function of human resource departments. To create a binding link between business strategies and human resource management, the emphasis must be on metrics that evaluate all aspects of the business strategy, not just the financial targets but also the non-financial aspect such as employee satisfaction and motivation. As defended by Huselid (1998), sustained competitive advantage is mostly attained by enforcing effective systems of human resource management practices that “simultaneously exploit the potential for complementarities or synergies among such practices and help to implement a firm’s competitive strategy”. 2.3.3 Corporate level Strategy As illustrated by Hill and Jones (2009), corporate strategy is concerned with avenues and roadmaps structured to maximize and sustain long-term profitability and growth of the firm. Within the context of construction, Analoui and Karami (2003) identified three areas that define corporate strategy namely; diversification, internationalization or conglomerates and vertical integration. Analoui and Karami (2003) continue to expound that diversification revolves around new market penetration for growth, sentiments echoed by Smyth (2000). Internationalization invokes structuring strategic partnerships and alliances while
vertical integration looks at acquiring control over additional links within the value chain of producing and selling of services in order to reduce over-reliance of suppliers. Zeithmal and Bitner (2000) identify as part of the corporate strategy, a good corporate marketing plan should be developed which should describe the tactics that a company would use to meet its overall corporate objectives. An even more pertinent approach to corporate level strategy is corporate branding. Keller (2001) expounds on brand equity and substantiates this terminology by explaining brand equity is the differential effect that brand knowledge has on responses to the marketing of that brand. The construction sector is very competitive and branding is one avenue that the firm can gain a competitive advantage. Branding humanizes the company and allows people to make associations with favourable qualities that comprise the firms brand identity. Essentially, the benefit of branding and in particular the construction industry include trust and consistency stemming from a set of expectations which customers know that they are getting a consistently high quality product or service. Architects tend to recommend brands that they trust and are familiar with so construction product manufacturers need to cut through the clutter by building a strong and reliable brand. Another benefit includes competitive advantage. There are many companies offering similar products and services, so a firm needs to prove why they are different and this is a key component to competitive advantage. Another consideration within the corporate level strategy is that of stakeholder management. Companies are searching for ways to develop long-term, collaborative relationships with their stakeholders. These relationships involve both tangible and intangible investments. Investments and lessons learned through the process of developing a dialog and relationship with one stakeholder should add value to other stakeholder relationships. These efforts result in social capital, an asset that resides in relationships and is characterized by mutual goals and trust. Reputation management is the process of building and sustaining a company’s good name and generating positive feedback from stakeholders. The process of reputation management involves the interaction of organizational identity (how the firm wants to be viewed), organizational image (how stakeholders initially perceive the firm), organizational performance (actual interaction between the company and stakeholders), and organizational reputation (the collective view of stakeholders after interactions with the company). Stakeholders will reassess their views of the company on the basis of how the company has actually performed. 2.3.4 Performance of private construction firms Growth and increased performance is developed by identifying and seeking out new opportunities, promoting the firm’s products and services, including responsibility for technical appraisals and supply of advice to customers on all aspects of the firm’s business from procurement to final delivery. The construction industry's core business is undertaking projects in erecting new structures or refurbishing existing ones for a variety of clients. According to Ward et al (1991), the success or failure of construction projects has been pegged on the pillars of cost, time and quality achieved. Kagioglou et al (1998) proposes additional approaches or philosophies as measures of performance within the construction industry. These include BPR
International Journal of Scientific and Research Publications, Volume 5, Issue 6, June 2015 10 ISSN 2250-3153
www.ijsrp.org
(business process re-engineering), TQM (total quality management), CP (continuous improvement) and BPM (business process management). As argued by Kagioglou et al (1998), this has a holistic view of performance and does not concentrate measure of success on the traditional pillars of cost, quality and time. A report compiled by the U.K best practices program (bprc, 1999) highlighted various KPI's that can be used as measures of performance namely; defects, productivity levels, client satisfaction, cost / profitability and health and safety. These measures are directly related to the strategic objectives set as the core nature of business entities is to perpetuate success through a robust and successful road map chartered through the firm’s mission and vision. It therefore involves the development of a framework upon which performance measures can be developed and implemented as to identify the degree to which an organisation is able to implement its strategy. According to Takim and Akintoye (2002), construction projects encompass a
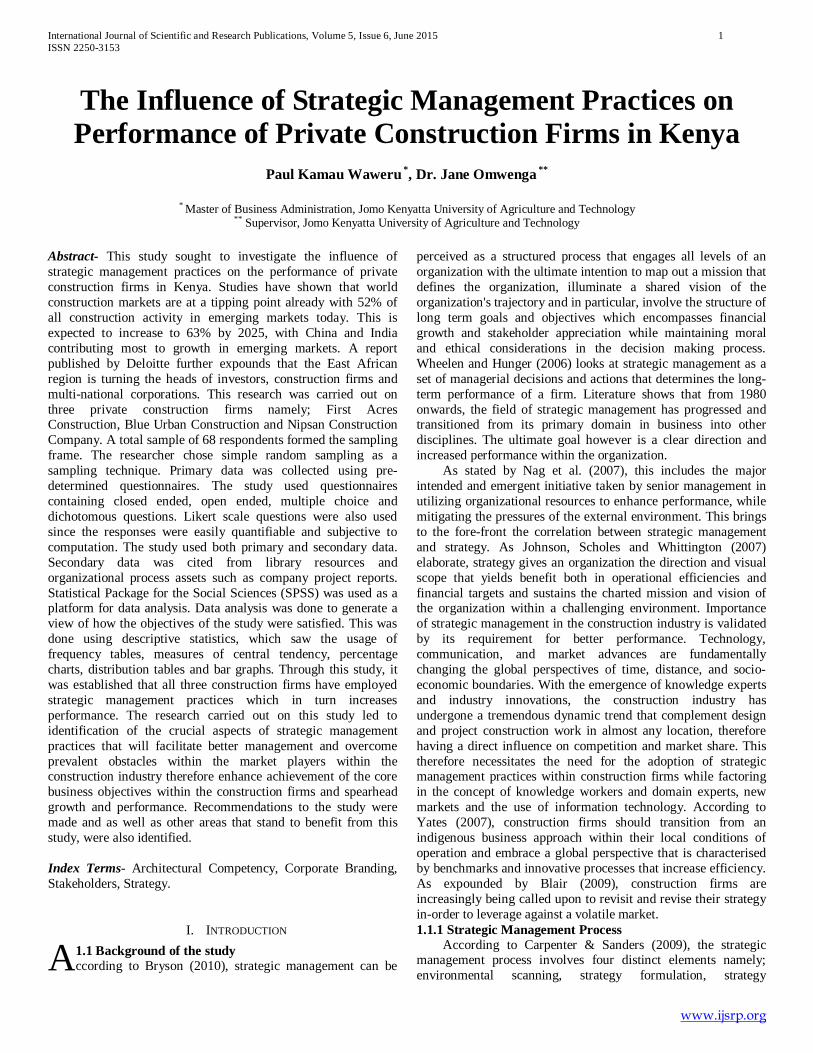
number of phases, stakeholders, processes that require a great deal of input in the form of tangible and intangible resources. The level of success in a project which translates to the performance of the construction firm largely depends on the expertise of management, financial, technical and organizational process flows. Chan and Tam (2000) emphasize that just as in any industry, the key success factor or rating is based on quality. A construction project is deemed successful when it is completed on time, within budget and in accordance to the primary stakeholder's specifications. According to Hanson et al.(2003) there are several factors that if not mitigated properly can have a negative impact on the performance of the construction firm. These include; poor conflict resolution procedures and poor workmanship. The generally perceived factors that influence quality performance can be grouped under the headings of client, project, project environment, project team leaders, project procedures and project management procedures (Chan and Tam, 2000).
Fig. 2.5: Contractor Performance
(Chan and Tam, 2000) 2.4 Empirical Review An attempt to draw a link between strategic management practices and the growth of the construction industry has been made with previous studies done highlighting organizational performance of construction firms as the key dependent variable. A study conducted by Kagioglou, Cooper and Aouad (2001), expounded on performance management in construction. The researchers discussed that the measurement of an organisation’s current and past performance is an important issue, which has been considered closely in the past decade. The researchers highlight that it involves the development of a framework upon which performance measures can be developed and implemented as to identify the degree to which an organisation is able to
implement its strategy. The researchers presented a performance process conceptual framework (PPF) which integrates the main themes of performance management in a simple matrix like arrangement. Its basis was on the balanced scorecard (BSC) but included the addition of the ‘project’ and ‘supplier’ perspectives, which in the view of the researchers were specific for the construction industry. Another study carried out by Kamuiru (2013) shed light on the Elements of Project Management applied by Home Builders in the Construction of Single Family House; A Case of Ngoingwa Estate- Kiambu County. The study placed emphasis on the project management techniques and methods in the construction of a family houses by the contractors. The finding of

International Journal of Scientific and Research Publications, Volume 5, Issue 6, June 2015 11 ISSN 2250-3153
www.ijsrp.org
the study exposed that once the contract is awarded, the first action plan the home builder did was to search for material suppliers and to seek for the second opinions of what needed to be done before commencement of the work. The researcher recommended that project management methodologies be applied and implemented within the context of building and construction of family housing which would improve the performance and increase the productivity of contractors. A third study was done by Mungeria (2005) which focused on professional teamwork and project performance in the construction industry in Kenya. The purpose of this study was to establish the factors leading to effective team work management of professional firms in the building construction industry in Kenya, to determine the extent to which teamwork management of professional firms has been employed in the construction industry in Kenya; to evaluate the relationship between teamwork management of professional firms in the construction industry and successful completion of construction projects in Kenya and to establish the challenges facing the teamwork management of professional firms in the construction industry in Kenya. The findings revealed that effective teamwork is determined by good team leadership, project atmosphere, project members and project management strategies. 2.5 Critique of the existing literature Within the first study conducted by Kagioglou, Cooper and Aouad (2001), although a valiant effort was made in drawing a link between the philosophies of organizational performance and modern tools of measure, it was highly subjective to the implementation of the balanced scorecard as performance measurement tool within a construction framework and fell short of describing the holistic influence of strategic management practices within private construction firms and their consequent impact on performance. Within the second and third study by Kamuiru (2013) and Mungeria (2005), looked at project management techniques and effective teamwork management respectively, which is an important consideration in construction management. Project management is an important domain of practice that is perceived as a temporary endeavour with a definite start and end to produce a unique product or service. Team management is a core facet to achieving synergy within the confines of targeted business outcomes. The two studies predispose project management and teamwork as sub entities and not the overall influence to organisational performance of construction firms. Both studies took a narrower approach and did not capture or pinpoint the holistic influences of strategic management practices on the performance of construction firms. 2.6 Research Gap The researcher identified this area as deserving attention since none of the studies highlighted addressed the influence of strategic management practices on the performance of private construction firms in Kenya. The researcher identified a gap in evidence of approaches of using strategy and the strategic management process for operational, functional and corporate level optimization of the vision and mission of the construction firms and performance their performance. 2.7 Summary This chapter took a look at a theoretical review of strategic management practices within the construction industry. It commenced by a reiteration of the challenges within the
construction industry pointing towards the problem statement. It also highlighted three theories that are directly related to the building and construction industry in respect to strategic management and drew in parallel to the problem being investigated. This chapter expounded on a conceptual framework that exposed the variables under study and also highlighted an empirical study which show cased the findings of previous studies done with a critique of the same.
III. METHODOLOGY 3.1 Introduction This chapter describes the research methodology that was employed within the study. The research methodology is the process used to collect information and data for the purpose of making business decisions. The methodology may include publication research, interviews, surveys and other research techniques, and could include both present and historical information. The research methodology may also be viewed as the procedural plan that is adopted to provide validity, objectivity, accuracy and economic metrics to the defined research questions. The researcher in this section provided an overview of the research design, target population, sampling frame, sampling technique, data collection instruments as well as defined the procedures and analysis of data that was employed within the study. 3.2 Research Design Research design refers to the arrangement of conditions for the collection and analysis of data in a manner that aims to combine relevance to the research purpose with economy in the procedure (Babbie, 2002). This study adopted a descriptive design. This design refers to a set of methods and procedures that describe variables. It involves gathering data that describe events and then organizes, tabulates, depicts and describes data. Descriptive studies portray the variables by answering who, what and how (Babbie, 2002). According to Cooper and Schindler (2004), a study was concerned with finding out who, what, where, when and how of a phenomenon is a descriptive study, which is the concern of the proposed research project. The variables under study included; elements of operational excellence and execution strategies which encompasses the firm's internal processes, level of resource optimization and level of use of automation; business level practices which exposed measures on team management and positioning models such as SWOT analysis; corporate level practices which sought to measure the extent of stakeholder management, influence of corporate branding and use of models to measure external influences; and the overall performance of the private construction firms. A cross-sectional survey on three private construction companies from which data was collected, was performed in this study. 3.3 Population The study population comprises the entire groups of individuals, objects, items, cases, articles or things with common attributes or characteristics existing in space at a particular point of time (Baker, 1999; Majumdar, 2005). The study population comprised of 62 building construction and consulting companies in Kenya as at September, 2014. According to Mugenda and Mugenda (2003), a target population is that population which the researcher wants to generalize results. The target population for

International Journal of Scientific and Research Publications, Volume 5, Issue 6, June 2015 12 ISSN 2250-3153
www.ijsrp.org
this study identified all the employees both contractual and permanent in the three construction firms identified from the
study population.
Table 3.1 : List of Registered Contractors in Kenya
Name of Construction Firm Name of Construction Firm Mecada Contractors Blue Urban Construction Ltd. Elsek And Elsek Construction Dawda Group Construction Limited Intex Construction First Arces Construction Ltd. Jaha Construction Company Archbuild Limited Erdemann Limited Arcs Africa Ltd Kingspride Contractors Ltd Dara Consulting Ltd Mutungechi Contractors Ltd. Nipsan Construction Ltd. Garden Real Development Contractors Ltd Dankie Limited Xilman Contractors Limited Barker And Barton Kenya Developing Africa Construstion Limited Becam Constractors Ltd Frame Consultants Ltd Dinara Developers Limited Lee Construction Ltd Elgon Towers Construction Company Limited Rex Construction Consultants Ltd Homeland Real Estate Development Ltd Simba Corp. Innovative Planning And Design Consultants E.D.G. & Atelier Construction Cost Consultancy Mavji Construction Ltd Ecocare Consultants Edarns Enterprises Ltd. Gugobuild Ltd AMS Construction Kings Developers Intersec Construction Consultants SDS Construction Ltd Urbanis Africa Intersec Technical Kenya Limited Africost Kenya Consulting Quantity Surveyors J. S. Kalsi Contractors & Associates Bella Line Interor Contractors Ltd Oaks Construction Company Limited Classic Mouldings Contractors Building Scope Limited Adventis In-house Africa Civicon Engineering Africa Chania Gardens Limited Costing Consult Contractors Contrastrict Associates Image 360 Designs Ltd Actis Construction Midroc Construction Limited Cuak Construction Archens Company Limited Acorn Group Limited Bluebell Construction Limited Aktasis Construction Consultants Parbat Siyani Construction Limited Arprim Contractors Gibb Africa Ltd
Source: National Construction Authority, 2014

International Journal of Scientific and Research Publications, Volume 5, Issue 6, June 2015 13 ISSN 2250-3153
www.ijsrp.org
At present, the employee structure of the three firms stands as follows;
Table 3.2: Target Population
Name of Construction Firm Employee Number (Contracted)
Employee Number (Permanent)
First Arces Construction Ltd. 70 20 Blue Urban Construction Ltd. 50 15 Nipsan Construction Ltd. 65 10
3.4 Sample Size and Sampling Technique 3.4.1 Sampling Frame A sample is a subset of a particular population while sampling is the practice concerned with the selection of individual observations intended to yield some knowledge about a population of concern especially for the purpose of statistical inference (Mugenda and Mugenda, 2003). The sample size is a
representative of the target population. According to Mugenda and Mugenda (2003) a researcher would have to use 30% of the total target population as a sample size for it to be accepted as a good representative sample. Thus, a total sample of 68 respondents were selected from the target population. This was obtained using the formula illustrated below:
Total Number of Employees in the
construction firms

International Journal of Scientific and Research Publications, Volume 5, Issue 6, June 2015 14 ISSN 2250-3153
www.ijsrp.org
Table 3.3 Sampling Frame
Name of Construction Firm Employee Number (Contracted)
Employee Number (Permanent)
30% Sample Size (Contracted) n
30% Sample Size (Permanent) n
First Arces Construction Ltd. 70 20 21 6 Blue Urban Construction Ltd. 50 15 15 4 Nipsan Construction Ltd. 65 10 19 3 Total 185 45 55 13
Therefore, total sampling frame = (contracted (n) ) + ( permanent (n) ) = 68 respondents 3.4.2 Sampling Techniques The researcher chose to use simple random sampling because of the following reason namely; the ease of assembling the sample. It was considered as a fair way of selecting a sample from a given population since every member was given equal opportunities of being selected; due to the representativeness of a sample obtained by simple random sampling, it was reasonable to make generalizations from the results of the sample back to the population as one of the goals of research was to be able to make conclusions pertaining to the population from the results obtained from a sample. 3.5 Data Collection Instruments Primary data was collected using pre-determined questionnaires. The study used questionnaires containing closed ended, open ended, multiple choice and dichotomous questions. According to Creswell (1994), data collection methods for primary data include; structured and semi-structured questionnaires, mailed questionnaires, structured and semi-structured interviews (personal and telephone interviews), observation and focus groups. Likert scale questions were also used since the responses are easily quantifiable and subjective to
computation. Since it does not require the participant to provide a simple and concrete yes or no answer, it does not force the participant to take a stand on a particular topic, but allows them to respond in a degree of agreement; this makes question answering easier on the respondent. Unstructured questions (where respondents were to answer based on the knowledge one has) was used so as to encourage the respondents to give an in-depth and felt response without feeling held back in revealing any relevant information. Secondary data was sourced from organizational process assets and published materials. 3.6 Data Collection Procedures The study used both primary and secondary data. Secondary data was cited from library resources and organizational process assets such as company project reports. The drop and pick method was used to collect primary data. 3.7 Pilot Testing According to Connelly (2008), extant literature suggests that a pilot study sample should be 10% of the sample projected for the larger parent study. Prior to the main study, a pilot study was conducted with 7 employees of a different contractor company. This process was to help refine the questionnaire, enhance its legibility and minimize the chances of misinterpretation. This was obtained using the formula illustrated below:
3.7.1 Reliability Reliability refers to a measure of the degree to which research instruments yield consistent results (Mugenda and Mugenda, 2003). In this study, reliability was ascertained by pre-testing the questionnaire with a selected sample of employees from a different firm to avert biasness. 3.7.2 Validity The accuracy of data collected largely depended on the data collection instruments in terms of validity. Validity as noted by Robinson (2002) is the degree to which result obtained from the analysis of the data actually represents the phenomenon under study. Validity was ascertained by having all the objective questions included in the questionnaire. 3.8 Data Presentation and Analysis 3.8.1 Data Analysis Common data collection methods used in qualitative research are focus groups, in-depth interviews, uninterrupted observations, interviews with managers regarding strategic decision making, how they perceive it and what they use as a guide to making these decisions. Statistical applications such as
Statistical Package for the Social Sciences (SPSS) was used as a platform for data analysis. Data analysis was done to generate a view of how the objectives were to be achieved. This was done using descriptive statistics, which saw the use of frequency tables, percentage charts/ pie charts, distribution tables and bar graphs. 3.8.2 Data Presentation According to Miller (1991), descriptive statistics is used to describe data collected from a sample. The mean, median, percentage, mode and standard deviation are the most commonly used descriptive statistics. Measures of central tendency were used in this study to give a description of the data. Graphs bar and pie charts was used for further representation.
IV. RESEARCH FINDINGS AND DISCUSSIONS 4.1 Introduction This chapter presents the findings from the respondents from three construction firms namely; First Acres, Nipsan and
68 = 6.8 Ω 7

International Journal of Scientific and Research Publications, Volume 5, Issue 6, June 2015 15 ISSN 2250-3153
www.ijsrp.org
Blue Urban Construction Company who were drawn from the three levels of the organizational structure. The operational level included labourers, foremen and site engineers; the business level encompassed business developers / marketing and sales staff and corporate level included C-level management such as the managing directors, project manager and finance directors. They were given questionnaires to fill out of which data was collected,
analyzed and interpreted. The results are presented in form of tables and charts 4.2 Response Rate Out of 68 questionnaires that were issued 56 were filled and returned. This gave 82.35% response rate of the study. The respondents from the three companies were distributed in table below.
Table 4.1: Frequency Table of title of Respondents
Organization structure Frequency Percent Cumulative Percent Business Level 14 25 25 Corporate Level 7 12.5 37.5 Operational Level 35 62.5 100 Total 56
From table 4.1, 62.5% of the respondents were employed at operation level, 12.5% were from corporate level and 25% were from business level. This indicates that majority were from operational level. 4.3 General Information on Respondents 4.3.1 Gender From the study regarding gender of the respondents it was revealed that majority were male as shown in figure 4.1 below.
Gender
92.9%
7.1%
Male
Female
Figure 4.1: Gender Pie-Chart
From figure 4.1 regarding gender, 92.9% were male and 7.1% of the respondents were female. This indicates that majority of the employees in construction industry as men. 4.3.2 Age of the respondents Age of the respondents were as in the table below:
Table 4.2 Descriptive Statistics of age of Respondents
N Minimum Maximum Mean Std. Deviation Age 56 26 48 32.57 4.902 Valid N (list wise) 56

International Journal of Scientific and Research Publications, Volume 5, Issue 6, June 2015 16 ISSN 2250-3153
www.ijsrp.org
From table 4.2, the average age of all of respondents was found to be 32.57 years of age. The minimum age being 26 and maximum age being 48 years. The standard deviation was 4.902 which is small and it indicates that majority of the respondents had almost the same age being close to the average age. 4.3.3 Years of Service Years of service for each respondents was summarized in the figure 4.2
Figure 4.2: Year of Service
From fig 4.2, 14.286% of the employees have worked for less than one year, 5.35% have worked for 6-10 years and majority of around 80.36% have worked between 1-5 years. This indicates that many of the respondents had worked for the Construction Companies for a good time and hence data was collected from more experienced respondents. 4.3.4 Level of Practice Level of Practice of the respondents was observed to be as in the figure 4.3
Figure 4.3: Level of Practice of Respondents
From figure 4.3, 26.78% of the respondents are practicing building consultants, 21.43% are skilled labours, 35.71% are semi-skilled and 16.07% hade other levels of practice in the company.

International Journal of Scientific and Research Publications, Volume 5, Issue 6, June 2015 17 ISSN 2250-3153
www.ijsrp.org
4.3.5 Other Level of practices
Table 4.3 Frequency Table of Other Levels of Practice
Frequency Percent Valid Percent Cumulative Percent
Valid
No. of Response 47 83.9 83.9 83.9 Office Staff 9 16.1 16.1 100.0
Total 56 100.0 100.0 From table 4.3, the respondents were asked to specify their other levels of practice, 83.9% of the respondents had no other levels of practice, and 16.1% were office staff. 4.4 Operation Excellence Strategies 4.4.1 Use of Automated System Respondents were asked if the firm uses automated system for planning and Management of construction timelines and milestone and they responded as follows
Automated system for planning
and management
73.2%
26.8%
Yes
No
Figure 4.4 Automated system for planning and Management
From figure 4.4, 73.2% of the respondents accepted that they are using automated system for planning and management of construction timelines and milestone while 26.8% said that they do not use the system.
International Journal of Scientific and Research Publications, Volume 5, Issue 6, June 2015 18 ISSN 2250-3153
www.ijsrp.org
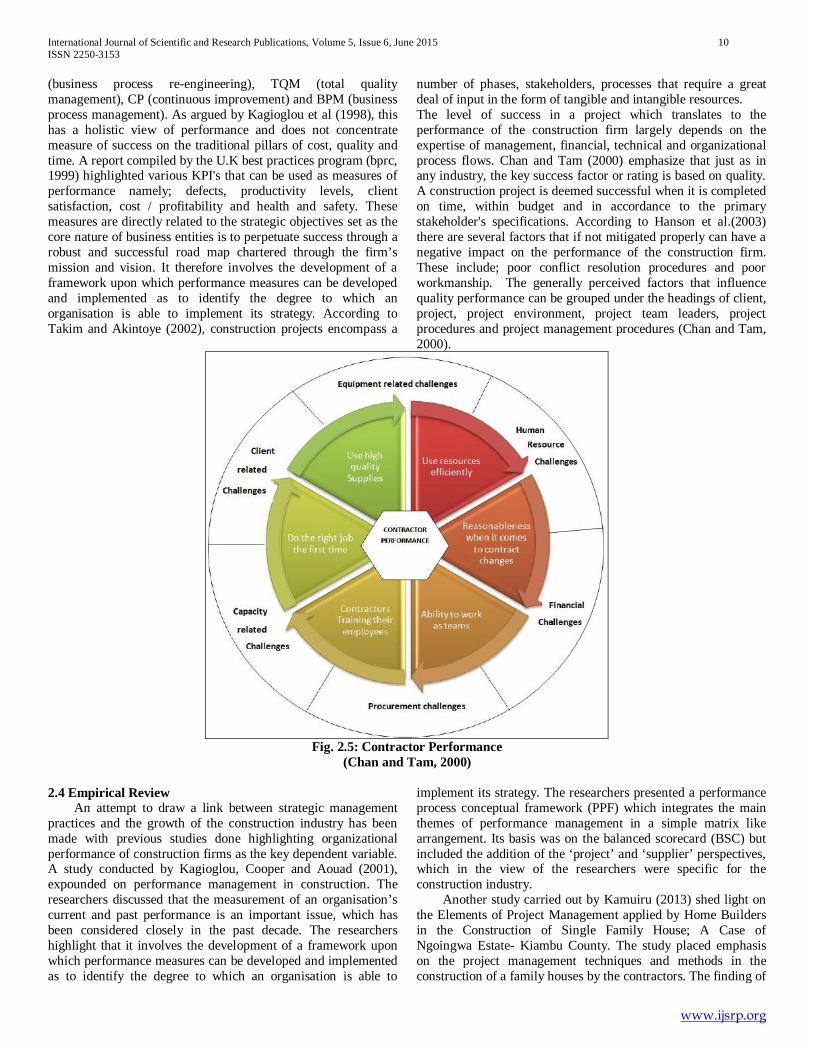
4.4.2 Rate on the impact of automated system on operational efficiency Respondents were asked regarding their rate on the impact of this system on operational efficiency and it was shown in the frequency table below.
Table 4.4 Frequency table on the rate of the impact of Automated System on operational efficiency
Frequency Percent Valid Percent Cumulative Percent No Response 15 26.8 26.8 26.8
Valid
Least Impact 6 10.7 14.6 37.5 Less Impact 7 12.5 17.1 50.0 Moderate Impact 10 17.9 24.4 67.9 High Impact 16 28.6 39.0 96.4 Highest Impact 2 3.6 4.9 100.0 Total 41 73.2 100.0
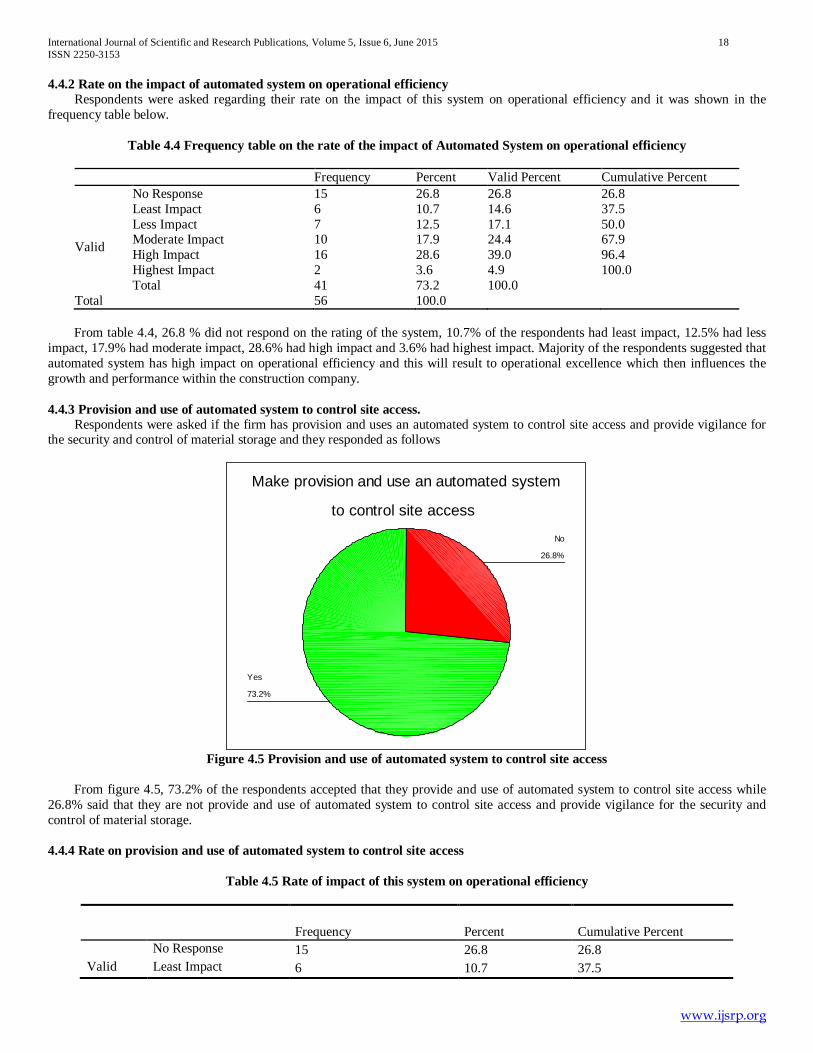
Total 56 100.0 From table 4.4, 26.8 % did not respond on the rating of the system, 10.7% of the respondents had least impact, 12.5% had less impact, 17.9% had moderate impact, 28.6% had high impact and 3.6% had highest impact. Majority of the respondents suggested that automated system has high impact on operational efficiency and this will result to operational excellence which then influences the growth and performance within the construction company. 4.4.3 Provision and use of automated system to control site access. Respondents were asked if the firm has provision and uses an automated system to control site access and provide vigilance for the security and control of material storage and they responded as follows
Make provision and use an automated system
to control site access
73.2%
26.8%
Yes
No
Figure 4.5 Provision and use of automated system to control site access
From figure 4.5, 73.2% of the respondents accepted that they provide and use of automated system to control site access while 26.8% said that they are not provide and use of automated system to control site access and provide vigilance for the security and control of material storage. 4.4.4 Rate on provision and use of automated system to control site access
Table 4.5 Rate of impact of this system on operational efficiency
Frequency Percent Cumulative Percent No Response 15 26.8 26.8 Valid Least Impact 6 10.7 37.5

International Journal of Scientific and Research Publications, Volume 5, Issue 6, June 2015 19 ISSN 2250-3153
www.ijsrp.org
Less Impact 7 12.5 50.0 Moderate Impact 10 17.9 67.9 High Impact 16 28.6 96.4 Highest Impact 2 3.6 100.0 Total 56 100.0
From table 4.5, 26.8 % did not respond on the rating of the system, 10.7% of the respondents had least impact, 12.5% had less impact, 17.9% had moderate impact, 28.6% had high impact and 3.6% had highest impact. Majority of the respondents suggested that provision and use of automated system to control site access and this will result to operational excellence which then influences the growth and performance of the construction company. 4.4.5 Use of automated system for resource management and allocation to construction projects. Respondents were asked if the firm use of automated system for resource management and allocation to construction projects awarded to their firm and they responded as follows
Use automated system for resource
management and allocation to construction
73.2%
26.8%
Yes
No
Figure 4.6 Use of automated system for resource management and allocation to construction projects
From figure 4.6, 73.2% of the respondents accepted that they use automated system for resource management and allocation to construction projects while 26.8% said that they do not have provision and use of automated systems. 4.4.6 Rate on Use of automated system for resource management and allocation
Table 4.6 Rate the impact of this system on operational efficiency
Frequency Percent Cumulative Percent No Response 15 26.8 26.8 Valid
Least Impact 6 10.7 37.5 Less Impact 7 12.5 50.0 Moderate Impact 10 17.9 67.9 High Impact 16 28.6 96.4 Highest Impact 2 3.6 100.0
56 100.0 From table 4.6, 26.8 % did not respond on the rating of the system, 10.7% of the respondents had least impact, 12.5% had less impact, 17.9% had moderate impact, 28.6% had high impact and 3.6% had highest impact. Majority of the respondents suggested that the firm use of automated system for resource management and allocation to construction projects had high impact and this will result to operational excellence which then has a direct influence to the growth and performance of construction companies. 4.4.7 Firm’s Retention of staff and labour it had previously hired

International Journal of Scientific and Research Publications, Volume 5, Issue 6, June 2015 20 ISSN 2250-3153
www.ijsrp.org
Retain staff and labour
it has previously hired
73.2%
26.8%
Yes
No
Figure 4.7: A graph of the Firm’s Retention of staff and labour it had previously hired
From figure 4.7, 73.2% of the respondents accepted that the firms retains staff and labour it has previously hired to work for the company while 26.8% said that it does not retain staff and labour. 4.5 Internal Processes and Quality Management 4.5.1 Organization has a quality assurance mechanism Respondents were asked if the company has a quality assurance mechanism and they responded as from the chart below
Quality assurance mechanism
within your organisation
92.9%
7.1%
Yes
No
Figure 4.8: Organization has a quality assurance mechanism
From figure 4.8, 92.9% of the respondents accepted that organization has a quality assurance mechanism while 7.1% said that it does not have. Since majority accepted then it indicates that the system is in place hence the quality of work is monitored and influences the performance of the construction firms.

International Journal of Scientific and Research Publications, Volume 5, Issue 6, June 2015 21 ISSN 2250-3153
www.ijsrp.org
4.5.2 Measures to ensure quality and continuous improvement of the firm's performance
Table 4.7 Measures to ensure quality and continuous improvement of the firm's performance
Frequency Percent
Valid
No Response 11 19.6 Benchmarks 6 10.7 Communication Channels 14 25.0 Customers Feedback analysis 1 1.8 employee motivation 4 7.2 Friendly Work environment 1 1.8 gather all requirements 2 3.6 key performance indicator 1 1.8 Market surveys 1 1.8 open door policy 1 1.8 qualified personnel 1 1.8 quality audit 1 1.8 regular meetings 1 1.8 Site Inspection 6 10.8 training staff 2 3.6 updating reports 1 1.8 use of ICT 1 1.8 using standards 1 1.8 Total 56 100.0
From table 4.7, improve on Communication Channels had the highest response of 25.0% ,set benchmarks had 10.7%,site inspection had 10.8% and employee motivation had a significant
response of 7.25.Also 19.6% did not response on this issue and the rest had some significant response.
4.5.3 Descriptive statistics on Internal Process perspective Indicators within the organization.
Table 4.8 Descriptive Statistics of Internal Process
We adopt processes that address concerns of our stakeholders
We use benchmarking to continuously improve our business processes
We are able to objectively measure the social impact of our operations
Our internal business processes contribute greatly towards organizational profitability
N Valid 49 49 49 49 No Response 7 7 7 7
Median 3.00 4.00 3.00 4.00 Mode 3 4 3 4
From table 4.8, 'we adopt processes that address concerns of our stakeholders' has a mode and median 3 which is somehow agree as per the likert scale and this indicates that many respondents somehow agreed that the organization adopt processes that address concerns of our stakeholders and this influences strategic management practices on the performance of private construction firms. 'we use benchmarking to continuously improve our business processes' has a mode and median of 4 which is agree as per the likert scale this indicates that many respondents agreed that the organization uses benchmarking to continuously improve our business processes. 'we are able to objectively measure the social impact of our operations' has a
mode and median of 3 which is somehow agree as per the likert scale and this indicates that many respondents somehow agreed that the organization is able to objectively measure the social impact of our operations and ‘our internal business processes contribute greatly towards organizational profitability’ has a mode and median of 4 which is agree as per the likert scale this indicates that many respondents agreed that their internal business processes contribute greatly towards organizational profitability. From the study 7 respondents did not suggest anything on the internal process perspective indicators within their organization.
4.5.4 Currently employ any mechanism to reduce operational costs and turnarounds Times.

International Journal of Scientific and Research Publications, Volume 5, Issue 6, June 2015 22 ISSN 2250-3153
www.ijsrp.org
Currently employ any mechanisms to reduce
operational cost and turnaroun
94.1%
5.9%
Yes
No
Figure 4.9 Employ any mechanism to reduce operational costs and turnarounds Times
Figure 4.9, 94.1% of the respondents indicated that the companies currently employ mechanism to reduce operational costs and turnarounds times while 5.9% indicate that the company is not employing any mechanism to reduce operational costs and turnarounds times.
Table 4.9 Mechanisms to reduce operational costs and turnarounds times
Frequency Percent Valid Percent
Cumulative Percent
Valid
No Response 8 14.3 14.3 14.3 attendance system 1 1.8 1.8 16.1 baseline measures 3 5.4 5.4 21.4 control charts 1 1.8 1.8 23.2 Cutting back on materials 1 1.8 1.8 25.0 Dividing Labour 1 1.8 1.8 26.8 performance report 8 14.3 14.3 41.1 proper communication 1 1.8 1.8 42.9 record keeping 2 3.6 3.6 46.4 reducing paper waste 4 7.1 7.1 53.6 Risk analysis 1 1.8 1.8 55.4 risk management 1 1.8 1.8 57.1 save on stationery 1 1.8 1.8 58.9 site inspection and audits 3 5.4 5.4 64.3 Site Meeting 3 5.4 5.4 69.6 Training staff 1 1.8 1.8 71.4 using control charts 1 1.8 1.8 73.2 Using organizational process assets 1 1.8 1.8 75.0 Using Quality audits 2 3.6 3.6 78.6 Using Quality Audits 1 1.8 1.8 80.4 Work Schedules 11 19.6 19.6 100.0 Total 56 100.0 100.0
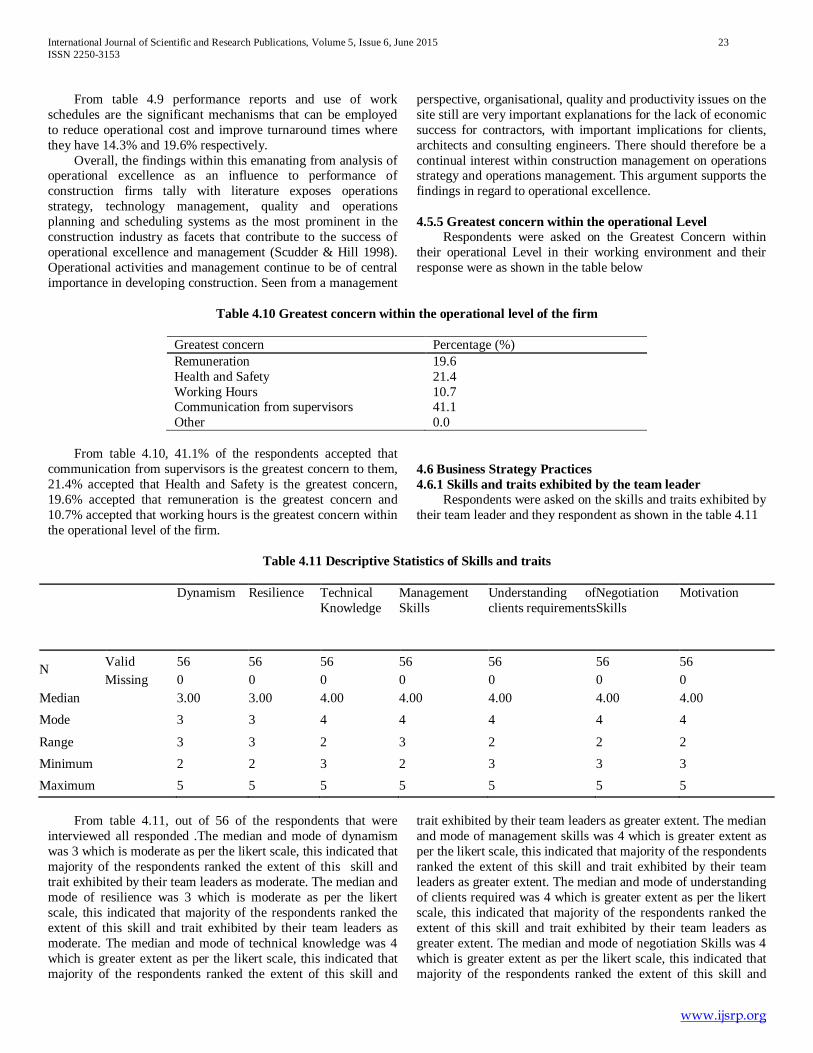
International Journal of Scientific and Research Publications, Volume 5, Issue 6, June 2015 23 ISSN 2250-3153
www.ijsrp.org
From table 4.9 performance reports and use of work schedules are the significant mechanisms that can be employed to reduce operational cost and improve turnaround times where they have 14.3% and 19.6% respectively. Overall, the findings within this emanating from analysis of operational excellence as an influence to performance of construction firms tally with literature exposes operations strategy, technology management, quality and operations planning and scheduling systems as the most prominent in the construction industry as facets that contribute to the success of operational excellence and management (Scudder & Hill 1998). Operational activities and management continue to be of central importance in developing construction. Seen from a management
perspective, organisational, quality and productivity issues on the site still are very important explanations for the lack of economic success for contractors, with important implications for clients, architects and consulting engineers. There should therefore be a continual interest within construction management on operations strategy and operations management. This argument supports the findings in regard to operational excellence. 4.5.5 Greatest concern within the operational Level Respondents were asked on the Greatest Concern within their operational Level in their working environment and their response were as shown in the table below
Table 4.10 Greatest concern within the operational level of the firm
Greatest concern Percentage (%) Remuneration 19.6 Health and Safety 21.4 Working Hours 10.7 Communication from supervisors 41.1 Other 0.0
From table 4.10, 41.1% of the respondents accepted that communication from supervisors is the greatest concern to them, 21.4% accepted that Health and Safety is the greatest concern, 19.6% accepted that remuneration is the greatest concern and 10.7% accepted that working hours is the greatest concern within the operational level of the firm.
4.6 Business Strategy Practices 4.6.1 Skills and traits exhibited by the team leader Respondents were asked on the skills and traits exhibited by their team leader and they respondent as shown in the table 4.11
Table 4.11 Descriptive Statistics of Skills and traits
Dynamism Resilience Technical
Knowledge Management Skills
Understanding of clients requirements
Negotiation Skills
Motivation
N Valid 56 56 56 56 56 56 56 Missing 0 0 0 0 0 0 0
Median 3.00 3.00 4.00 4.00 4.00 4.00 4.00 Mode 3 3 4 4 4 4 4
Range 3 3 2 3 2 2 2 Minimum 2 2 3 2 3 3 3 Maximum 5 5 5 5 5 5 5
From table 4.11, out of 56 of the respondents that were interviewed all responded .The median and mode of dynamism was 3 which is moderate as per the likert scale, this indicated that majority of the respondents ranked the extent of this skill and trait exhibited by their team leaders as moderate. The median and mode of resilience was 3 which is moderate as per the likert scale, this indicated that majority of the respondents ranked the extent of this skill and trait exhibited by their team leaders as moderate. The median and mode of technical knowledge was 4 which is greater extent as per the likert scale, this indicated that majority of the respondents ranked the extent of this skill and
trait exhibited by their team leaders as greater extent. The median and mode of management skills was 4 which is greater extent as per the likert scale, this indicated that majority of the respondents ranked the extent of this skill and trait exhibited by their team leaders as greater extent. The median and mode of understanding of clients required was 4 which is greater extent as per the likert scale, this indicated that majority of the respondents ranked the extent of this skill and trait exhibited by their team leaders as greater extent. The median and mode of negotiation Skills was 4 which is greater extent as per the likert scale, this indicated that majority of the respondents ranked the extent of this skill and
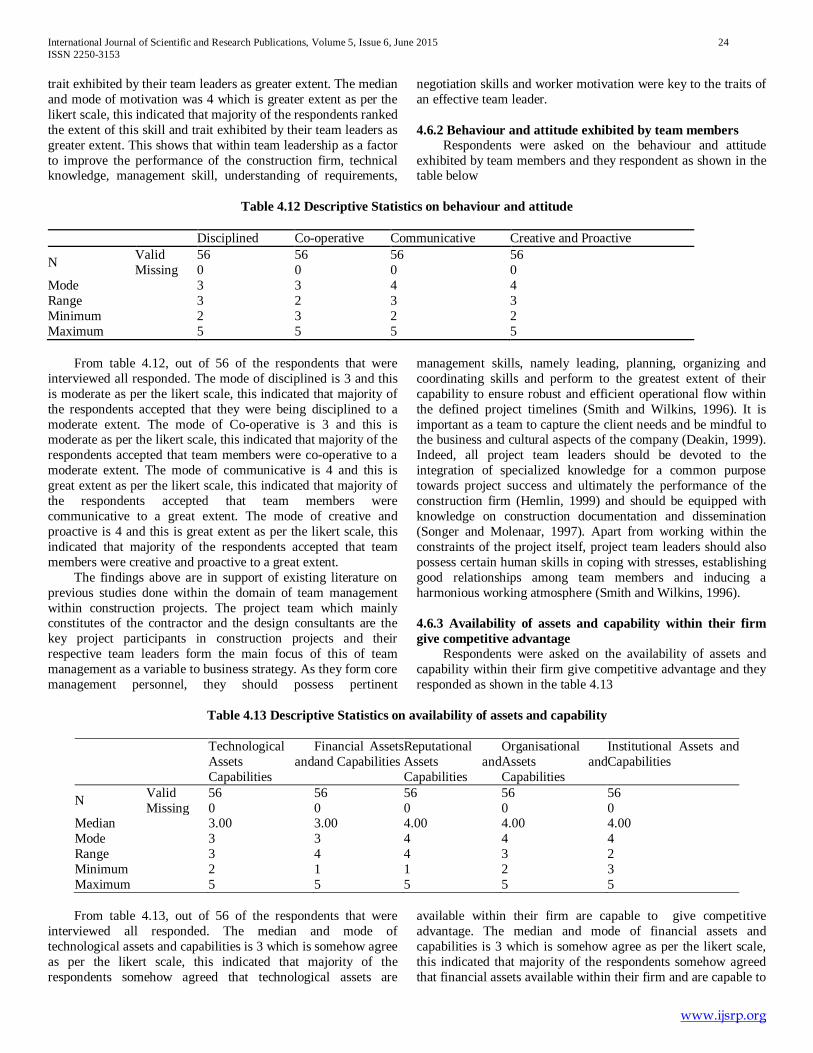
International Journal of Scientific and Research Publications, Volume 5, Issue 6, June 2015 24 ISSN 2250-3153
www.ijsrp.org
trait exhibited by their team leaders as greater extent. The median and mode of motivation was 4 which is greater extent as per the likert scale, this indicated that majority of the respondents ranked the extent of this skill and trait exhibited by their team leaders as greater extent. This shows that within team leadership as a factor to improve the performance of the construction firm, technical knowledge, management skill, understanding of requirements,
negotiation skills and worker motivation were key to the traits of an effective team leader. 4.6.2 Behaviour and attitude exhibited by team members Respondents were asked on the behaviour and attitude exhibited by team members and they respondent as shown in the table below
Table 4.12 Descriptive Statistics on behaviour and attitude
Disciplined Co-operative Communicative Creative and Proactive
N Valid 56 56 56 56 Missing 0 0 0 0
Mode 3 3 4 4 Range 3 2 3 3 Minimum 2 3 2 2 Maximum 5 5 5 5 From table 4.12, out of 56 of the respondents that were interviewed all responded. The mode of disciplined is 3 and this is moderate as per the likert scale, this indicated that majority of the respondents accepted that they were being disciplined to a moderate extent. The mode of Co-operative is 3 and this is moderate as per the likert scale, this indicated that majority of the respondents accepted that team members were co-operative to a moderate extent. The mode of communicative is 4 and this is great extent as per the likert scale, this indicated that majority of the respondents accepted that team members were communicative to a great extent. The mode of creative and proactive is 4 and this is great extent as per the likert scale, this indicated that majority of the respondents accepted that team members were creative and proactive to a great extent. The findings above are in support of existing literature on previous studies done within the domain of team management within construction projects. The project team which mainly constitutes of the contractor and the design consultants are the key project participants in construction projects and their respective team leaders form the main focus of this of team management as a variable to business strategy. As they form core management personnel, they should possess pertinent
management skills, namely leading, planning, organizing and coordinating skills and perform to the greatest extent of their capability to ensure robust and efficient operational flow within the defined project timelines (Smith and Wilkins, 1996). It is important as a team to capture the client needs and be mindful to the business and cultural aspects of the company (Deakin, 1999). Indeed, all project team leaders should be devoted to the integration of specialized knowledge for a common purpose towards project success and ultimately the performance of the construction firm (Hemlin, 1999) and should be equipped with knowledge on construction documentation and dissemination (Songer and Molenaar, 1997). Apart from working within the constraints of the project itself, project team leaders should also possess certain human skills in coping with stresses, establishing good relationships among team members and inducing a harmonious working atmosphere (Smith and Wilkins, 1996). 4.6.3 Availability of assets and capability within their firm give competitive advantage Respondents were asked on the availability of assets and capability within their firm give competitive advantage and they responded as shown in the table 4.13
Table 4.13 Descriptive Statistics on availability of assets and capability
Technological
Assets and Capabilities
Financial Assets and Capabilities
Reputational Assets and Capabilities
Organisational Assets and Capabilities
Institutional Assets and Capabilities
N Valid 56 56 56 56 56 Missing 0 0 0 0 0
Median 3.00 3.00 4.00 4.00 4.00 Mode 3 3 4 4 4 Range 3 4 4 3 2 Minimum 2 1 1 2 3 Maximum 5 5 5 5 5
From table 4.13, out of 56 of the respondents that were interviewed all responded. The median and mode of technological assets and capabilities is 3 which is somehow agree as per the likert scale, this indicated that majority of the respondents somehow agreed that technological assets are
available within their firm are capable to give competitive advantage. The median and mode of financial assets and capabilities is 3 which is somehow agree as per the likert scale, this indicated that majority of the respondents somehow agreed that financial assets available within their firm and are capable to

International Journal of Scientific and Research Publications, Volume 5, Issue 6, June 2015 25 ISSN 2250-3153
www.ijsrp.org
give competitive advantage. The median and mode of reputational assets and capabilities is 4 which is agree as per the likert scale, this indicated that majority of the respondents agreed that reputational assets are available within their firm and are capable to give competitive advantage. The median and mode of organizational assets and capabilities is 4 which is agree as per the likert scale, this
indicated that majority of the respondents agreed that organizational assets are available within their firm and are capable to give competitive advantage. The median and mode of institutional assets and capabilities is 4 which is agree as per the likert scale, this indicated that majority of the respondents agreed that institutional assets are available within their firm and are capable to give competitive advantage.
Table 4.14 One-Sample Test on availability of assets and capability
Test Value = 0 t Df Sig. (2-tailed) Mean Difference 95% Confidence Interval of the
Difference Lower Upper
Technological Assets and Capabilities 36.380 55 .000 3.464 3.27 3.66
Financial Assets and Capabilities 29.040 55 .000 3.286 3.06 3.51
Reputational Assets and Capabilities 32.075 55 .000 3.464 3.25 3.68
Organizational Assets and Capabilities 36.708 55 .000 3.500 3.31 3.69
47.545 55 .000 3.589 3.44 3.74 From table 4.14, the computed p-values of all the resources are all significant at p-value < .05 since their p = 0.000 The findings above complements the literature that exists on the resource based view. According to RBV theory, if resources can be readily obtained in the factor markets or can be easily imitated by competitors, they cannot represent a meaningful source of economic benefit. As emphasized by Galbreath (2005), tangible assets or resources are mostly prone to imitation and therefore dilute a firm’s competitive leverage. Emanating from a business point of view, core competencies can be viewed as combination of attributes that an organization possesses which in turn allows it to achieve competitive advantage. Therefore, construction firms should attain those competencies that may curb competitor duplication. The managers must turn their attention to resources that are intangible in nature to build strategic capability. For the company, three core components also known as assets to competitive leverage arise, namely organizational assets, reputational assets and tangible assets. Organizational assets, such as culture, human resource management policies and corporate structure can significantly impact on a company’s success. Such assets should be carefully planned and developed, particularly with respect to their synergistic impact on the development and utilization of firm capabilities. Organizational assets may also be intangible assets that can resist the duplication efforts of competitors. For example, contracts (e.g. franchise agreements, licensing agreements) can be one of the most important resources for some companies. Because contracts are legally enforceable by law, they may prevent competitors from replicating the benefits derived from such agreements. Likewise, other organizational assets such as culture, human resource management policies and organizational structure may be difficult to duplicate as well. Management must turn its attention to such resources whose
accumulation over a period of time represent high levels of asset specificity. Reputational assets are among the most important the company can develop. Logically, a good reputation leads to positive performance, both financially and socially. Strategic efforts aimed towards building and maintaining a good reputation is essential in the management of company’s resources. Marketing scholars have particularly emphasized the impact of the intangible asset reputation on firm success. Largely, reputational assets, in its various forms, summarize a good deal of information about firms and shape the responses of customers, suppliers, and competitors. Similarly, as signaling theory suggests, reputational assets can inform external constituents about the trustworthiness, credibility and quality of the firm. Therefore, reputational assets can be key drivers of external constituents positive reactions toward a firm vis-à-vis its competitors, thus positively impacting on firm success. Reputation is built, not bought, suggesting that it is a non-tradable intangible asset that may be much more difficult to duplicate than tangible assets. Tangible assets may still have a viable place in the performance of company. Company should able to generate high value-in-use of financial or physical assets which may indeed be able to leverage such assets for competitive advantage while creating barriers to duplication. Proprietary processes and equipment includes equipment protected by patents as well as unpatented processes and equipment held in secret. It also includes state of-the-art equipment and construction processes that have been developed exclusively by the firm. Focus should be on competitive assessments of production processes of the construction plant as a whole, and the degree to which production processes are proprietary.
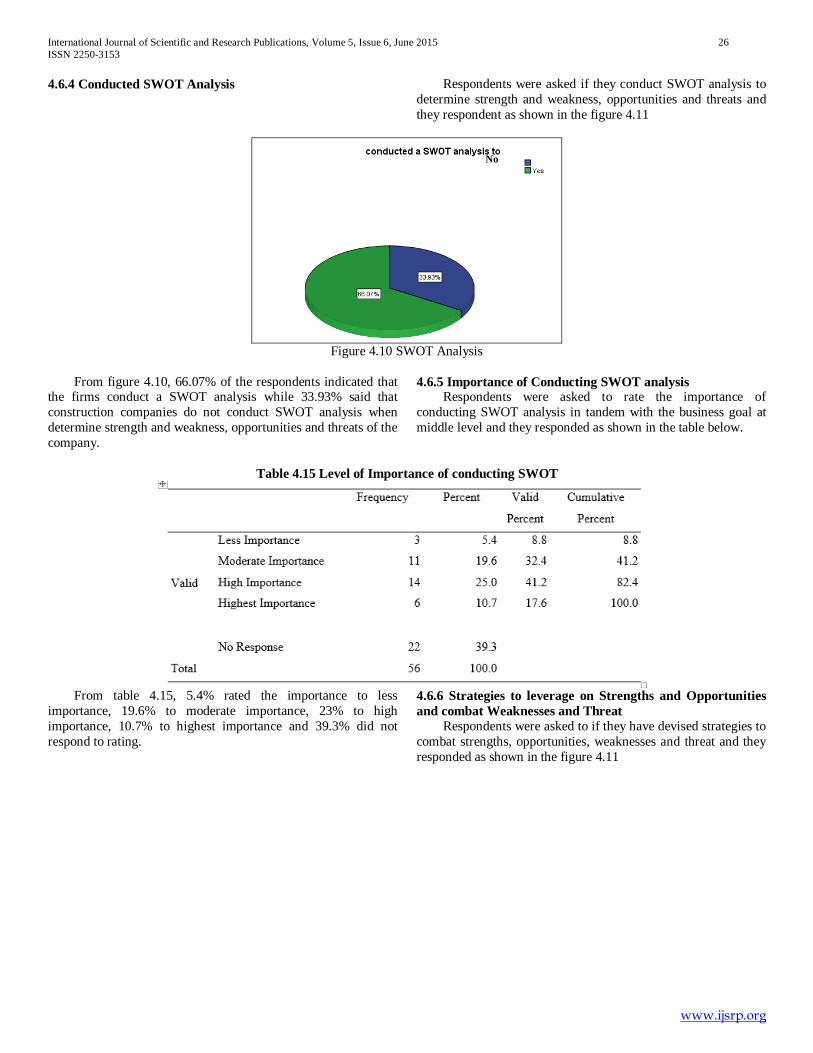
International Journal of Scientific and Research Publications, Volume 5, Issue 6, June 2015 26 ISSN 2250-3153
www.ijsrp.org
4.6.4 Conducted SWOT Analysis Respondents were asked if they conduct SWOT analysis to determine strength and weakness, opportunities and threats and they respondent as shown in the figure 4.11
Figure 4.10 SWOT Analysis
From figure 4.10, 66.07% of the respondents indicated that the firms conduct a SWOT analysis while 33.93% said that construction companies do not conduct SWOT analysis when determine strength and weakness, opportunities and threats of the company.
4.6.5 Importance of Conducting SWOT analysis Respondents were asked to rate the importance of conducting SWOT analysis in tandem with the business goal at middle level and they responded as shown in the table below.
Table 4.15 Level of Importance of conducting SWOT
From table 4.15, 5.4% rated the importance to less importance, 19.6% to moderate importance, 23% to high importance, 10.7% to highest importance and 39.3% did not respond to rating.
4.6.6 Strategies to leverage on Strengths and Opportunities and combat Weaknesses and Threat Respondents were asked to if they have devised strategies to combat strengths, opportunities, weaknesses and threat and they responded as shown in the figure 4.11
No

International Journal of Scientific and Research Publications, Volume 5, Issue 6, June 2015 27 ISSN 2250-3153
www.ijsrp.org
94.1%
5.9%
Yes
No
Figure 4.11 Pie-chart of Strategies devised to leverage on Strengths, opportunities and combat weaknesses and threat
From figure 4.11, 94.1% accepted that strategies devised to leverage on strengths, opportunities and combat weaknesses and threat were within the firms’ management structures in place and 5.9% said they have not been devised.
Table 4.16 Strategies to leverage on strengths, opportunities and combat weaknesses and threats
Frequency Percent Valid Percent Cumulative Percent
Valid
Planning and Communication management 31 55.4 55.4 55.4
Analyzing performance 1 1.8 1.8 57.1 Stakeholder management 3 5.4 5.4 62.5 Historical data 4 7.1 7.1 69.6 Improve funding 1 1.8 1.8 71.4 Internal audits 1 1.8 1.8 73.2 Market surveys 2 3.6 3.6 76.8 Organisation culture 1 1.8 1.8 78.6 Performance report 1 1.8 1.8 80.4 Team building 1 1.8 1.8 82.1 Training staff 5 8.9 8.9 91.1 Use of responsibility matrix 1 1.8 1.8 92.9 Using progress charts 1 1.8 1.8 94.6 Using consultants 1 1.8 1.8 96.4 Using risk registers 2 3.6 3.6 100.0 Total 56 100.0 100.0
From table 4.16, 55.4 % of the respondents identified planning and communication management as ways to capitalize on strengths and opportunities as well as identification of weakness, threats and remedies thereof. Training staff as a strategy was confirmed by 8.9%, using historical data by 7.1%, communication channels by 5.4% and other strategies were below 4.0% as shown in the table. The findings show that SWOT analysis should be considered a structured and viable approach that helps strategists to systematically analyse the issues that may affect the fulfillment of the vision, mission and strategic
objectives. The SWOT analysis is a convenient and concise way of past, present and future evaluation to leverage on strengths and opportunities while guarding against threats and weaknesses (Pearce and Robinson Jr., 2000, Rabin et al., 2000, Macmillian and Tampoe, 2000). 4.7 Corporate Level Strategy Practices 4.7.1 Influence of stakeholders on the strategy of the firm Respondents were asked to response on influence of the stakeholders on the strategy of the firm and they responded as below:
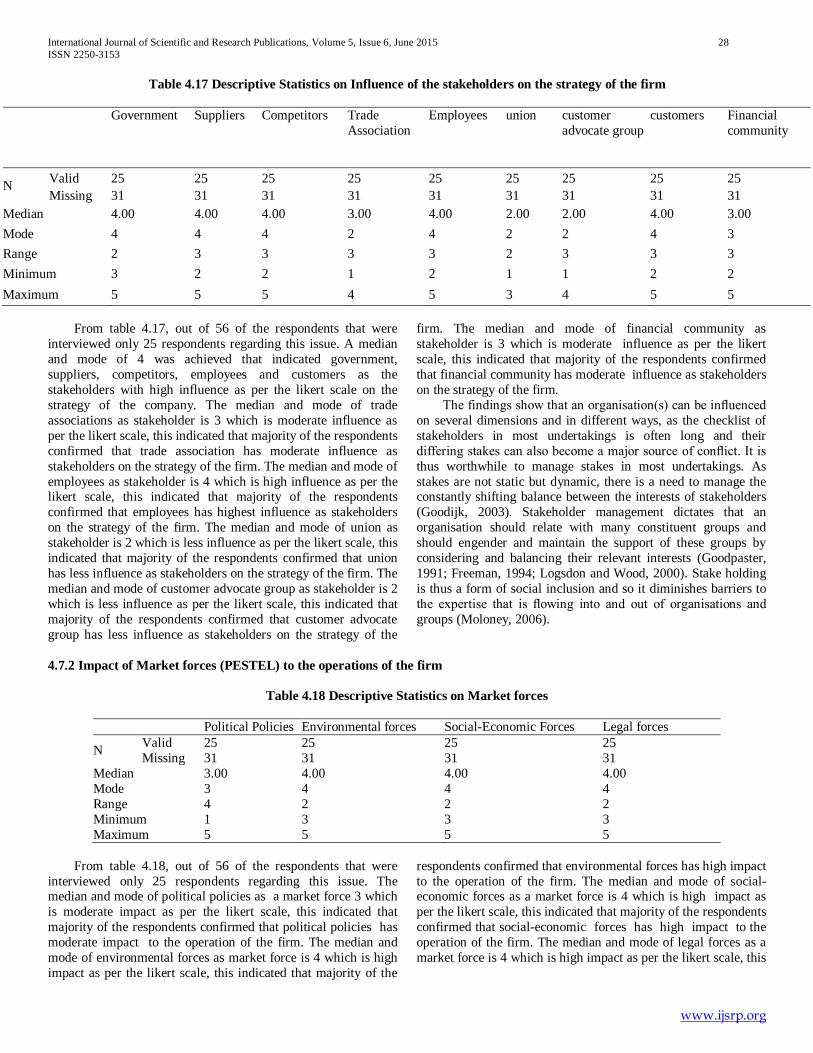
International Journal of Scientific and Research Publications, Volume 5, Issue 6, June 2015 28 ISSN 2250-3153
www.ijsrp.org
Table 4.17 Descriptive Statistics on Influence of the stakeholders on the strategy of the firm
Government Suppliers Competitors Trade Association
Employees union customer advocate group
customers Financial community
N Valid 25 25 25 25 25 25 25 25 25 Missing 31 31 31 31 31 31 31 31 31
Median 4.00 4.00 4.00 3.00 4.00 2.00 2.00 4.00 3.00 Mode 4 4 4 2 4 2 2 4 3 Range 2 3 3 3 3 2 3 3 3 Minimum 3 2 2 1 2 1 1 2 2 Maximum 5 5 5 4 5 3 4 5 5
From table 4.17, out of 56 of the respondents that were interviewed only 25 respondents regarding this issue. A median and mode of 4 was achieved that indicated government, suppliers, competitors, employees and customers as the stakeholders with high influence as per the likert scale on the strategy of the company. The median and mode of trade associations as stakeholder is 3 which is moderate influence as per the likert scale, this indicated that majority of the respondents confirmed that trade association has moderate influence as stakeholders on the strategy of the firm. The median and mode of employees as stakeholder is 4 which is high influence as per the likert scale, this indicated that majority of the respondents confirmed that employees has highest influence as stakeholders on the strategy of the firm. The median and mode of union as stakeholder is 2 which is less influence as per the likert scale, this indicated that majority of the respondents confirmed that union has less influence as stakeholders on the strategy of the firm. The median and mode of customer advocate group as stakeholder is 2 which is less influence as per the likert scale, this indicated that majority of the respondents confirmed that customer advocate group has less influence as stakeholders on the strategy of the
firm. The median and mode of financial community as stakeholder is 3 which is moderate influence as per the likert scale, this indicated that majority of the respondents confirmed that financial community has moderate influence as stakeholders on the strategy of the firm. The findings show that an organisation(s) can be influenced on several dimensions and in different ways, as the checklist of stakeholders in most undertakings is often long and their differing stakes can also become a major source of conflict. It is thus worthwhile to manage stakes in most undertakings. As stakes are not static but dynamic, there is a need to manage the constantly shifting balance between the interests of stakeholders (Goodijk, 2003). Stakeholder management dictates that an organisation should relate with many constituent groups and should engender and maintain the support of these groups by considering and balancing their relevant interests (Goodpaster, 1991; Freeman, 1994; Logsdon and Wood, 2000). Stake holding is thus a form of social inclusion and so it diminishes barriers to the expertise that is flowing into and out of organisations and groups (Moloney, 2006).
4.7.2 Impact of Market forces (PESTEL) to the operations of the firm
Table 4.18 Descriptive Statistics on Market forces
Political Policies Environmental forces Social-Economic Forces Legal forces
N Valid 25 25 25 25 Missing 31 31 31 31
Median 3.00 4.00 4.00 4.00 Mode 3 4 4 4 Range 4 2 2 2 Minimum 1 3 3 3 Maximum 5 5 5 5
From table 4.18, out of 56 of the respondents that were interviewed only 25 respondents regarding this issue. The median and mode of political policies as a market force 3 which is moderate impact as per the likert scale, this indicated that majority of the respondents confirmed that political policies has moderate impact to the operation of the firm. The median and mode of environmental forces as market force is 4 which is high impact as per the likert scale, this indicated that majority of the
respondents confirmed that environmental forces has high impact to the operation of the firm. The median and mode of social-economic forces as a market force is 4 which is high impact as per the likert scale, this indicated that majority of the respondents confirmed that social-economic forces has high impact to the operation of the firm. The median and mode of legal forces as a market force is 4 which is high impact as per the likert scale, this

International Journal of Scientific and Research Publications, Volume 5, Issue 6, June 2015 29 ISSN 2250-3153
www.ijsrp.org
indicated that majority of the respondents confirmed that legal forces has high impact on the operation of the firm. 4.7.3 Presence of Corporate Branding Respondents were asked if the firm has a corporate brand and they respondent as shown in the figure below
Figure 4.12 Corporate Brand
From figure 4.12, 81.25% accepted that the firm has a corporate brand and 18.75% said that it does not have a corporate brand.
Table 4.19 Frequency table of how brand play role in the firm
Frequency Percent Valid Percent Cumulative Percent
Valid
No Response 36 64.3 64.3 64.3 accountable to client 1 1.8 1.8 66.1 attract clients 17 30.4 30.4 96.4 business continuity 2 3.6 3.6 100.0 Total 56 100.0 100.0
From table 4.19, 64.3 % of the respondents did not respond on this issue, 1.8% said that it ensures accountability to clients, 30.4% said that it attracts clients and 3.6 said that it enhances business continuity.
4.7.4 Influences to the corporate strategy within the firms Respondents were asked to indicate the level of importance on the following influences to the corporate strategy within the firm and they responded as shown in the table below
Table 4.20 Descriptive Statistics on the influence to the corporate strategy within the firm
Increased Margin Satisfying Customers Getting Repeat
Business Increasing Productivity
Reduce Costs
N Valid 21 21 21 21 21 Missing 35 35 35 35 35
Median 4.00 4.00 4.00 4.00 4.00 Mode 4 4 4 4 4 Range 2 1 1 1 1 Minimum 3 4 4 4 4 Maximum 5 5 5 5 5
From table 4.20, out of 56 of the respondents that were interviewed only 21 respondents regarding this issue. The median and mode of Increased Margin is 4 which is more important as per the likert scale, this indicated that majority of the respondents confirmed that Increased Margin has more important influence to the corporate strategy of the firm. The median and mode of Satisfying Customers is 4 which is more important as per the likert scale, this indicated that majority of
the respondents confirmed that Satisfying Customers has more important influence to the corporate strategy of the firm. The median and mode of getting repeat business is 4 which is more important as per the likert scale, this indicated that majority of the respondents confirmed that getting repeat business has more important influence to the corporate strategy of the firm. The median and mode of increasing productivity is 4 which is more important as per the likert scale, this indicated that majority of the respondents confirmed that increasing

International Journal of Scientific and Research Publications, Volume 5, Issue 6, June 2015 30 ISSN 2250-3153
www.ijsrp.org
productivity has more important influence to the corporate strategy of the firm. The median and mode of reduce costs is 4 which is more important as per the likert scale, this indicated that majority of the respondents confirmed that reduce costs has more important influence to the corporate strategy of the firm.
4.7.5 Mission Statement Respondents were asked to indicate if the firm has mission statement and they respondent as shown in the figure 4.14
Figure 4.13 Mission statement
From figure 4.13, 81.82% of the respondents accepted that the organization has a mission statement and 18.18% said that they don’t know if it has a mission statement.
Figure 4.14 Rate of the influence to the performance of the firm
From figure 4.14, 6.7% of the respondents rate least influence of the mission statement on performance of the firm,15.6% rated less influence, 28.9% rated moderate influrnce,37.7% rated high influence and 11.1% rated highest influence.
4.7.6 Vision Statement Respondents were asked to indicate if the firm has vision statement and they respondent as shown in the figure below

International Journal of Scientific and Research Publications, Volume 5, Issue 6, June 2015 31 ISSN 2250-3153
www.ijsrp.org
Figure 4.15 vision statement
From figure 4.15, 81.13% of the respondents accepted that the firm has a vision statement while 18.87% said they don’t know.
Table 4.21 Rate of the influence of vision statement to the performance of the firm
Frequency Percent Valid Percent Cumulative Percent
Valid
Least Influence 3 5.5 6.7 6.7 Less Influence 8 12.7 15.6 22.2 Moderate Influence 12 21.8 26.7 48.9 High Influence 17 30.9 37.8 86.7 Highest Influence 6 10.9 13.3 100.0
Missing System 10 18.2 Total 56 100.0
From table 4.21, 5.5 % of the respondents rated the least influence of vision statement to performance, 12.7% rated less influence, 21.8% rated moderate influence, 30.9% rated high influence, 10.9% rated highest influence and 18.2% did not rate the importance of vision statement.
4.7.7 Level of adoption of Mission and Vision Respondents were asked to indicate if they agree firm has mission and vision statement and they respondent as shown in the figure 4.17
Figure 4.16 Agree with firm’s Mission and vision
From figure 4.16, 86.67% accepted that they do agree with the firm’s mission and vision statement while 13.33% said that they don’t agree with the statement.

International Journal of Scientific and Research Publications, Volume 5, Issue 6, June 2015 32 ISSN 2250-3153
www.ijsrp.org
Table 4.22 Suggestions to what should be included within the Mission Statement
Frequency Percent Valid Percent Cumulative Percent
Valid No Response 49 89.1 89.1 89.1 workers are not taken care of 7 10.9 10.9 100.0 Total 56 100.0 100.0
From table 4.22 89.1% did not respond on this issue but 10.9% said that the mission and vision statement do not take care of workers welfare and concerns. According to literature on corporate planning performed by c-level management and encompasses a number of components namely; company mission and vision, market plan and growth options (Pryor, 2001). A mission statement is an important strategic tool because it states the company’s expectations (Pryor, 2001). The goals and objectives look forward to what the company plans to achieve in the future. These should always be related to the company mission. There are three primary areas of company goals profit, finance and personnel (Pryor, 2001). Many
plans fail because of lack of time, commitment and forethought. The best approach is for senior management to calculate their objectives and to understand completely all types of issues that they will have to deal with in a growth environment. The findings show a consensus to studies previously done within the area of corporate planning within the construction industry and demonstrate the importance of elements that constitute the corporate planning practices and their influence on performance. 4.8 Measures of Performance of Private Construction Firms 4.8.1 Presence of S.M.A.R.T Objectives Respondents were asked to indicate if firm has set strategic objectives and they responded as shown in the table 4.23
Table 4.23 Response on whether firm has set strategic objectives
Frequency Percent Valid Percent Cumulative Percent
Valid
No Response 37 67.3 67.3 67.3 No 12 21.8 21.8 89.1 Yes 7 10.9 10.9 100.0 Total 56 100.0 100.0
From table 4.23, 21.8 % said that the firm has not set strategic objectives, 10.9% said it has set strategic objectives and 67.3% did not respond on this issue.
Table 4.24 Metric used to measure Specific Objective
Frequency Percent Valid Percent Cumulative Percent
Valid
No Response 47 85.5 85.5 85.5 defining market 1 1.8 1.8 87.3 identify clients 2 1.8 1.8 89.1 residential project 1 1.8 1.8 90.9 using project charter 3 5.5 5.5 96.4 Workers welfare 2 3.6 3.6 100.0 Total 56 100.0 100.0
From table 4.24, 85.5% did not respond on this issue regarding metric used to measure specific objective, 5.5% said they use projects charter, 3.6% said use workers welfare and the rest said identifying client requirements and defining markets to operate in.
Table 4.25 Metric used to measure Measurable Objective
Frequency Percent Valid Percent Cumulative Percent
Valid
No Response 49 89.1 89.1 89.1 case notes 3 3.6 3.6 92.7 number of customer enquiries 2 3.6 3.6 96.4 number of projects 1 1.8 1.8 98.2 performance baselines 1 1.8 1.8 100.0 Total 56 100.0 100.0
From table 4.25,89.1% did not respond on this issue regarding metric used to measure Measurable objective, 3.6% said they use case notes ,3.6% said number of inquiries and the rest said use number of projects and baseline performance values.
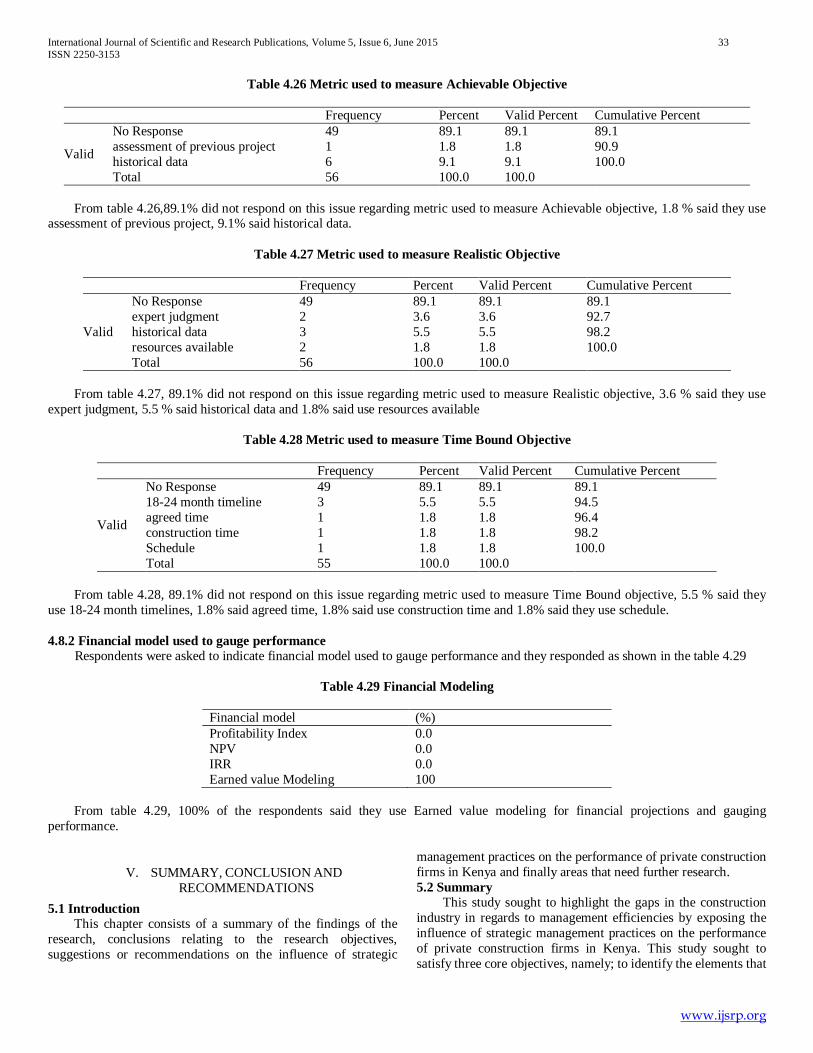
International Journal of Scientific and Research Publications, Volume 5, Issue 6, June 2015 33 ISSN 2250-3153
www.ijsrp.org
Table 4.26 Metric used to measure Achievable Objective
Frequency Percent Valid Percent Cumulative Percent
Valid
No Response 49 89.1 89.1 89.1 assessment of previous project 1 1.8 1.8 90.9 historical data 6 9.1 9.1 100.0 Total 56 100.0 100.0
From table 4.26,89.1% did not respond on this issue regarding metric used to measure Achievable objective, 1.8 % said they use assessment of previous project, 9.1% said historical data.
Table 4.27 Metric used to measure Realistic Objective
Frequency Percent Valid Percent Cumulative Percent
Valid
No Response 49 89.1 89.1 89.1 expert judgment 2 3.6 3.6 92.7 historical data 3 5.5 5.5 98.2 resources available 2 1.8 1.8 100.0 Total 56 100.0 100.0
From table 4.27, 89.1% did not respond on this issue regarding metric used to measure Realistic objective, 3.6 % said they use expert judgment, 5.5 % said historical data and 1.8% said use resources available
Table 4.28 Metric used to measure Time Bound Objective
Frequency Percent Valid Percent Cumulative Percent
Valid
No Response 49 89.1 89.1 89.1 18-24 month timeline 3 5.5 5.5 94.5 agreed time 1 1.8 1.8 96.4 construction time 1 1.8 1.8 98.2 Schedule 1 1.8 1.8 100.0 Total 55 100.0 100.0
From table 4.28, 89.1% did not respond on this issue regarding metric used to measure Time Bound objective, 5.5 % said they use 18-24 month timelines, 1.8% said agreed time, 1.8% said use construction time and 1.8% said they use schedule. 4.8.2 Financial model used to gauge performance Respondents were asked to indicate financial model used to gauge performance and they responded as shown in the table 4.29
Table 4.29 Financial Modeling
Financial model (%) Profitability Index 0.0 NPV 0.0 IRR 0.0 Earned value Modeling 100
From table 4.29, 100% of the respondents said they use Earned value modeling for financial projections and gauging performance.
V. SUMMARY, CONCLUSION AND RECOMMENDATIONS
5.1 Introduction This chapter consists of a summary of the findings of the research, conclusions relating to the research objectives, suggestions or recommendations on the influence of strategic
management practices on the performance of private construction firms in Kenya and finally areas that need further research. 5.2 Summary This study sought to highlight the gaps in the construction industry in regards to management efficiencies by exposing the influence of strategic management practices on the performance of private construction firms in Kenya. This study sought to satisfy three core objectives, namely; to identify the elements that

International Journal of Scientific and Research Publications, Volume 5, Issue 6, June 2015 34 ISSN 2250-3153
www.ijsrp.org
contribute to the operational excellence within the management of the construction firm, to investigate the strategies employed at the business level that will influence the growth and performance of the construction firm and to determine the adoptability of corporate level practices that influence the growth and performance of the construction firm. This research was carried out on three private construction firms namely; First Acres Construction, Blue Urban Construction and Nipsan Construction Company. The first variable under study was operational excellence which included the use of automation and efficiency of internal processes and quality management. The findings indicate that all three firms within the study have exploited the use of automation and execute their operations by utilizing platforms that increase the operational efficiency and therefore enhance the performance of the operations at this level. Overall, this is in agreement to where operations strategy, technology management, quality and operations planning and scheduling are the most prominent in the construction industry as factors that contribute to the success of operational excellence and management (Scudder & Hill 1998). The second variable under study was the extent to which business level strategies influence the performance the construction firms. The findings demonstrate the use of SWOT analysis as an important tool to gauge a firm’s strength and leverage against potential opportunities as well as guard against threats and counter weaknesses. All three firms saw the need to identify and leverage their resources and assets by using the RBV approach. Of equal importance was the need to explore team management and identification of team leader skills and team member attitude to their involvement of construction operations and management. All three firms possess structures that support team management and use these as a guide to structure the business strategy on the right personnel to hire and supplement core competencies within their firms. The third variable under study looked at the corporate level practices that influence the performance of the firms. All three firms demonstrated the use of elements such as mission and vision, corporate branding and using a framework that measures the impact of external influences so as to make informed decisions on the direction the firm is to take. 5.3 Conclusion From the findings of the research, it is evident that strategic management practices have a great influence on the performance of private construction firms in Kenya. This is evident in the three companies within the survey with regard to areas such as the usage of automated systems, the rate on use of automated system for resource management and allocation to construction projects, staff and labour, quality assurance mechanisms, mechanisms to reduce operational costs and turnarounds times, the administration of SWOT analysis and team management, the prioritization of various stakeholders, corporate branding and PESTEL analysis. The firms under study, which were randomly selected exhibited the use of a certain degree of strategic practices within all three levels of the firm. Equally important, is the communication and internalization of the mission and vision of the firms. In some cases, some respondents exhibited no knowledge such statements which leads to conclusions such as failure of communication and education of
such statements or lack of such statements within the company structures. Also lacking is the adoption of SMART objectives that can help in the strategic makeup of the firm hence influence the decisions in regard to growth and performance. 5.4 Recommendations In relation to the influence of the elements of operational excellence on the performance of the construction firm, the level of success in a project which translates to the performance of the construction firm largely depends on the expertise of management, financial, technical and organizational process flows that, to a large extent, forms a firm’s strategy. It is therefore the recommendation from the researcher to emphasis on automation and process management be regarded as high priority to achieve increased operational efficiency and consequently improve the performance of the firm. In relation to the strategies employed at the business level and the adoptability of corporate level practices that influence the performance of the construction firm, it is the recommendation of this research that every construction firm develop a business strategy looking at the core strategic pillars of strategic planning, strategic choice and strategic implementation, encompassing the three critical levels of the firm, that is, the corporate, business and operational levels of the firm. The use of strategic management practices within the construction industry ensures that the holistic view of performance is pegged on strategic planning, strategic choice and strategic implementation and does not merely concentrate on measures of success on the traditional pillars of cost, quality and time. These practices are directly related to the strategic objectives set as the core nature of business entities is to perpetuate success through a robust and successful road map chartered through the firm’s mission and vision. It therefore involves the development of a framework upon which performance measures can be developed and implemented as to identify the degree to which an organisation is able to implement its strategy. Further Areas for Research There still exists opportunities to carry out further research. Much still needs to be explored in the public sector arena where construction is on an upward growth. Further areas of research may include the public sector road and amenities and the strategic management practices used to govern such projects in relation to the objectives set. Also as an area of further research, the exploration of private entities that finance construction projects and the strategic practices they execute to govern the role the play as financiers and legitimate stakeholders to construction projects
REFERENCES [1] Analoui, F. & Karami, A. (2003). Strategic Management in Small and
Medium Enterprises. London: Thomson Learning [2] Arain, F. M. and Low, S.P. (2005). "Knowledge-based decision support
system framework for management of variations in institutional buildings", Proceedings of the MICRA 4th Annual Conference, Kuala Lumpur, Malaysia, pp. 1-24.
[3] Augier, M., D. Teece. (2006). Understanding complex organization: The role of know-how, internal structure, and human behavior in the evolution of capabilities. Corporate Change. 15(2) pp.395–416.
International Journal of Scientific and Research Publications, Volume 5, Issue 6, June 2015 35 ISSN 2250-3153
www.ijsrp.org
[4] Babbie, E. (2002). Survey research methods (2nd Edition), Belmont: Woodsworth
[5] Belbin, R.M. (2004), Management Teams – Why They Succeed or Fail, 2nd edition: Elsevier Butterworth-Heinemann, Amsterdam
[6] Belbin, R.M. (2004), Management Teams – Why They Succeed or Fail, 2nd ed., Elsevier Butterworth-Heinemann, Amsterdam
[7] Blair, B. (2009), Strategy in the eye of the storm. Raleigh, North Carolina: FMI Corporation
[8] Blank, J.A. & Boal, K.B. (1994). "Strategic resources: traits, configurations and paths to sustainable competitive advantage." Strategic management journal 15(2): pp.131–148.
[9] Bourne, L. and D. H. T. Walker. (2005). Visualizing and mapping stakeholder influence: Management Decision, 43 (5): pp.649 - 660.
[10] Bryson, J. (2010). The future of public and nonprofit planning in the United States Public Administration Review. Special Issue on the Future of Public Administration in 2020.
[11] Carpenter, M. A., & Sanders, W. G. (2009). Strategic Management A Dynamic Perspective Concepts, 2nd edition. London: Pearson Education Edition.
[12] Chan A.P.C, Tam C.M. (2000). "Factors affecting the quality of building projects in Hong Kong". International Journal on Quality and Reliability Management. 17(4/5): pp. 423-441.
[13] Charagu S. (2013), "Collapsing Building Structures In Kenya", 20th Engineers International Conference, Tom Mboya Labour College, Kisumu
[14] Connelly, L. M. (2008). Pilot studies. Medsurg Nursing, 17(6), 411-2. [15] Crawford, L. (2000). "Profiling the competent project manager. In Project
management research at the turn of the Millenium": Proceedings of PMI Research Conference, 3 - 15. Paris, 21 - 24: Sylva, NC: Project Management Institute.
[16] Creswell, J.W (1994), Research Design: Qualitative and Quantitative Approaches. Thousand Oaks: CA Sage.
[17] Crook, T. R., Ketchen Jr., D. J., Combs, J. G., & Todd, S. Y. (2008), "Strategic resources and performance": A meta-analysis. Strategic Management Journal; 29, pp. 1141–1154.
[18] Deakin, P. (1999), "Client's local experience on design and build projects", Seminar Proceedings on Design and Build Procurement System, January, Hong Kong, pp.11-16
[19] Deloitte (2013), Office Politics: Improving public sector property management, Global.
[20] Dess, G. G.; Lumpkin G.T. & Eisner, A.B. (2010). Strategic Management: Creating Competitive Advantages. 5th ed. New York: McGraw-Hill Irwin
[21] Dess, G.G. & Miller, A. (1993). Strategic Management. Mc Grow-Hill book Co. New York.
[22] Dye, R. & Sibony, O. (2007). How to improve strategic planning: McKinsey Quarterly
[23] EC Harris Research (2013). Market View UK. [24] EC Harris Research. (2013), International Construction Costs: A Change Of
Pace, Arcadis Co. [25] Eisenhardt, K. & Martin J. (2000) "Dynamic Capabilities: What are they?"
Strategic Management Journal, Vol. 21, pp. 1105-1121. [26] Elias, A. A., L. S. Jackson and R. Y. Cavana. (2004). Changing positions
and interests of stakeholders in environmental conflict: A New Zealand transport infrastructure case. Asia Pacific Viewpoint, 45 (1): pp. 87 - 104.
[27] Freeman, R. E, (1984). Strategic management: A stakeholder approach. Pitman, Boston.
[28] Freeman, R. E. and J. McVea (2001). A Stakeholder approach to strategic management, Hitt, M.A., Freeman, R. E. and Harrison, J. S., The Blackwell Handbook of Strategic Management, Blackwell Business, Oxford, pp. 189 - 207.
[29] Freeman, R.E. (1994) A stakeholder theory of the modern corporation. In: Beauchamp, T.L. and Bowie, N.E. (eds) Ethical Theory and Business. Englewood Cliffs, NJ: Prentice-Hall, pp. 66–76.
[30] Friedman, Andrew L.; Samantha Miles (2002) Stakeholders: Theory and Practice. Oxford University Press.
[31] Galbreath, J. (2005). Which resources matter the most to firm success? An exploratory study of resource based theory? Technovation 25(9): pp.979–987.
[32] Goodijk, R. (2003) Partnership at corporate level: The meaning of the stakeholder model. Journal of Change Management, 3(3):225–241.
[33] Goodpaster, K.E. (1991) Business ethics and stakeholder analysis. Business Ethics Quarterly, 1(1):53–73.
[34] Gray, C. and Flannagan, R. (1989) The Changing Role of Specialist and Trade Contractors. Ascot: The Chartered Institute of Building.
[35] Hamel, G. (2000). Leading the Revolution, Harvard Business School Press. [36] Hemlin, D. (1999), "Contractor's local experience on design & build
projects", Seminar Proceedings on Design and Build Procurement System, January, Hong Kong, pp.17-26
[37] Hill, C.W.L. & Jones, G.(2009). Strategic Management Theory: An Integrated Approach.9th ed. Mason, Ohio: Cengage Learning.
[38] Hillman, A. J. and G. D. Keim. (2001). "Shareholder value, stakeholder management, and social issues": What's the bottom line? Strategic Management Journal, 22: pp.125 - 139.
[39] Hunger D.J, Wheelen T.L, (2006). Concepts in Strategic Management and Business Policy. 10th ed. Pearson Education, Inc. New Jersey
[40] Ibbs, C. W., Wong, C.K. and Kwak, Y.H. (2001). “Project change management system”, Journal of Management in Engineering, 17(3), pp. 159-165.
[41] Jeremy Galbreath, (2005) Which resources matter the most to firm success? An exploratory study of resource-based theory, Technovation 25 979–987
[42] Johnson, G. & Scholes K. (2006). Exploring corporate strategy (6th ed). Harlow: Prentice Hall.
[43] Johnson, G., Scholes, K., & Whittington, R. (2007). Exploring Corporate Strategy, (8th ed) England: Pearson Education Limited.
[44] Jonker, J. and D. Foster. (2002). Stakeholder excellence? Framing the evolution and complexity of a stakeholder perspective of the firm. Corporate social responsibility and Environmental Management, 9: pp.187 - 195.
[45] K.C. Iyer & K.N. Jha. (2005). "Factors affecting cost performance: evidence from Indian construction projects", International Journal of Project Management ,23, pp.283-295.
[46] Kenya National Bureau of Statistics (2011), Kenya Economic Survey [47] Kevin Keller (2001)., Building Customer-Based Brand Equity, MM
Publishers. [48] Kogut, B. and Kulatilaka, N. (2001), Capabilities as real options,
Organization Science, Vol. 12 No. 6, pp. 744-58. [49] Lim, G., H. Ahn and H. Lee. (2005). Formulating strategies for stakeholder
management: a case based reasoning approach. Expert Systems with Applications, 28: pp. 831 - 840.
[50] Loasby, B.J. (2002), "Options and evolution", paper presented at the Druid Summer Conference, available at: www.druid.dk
[51] Logsdon, J.M. and Wood, D.J. (2000) Introduction. In: Logsdon, J.M., Wood, D.J. and Benson, L.E. (eds) Research in Stakeholder Theory, 1997–1998: The Sloan Foundation Minigrant Project. Toronto: Clarkson Centre for Business Ethics, pp. 1–4.
[52] Macmillian, H. and M. Tampoe, 2000, Strategic Management: Process, Content and Implementation, Oxford University Press, New York
[53] Majumdar, P.K. (2005), Research Methods in Social Science. New Delhi: Viva Books Private Limited.
[54] Mitchell, R. K., R. R. Agle and D. J. Wood. (1997). "Toward a theory of stakeholder identification and salience": Defining the principle of how and what really counts. Academy of Management Review, 22 (4): 853 - 886.
[55] Moloney, K. (2006) Rethinking Public Relations: PR Propaganda and Democracy (2nd edn). London: Routledge.
[56] Mugenda, O.M and Mugenda A.G. (2003), Research Methods: Quantitative and Qualitative Approaches, Nairobi: ACTS Press
[57] Nag, R., Hambrick, D., & Chen, M. (2007). "What is strategic management really?" Inductive derivation of a consensus definition of the field. Strategic Management Journal, 28(9): pp. 935-955
[58] Newcombe, R. (2003). "From client to project stakeholders": a stakeholder mapping approach. Construction Management and Economics, 21: pp.841-848.
[59] Nuhu Braimah & Issaka Ndekugri. (2008), "Factors influencing the selection of delay analysis methodologies", International Journal of Project Management, 26, pp.789-799.
International Journal of Scientific and Research Publications, Volume 5, Issue 6, June 2015 36 ISSN 2250-3153
www.ijsrp.org
[60] Pearce II, J. and Robinson Jr.,2000, Strategic Management: Formulation, Implementation and Control, Seventh Edition, McGraw-Hill International
[61] Pearce, D. (2003). The Social and Economic Value of Construction: The Construction Industry's Contribution to Sustainable Development. Construction Industry Research and Innovation Strategy Panel, UK.
[62] Phillips, Robert (2003). Stakeholder Theory and Organizational Ethics. Berrett-Koehler Publishers.
[63] Post, James (2002). Redefining the Corporation: Stakeholder Management and Organizational Wealth. Stanford University Press.
[64] PricewaterhouseCoopers (2013), Reconstructing productivity: Productivity in the Construction Industry, Australia
[65] Pryor, P. (2001). Marketing Construction Services. Industrial Press, Inc., New York
[66] Rabin, J.G.J. Miller and W.B.Hildreth, 2000, Handbook of Strategic Management, 2nd Edition, Marcel Dekker Inc. USA
[67] Ray, G., Barney, J.B. & Muhanna, W. (2004). "Capabilities, business processes, and competitive advantage: Choosing the dependent variable in empirical tests of the resource-based view". Strategic Management Journal 25 (1): pp.23–37.
[68] Rippin, A. (2002), Team-working, Capstone Publishing, Oxford [69] Robinson, S.(2002), Research Methodology. Washington D.C: National
Academies Press [70] Roger G. Schroeder, Kimberly A. Bates and Mikko A. Junttila, (2002). "A
Resource-based view of manufacturing strategy and the relationship to manufacturing performance", Strategic Management Journal, Vol. 23, No. 2, pp.105-117
[71] Schendel, D (1994) Strategy: search for new paradigms, Introduction to the summer special issue. Strategic Management Journal 15: pp. 1-4
[72] Senge, P.M. (1990). The fifth discipline. The art & practice of the learning organization. Random House, London. pp. 424.
[73] Simon, H. A. (2002). We and they: The human urge to identify with groups. Industry. Corporate Change 11(3) pp.607–610.
[74] Smith, A., Wilkins, B. (1996), "Team relationships and related critical factors in the successful procurement of health care facilities", Journal of Construction Procurement, Vol. 2 No.1, pp.30-40.
[75] Smyth, H. (2000). Marketing and Selling Construction Services. Blackwell Science, London.
[76] Songer, A.D., Molenaar, K.R. (1997), "Project characteristics for successful public-sector design-build", Journal of Construction Engineering and Management, Vol. 123 No.1, pp.34-40
[77] Takim R, Akintoye A (2002). A conceptual model for successful construction project performance, .Second International Postgraduate Research Conference in Built and Human Environment, University of Salford, Salford.
[78] Teece, D. J., G. Pisano. (1994). The dynamic capabilities of firms: An introduction. Industry. Corporate Change 3(3) pp.537–556.
[79] Teece, D., Pisano, G. & Shuen, A. (1997) Dynamic capabilities and strategic management, Strategic Management Journal, Vol. 18, pp. 509-533.
[80] Teece, David J. (2007). “Explicating Dynamic Capabilities: The Nature and Micro-foundations of (Sustainable) Enterprise Performance,” Strategic Management Journal, 28(13): pp.1319-1350.
[81] Vinten, G. (2000). The stakeholder manager. Management Decision, 28 (6): 377 - 383
[82] Waithaka J. (2011). Construction is top performing industry in Kenya’s economy. http://www.the-star.co.ke/ Accessed in Oct.2014
[83] Wernerfelt, B (1984). A resource based view of the firm. Strategic Management Journal, Vol. 5, Issue: 2, pp.171-180.
[84] Zeithmal,V. and Bitner,M.(2000). Services Marketing. Irwin McGraw-Hill, Boston.
AUTHORS First Author – Paul Kamau Waweru, Master of Business Administration, Jomo Kenyatta University of Agriculture and Technology Second Author – Dr. Jane Omwenga, Supervisor, Jomo Kenyatta University of Agriculture and Technology


![CURICULLUM VITEA - sitcoe.ac.in2] “Application of Wind Energy in Two Wheeler”, International Journal of Scientific and Research Publications, ISSN 2250-3153. 3] “Artificial Wind](https://img.dokumen.tips/doc/110x75/5f0e7c097e708231d43f78a1/curicullum-vitea-2-aoeapplication-of-wind-energy-in-two-wheelera-international.jpg)


