Embed Size (px)
Citation preview

821Urban Lake Management
The Influence of Septic Systemsat the Watershed Level
by Chris Swann
Introduction
Septic systems remain an enigmatic but poten-tially significant pollutant source in small water-sheds. An estimated 23% of all households in theUnited States rely on septic systems to meet theirwastewater disposal needs (US Census, 1999), andwatershed managers routinely express concern abouttheir potential impact on the quality of lakes, coastalwaters and drinking water supplies. However, whilewe know a great deal about the performance of indi-vidual septic systems at the site level, we know verylittle about their aggregate impacts at the watershedlevel, and what influence they may collectively haveon water quality.
A quick perusal of the literature will reveal hun-dred of citations on the performance of different septicsystem technologies under a variety of soil condi-tions. But at almost any level, we lack the hard data onthe collective influence of septic systems on thewatershed. We are often in the dark about questionslike the following:
• How many septic systems are actually located inany given watershed?
• How many of these systems are failing, and whatexactly constitutes failure?
• What nutrient loads are generated from a func-tioning septic system?
• What happens to nutrients after they leave thedrainfield?
• How much does septic system performance de-cline with age?
• How much vertical and lateral sepa-ration distance is needed to reduceloadings?
• Is there a threshold value for septicloadings to the soil on a watershed basis?
This article summarizes current research on thepotential risk of surface and subsurface pollution fromseptic systems. First, we provide a quick overview ofbasic septic system concepts and define some of theterminology every watershed manager should knowwhen examining septic systems as a pollutant source.Next, we review research on nutrient loading fromseptic systems and estimate their potential nitrogenand phosphorus loads. From there, we examine thecauses of septic system failure and explore recentchanges in technology that could address possiblefailures. Next, we look at the pros and cons of usingseptic system regulation as a growth managementtechnique for sensitive watersheds. Finally, we suggestsome priorities for future watershed research.
Basic Concepts for Septic Systems
The diverse terminology used to describe septicsystem technologies can often be quite confusing. Forexample, septic systems are sometimes referred to asonsite wastewater treatment systems (OWTS), onsitesewage disposal systems (OSDS), or wastewater infil-tration systems. To facilitate understanding, we havesimplified the terminology and placed septic systemsinto three basic categories: conventional, alternative,and innovative (Table 1).
Table 1. Summary of Septic System Types
System Type ConstructionCost
MaintenanceNeeds
Nitrogen RemovalCapability
Acceptance byPublic Health
Officials
Conventional ° ° ° ¯
Alternative ™ ™ ° ™
Innovative ¯ ¯ ¯ °
° - Low ™ - Moderate ̄ - High
822 Urban Lake Management
Figure 1. Conventional Septic System Design(Soap and Detergent Association, 2001)
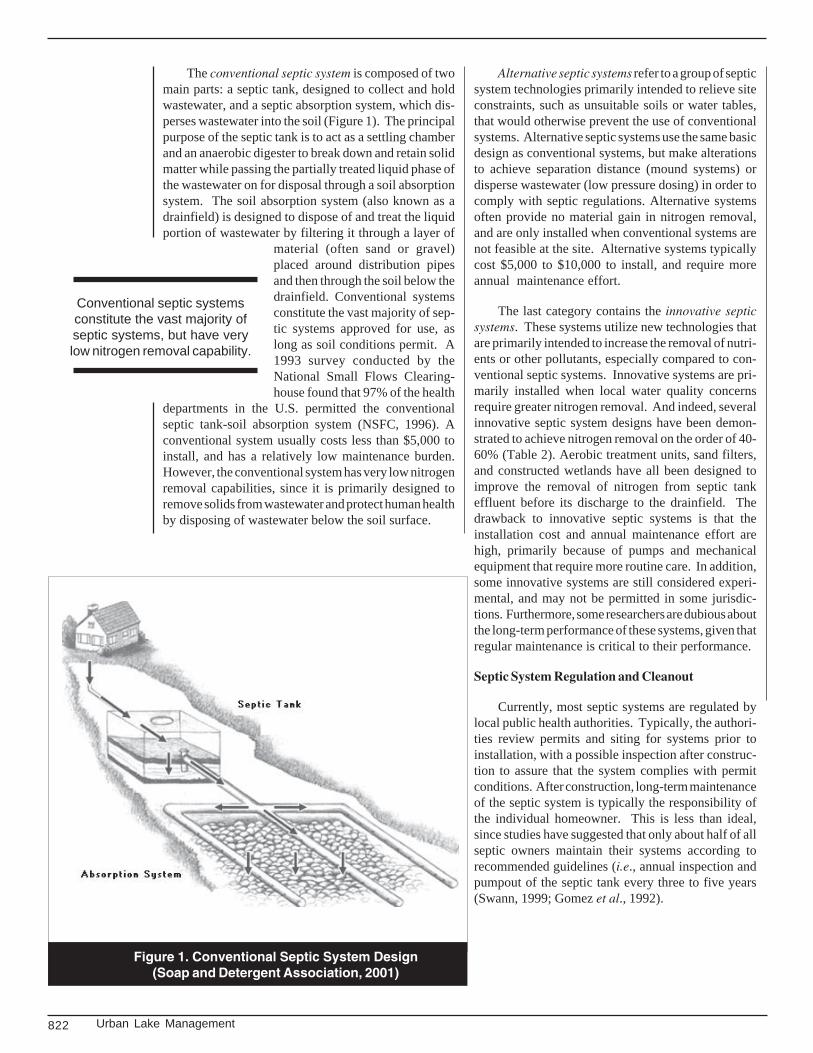
The conventional septic system is composed of twomain parts: a septic tank, designed to collect and holdwastewater, and a septic absorption system, which dis-perses wastewater into the soil (Figure 1). The principalpurpose of the septic tank is to act as a settling chamberand an anaerobic digester to break down and retain solidmatter while passing the partially treated liquid phase ofthe wastewater on for disposal through a soil absorptionsystem. The soil absorption system (also known as adrainfield) is designed to dispose of and treat the liquidportion of wastewater by filtering it through a layer of
material (often sand or gravel)placed around distribution pipesand then through the soil below thedrainfield. Conventional systemsconstitute the vast majority of sep-tic systems approved for use, aslong as soil conditions permit. A1993 survey conducted by theNational Small Flows Clearing-house found that 97% of the health
departments in the U.S. permitted the conventionalseptic tank-soil absorption system (NSFC, 1996). Aconventional system usually costs less than $5,000 toinstall, and has a relatively low maintenance burden.However, the conventional system has very low nitrogenremoval capabilities, since it is primarily designed toremove solids from wastewater and protect human healthby disposing of wastewater below the soil surface.
Alternative septic systems refer to a group of septicsystem technologies primarily intended to relieve siteconstraints, such as unsuitable soils or water tables,that would otherwise prevent the use of conventionalsystems. Alternative septic systems use the same basicdesign as conventional systems, but make alterationsto achieve separation distance (mound systems) ordisperse wastewater (low pressure dosing) in order tocomply with septic regulations. Alternative systemsoften provide no material gain in nitrogen removal,and are only installed when conventional systems arenot feasible at the site. Alternative systems typicallycost $5,000 to $10,000 to install, and require moreannual maintenance effort.
The last category contains the innovative septicsystems. These systems utilize new technologies thatare primarily intended to increase the removal of nutri-ents or other pollutants, especially compared to con-ventional septic systems. Innovative systems are pri-marily installed when local water quality concernsrequire greater nitrogen removal. And indeed, severalinnovative septic system designs have been demon-strated to achieve nitrogen removal on the order of 40-60% (Table 2). Aerobic treatment units, sand filters,and constructed wetlands have all been designed toimprove the removal of nitrogen from septic tankeffluent before its discharge to the drainfield. Thedrawback to innovative septic systems is that theinstallation cost and annual maintenance effort arehigh, primarily because of pumps and mechanicalequipment that require more routine care. In addition,some innovative systems are still considered experi-mental, and may not be permitted in some jurisdic-tions. Furthermore, some researchers are dubious aboutthe long-term performance of these systems, given thatregular maintenance is critical to their performance.
Septic System Regulation and Cleanout
Currently, most septic systems are regulated bylocal public health authorities. Typically, the authori-ties review permits and siting for systems prior toinstallation, with a possible inspection after construc-tion to assure that the system complies with permitconditions. After construction, long-term maintenanceof the septic system is typically the responsibility ofthe individual homeowner. This is less than ideal,since studies have suggested that only about half of allseptic owners maintain their systems according torecommended guidelines (i.e., annual inspection andpumpout of the septic tank every three to five years(Swann, 1999; Gomez et al., 1992).
Conventional septic systemsconstitute the vast majority ofseptic systems, but have verylow nitrogen removal capability.

823Urban Lake Management
Inspection and maintenance can have a directimpact on the life span of septic systems. The designlife of a septic system is estimated to be 12 to 20 years(MOSDTF, 1999). However, many existing septic sys-tems are much older, having been installed severaldecades ago. For example, one national survey (USEPA, 2000) indicated that more than half of existingsystems are more than 30 years old. The same surveyfound that at least 10% of all systems are not workingat any given time. Another survey discovered thatabout one fourth of all septic systems in the Chesa-peake Bay watershed are more than 30 years old (Swann,1999). Nationally, more than 80 million homes werebuilt before 1979, and many of these are served byseptic systems that are presumably well beyond theirdesign life.
Septic System Failure From a WatershedPerspective
For the watershed manager, it could be argued thatevery septic system experiences failure to some degree,since they can never produce zero wastewater dis-charge. Nationwide, failure rates for septic systemsvary, but the regional rate of septic failure is reportedto range between five and 40%, with an average ofabout 10%. Maryland and Virginia have reportedfailure rates of 5% for their septic systems (Fehr and Pae,1997).
To further complicate the picture, septic systemauthorities often give conflicting definitions of fail-ure. At the watershed level, a failing system may beconsidered one that discharges effluent with pollutantconcentrations that can impair downstream water qual-ity. An understanding of septic system failure is
important, since it has implications for watershed-ap-propriate management.
Failures can usually be placed into one of threecategories: hydraulic failures, subsurface failures, andtreatment failures. Hydraulic failure is the type thatpeople traditionally think of when talking about failingsystems: the drainfield or distribution system has be-come completely clogged, and sewage backs up in thehouse or breaks out on the surface of the field. Withhydraulic failure, the septic system discharges partiallytreated wastewater that can have nitrogen, phosphorus,bacteria, and BOD levels similar to untreated wastewa-
Figure 1. An Example of Hydraulic Failure(Source: Houston/Galveston Area Council)
Figure 2. An Example of Hydraulic Failure(Houston/Galveston Area Council, 2000)
Table 2: Nitrogen Removal for Innovative Septic Systems
System TypeNitrogenRemovalRange(mg/L)
Average NitrogenRemoval
(%)
EstimatedLbs. of N
Removed *
Capital Cost($ Per System)
AnnualMaintenance
Cost($/yr)
Conventional SepticSystem
10-40 20 5.5 2,700-6,700 95
Intermittent Sand FilterSystem
10-65 45 12.5 5,360-10,720 140
Recirculating Sand FilterSystem
40-85 60 16.75 6,000-10,700 195
Aerobic Treatment Units 25-65 55 15 3,000-6,300 225
Constructed Wetland 25-90 55 15 4,000-10,000 55
Sources: U.S. EPA, 1993; Reed et al., 1995; Tetra Tech, Inc., 1999; Mooers and Waller, 1997; MSSAC, 2000.*assumed 2.5 persons per system

824 Urban Lake Management
ter. This type of failure is often short-term in nature, sinceit is readily noticeable to the homeowner (see Figure 2).Because of the risks for public health, hydraulic failuresare usually quickly corrected by local agencies oncethey are identified.
Hydraulic failures obviously deliver a significantamount of pollutants to local water bodies, especially incoastal and lake shoreline areas. For example, a study ofphosphorus contribution from older septic systems to alake in Washington state found a failing system thatdaily contributed 3.5 mg/L total phosphorus directly tothe lake through surface flow (Gilliom and Patmont,
1983). The author suggested thatpoor siting in a wet area may havecontributed to the problem.
With hydraulic failure, the threatof bacterial contamination becomesvery important. Many reports ofdisease outbreaks are linked toground water contamination by sep-
tic system effluent. In fact, effluent from septic systemsis the most frequently cited source of ground watercontamination leading to diseases such as acute gas-trointestinal illness, hepatitis A, and typhoid (US EPA,1986). Surface and groundwater impacts from hydraulicfailures have been documented in a number of studies.For example, Cogger (1988) reported incomplete mi-crobe removal when groundwater is near or at the samedepth as the absorption trench. Another study of season-ally used septic systems in coastal Rhode Island foundthat fecal coliform concentrations at two sites were often
in excess of marine recreational standards, even at 20meters away from the soil absorption system. This wasattributed to the absence of a biological clogging matand poor distribution of effluent throughout thedrainfield (Postma et al., 1992).
The second category of septic system failure in-volves subsurface plumes. In this case sewage isdistributed into the drainfield, but a plume of partiallytreated sewage moves through soil macropores, cracksor ditches. The extent of subsurface failure depends onsite conditions and system age, but plume formationappears to be a fairly common occurrence in sandysoils. The main water quality problems associated withsubsurface plumes are high nitrogen and phosphorusloads to downstream receiving waters.
Many studies have shown that subsurface nitro-gen plumes have a major impact on local water quality.Several studies have reported nitrate (NO
3) concentra-
tions varying from 10 mg/l to 70 mg/l within 10 to 100feet from the drainfield (Caradona, 1998). For phos-phorus, subsurface movement depends on soil textureand structure, pH, mineral content, and depth to thewater table or confining soil layer. Most research hasshown that phosphorus plumes are unusual in unsatur-ated soils with finer textures because most phosphorusis absorbed by the soil (Stolt and Reneau, 1991), andnumerous studies have documented a high degree ofphosphorus removal within the first few metersdowngradient from the drainfield (Weiskel and Howes,1992; Robertson et al., 1991; Wilhelm et al., 1994). Itappears that for a properly functioning system not
Hydraulic failures obviouslydeliver a significant amount of
pollutants to local water bodies.
Table 3. Subsurface Plumes and Septic Systems
Study Location Results
Grant, 1998 Indiana A study of near-shore development on 18 lakes found septicplumes entering the lakes even though all failing septicsystems had been replaced. Orthophosphate concentrationswere found to be 2-10 times higher near-shore than for midlake samples.
Harman et al.,1996
Ontario Found nitrate plumes in the groundwater beneath a 44-year-oldseptic system with nitrate concentrations above drinking waterlimits as far as 100 meters from the drainfield.
Robertson etal., 1991
Ontario A study documented rapid nitrification in a septic plume, with.nitrate concentrations in the plume core varying within a rangefrom 21 to 48 mg/l. Nitrate concentrations did not change as theseptic plume moved downgradient through a distance of 330feet.
Robertsonand Harman,1999
Ontario A study of two decommissioned septic systems found that if aphosphate plume is present before decommissioning,downgradient P loading is not likely to diminish for severalyears and may constitute a threat to downgradient surfacewaters.
825Urban Lake Management
located in soils conducive to plume formation, as muchas 95% of the phosphorus may be retained in the soil(Mandel and Haith, 1992). The exception appears tobe sandy soils and/or saturated soils, where movementof phosphorus into surface waters due to lower phos-phorus adsorption capacity has been cited as a sourceof phosphorus to lakes (Sagona, 1988; Grant, 1998).Table 3 examines the results of number of studies ofplume formation and nitrate and phosphate move-ment.
The final septic system failure category, treatmentfailure, may be the most ominous for the watershedmanager trying to protect water quality, particularly incoastal waters that are nitrogen sensitive. Treatmentfailure means that sewage is adequately treated withinthe soils of the drainfield, but nitrogen is not reducedbefore it reaches groundwater. Nitrogen is delivered togroundwater in the form of nitrate, which can contrib-ute to eutrophication in nitrogen-sensitive waters suchas estuaries, coastlines and some springs. (It should benoted that nitrogen loads are also produced by thedischarge of wastewater treatment plants, given howdifficult it is to reduce nitrate from wastewater).
Research has shown that conventional septic sys-tems can only remove about 10 to 20% of the nitrogenthat enter them. As a result, an average of about 23pounds of nitrogen (primarily nitrate) each year canmove from the drainfield and into groundwater, if notreatment in the soil occurs. The ultimate fate of thisnitrogen load is not known, although several research
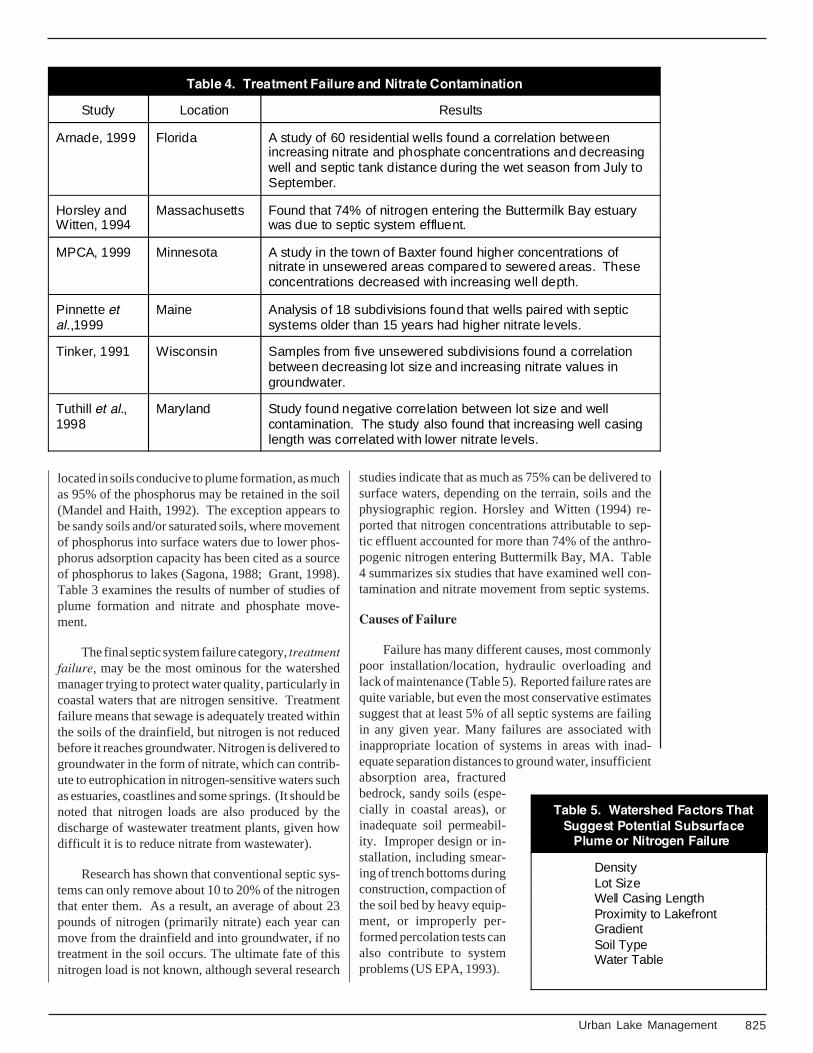
studies indicate that as much as 75% can be delivered tosurface waters, depending on the terrain, soils and thephysiographic region. Horsley and Witten (1994) re-ported that nitrogen concentrations attributable to sep-tic effluent accounted for more than 74% of the anthro-pogenic nitrogen entering Buttermilk Bay, MA. Table4 summarizes six studies that have examined well con-tamination and nitrate movement from septic systems.
Causes of Failure
Failure has many different causes, most commonlypoor installation/location, hydraulic overloading andlack of maintenance (Table 5). Reported failure rates arequite variable, but even the most conservative estimatessuggest that at least 5% of all septic systems are failingin any given year. Many failures are associated withinappropriate location of systems in areas with inad-equate separation distances to ground water, insufficientabsorption area, fracturedbedrock, sandy soils (espe-cially in coastal areas), orinadequate soil permeabil-ity. Improper design or in-stallation, including smear-ing of trench bottoms duringconstruction, compaction ofthe soil bed by heavy equip-ment, or improperly per-formed percolation tests canalso contribute to systemproblems (US EPA, 1993).
Table 4. Treatment Failure and Nitrate Contamination
Study Location Results
Arnade, 1999 Florida A study of 60 residential wells found a correlation betweenincreasing nitrate and phosphate concentrations and decreasingwell and septic tank distance during the wet season from July toSeptember.
Horsley andWitten, 1994
Massachusetts Found that 74% of nitrogen entering the Buttermilk Bay estuarywas due to septic system effluent.
MPCA, 1999 Minnesota A study in the town of Baxter found higher concentrations ofnitrate in unsewered areas compared to sewered areas. Theseconcentrations decreased with increasing well depth.
Pinnette etal.,1999
Maine Analysis of 18 subdivisions found that wells paired with septicsystems older than 15 years had higher nitrate levels.
Tinker, 1991 Wisconsin Samples from five unsewered subdivisions found a correlationbetween decreasing lot size and increasing nitrate values ingroundwater.
Tuthill et al.,1998
Maryland Study found negative correlation between lot size and wellcontamination. The study also found that increasing well casinglength was correlated with lower nitrate levels.
Table 5. Watershed Factors ThatSuggest Potential Subsurface
Plume or Nitrogen Failure
DensityLot SizeWell Casing LengthProximity to LakefrontGradientSoil TypeWater Table

826 Urban Lake Management
Watershed Tank Density
What indicators can be used to determine the poten-tial impact of septic systems in a watershed? One usefulindicator of potential impact is septic tank density (tanksper square mile). For example, based on our best esti-mates, about two million septic systems are currently inthe ground in the Chesapeake Bay watershed, withanother 15,000 to 20,000 new systems installed eachyear. The majority of the septic systems utilize theconventional septic tank and drainfield design. Thisequates to one tank per 20 acres. However, in a smallwatershed tank density can become significant: Figure3 illustrates the relationship between septic density,watershed development and residential zoning for a 10square mile watershed.
And certainly, an understanding of density is criti-cal to the watershed manager concerned with collectiveseptic system impacts. A number of studies have indi-cated that septic density is correlated to nitrogen loadingto groundwater. Cogger (1988) reported on a study ofnitrate levels in a shallow aquifer beneath a denselypopulated, 30 square mile unsewered area east of Port-land, Oregon. Nitrate averaged nearly 8 mg/L, with somewells exceeding the 10 mg/L EPA standard. Populationdensity was about five people/acre. Gold et al. (1990)also found that unsewered residential development us-ing half-acre zoning could produce nitrogen loadingscomparable to production agriculture. He recommendedthat denitrification systems be required on small lotzoning to ensure potable groundwater in coastal areas.
A knowledge of watershed tank density helps man-agers calculate potential subsurface waste flows fromexisting systems, identify areas of concern and plan for
more intensive monitoring. In addition, septic densitycan be combined with information on system age tolocate areas with high potential failure rates. Finally,septic density permits the watershed manager to esti-mate the sum of the potential pollutant load from bothexisting and future systems and determine the best wayto control septic system discharges to meet waterquality standards. Suggestions for changes in land useplanning to limit new development in areas with highseptic densities can be made to avoid additional nutri-ent loading to local waters.
Potential Pollutant Loadings From Septic Systems
Conventional septic tank effluent can contributenitrogen, phosphorus, and bacteria to the drainfield, afraction of which will eventually enter ground orsurface waters. Of paramount concern to the watershedmanager is the amount of these pollutants that willenter local lakes, streams, or estuaries. The manystudies on septic system performance are often con-flicting or confusing in this regard. However, a reviewof some basic numbers can help watershed managersunderstand the potential pollutant loads from septicsystems.
The first numbers needed to make an estimate ofpotential septic system loads are per-capita or perhousehold sewage flows. The average person gener-ates about 40 - 80 gallons per day of wastewater, withhouseholds on septic systems tending to fall on thelower end of the range. The household sewage flow iseasily estimated by multiplying the per capita flow rateby the average number of people per household (na-tionally, about 2.7 people per household). Under thesecalculations, approximately 108 - 218 gallons of waste-
0
2000
4000
6000
8000
10000
12000
14000
0 10 20 30 40 50 60 70 80 90 100
% of Watershed Developed
Max
imu
m #
of
Sep
tic
Tan
ks
1/2 Acre Lots
1 Acre Lots
2 Acre Lots
5 Acre Lots
Figure 3. The Relationship Between Septic Density and Watershed Development
827Urban Lake Management
water flows are produced daily by each household. Toput these statistics into perspective, a one milliongallon per day sewer system that collects and treatswastewater typically serves from two to 10 thousandhouseholds (with a mean of 7,500).
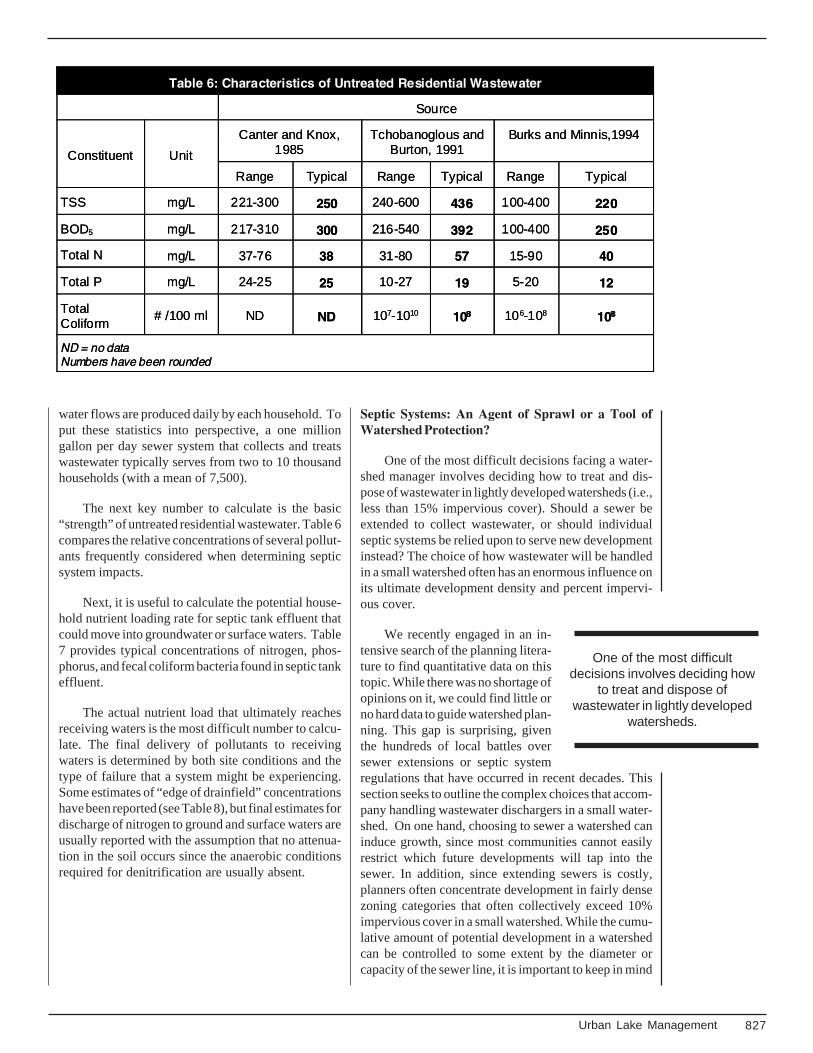
The next key number to calculate is the basic“strength” of untreated residential wastewater. Table 6compares the relative concentrations of several pollut-ants frequently considered when determining septicsystem impacts.
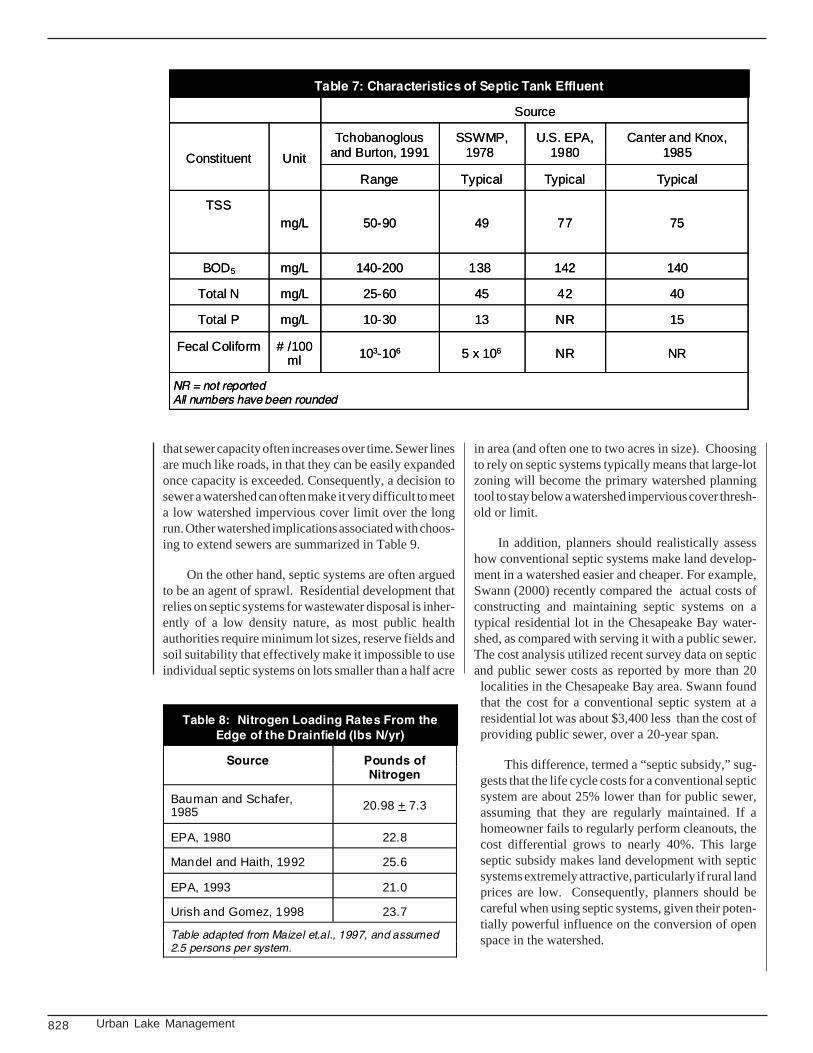
Next, it is useful to calculate the potential house-hold nutrient loading rate for septic tank effluent thatcould move into groundwater or surface waters. Table7 provides typical concentrations of nitrogen, phos-phorus, and fecal coliform bacteria found in septic tankeffluent.
The actual nutrient load that ultimately reachesreceiving waters is the most difficult number to calcu-late. The final delivery of pollutants to receivingwaters is determined by both site conditions and thetype of failure that a system might be experiencing.Some estimates of “edge of drainfield” concentrationshave been reported (see Table 8), but final estimates fordischarge of nitrogen to ground and surface waters areusually reported with the assumption that no attenua-tion in the soil occurs since the anaerobic conditionsrequired for denitrification are usually absent.
Septic Systems: An Agent of Sprawl or a Tool ofWatershed Protection?
One of the most difficult decisions facing a water-shed manager involves deciding how to treat and dis-pose of wastewater in lightly developed watersheds (i.e.,less than 15% impervious cover). Should a sewer beextended to collect wastewater, or should individualseptic systems be relied upon to serve new developmentinstead? The choice of how wastewater will be handledin a small watershed often has an enormous influence onits ultimate development density and percent impervi-ous cover.
We recently engaged in an in-tensive search of the planning litera-ture to find quantitative data on thistopic. While there was no shortage ofopinions on it, we could find little orno hard data to guide watershed plan-ning. This gap is surprising, giventhe hundreds of local battles oversewer extensions or septic systemregulations that have occurred in recent decades. Thissection seeks to outline the complex choices that accom-pany handling wastewater dischargers in a small water-shed. On one hand, choosing to sewer a watershed caninduce growth, since most communities cannot easilyrestrict which future developments will tap into thesewer. In addition, since extending sewers is costly,planners often concentrate development in fairly densezoning categories that often collectively exceed 10%impervious cover in a small watershed. While the cumu-lative amount of potential development in a watershedcan be controlled to some extent by the diameter orcapacity of the sewer line, it is important to keep in mind
One of the most difficultdecisions involves deciding how
to treat and dispose ofwastewater in lightly developed
watersheds.
Table 6: Characteristics of Untreated Residential Wastewater
Source
Constituent Unit
Canter and Knox,1985
Tchobanoglous andBurton, 1991
Burks and Minnis,1994
Range Typical Range Typical Range Typical
TSS mg/L 221-300 250 240-600 436 100-400 220
BOD5 mg/L 217-310 300 216-540 392 100-400 250
Total N mg/L 37-76 38 31-80 57 15-90 40
Total P mg/L 24-25 25 10-27 19 5-20 12
TotalColiform
# /100 ml ND ND 107-1010 1088 106-108 1088
ND = no dataNumbers have been rounded
828 Urban Lake Management
Table 8: Nitrogen Loading Rates From theEdge of the Drainfield (lbs N/yr)
Source Pounds ofNitrogen
Bauman and Schafer,1985 20.98 + 7.3
EPA, 1980 22.8
Mandel and Haith, 1992 25.6
EPA, 1993 21.0
Urish and Gomez, 1998 23.7
Table adapted from Maizel et.al., 1997, and assumed2.5 persons per system.
that sewer capacity often increases over time. Sewer linesare much like roads, in that they can be easily expandedonce capacity is exceeded. Consequently, a decision tosewer a watershed can often make it very difficult to meeta low watershed impervious cover limit over the longrun. Other watershed implications associated with choos-ing to extend sewers are summarized in Table 9.
On the other hand, septic systems are often arguedto be an agent of sprawl. Residential development thatrelies on septic systems for wastewater disposal is inher-ently of a low density nature, as most public healthauthorities require minimum lot sizes, reserve fields andsoil suitability that effectively make it impossible to useindividual septic systems on lots smaller than a half acre
in area (and often one to two acres in size). Choosingto rely on septic systems typically means that large-lotzoning will become the primary watershed planningtool to stay below a watershed impervious cover thresh-old or limit.
In addition, planners should realistically assesshow conventional septic systems make land develop-ment in a watershed easier and cheaper. For example,Swann (2000) recently compared the actual costs ofconstructing and maintaining septic systems on atypical residential lot in the Chesapeake Bay water-shed, as compared with serving it with a public sewer.The cost analysis utilized recent survey data on septicand public sewer costs as reported by more than 20localities in the Chesapeake Bay area. Swann foundthat the cost for a conventional septic system at aresidential lot was about $3,400 less than the cost ofproviding public sewer, over a 20-year span.
This difference, termed a “septic subsidy,” sug-gests that the life cycle costs for a conventional septicsystem are about 25% lower than for public sewer,assuming that they are regularly maintained. If ahomeowner fails to regularly perform cleanouts, thecost differential grows to nearly 40%. This largeseptic subsidy makes land development with septicsystems extremely attractive, particularly if rural landprices are low. Consequently, planners should becareful when using septic systems, given their poten-tially powerful influence on the conversion of openspace in the watershed.
Table 7: Characteristics of Septic Tank Effluent
Source
Constituent Unit
Tchobanoglousand Burton, 1991
SSWMP,1978
U.S. EPA,1980
Canter and Knox,1985
Range Typical Typical Typical
TSSmg/L 50-90 49 77 75
BOD5 mg/L 140-200 138 142 140
Total N mg/L 25-60 45 42 40
Total P mg/L 10-30 13 NR 15
Fecal Coliform # /100ml 103-106 5 x 10⁶ NR NR
NR = not reportedAll numbers have been rounded

829Urban Lake Management
Table 9. Key Watershed Issues to Consider When Choosing Wastewater Options
EXTEND SEWERS EMPLOY SEPTIC SYSTEMS
PRO CON PRO CON
Single NPDES permit possibleinfiltration/inflow
potential growth controlin watershed
harder to treat multipleunits or densedevelopment
greater probability ofregular maintenance
probability of sanitarysewer overflows
lower life cycle cost perdwelling unit
subsurface nitrogenloads
potentially highernitrogen removal, ifBNR used
risk of induced growth potentially highernitrogen removal, ifinnovative systems
high potential for future failure, in someareas
immediate repair forfailing septic systems
higher life cycle costper dwelling unit
hundreds of ownersto monitor
utility structure existsfor wastewater mgmt
physical alteration of stream corridor bysewer line construction
no enforcementmechanism tomaintain, upgrade orrehab older units
potential wellcontamination
Planners should realisticallyassess how conventional septic
systems make landdevelopment in a watershed
easier and cheaper.
It should be noted that the septic subsidy com-pletely disappears when innovative septic systems areinstalled to reduce nitrogen loads. Over a 20-yearperiod, the cost to construct and maintain innovativeseptic systems was roughly equivalent to the averagecost for public sewer.
Still, septic systems can be a useful tool for achiev-ing watershed impervious cover limits of 10 or 15%, iftheir aggregate impact on pollutant loading and landconversion are considered in a watershed plan. Forexample, watershed managers might want to considersetting a minimum residential lot size greater than oneacre. As noted by Cappiella and Brown (this issue),even one-acre lot zoning produces more than 10%impervious cover across a small watershed, unless aconsiderable fraction of watershed area cannot bedeveloped because of the presence of parks, farms,steep slopes, flood plains, wetlands, buffers, conserva-tion areas or unsuitable soils.
Watershed managers should also carefully evalu-ate the available range of alternative septic systemsthat can be installed in the watershed. Often, thesealternative systems enable septic treatment on siteswhere conventional septic systems are unsuitable, andconsequently, increase the inventory of buildable resi-dential lots in a watershed. In some cases, this mayexceed maximum impervious cover thresholds or tar-gets for a small watershed. In addition, while alterna-tive septic systems alleviate many site constraints,
most provide no material improvement in pollutantreduction, particularly for nutrients. Lastly, alternativesystems usually have higher maintenance needs, andthus may present a higher risk of one of the three kindsof potential failure.
Septic System Criteria for Sensitive Watersheds
If septic systems are chosen totreat wastewater in a sensitive water-shed, managers should carefully regu-late where and how they are installed,and whether or not they should useinnovative technologies to reducenitrogen. With this in mind, 10 crite-ria should be considered when regu-lating septic systems to protect a sen-sitive watershed:
1. Designate Areas of Concern in the Watershed.More stringent septic system setbacks and/or innovativetechnologies should be required for new systems locatedwithin areas of concern (MOSDTF, 1999). Examples ofpotential areas of concern that might be delineatedwithin a watershed include areas with the followingcharacteristics:
• Have experienced prior widespread failures
• Drain to water supply reservoirs
• Are within a wellhead protection area
830 Urban Lake Management
• Currentlyexperiencehigh nitrateconcentration in wells
• Are in closeproximity totidal waters
• Are in closeproximity to lake
shorelines
• Have karst terrain
• Drain to shellfish beds or swimming beaches
2. Setbacks: Communities should examine theirmandatory distances from streams, ditches, tidal waterwaters, lake shorelines, and down gradient wells toensure adequate water quality protection.
3. Separation Distances: The vertical separationfrom bedrock, confining soil layers, or seasonally highwater table should be based on soils and terrain, butshould be a minimum of two to four feet.
4. Reserve Fields: For communities that have areserve field requirement, the reserve area should also beafforded protection. This might include marking thelocation on septic systems plans, placing restrictions onhow the land is used, and avoiding activities that couldcompact the soil. In addition, communities might exam-ine the concept of alternating drainfields on a regularbasis to extend the life of the system.
5. Alternative Technology: Communities shouldestablish a certification/verification process for alterna-tive technologies (MOSDTF, 1999).
6. Innovative Technology: When an onsite waste-water treatment system is to be located in an area ofconcern, regulations should require either mandatory orpreferred use of recirculating sand filters, aerobic treat-ment units or constructed wetlands.
7. Creation of septic management districts or en-forceable maintenance agreements. Lack of mainte-nance is a leading cause of septic failure, and communi-ties should create a mechanism to guarantee continuedmaintenance (see Table 10).
8. Minimum Lot Size: Given the minimum lot sizesestablished by zoning, watershed managers should cal-culate what the impervious cover will be to ensure thatimpervious cover limits or targets are not exceeded.
9. Inspections and certification: Many communi-ties have made inspections of existing systems manda-tory at time of real estate transfer, expansion or changein use (e.g., Massachusetts, Wayne County, MI,Cuyahoga County, OH, Thurston County, WA, StinsonBeach, CA). An example of a septic inspection ordi-nance is available at the Center for Watershed Protec-tion website at www.cwp.org.
10. Allow shared systems: Shared wastewatersystems should be permitted for appropriate openspace or cluster subdivisions that promote greaterwatershed protection.
EPA plans to publish a new Onsite WastewaterTreatment Systems Manual in 2001 that will encour-age the use of performance-based systems and willcontain current information on the performance anddesign of alternative systems, especially those in-stalled in areas with sensitive or threatened waterresources. Check the EPA Office of Wastewater Man-agement website at http://www.epa.gov/owm/decentfor more information.
Septic System Maintenance Programs
Proper maintenance of existing and new septicsystems should be an integral part of local watershedplans. A recent survey found that 46% of septic systemowners in the Chesapeake Bay had not performed apumpout in the recommended timeframe (Swann, 1999).An extrapolation of this number across the ChesapeakeBay suggests that almost a million septic systems arenot properly inspected or maintained.
A number of variables should affect how the man-agement of septic systems occurs. These include pro-tection of public health, the sensitivity of the receivingenvironment, the cost of the treatment processes and/or equipment employed, and the resources and admin-istrative authority of the local government. A compre-hensive septic system management program shouldultimately contain the following elements:
1. System performance requirements to protect hu-man health and the environment
2. System management agreements or guidelines tomaintain performance
3. Compliance inspection and enforcement to en-sure system performance is maintained
4. Technical guidelines for site evaluation, design,construction, operation and acceptable designsfor specific site conditions and use
5. Training and certification/licensing for systeminstallers and septage haulers

831Urban Lake Management
6. Program audits to maintain the foundation of themanagement program on sound practices and pro-cedures
A number of program options exist to improve themaintenance of septic systems. These programs mayuse a variety of tools to keep existing septic systemsproperly maintained, such as regular inspection pro-grams, discharge permits, certification at time of saleand resale, operational permits, and mandatory inspec-tion contract requirements. Several innovative septicsystem management programs are profiled in Table 10.Communities should consider adopting these innova-tive programs, especially for sensitive watersheds suchas drinking water reservoirs, natural lakes, and coastalshellfish areas. In addition, the responsibilities ofseptic system ownership should be a stronger and moreconsistent theme of watershed education programs.
The US EPA recognized the importance of im-proved management with its recently issued draft guide-lines for management of septic systems. The guidelinesinclude a description of five model management pro-grams designed to improve the level of septic systemperformance. The goal of these model programs is tomanage septic systems on a watershed basis throughperformance standards and progressively more rigorousmanagement requirements. The draft guidelines andoutline of the guidance manual are available at http://www.epa.gov/owm/decent.
Watershed Research Needs
A recurring theme of this article is our uncertainunderstanding of real world performance of septic sys-tems. Consequently, there are four critical researchpriorities that would be of great value to watershedmanagers.
Table 10. Existing Septic System Management Programs
Entity Management Activity
Catskill WatershedCorporation, New York
Not-for-profit corporation that provides subsidies for septic systemupgrades or replacements. The CWC reimburses 60-100% of the eligiblecosts for residents in areas designated as highly sensitive to water qualityfor repair of failing systems.
Cuyahoga CountyBoard of Health, Ohio
Annual operational permits required. Operation and Maintenance Programprovides for countywide stream monitoring and sampling. Point-of-saleinspections and nuisance complaint investigations, operationalmaintenance inspections of household sewage systems. Offers lowinterest loans to homeowners to repair or replace failing systems. Registers septic system installers.
Hamilton County, OhioHealth Department
Inspect mechanical septic system on a yearly basis. Non-mechanicalsystems inspected at least once every 5 years. Final inspection performedafter system installation. Department reviews plans for all new subdivisionsless than five acres and individual plots for soil suitability for system use.
Kitsap County-Bremerton HealthDepartment,Washington
Certifies maintenance specialists. Keeps records of as-built drawings ofmost installed drainfield after 1970. Provides inspections and placesnotices on titles for properties with alternative systems.
Stinson Beach CountyWater District,California
Operational permits issued for 1-2 years following inspection by staff. Every system inspected at least once every three years and at change ofownership. District approval of system design required before issuing of abuilding permit for new construction. Monitoring of surface and groundwaterto detect possible occurences of failure.
Thurston CountyDepartment ofEnvironmental Health,Washington
Professional training and certification of designers, installers, pumpers, andmonitoring specialists. Review of permit applications for new systems,repaired systems, or expanded systems. Issuance and renewal ofOperational Certificates for 1-4 years. Evaluation of systems when propertyis sold and initial inspection when a permit is issued. Administration of alow-interest loan program to help those who need financial assistance torepair failing systems.

832 Urban Lake Management
First, most watershed managers lack basic researchand tracking of the performance of septic systems in theirwatershed. More systematic reporting of working andfailing septic systems is recommended in order to accu-rately assess the potential impacts of system dischargeson water quality. Better coordination among localpublic health authorities is also needed toget better estimates of regional fail-ure rates. In addition, coordi-nation is needed to agree oncommon definitions offailure, standard inspec-tion protocols, and iso-late critical site factorsthat lead to higher nitro-gen loading.
Second, research isrequired to determinewhether consistent relation-ships between the density of septic tanksand water quality exist in small watersheds,especially with regards to bacteria, nitrogen and phos-phorus. Research is also needed to determine whetherthese relationships can be detected during storm eventsor dry weather flow.
Third, we need to improve our ability to predict thedelivery of nutrients from the edge of the drainfield tosurface waters, and in particular, isolate the criticalfactors at a site that influence this subsurface delivery.Further research is needed to identify whether denitrifi-cation can be promoted or enhanced within stream orshoreline buffers.
Lastly, more data is needed on the performance ofaging septic systems in order to determine whether theseolder systems contribute higher nitrogen and phospho-rus loads. This research effort could involve systematicgroundwater sampling around both older and youngerdrain fields under controlled soil, terrain and geologicconditions. This monitoring would help watershedmanagers determine whether the estimated 12 millionseptic systems nationwide that are more than 30 years oldshould be targeted as a controllable source of nutrients.
Conclusion
Septic systems are a frequently cited but poorlyunderstood water quality problem. In 1996, septicsystems were identified as a leading source of pollutionfor ocean shorelines, and were reported to be the thirdmost common source of groundwater contamination (USEPA, 1996). Unfortunately, septic systems have seldombeen managed or regulated from a watershed perspec-tive. The need to revamp siting and maintenance re-quirements for septic systems has recently receivedmuch-needed attention by government agencies and
wastewater professionals. The push for new perfor-mance standards as part of a comprehensive watershedapproach is welcomed, but many questions still remainabout the true role of septic systems in watershedmanagement. More watershed research is needed to get
a clearer picture of the impact of theseenigmatic pollutant sources on the
health of out nation’s watersheds.
Editors Note: The Centerrecently completed a review ofseptic system related literature,and has made the bibliographyavailable at our StormwaterManager’s Resource Center(SMRC) website atwww.stormwatercenter.net. Thebibliography contains short
synopses of more than 80 refer-ences dealing with numerous is-
sues regarding septic system im-pacts, costs, performance and design,
and policy and management. The bibliography pro-vides an excellent starting point for watershed manag-ers interested in learning more about the role of septicsystems in watershed management.
Septic System Websites
National On-Site Wastewater Recycling Association(NOWRA): www.nowra.org
National Small Flows Clearinghouse (NSFC)www.estd.wvu.edu/nsfc
Septic System Owner’s Guide and Other Sewage Treat-ment Pubs www.extension.umn.edu
U.S. EPA Office of Wastewater Managementwww.epa.gov/owm/decent
References
Arnade, L.J. 1999. "Seasonal Correlation of WellContamination and Septic Tank Distance." GroundWater 36 (6): 920-923.
Bauman, B.J. and W.M. Schafer. 1985. “EstimatingGround-Water Quality Impacts from On-SiteSewage Treatment Systems.” On-Site Wastewa-ter Treatment: Proceedings of the FourthNational Symposium on Individual and SmallCommunity Sewage Systems. American Societyof Agricultural Engineers, St. Joseph, Michigan.
Burks, Bennette Day and Mary Margaret Minnis. 1994.Onsite Wastewater Treatment Systems. HogarthHouse, Ltd, Madison, WI.
Canter, Larry and Robert Knox. 1985. Septic TankSystem Effects on Ground Water Quality. LewisPublishers, Inc. ASTM.

833Urban Lake Management
Carodona, M.. 1998. Nutrient and Pathogen Contri-butions to Surface and Subsurface Waters FromOn-site Wastewater Systems - A Review. NorthCarolina State University Cooperative ExtensionService.
Cogger, Craig. 1988. "On-Site Septic Systems: TheRisk of Groundwater Contamination." Journal ofEnvironmental Health, Volume 51.
Fehr, Stephen and Peter Pae. 1997. “Aging SepticTanks Worry D.C. Suburbs.” Washington Post,May 18, 1997.
Gerba, C.P. 1985. “Microbial Contamination of theSubsurface.” In Groundwater Quality (C.H. Ward,W. Giger and P.L. McCarty editors). Wiley-Interscience, New York, NY.
Gilliom, R.J. and C. Patmont. 1983. "Lake PhosphorusLoading from Septic Systems by SeasonallyPerched Groundwater." Journal of the WaterPollution Control Federation 55 (10): 1297-1305.
Gold, Arthur, William DeRagon, W. Michael Sullivanand Jerrell Lemunyon. 1990. “Nitrate-NitrogenLosses to Groundwater from Rural and SuburbanLand Uses.” Journal of Soil and Water Conserva-tion Volume 45 Number 2.
Grant, William. 1988. Movement of Septic SystemEffluent From Lake Developments Into Near-ShoreAreas of 18 Indiana Lakes. LaGrange CountyHealth Department.
Gomez, A., M. Taylor and R. Nicola. 1992. "Devel-opment of Effective On-site Sewage DisposalSurveys in King County, Washington." Journalof Environmental Health 54 (5): 20-27.
Harman, J., W.D. Robertson, J.A. Cherry, and L.Zanini.1996. “Impacts on a Sand Aquifer from an OldSeptic System.” Ground Water 34 (6): 1105-1114.
Horsley and Witten. 1994. Coastal Protection Pro-gram Workshops in Innovative Management Tech-niques for Estuaries, Wetlands, and Near CoastalWaters. Sponsored by U.S. EPA, Office of Wet-lands, Oceans, and Watersheds.
Houston/Galveston Area Council. 2000. http://www.hgac.cog.tx.us/.
Kerfoot, W.B. and S.M. Skinner. 1981. "Septic LeachateSurveys for Lakeside Sewer Needs Evaluation."Journal of the Water Pollution Control Federa-tion 53: 1717-1725.
Maizel, M., G. Muehlbach, P. Baynham, J. Zoerkler, D.Monds, T. Iavari, P. Welle, J. Robbin, J. Wiles.1997. The Potential for Nutrient Loadings fromSeptic Systems to Ground and Surface WaterResources and the Chesapeake Bay. US EPAChesapeake Bay Program, Annapolis, MD.
Mandel, Ross and Douglas A. Haith. 1992. The Impactof Septic Systems on Surface Water Quality. Dept.of Civil and Environmental Engineering, Dept. ofAgriculture and Biological Engineering, CornellUniversity.
Maryland On-Site Sewage Disposal Task Force(MOSDTF). 1999. Reducing the EnvironmentalImpacts from On-site Sewage Disposal Systems.Maryland Department of Natural Resources, Tribu-tary Strategies Program.
Maryland Septic System Advisory Committee. 2000.Final Report. Available on the Maryland Depart-ment of the Environment Website at http://www.mde.state.md.us.
Minnesota Pollution Control Agency (MPCA). 1999.Effects of Septic Systems on Ground Water Quality- Baxter, Minnesota. MPCA, St. Paul, Minnesota.
Mooers, J.D. and D.H. Waller. 1997. On-Site WastewaterManagement in Nova Scotia. Phase III Final ReportOn-Site Wastewater Research Program. Centre forWater Resources Studies, Nova Scotia, Canada.
National Small Flows Clearinghouse (NSFC). 1996.Summary of Onsite Systems in the United States,1993. National Small Flows Clearinghouse,Morgantown, WV.
Pinnette, Steven R., William T. Noble, Daniel B. Locke,and Marc C. Loiselle. 1999. Residential SepticSystem Impacts on Groundwater Quality in Maine— Characterization of Nitrate Concentrations inDomestic Wells at 18 Subdivisions. Maine Depart-ment of Environmental Protection, Bureau of Landand Water Quality, Augusta, ME.
Postma, Frank, Arthur Gold, and George Loomis. 1992.“Nutrient and Microbial Movement from Season-ally-Used Septic Systems.” Journal of Environmen-tal Health, Vol. 55. Sept/Oct. 1992. pp 5-10.
Reed, Sherwood, Ronald Crites, and E. Joe Middlebrooks.1995. Natural Systems for Waste Management andTreatment. McGraw-Hill, Inc, New York, NY.
Robertson, W.D. and J. Harman. 1999. “PhosphatePlume Persistence at Two Decommissioned SepticSystem Sites.” Ground Water 37 (2): pages 228-236.
Robertson, W.D., J.A. Cherry, and E.A. Sudicky. 1991.“Groundwater Contamination From Two SmallSeptic Systems On Sand Aquifers.” Ground Water29 (2): pages 82-92.
Rouge River Wet Weather Demonstration Project. 1998.Strategies to Address On-Site Sewage System Prob-lems. Task No. RPO-NPS-TPM54.00.WayneCounty, Michigan.
Sagona, Frank. 1988. Color Infrared Surveys of SepticSystems in the Tennessee Valley Region. TennesseeValley Authority, Chattanooga, TN.
Small Scale Waste Management Project (SSWMP). 1978.Management of Small Waste Flows. University ofWisconsin-Madison. EPA 600/2-78-173.
Soap and Detergent Association. 2001. Special Report:Septic Tank Systems and Household Cleaning Prod-ucts. Soap and Detergent Association, Washington,DC. Website: http://www.cleaning101.com/envi-ronment/septic

834 Urban Lake Management
Stolt, Mark and Raymond Reneau. 1991. Potential forContamination of Ground and Surface Waters fromOnsite Surface Disposal Systems. Virginia Depart-ment of Health.
Shepard, Frank. 1996. Managing Wastewater: Pros-pects in Massachusetts for a Decentralized Ap-proach. Marine Studies Consortium, Waquoit BayNational Estuarine Research Reserve, and ad hocTask Force for Decentralized Wastewater Manage-ment.
Swann, C. 2000. Literature Synthesis of the Effects andCosts of Septic Systems Within the Chesapeake BayWatershed. Center for Watershed Protection,Ellicott City, MD.
Swann, C. 1999. A Survey of Residential NutrientBehavior in the Chesapeake Bay. Center for Water-shed Protection, Ellicott City, MD.
Tchobanoglous, G. and Burton, F.L. 1991. WastewaterEngineering: Treatment Disposal, Reuse. Metcalf& Eddy, 3rd edition. McGraw-Hill, Inc., New York,NY.
Tetra Tech, Inc. 1999. Personal communication andunpublished document. Tetra Tech, Fairfax, VA.
Tinker, J. Jr. 1991. "An Analysis of Nitrate-Nitrogen inGround Water Beneath Unsewered Subdivisions."Ground Water Monitoring Review 11 (winter): 141-150.
Tuthill, Anna, D.B. Meikle, and Michael C.R. Alavanja.1998. “Coliform Bacteria and Nitrate Contamina-tion of Wells in Major Soils of Frederick County,Maryland.” Journal of Environmental Health60(8):16-21.
Urish, D. and A. Gomez. 1998. Determination of theQuantity, Quality, and Location of Coastal Ground-water Discharge to a Marine Embayment: Green-wich Bay, Rhode Island. University of Rhode Is-land, Dept. of Civil and Environmental Engineer-ing.
U.S. Bureau of the Census. 1999. American HousingSurvey. (http://www.census.gov).
U.S. Environmental Protection Agency (US EPA). 2000.Draft Guidelines for Management of Onsite/De-centralized Wastewater Systems. U.S. EPA Officeof Wastewater Management, Washington, DC.
US EPA. 1997. Response to Congress on Use ofDecentralized Wastewater Treatment Systems.EPA-832-R-97-001B. U.S. EPA, Office of Water& Office of Wastewater Management, Washing-ton, DC.
US EPA. 1996. National Water Quality InventoryReport to Congress (305 (b) Report). U.S. EPA,Washington, D.C.
US EPA. 1993. Guidance Specifying ManagementMeasures for Sources of Nonpoint Pollution inCoastal Waters. EPA-840-B-92-002. U.S. EPA,Office of Water, Washington, DC.
US EPA. 1987. Septic Tank Siting to Minimize theContamination of Ground Water ByMicrorganisms. EPA 440/6-87-007. U.S. EPA,Office of Water, Washington, D.C.
US EPA. 1986. Septic Systems and Ground WaterProtection: An Executive’s Guide. EPA 055-000-00256-8. U.S. EPA, Office of Ground-Water Pro-tection, Washington, D.C.
US EPA. 1980. Design Manual: Onsite WastewaterTreatment and Disposal Systems (EPA 625/1-80-012). U.S. EPA Office of Research and Develop-ment, Municipal Environmental Research Labo-ratory, Cincinnati, OH.
Weiskel, P.K. and B.L. Howes. 1992. “DifferentialTransport of Sewage-Derived Nitrogen and Phos-phorus Through a Coastal Watershed.” Environ-mental Science and Technology 26:pp 352-360.
Wilhelm, S., S.L. Schiff, and W.D. Robertson. “Chemi-cal Fate And Transport In A Domestic SepticSystem: Unsaturated and Saturated ZoneGeochemistry.” Environmental Toxicology andChemistry 13 (2): 193-203.
Yates, Marylynn. 1985. “Septic Tank Density andGround-Water Contamination.” Ground Water23 (5): 586-591.


![POWTS Handbook - Marathon County, Wisconsin · 2020. 4. 29. · more septic tanks (for example, conventional systems and mound systems both have septic tank[s]). Maintenance of septic](https://img.dokumen.tips/doc/110x75/6129ab36b1091c6dca59dfb0/powts-handbook-marathon-county-wisconsin-2020-4-29-more-septic-tanks-for.jpg)