Embed Size (px)
Citation preview

JOURNAL OF SPATIAL INFORMATION SCIENCENumber 5 (2012), pp. 51–73 doi:10.5311/JOSIS.2012.5.107
RESEARCH ARTICLE
The influence of landscape variationon landform categorization
Maia Williams1, Werner Kuhn2, and Marco Painho1
1Institute for Statistics and Information Management, Universidade Nova de Lisboa, Portugal2Institute for Geoinformatics, University of Munster, Munster, Germany
Received: September 4, 2012; returned: October 25, 2012; revised: November 25, 2012; accepted: December 13, 2012.
Abstract: This paper compares the landform vocabularies of residents from two regions inPortugal. Participants described both their own and the other, less familiar landscapes inresponse to video footage of the regions. The results indicate that participants used moredetailed vocabularies to describe the known landscape compared to the less familiar studysite, with detail triggered by individual place recognition. A relationship between land-form lexica content and landscape type was observed in the relative placement of detailwithin each vocabulary. The observed drivers of categorization were the salient featuresof the landscape (elevation and land cover) and utilitarian motivations (land use, context,and familiarity). The results offer support to the notion of non-universality in geographicobject categorization.
Keywords: cognitive geography, ethnophysiography, geographic information systems,GIS, landform categorization, landform terms, landscapes
1 Introduction
The conceptualization of objects or phenomena in a geographic information system (GIS)is often poorly considered or understood. This paper presents exploratory research resultsthat contribute to the understanding of geographic object conceptualization through aninvestigation of landscape categorization variability.
Conceptualization is the process of abstracting the real world into the concepts we useto refer to what is there [16]. Defining the extent of concept non-universality and limitationsusing empirical studies is important for the development of geographic domain ontologies[20,32]. Examining variations in concept formation and use is one approach towards better
c© by the author(s) Licensed under Creative Commons Attribution 3.0 License CC©

52 WILLIAMS, KUHN, PAINHO
defining the conceptual space each concept occupies, and the locations and contexts withinwhich the concept is relevant.The categories (or objects) in question in this study are landforms, which are used to
describe the features of the earth’s surface—mountain, valley, and hill, for example. Land-form conceptualization is more subject to influence by language, culture, the environment,and individual perspectives than other domains, due to the continuity of the (Earth’s) sur-face fromwhich categories must be extracted [23]. Landform concept definition is thereforea challenging component of geographic domain formalization.Research on landform conceptualization and terminology has been conducted with a
range of approaches. Within geographic information science, Pires [28] compared Por-tuguese and American participants’ responses to “list a natural earth formation.” The ques-tion originally formed part of a Battig and Montague geographic category norms survey,given to university students. Pires finds that four of the top five responses are commonto both country groups, but concludes that the differences in the top ten responses are ofmost interest as they reflect the presence and prominence of different types of geographicentities in each country: canyon, cliff, and cave in America and water, sea, and plain inPortugal.The study presented here follows a similarly comparative approach although in con-
trast to Pires’ work, which was designed to observe the influences of cultural context, thefocus lies on the sensitivity of landform vocabularies to localized intra-country landscapevariation.A related body of research is that of ethnophysiography which is concerned with the
“categories that people use when conceptualizing and communicating about the land-scape” [22]. It is distinct from the related sciences of ethnobiology, ethnozoology, andethnoecology due to the complex influences driving landform conceptualization comparedto those involved in natural kind categorization. Mark and Turk describe the differencesbetween the European-Australian conceptualization of topographic features and that ofan Indigenous-Australian group, the Yindjibarndi. This is a cross-cultural comparison oflandform vocabularies and concepts within a single region.The current study applies many of the field methods described by Mark and Turk [22],
such as the use of images and participant interviews. The research does not, however, aimfor detailed and complete geographic vocabulary elicitation of two groups at one location;rather the work compares colloquial landform terminology between two culturally simi-lar groups residing in different locations. The elicitation methods are designed to capturethe landform terms participants use in day-to-day life, as this is where landscape-drivenvariability will arise.Geographic vocabularies have been explored in cross-cultural comparisons by linguists
Burenhult and Levinson [6, 21]. The linguistic approach focuses on determining the mech-anisms driving the formation of geographic concepts and their relative contributions. Bu-renhult and Levinson [6] identify three main drivers in the formation of landscape cate-gories: 1) “perceptual or cognitive salience”; 2) the “affordances ... or ... constraints [thecategories] impose on human activities”; and 3) the presence of “conceptual templates andcultural beliefs.”The current study contributes to the exploration of relative driver contributions using
observations of the categorization drivers referenced in participant responses. The adoptedapproach includes an assessment of landform terminology with respect to place familiarity,giving a new perspective to categorization driver research.
www.josis.org
THE INFLUENCE OF LANDSCAPE VARIATION ON LANDFORM CATEGORIZATION 53
In this paper the effects of landscape type variation and landscape familiarity on ruralresidents’ landform conceptualizations within a single country and language are exploredand some comment is made about the observed drivers of categorization. The study wasdesigned to consider the effects of landscape on the categorization process, separate fromcultural and linguistic influences, which have been the focus of previous research in thearea. Although language and cultural practices are not separate from landscapes and arenot constant across a country, for the purposes of this study the influence of these variationsand inter-relationships have been assumed to be minimal. An additional component of thestudy is a comparison of the participant landform categorizations to a simple automatedelevation-based landform classification.
The questions posed to drive the research are:
1. Do people identify categorizations with greater degrees of detail in landscapes theyare very familiar with, compared to lesser-known landscapes?
2. Is there any evidence suggesting that landscape categories are developed accordingto utilitarian factors more than salient features?
3. How do the categories people identify compare with a simple elevation-based auto-mated landform classification?
The work complements previous research by aforementioned authors and makes a contri-bution towards the interoperability of geographic information processing across cultural,linguistic, and domain boundaries [19]. The paper is organized into sections describing thestudy sites, the methods used, and results obtained, discussed with respect to each researchquestion.
2 Study sites
Two locations with contrasting landscape types were chosen as study sites. Figure 1 showstypical views of each study site. These regions were observed, photographed, and filmedduring five field trips. The first site is situated in the Lousa and Gois concelhos of the PinhalInterior Norte region of Portugal and encompasses the town of Lousa as well as severalvillages (Candal, Talasnal, Aigra Nova, and Aigra Velha) in the Serra da Lousa mountainrange (see Figure 2). The range rises steeply to the south-east of Lousa town and has anelevation range of 200 to 1204m. The schist and granite mountains are covered in natural(various oak species and chestnuts) and plantation (pine and eucalyptus) forests, and heathlands at the higher altitudes; great vegetation variability is due to the abrupt changes inelevation and climatic conditions throughout the region [7].
The second study site covers a portion of the Odemira concelhowhich lies in the AlentejoLitoral region in the south of Portugal (see Figure 2). Participants from this study area livein a number of different towns: Odemira, Sao Luıs, Boavista dos Pinheiros, Relıquias, CaboSadao, Zambujeira do Mar, Sao Teotonio, Azenha do Mar, and Moitinhas Saboia. The areaconsists largely of lowlands and small undulating hills with a number of higher elevationranges (up to 341m). The region is characterized by cork oak and holm oak trees (montadoregions) interspersed with cultivated and grazing land (polyculture). There are also areasof eucalyptus and pine plantations [2, 8].
JOSIS, Number 5 (2012), pp. 51–73

54 WILLIAMS, KUHN, PAINHO
Study site 1 Study site 2
Figure 1: Photographs of study site 1 (Serra da Lousa) and study site 2 (Odemira).
Figure 2: Study site location map.
www.josis.org

THE INFLUENCE OF LANDSCAPE VARIATION ON LANDFORM CATEGORIZATION 55
3 Research methods
The research methods applied in this study are taken from both social and computationalsciences. This cross-disciplinary approach gives rise to two different datasets, both ex-pressing landform category information: participant landform categorizations and digitalelevation model (DEM)-derived landform classifications. The conceptual framework, anddata collection and analysis methodologies are presented in Sections 3.1, 3.2, and 3.3.
3.1 Conceptual framework
A simple conceptual model was designed to approach the research aims of this study. Theprimary component of the model comprises the landform categorizations given by partici-pants from the two study sites. The secondary component consists of the automated land-form classification of each site, as derived from a DEM. The data extracted from participantresponses is compared between the two study sites, as well as against the DEM classi-fication. The first of the research questions is addressed with a quantitative exploratoryanalysis, while the remaining two are presented descriptively. Additional analysis of theparticipant responses and extracted data is discussed where relevant. Figure 3 shows thesteps of the methodology in detail.
Landform classification using DEM
Study site 1 Study site 2
Note the class at each view location
Extract landform terms
and counts
Video view location and angle map
Landform classification
map
Note the most common terms for
each class
Plot term use distributions
Interview recordings
Document observations
Calculate frequencies of
occurrence
Note the most common terms for each video view
Participant interviews
using videos
Landform classification using DEM
Participant interviews
using videos
Interview recordings
Document observations
Visual comparison
Quantitative comparisons
List of classes and corresponding
participant terms
Qualitative comparison
Note the class at each view location
Extract landform terms
and counts
Video view location and angle map
Note the most common terms for
each class
List of classes and corresponding
participant terms
Calculate frequencies of
occurrence
Plot term use distributions
Aggregate results
Aggregate results
Qualitative comparison
Landform classification
map
Note the most common terms for each video view
Figure 3: Research methodology.
JOSIS, Number 5 (2012), pp. 51–73
56 WILLIAMS, KUHN, PAINHO
3.2 Participant landform categorization
3.2.1 Video elicitation
The first component of the research involved interviewing participants from both studysites, using video-elicitation techniques. The purpose of these interviews was to gatherdata about the landform terms and place names residents use to describe both their locallandscape, and the less familiar landscape of the other study site.
Photo- or video-elicitation is the method of conducting interviews based on partici-pants’ descriptions of photographs (or video) or the use of images as prompts. Such in-terview methods have been used by ethnophysiographers and linguists in their work onunderstanding the language used to describe landscapes, and are well documented in [5]and [36]. The method was also used by Surova and Pinto-Correia [35] in their study oflandscape perceptions and preferences in Portugal. For the purposes of this study videowas considered a more useful medium; it allows for a sense of movement through the land-scape and a continuous view of a wider scene. This has the benefit of giving the viewer agreater sense of perspective, scale, and context.
A range of common landscape features in each study site were filmed. Locations withuninterrupted wide views across the landscape were chosen, and short (approximately 30second) pan shots were captured. Care was taken to maintain a similar distance from themajor landforms in order to retain a consistent scale of view. Five views from each site wereused to form a four-minute video and photograph montage of that region.
3.2.2 Interviews
Interview participants were selected according to purposeful criterion sampling; a qualita-tive researchmethod outlined in [27]. The requirement was that the person had lived in thestudy area for more than five years, with greater preference given to people who had livedtheir whole lives in the region. No limitations were placed on age, occupation, or sex.
A total of 10 and 11 participants were interviewed in the Lousa andOdemira study sites,respectively. The small sample size was considered sufficient, given the exploratory anddescriptive nature of the study. The usefulness of low count numerical data combined withqualitative observations, for exploratory work, is recognized in usability testing research[26].
The interviews consisted of two parts. Firstly, the purpose and format of the interviewwas outlined and interviewees watched an introduction video, which helped explain whatwas required of them. Secondly, two requests were made of the interviewees: they wereasked 1) to watch the two videos of the study sites and name the landforms they couldidentify; and 2) to give the place names of any locations they recognized. They were thenfree to describe the landforms of their choosing with little prompting or questioning. Theintention was to capture participants’ unbiased, natural ways of talking about landscapes.Participants were not informed of the study site locations prior to watching the videos.They were also asked to watch the video of the unfamiliar site before that of the study areathey live in.
The interviews were conducted in people’s homes, workplaces, and study places, and,where possible, alone. The interviews were conducted in Portuguese and recorded usingCamStudio software.
www.josis.org

THE INFLUENCE OF LANDSCAPE VARIATION ON LANDFORM CATEGORIZATION 57
3.2.3 Data extraction and aggregation
With the aid of translators the interview recordings were studied, and landform terms andplace names extracted. A systematic approach was used to record this information: each ofthe major landforms shown in the videos (named by at least one participant) was numberedand the term used by each participant was recorded against that number. This allowed forcounts of the number of terms used by each participant as well as the number of peoplewho used a certain term. The resultant dataset is nominal discrete primary data with asample size too low to permit the use of statistical significance tests.
A list of 58 distinct landform termswas compiled and later aggregated into 18meaning-ful categories (or groups of terms). Univariate descriptive analysis methods were used toexplore the data, including the computation of category distribution graphs using categoryfrequencies of occurrence [4] (see Section 4.1).
During the aggregation process some of the terms formed their own categories (becausethey were particularly distinct and common), while others were aggregated with similarterms under a category name (e.g., “slopes” or “hills”). The category names are in English,except the single term categories which have been left in Portuguese in accordance withthe aim of minimal translation. Rough translations of the remaining Portuguese terms arelisted in Table 3, if required.
Due to frequent references to water features and water bodies, despite there being novisible water in the videos shown to participants, these have been included as landforms.Descriptions of land use were included only when given as a part of the landform term, forthe purpose of differentiating between similar landforms.
3.2.4 Analysis
In response to the first research question (“Do people identify categorizations with greaterdegrees of detail in landscapes they are very familiar with, compared to lesser-known land-scapes?”) an assessment of the effects of landscape familiarity was made at two differentscales. The first level was at the scale of the study site, whereby the number of terms usedby participants in descriptions of their own study site (the landscape in which they live)is compared to the number of terms used in their description of the other study site. At asmaller scale, the number of places recognized (indicated by providing an accurate placename for a view in the video) was compared to the number of terms used in the landformdescription of that study site. These comparisons were made using term counts aggregatedaccording to participant groups: Odemira participants and Lousa participants. The resultsof this analysis are presented in Section 4.1.2
The second research question, regarding the relative contributions of categorizationdrivers, was analyzed using observations of participants and collated interview content.This qualitative analysis is largely based on the authors’ interview records and descriptivedetails noted during interview translation. The results of this analysis are presented inSection 4.2
Aside from responses to the research questions, the quantitative data analysis yieldedadditional avenues of exploration. The analysis of an apparent connection between land-scape type and landform vocabulary involved ordering the term category frequencies ofoccurrence from most to least frequently used by each participant group. The results ofthis analysis are presented in Section 4.1.1.
JOSIS, Number 5 (2012), pp. 51–73
58 WILLIAMS, KUHN, PAINHO
Examination of the relative frequencies of term use by all participants, ordered frommost to least used, yielded a dataset which could be compared to the results of the categorynorms research of Pires [28]. The results of the comparison are presented in Section 4.1.3.
3.3 Digital elevation model (DEM) landform classification
The second approach to the research involved a deterministic landform classification ofthe study areas using a digital elevation model (DEM). The classification provides land-form classes against which to compare participants’ landform categorizations, as posed inthe third research question: how do the categories people identify compare with a sim-ple elevation-based automated landform classification? Smith and Mark [33] suggest thatelevation-based automated landscape classifications may be useful in determining catego-rization drivers. However, the DEM classification versus participant categorization pre-sented in this paper does not make a contribution to that discussion. Rather it providessome assessment of the applicability of the selected method as a tool in categorizationdriver investigation.The implemented classification method is based on a macro landform classification sys-
tem developed by geographer Edward Hammond in the 1950s and 60s [11]. It has sincebeen modified into a deterministic analysis, which can be computed using elevation dataand performed in a GIS [10, 11]. More recently a step-by-step approach to the pixel-basedanalysis using ArcGIS tools was published [25]. This approach, with corrections publishedby Drescher and Frey [12], was followed here.Given the purpose of the automated classification, the chosen method was considered
sufficient and exploration of optimal techniques was considered beyond the scope of thestudy. The authors acknowledge that a pixel-based method is by no means ideal for deriv-ing an accurate landform classification. The application of object-based methods [30,34] ormulti-scaled morphometry approaches [9, 14] may be considered in future developmentsof this work.
3.3.1 Implementation
The landform classification was performed using 30 meter pixel ASTER (Advanced Space-borne Thermal Emission and Reflection Radiometer) DEM datasets. The classification in-volved the application of thresholds to slope, relief, and profile parameters to form gener-alized macro scale landform types, achieved using the ArcGIS model builder function andArcInfo toolbox. The result is a map with a subset of the 24 meaningful landform classesdescribed in [25].The analysis is split into three sub-sections, the results from which are then combined
to form: landform type = slope + relief + profile.
Slope The slope layer gives the percentage of near-level land for each pixel (which is thevalue calculated for a 20 pixel radius circular neighborhood and a near-level threshold of8% slope) split into four classes (Table 1).
Relief The relief layer gives the change in elevation for each pixel, based on the maximumand minimum elevation within a 20 pixel radius circular neighborhood. Morgan and Lesh
www.josis.org

THE INFLUENCE OF LANDSCAPE VARIATION ON LANDFORM CATEGORIZATION 59
[25] defined the relief classes with intervals rounded to the nearest 10 meters. However,Hammond’s original relief classes [15] were used in this analysis (Table 1).
Profile The profile layer gives the percentage of near-level ground in upland and lowlandareas of the landscape, again with a 20 pixel radius circular neighborhood. The boundarybetween upland and lowland is defined as the midpoint between the maximum and min-imum elevation for the target pixel’s neighborhood. The four profile classes are shown inTable 1.
Sub-section Morgan and Lesh sub-class [25]
Slope (%)> 0.8 4000.5–0.8 3000.2–0.5 200< 0.2 100
Relief (m)< 30 1030–91 2091–152 30152–305 40305–914 50> 914 60
Profile (%)> 75 150–75 225–50 3< 25 4
Table 1: Class thresholds for landform classification sub-classes. There is an error in thenumbering of these classes in Morgan and Lesh’s [25] publication (p. 3), noted by Drescherand de Frey [12]. The corrected class numbering is shown here.
The final landform map is produced by adding together the three sub-section layers.The result is a map with 96 possible sub-classes. These classes were aggregated into the 24meaningful super-classes developed by Dikau et al. [11] (Table 2). The 24 classes were usedto produce the landform classification maps presented in Section 4.3 and are referred to asthe “Morgan and Lesh landform classes.”
It should be noted that the detail of the classification depends on the resolution of theDEM used [12, 15]. The 30m ASTER DEM used in this study was selected according to theMorgan and Lesh methodology (which was developed for that resolution) [25] and othersuccessful implementations [12]. The effect of DEM resolution on the correspondence ofhuman-identified and computed landforms presents an interesting research question forfuture work. Similarly, further “tuning” of the algorithm thresholds to better representspecific landscapes could change the classification output [15] and comparison with partic-ipant categorizations.
JOSIS, Number 5 (2012), pp. 51–73

60 WILLIAMS, KUHN, PAINHO
Morgan and Lesh sub-classes Morgan andLesh class
Description
Plains411–414 11 Flat or nearly flat plains421–424 12 Smooth plains with some local relief311–314 13 Irregular plains with some local relief321–324 14 Irregular plains with moderate relief
Plains with hills or mountains431, 432, 331, 332 31 Plains with hills441, 442, 341, 342 32 Plains with high hills451, 452, 351, 352 33 Plains with low mountains461, 462, 361, 362 34 Plains with high mountains
Tablelands433, 434, 333, 334 21 Tablelands with moderate relief443, 444, 343, 344 22 Tablelands with considerable relief453, 454, 353, 354 23 Tablelands with high relief463, 464, 363, 364 24 Tablelands with very high relief
Open hills and mountains211–214 41 Open very low hills221–224 42 Open low hills231–234 43 Open moderate hills241–244 44 Open high hills251–254 45 Open low mountains261–264 46 Open high mountains
Hills and mountains111–114 51 Very low hills121–124 52 Low hills131–134 53 Moderate hills141–144 54 High hills151–154 55 Low mountains161–164 56 High mountains
Table 2: Aggregation of sub-classes into Morgan and Lesh landform classes, and class de-scriptions.
3.3.2 Data extraction and analysis
The results of the automated landform classification were compared with participant land-form terms to assess how effectively the DEM-derived dataset represents the landscape.The comparison was made over a relatively large extent (given that the classes cover areasdescribed as “plains with hills,” for example), with no aim to compare at the individuallandform scale. The data was extracted by plotting the video scene locations and directionof view onto a map together with the landform classification. For each of the video viewsthe landform classes and the most commonly used participant termswere noted. The result
www.josis.org

THE INFLUENCE OF LANDSCAPE VARIATION ON LANDFORM CATEGORIZATION 61
is a list of the participant terms used to describe the corresponding DEM-derived landformclasses, aggregated across multiple views and participant responses. The results are pre-sented in Section 4.3.
4 Results and discussion
4.1 Participant categorization
Results of the quantitative data analyses are presented in this section. First, the content ofeach participant group’s vocabulary is explored, then the effects of landscape familiarityare presented in response to the first research question, and, finally, a comparison of theresults with category norms research is shown.
4.1.1 Vocabulary reflecting landscape
The quantitative results extracted from participant interviews suggest differences in land-form vocabulary size and content between the two study site participant groups. The totalnumber of distinct landform terms used by the Serra da Lousa participants was 44, whilethe Odemira participants used only 34 terms (see Table 4). The content of these vocabulariesis noticeably different, as the two groups place their more detailed landform identificationin different parts of the landscape.
The landform vocabulary content appeared to become more detailed surrounding theprominent features of the landscape in which the participants live. This is as expected,because it is useful for inhabitants of a region to become familiar with landform categorieswith which they can best describe and communicate aspects of their environment. Markand Turk [22] state that “basic level categories in a languagemust be tuned to the variationsin the particular environment in which a speech community lives”; a statement well sup-ported, with respect to landform categories, by this study. This effect is best discussed withan examination of Figure 4, which shows the distribution of aggregated landform-termcategory use by the two participant groups in their descriptions of the two locations. Thegraph shows percentage frequencies of occurrence of aggregated landform term counts.Translations of Portuguese terms are given in Table 3.
Portuguese term English termArriba CliffCordilheira Mountain rangeLombo BackMontanha MountainMonte HillPerfil da montanha Mountain profilePlanıcie PlainRio RiverRibeiro StreamSerra Mountain or mountain rangeVale Valley
Table 3: Portuguese term translations.
JOSIS, Number 5 (2012), pp. 51–73

62 WILLIAMS, KUHN, PAINHO
100 100 100
43
78
25
50
30 3017
29
10
2416
22
13
850
22 27 29
1429
1933
22
10
43
50
17
20
50
19
3017
33
1822
3322 20
14 1325
50
30 27 25
43
29
4333
56
70
0
10
20
30
40
50
60
70
80
90
100
Perc
enta
ge fr
eqen
cy o
f occ
urre
nce
Aggregated landform-term categories
Odemira participants - Odemira video Odemira participants - Lousã video
Lousã participants - Odemira video Lousã participants - Lousã video
Figure 4: Landform-term category distribution between participant-video groups as per-centage frequency of occurrence. The lower (non-bordered) bars represent the percentagefrequency occurrence of the Lousa participants’ responses to videos of each study site. Theupper (bordered) bars represent the percentage frequency occurrence of the Odemira par-ticipants’ responses to videos of each study site.
At the center of Figure 4 are the terms common to both groups: serra, monte, montanha,planicie, and vale. These terms have an approximately 50% occurrence in each participantgroup. The categories to the left and right of the center are used predominantly by theLousa and Odemira participants, respectively. The most important points of this distribu-tion are as follows:
www.josis.org

THE INFLUENCE OF LANDSCAPE VARIATION ON LANDFORM CATEGORIZATION 63
• the Odemira participantsmore frequently use variations on the three base terms serra,monte, and montanha;
• in comparison, the Lousa participants are more likely to use various terms for hills,ridges/peaks, and slopes rather than variations on the three common terms (serra,monte, and montanha) to describe topographic eminences;
• the Odemira participants have a greater range of terms for lowlands (other than thecommon terms planicie and vale) than the Lousa participants;
• there are three terms used solely by the Lousa participants (arriba, lombo, and perfil damontanha); and
• the Lousa participants make more references to water-related features.
These findings directly reflect the landscapes the vocabularies are applied to. The Serrada Lousa landscape consists of many different shapes, elevations, contours, and profilesand hence inhabitants require many more terms to describe the features; serra, monte, andmontanha are not sufficient. There is also the need for an enriched mountain landform vo-cabulary, hence the use of terms such as peak, ridge, and lombo (back). In this landscapelines of water flow are noticeable and provide clear boundaries of, or identifiers for, land-forms. The Odemira landscape is less variable, consisting predominantly of plains withoccasional convex eminences, which are usually of similar shape (even if not elevation).Thus the inhabitants of Odemira have a smaller landform vocabulary that makes use ofdescriptors such as “big,” “small,” or “smooth” to modify the common serra, monte, andmontanha terms when needed.
The results also suggest that the wide range of landform terms in the Lousa participants’vocabulary makes it more versatile for use in describing other landscapes. Table 4 showsthat both participant groups usedmore landform terms to describe the video of their region(68% versus 61% and 76 % versus 53%, for Lousa and Odemira participants, respectively).However, the margin of this difference is markedly greater for the Odemira participants.This suggests that they were not able to apply their vocabulary, or that it was not sufficientfor the description of the Serra da Lousa region. Conversely, the varied Lousa vocabularyappeared to be almost equally applicable to both landscape types.
Lousa participants Odemira participantsTerm count Term proportion (%) Term count Term proportion (%)
Lousa video 30 68 18 53Odemira video 27 61 26 76Total number of terms 44 34
Table 4: Total term counts and frequencies of occurrence per participant group.
4.1.2 Effects of familiarity and place recognition
The effects of familiarity and place recognition were assessed at two levels. The first im-pact of familiarity was at a large landscape-type scale and takes the form of vocabularyapplicability as discussed in the previous section. Participants showed that they were ableto use more landform terms to describe the landscape most familiar to them. Lousa par-ticipants used 30 terms in descriptions of Lousa and 27 for descriptions of the unfamiliar
JOSIS, Number 5 (2012), pp. 51–73

64 WILLIAMS, KUHN, PAINHO
Odemira landscape. Odemira participants used 26 terms to describe Odemira and only 18for describing the Lousa landscape (Table 4).The next level of familiarity was that of specific place recognition. Participants were
asked if they recognized the locations of the five scenes in the video of their region. Acomparison of the number of scenes people recognized and the number of landform termsthey used to describe the video yielded positive correlation coefficients of 0.74 and 0.55for Odemira and Lousa participants, respectively. This suggests that place recognition—indicated by knowing a place name for the video scene location—promoted amore detailedlandform categorization.This could be due to an effect noted by Agarwal [1] in her research on the sense of place.
She noted a correlation between people experiencing a sense of place and their spatial rea-soning skills. She further stated that “a ‘cognitive sense of place’ can be operationalized asa factor of spatial knowledge, degree of familiarity and conceptualization of boundaries.”Just as the conceptualization of boundaries is an integral aspect of categorization, a senseof place could similarly be a factor for landform categorization.Observation of the way participants gave their landscape descriptions yields greater
insight into the effects of place recognition. When participants recognized a place in thevideo, their descriptions began to follow their own understanding of landform connectiv-ity, regardless of the video pan movement. They appeared to be referring to their previ-ously composed mental map of the area rather than the video images in front of them. AsEgenhofer and Mark [13] describe, “[w]e explore geographic space by navigating in it, andwe conceptualize it from multiple views, which are put together (mentally) like a jigsawpuzzle.” It is not surprising then, that a previously made puzzle is more complete andallows for a more detailed landform description than five separate views can elicit.The effect of place recognition appeared to be equivalent to “zooming in” to the image;
participants observed from different perspectives and scales, and consequently identifiedmore boundaries. This observation supports Bian’s [3] inclusion of spatial scale and bound-ary as factors in landscape region delineation.Another contribution to the effect could be that participants were simply more enthu-
siastic when they recognized a familiar place. Surova and Pinto-Correia [35] noted in theirwork that using photographs of landscape scenes, which participants could easily recog-nize or relate to, stimulated their interest and curiosity. Certainly participants unanimouslywanted to recognize the video views (often making incorrect location guesses) before pro-gressing with their descriptions, and enjoyed recognizing scenes close to their homes.In Montello and Golledge [24] Tim McNamara asks “Are spatial judgments easier ...
from familiar views than from unfamiliar views?” and suggests that if they are it indicatesthat the perception and understanding of a view is orientation-dependent. The results ofthis study suggest this to be so, that people prefer to orientate themselves in the landscapeand describe it with an egocentric relative reference frame.The aforementioned areas of research originate frommany different domains, and high-
light the importance of familiarity (and place) in the study of spatial cognition. This papermakes a contribution that wider body of knowledge, from the perspective of landformconceptualization.
www.josis.org

THE INFLUENCE OF LANDSCAPE VARIATION ON LANDFORM CATEGORIZATION 65
4.1.3 Comparison with geographic category norms research
An additional result of this study is evidence in support of geographic category normsresearch conducted in Portugal [28, 29]. Pires’ results included a list of the top ten mostcommonly given examples of a natural earth formation. Four of those examples were alsowithin the ten most common landform term categories (see Table 5) identified in this cur-rent study: vale, montanha, planicie, and rio. This suggests that the research methods of thisstudy are successfully capturing the findings of similar studies despite the much smallersample size.
Three of the mentioned terms (vale, montanha, planicie) form single term categories inthe category list of Table 5. Rio is a part of the aggregated rio and ribeiro category. However,the term rio dominates the counts in this category 6:1 and hence retains its position in thetop ten.
Lousa video Odemira videoLandform-termcategory
Lousaparticipant(% freq.)
Odemiraparticipant(% freq.)
Lousaparticipant(% freq.)
Odemiraparticipant(% freq.)
Total
(% freq.)Vale 13 21 11 13 59Low lands 9 13 13 19 55Monte 7 15 15 10 47Serra 12 12 8 10 41Montanha 10 13 7 7 38Planicie 3 6 11 11 31Hills 9 0 10 2 21Slopes 9 2 3 4 18Ridge/peak 10 4 0 0 14Rio and ribeiro 4 0 3 6 14Serra variations 0 2 3 8 14Monte variations 0 4 3 6 13Water-related 3 2 7 1 13Montanha variations 0 4 3 2 10Lombo 6 0 0 0 6Cordilheira 0 2 2 0 4Arriba 1 0 0 0 1Perfil da montanha 1 0 0 0 1
100 100 100 100 400
Table 5: Aggregated landform-term category distribution within each participant groupordered from most to least common.
Another similarity between the two studies is the finding of the importance of waterbodies and water-related features of the landscape. The participants of this study fre-quently referred to water lines, rivers, streams, and flood lands despite there being novisible water in the videos. Pires [28] also noted the frequent reference to water bodies byPortuguese participants, as compared to their American counterparts. Smith andMark [31]explain the universal fact that water “is an especially distinctive substance that is critical tolife” and Pires suggests that this is particularly well recognized by Portuguese people.
JOSIS, Number 5 (2012), pp. 51–73

66 WILLIAMS, KUHN, PAINHO
4.2 Categorization drivers
4.2.1 Multiple drivers
Observations of participant landform descriptions suggest there are multiple drivers forcategorization. These influences fall broadly into two types: salient perceptual features ofthe landscape, and landscape affordance or utilitarian motivations. These constitute twoof the three drivers described by Burenhult and Levinson [6] and Levinson [20], the thirdbeing cultural and linguistic systems of a community which impact landscape categoriza-tion. More specifically, the salient features referred to by participants were the shape andprofile of the landforms; and the presence of water, vegetation, and other land cover types.The other influences are land use, context (such as the presence of clouds aroundmountainpeaks), and place familiarity with corresponding use of mental maps. This second groupof drivers is related to utilitarian motivations as they involve the participant’s prior experi-ence of the landscape or knowledge of how it may be used. No participant referred to onlya single driver as they described the landforms and certainly no one type of driver (e.g.,salient features versus utilitarian motivations) appearedmore predominant than the other.
4.2.2 Water, land cover, and land use
Of the drivers mentioned above, participants most consistently referred to water, landcover, and land use. None of the participants could describe the landformswithout first de-scribing the vegetation of the area and any understanding they had of the land use. Further,the understanding of the land use and land cover was evident in the landform terms used.For example, low-lying areas were often given terms such as “cultivated plain” (varzea) or“floodplain” (lezıria) as opposed to just “plain.” Water was used in two ways: to identifywhat could happen at a location or what the land cover is (for example, “flood plain” or“flat land subject to flooding”); and as an understanding of water as a force shaping anddividing the landscape (for example, “water lines,” “river,” and “basin”).
The inability to separate land cover/land use and landforms suggests that the mostnatural way of observing and categorizing a landscape is not according to landform, butinto parts more akin to the “ecotopes” described by Hunn and Meilleur [17]. These are“patches” of land defined by flexible similarity drawn from abiotic and biotic parameters.Participants more readily identified parts of the landscape by using combinations of geo-morphological, biological, and affordance factors.
4.2.3 Familiarity and mental maps
The relationship between localized place recognition and the detail of the landformdescrip-tion given by participants was noted in Section 4.1.2. This relationship—both in the quan-titative form of the correlation coefficient and the observations of participant responses—suggests that familiarity is a driver for categorization. More specifically it is the mentalmaps people form for familiar places that drive the identification of landform categoriesthrough associated knowledge of what happens at a place or of landform connectivity(topology).
When participants referred to their mental maps they zoomed in to the landscape, ob-served it from their preferred angles and perspectives, andwere able to evoke the feeling ofbeing in that place. This drove them to identify landforms that were neither clearly visible
www.josis.org
THE INFLUENCE OF LANDSCAPE VARIATION ON LANDFORM CATEGORIZATION 67
(rivers or valleys in the background) nor particularly eminent in the video image. Recog-nition allowed participants to satisfy their desire to be in the scene, a desire Kaplan [18]describes as the “‘involvement’ component” of perception. They also appeared to changetheir conception of the landforms from topologically separated to contiguous [31], drivingthe identification of more in-between landforms (such as slopes), rather than only moun-tains and valleys.
The observed effect of familiarity driving landform category conceptualization arisesfrom the study site comparison approach adopted in this study. It suggests that this ap-proach could be useful in further expansion of Levinson’s [20] work surrounding catego-rization drivers.
4.3 Comparison of DEM classification and participants’ categorization
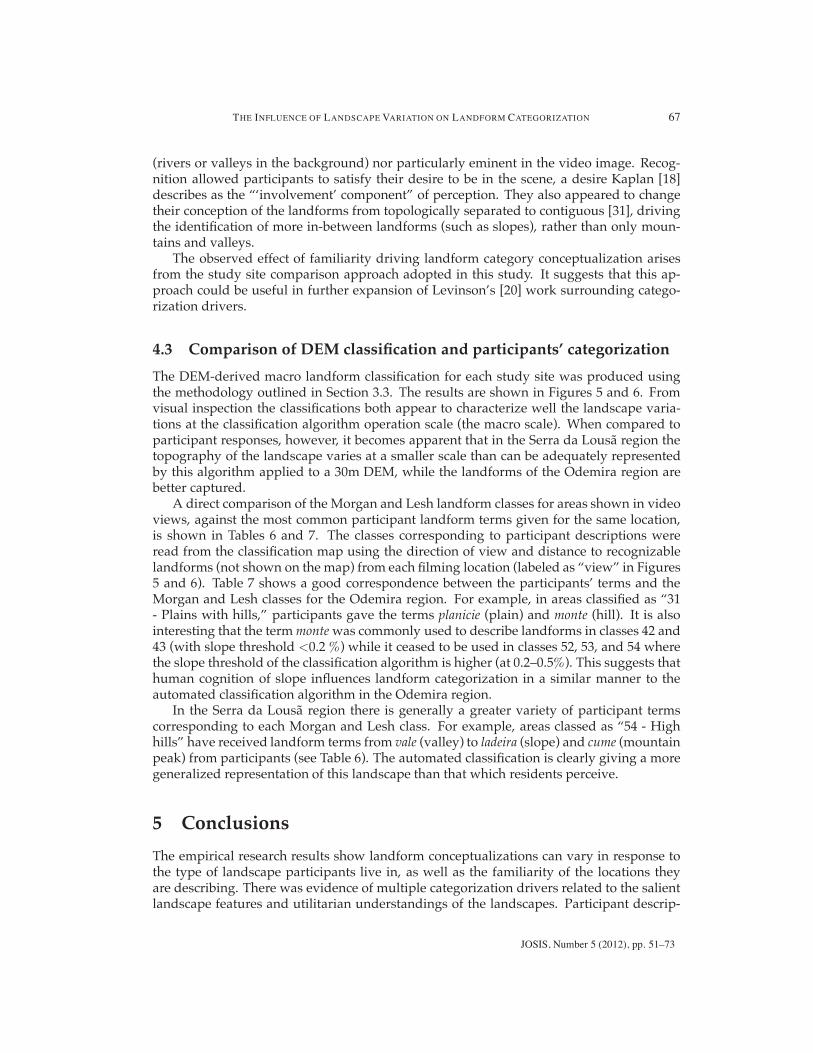
The DEM-derived macro landform classification for each study site was produced usingthe methodology outlined in Section 3.3. The results are shown in Figures 5 and 6. Fromvisual inspection the classifications both appear to characterize well the landscape varia-tions at the classification algorithm operation scale (the macro scale). When compared toparticipant responses, however, it becomes apparent that in the Serra da Lousa region thetopography of the landscape varies at a smaller scale than can be adequately representedby this algorithm applied to a 30m DEM, while the landforms of the Odemira region arebetter captured.
A direct comparison of the Morgan and Lesh landform classes for areas shown in videoviews, against the most common participant landform terms given for the same location,is shown in Tables 6 and 7. The classes corresponding to participant descriptions wereread from the classification map using the direction of view and distance to recognizablelandforms (not shown on the map) from each filming location (labeled as “view” in Figures5 and 6). Table 7 shows a good correspondence between the participants’ terms and theMorgan and Lesh classes for the Odemira region. For example, in areas classified as “31- Plains with hills,” participants gave the terms planicie (plain) and monte (hill). It is alsointeresting that the termmontewas commonly used to describe landforms in classes 42 and43 (with slope threshold <0.2 %) while it ceased to be used in classes 52, 53, and 54 wherethe slope threshold of the classification algorithm is higher (at 0.2–0.5%). This suggests thathuman cognition of slope influences landform categorization in a similar manner to theautomated classification algorithm in the Odemira region.
In the Serra da Lousa region there is generally a greater variety of participant termscorresponding to each Morgan and Lesh class. For example, areas classed as “54 - Highhills” have received landform terms from vale (valley) to ladeira (slope) and cume (mountainpeak) from participants (see Table 6). The automated classification is clearly giving a moregeneralized representation of this landscape than that which residents perceive.
5 Conclusions
The empirical research results show landform conceptualizations can vary in response tothe type of landscape participants live in, as well as the familiarity of the locations theyare describing. There was evidence of multiple categorization drivers related to the salientlandscape features and utilitarian understandings of the landscapes. Participant descrip-
JOSIS, Number 5 (2012), pp. 51–73

68 WILLIAMS, KUHN, PAINHO
Figure 5: Lousa landform classification.
www.josis.org
THE INFLUENCE OF LANDSCAPE VARIATION ON LANDFORM CATEGORIZATION 69
Figure 6: Odemira landform classification.
JOSIS, Number 5 (2012), pp. 51–73

70 WILLIAMS, KUHN, PAINHO
Morgan and Lesh class Participant terms (most to least common)14 - Irregular plains with moderate relief Vale (valley), Montanha (mountain), Monte (hill)43 - Open moderate hills Vale, Montanha, Monte53 - Moderate hills Vale, Montanha, Monte54 - High hills Montanha, Serra (mountain or mountain range),
Vale, Ladeira(slope), Cume (peak), Encostasabruptas (steep slope)
55 - Low mountains Montanha, Serra, Cume/cumeada (ridge),Montes
Table 6: Morgan and Lesh landform classes with corresponding participant terms, Lousavideo.
Morgan and Lesh class Participant terms (most to least common)12 - Smooth plains with some local relief Planicie (plain), Planalto (plateau)14 - Irregular plains with moderate relief Varzea (cultivated plain), Planicie, Planalto,
Monte (hill), Serra, Rio (river)31 - Plains with hills Planicie, Monte42 - Open low hills Serra, Montanha, Monte, Vale43 - Open moderate hills Monte, Serra, Montanha52 - Low hills Serra, Montanha53 - Moderate hills Serra, Montanha54 - High hills Montanha, Serra
Table 7: Morgan and Lesh landform classes with corresponding participant terms, Odemiravideo.
tions correspondedwell to a DEM-derivedmacro scale landform classification at the gentlyundulating study site and were comparatively more detailed at the mountainous site. It isacknowledged that this result will vary with DEM resolution and algorithm parametersused.The study supports ongoing research towards understanding the variability of geo-
graphic category conceptualization. This body of research is required for the successfuldevelopment of GIS applications suited to cross-location, -discipline, and -cultural geo-graphic knowledge representation and analysis.If replicated, this study could be refined by considering participant age, occupation,
lifestyle, and sex demographics in the data analysis. It could also be useful to use studysites of equal area. Reproductions of the study in different landscapes and languageswouldbe interesting.
Acknowledgments
The authors are grateful to the participants from the Lousa, Gois, and Odemira concelhos,and to the employees of Dueceira in Lousa, Lojas Aldeias do Xisto in Candal and AigraNova and Taipa in Odemira for their assistance. In addition the authors would like to thankthe translators, the field work assistant, and David Mark for his contribution to the project.
www.josis.org

THE INFLUENCE OF LANDSCAPE VARIATION ON LANDFORM CATEGORIZATION 71
This research was conducted with the support of the European Commission’s ErasmusMundus program.
References
[1] AGARWAL, P. Operationalising “sense of place” as a cognitive operator for semanticsin place-based ontologies. In Proc. International Conference on Spatial Information The-ory (COSIT) (Berlin, 2005), Lecture Notes in Computer Science, Springer, pp. 96–114.doi:10.1007/11556114 7.
[2] AGENCIA PORTUGESA DO AMBIENTE. Atlas do Ambiente. http:�www.iambiente.pt/atlas/est/index.jsp. Accessed 15 January 2011.
[3] BIAN, L. Object-oriented representation of environmental phenomena: Is everythingbest represented as an object? Annals of the Association of American Geographers 97, 2(2007), 267–281. doi:10.1111/j.1467-8306.2007.00535.x.
[4] BLAIKIE, N. Analyzing Quantitative Data. Sage, London, 2003.
[5] BOHNEMEYER, J., BURENHULT, N., ENFIELD, N. J., AND LEVINSON, S. C. Landscapeterms and place names elicitation guide. Field Manual 9 (2004), 75–79.
[6] BURENHULT, N., AND LEVINSON, S. Language and landscape: A cross-linguistic per-spective. Language Sciences 30, 2–3 (2008), 135–150. doi:10.1016/j.langsci.2006.12.028.
[7] CAMARA MUNICIPAL DA LOUSA. Caracterizacao do Concelho da Lousa. http:�www.cm-lousa.pt/concelho/index.htm. Accessed 3 January 2011.
[8] CAMARA MUNICIPAL DE ODEMIRA. Perfil do Concelho. http:�www.cm-odemira.pt/PT/Neg%C3%B3cios/Perfil/Paginas/default.aspx. Accessed 05 January 2011.
[9] CHAUDHRY, O., AND MACKANESS, W. Creating mountains out of mole hills: Auto-matic identification of hills and ranges using morphometric analysis. Transactions inGIS 12, 5 (2008), 567–589. doi:10.1111/j.1467-9671.2008.01116.x.
[10] DIKAU, R. The application of a digital relief model to landform analysis in geomor-phology. In Three dimensional applications in Geographical Information Systems, J. Raper,Ed. Taylor and Francis, London, 1989, pp. 51–77.
[11] DIKAU, R. E., BRABB, E., AND MARK, R. Landform classification of New Mexico bycomputer. U.S. Geological Survey, Menlo Park, CA, 1991.
[12] DRESCHER, K., AND FREY, W. D. Landform classification using GIS. Position IT(Aug/Sept 2009).
[13] EGENHOFER, M. J., AND MARK, D. M. Naive geography. In Spatial Information Theory:A Theoretical Basis for GIS, A. U. Frank and W. Kuhn, Eds., vol. 988. Springer, Berlin,1995, pp. 1–15. doi:10.1007/3-540-60392-1 1.
[14] FISHER, P., WOOD, J., AND CHENG, T. Where is Helvellyn? Fuzziness of multi-scalelandscape morphometry. Transactions of the Institute of British Geographers 29, 1 (2004),106–128. doi:10.1111/j.0020-2754.2004.00117.x.
JOSIS, Number 5 (2012), pp. 51–73
72 WILLIAMS, KUHN, PAINHO
[15] GALLANT, A., BROWN, D., AND HOFFER, R. Automated mapping of Ham-mond’s landforms. IEEE Geoscience and Remote Sensing Letters 2, 4 (2005), 384–388.doi:10.1109/LGRS.2005.848529.
[16] GRUBER, T. A translation approach to portable ontology specifications. KnowledgeAcquisition 5, 2 (1993), 199–220. doi:10.1006/knac.1993.1008.
[17] HUNN, E., AND MEILLEUR, B. Toward a theory of landscape ethnoecological classi-fication. In Landscape Ethnoecology: Concepts of Biotic and Physical Space, L. M. Johnsonand E. Hunn, Eds. Berghahn Books, New York, NY, 2010.
[18] KAPLAN, S. Perception and landscape: Conceptions and misconceptions. In Proc.Our national landscape: A conference on applied techniques for analysis and management ofthe visual resource (Nevada, 1979), US Department of Agriculture, pp. 241–248.
[19] KUHN, W. Ontology of landscape in language. In Landscape in Language: Transdis-ciplinary Perspectives, D. M. Mark, A. G. Turk, N. Burenhult, and D. Stea, Eds. JohnBenjamins, Amsterdam, 2012.
[20] LEVINSON, S. Landscape, seascape, and the ontology of places on RosselIsland, Papua New Guinea. Language Sciences 30, 2–3 (2008), 256–290.doi:10.1016/j.langsci.2006.12.032.
[21] LEVINSON, S. C. Language and space. Annual Review of Anthropology 25, 1 (1996),353–382. doi:10.1146/annurev.anthro.25.1.353.
[22] MARK, D. M., AND TURK, A. G. Landscape categories in Yindjibarndi. In Spatial In-formation Theory, Foundations of Geographic Information Science, W. Kuhn, M. F. Worboys,and S. Timpf, Eds., vol. 2825 of Lecture Notes in Computer Science. Springer, Berlin, 2003,pp. 28–45. doi:10.1007/978-3-540-39923-0 3.
[23] MARK, D. M., TURK, A. G., AND STEA, D. Ethnophysiography of arid lands: Cate-gories for landscape features. In Landscape Ethnoecology: Concepts of Physical and BioticSpace, L. M. Johnson and E. Hunn, Eds. Berghahn Books, New York, NY, 2010.
[24] MONTELLO, D. R., AND GOLLEDGE, R. Scale and detail in the cognition of geographicinformation. Report of a Specialist Meeting held under the auspices of the VareniusProject, University of California, Santa Barbara, 1999.
[25] MORGAN, J. M., AND LESH, A. Developing landform maps using ESRI’S Model-Builder. Presented at ESRI International User Conference, 2005.
[26] NIELSEN, J. Why you only need to test with 5 users. Alertbox, March 19, 2000,http:�www.useit.com/alertbox/20000319.html. Accessed 30 November 2011.
[27] PATTON, M. Q. Qualitative Evaluation And Research Methods. Sage Publications, 1990.
[28] PIRES, P. Geospatial conceptualization: A cross-cultural analysis on Portuguese andAmerican geographical categorizations. Journal on Data Semantics III, 3534 (2005), 196–212.
www.josis.org
THE INFLUENCE OF LANDSCAPE VARIATION ON LANDFORM CATEGORIZATION 73
[29] PIRES, P., PAINHO, M., AND KUHN, W. Measuring semantic differences betweenconceptualisations: The Portuguese water bodies case—does education matter? InOnthe Move to Meaningful Internet Systems (OTM), R. Meersman, Z. Tari, and P. Herrero,Eds., vol. 3762 of Lecture Notes in Computer Science. Springer, Berlin, 2005, pp. 1020–1026. doi:10.1007/11575863 124.
[30] SINHA, G., AND MARK, D. M. Cognition-based extraction and modelling of topo-graphic eminences. Cartographica 45, 2 (2010), 105–112. doi:10.3138/carto.45.2.105.
[31] SMITH, B., AND MARK, D. Ontology with human subjects testing. American Journal ofEconomics and Sociology 58, 2 (1998), 245–312. doi:10.1111/j.1536-7150.1998.tb03471.x.
[32] SMITH, B., AND MARK, D. M. Geographical categories: An ontological investi-gation. International Journal of Geographical Information Science 15, 7 (2001), 591–612.doi:10.1080/13658810110061199.
[33] SMITH, B., AND MARK, D. M. Do mountains exist? Towards an ontology oflandforms. Environment and Planning B: Planning and Design 30, 3 (2003), 411–427.doi:10.1068/b12821.
[34] STRAUMANN, R. K., AND PURVES, R. S. Delineation of valleys and valleyfloors. In Geographic Information Science, T. J. Cova, H. J. Miller, K. Beard, A. U.Frank, and M. F. Goodchild, Eds., vol. 5266. Springer, Berlin, 2008, pp. 320–336.doi:10.1007/978-3-540-87473-7 21.
[35] SUROVA, D., AND PINTO-CORREIA, T. Landscape preferences in the cork oak Mon-tado region of Alentejo, southern Portugal. Landscape Research 33, 3 (2008), 311–330.doi:10.1080/01426390802045962.
[36] TURK, A. G., MARK, D., O’MEARA, C., AND STEA, D. Geography—Documentingterms for landscape features. In Oxford Handbook of Linguistic Fieldwork, N. Thieberger,Ed. Oxford University Press, New York, NY, 2011.
JOSIS, Number 5 (2012), pp. 51–73