Embed Size (px)
Citation preview

9th
European Workshop on Structural Health Monitoring
July 10-13, 2018, Manchester, United Kingdom
Creative Commons CC-BY-NC licence https://creativecommons.org/licenses/by-nc/4.0/
The influence of global and local temperature variation on elastic
guided wave excitation, propagation and scattering
J. Moll1, A.A. Eremin
2,3 and M.V. Golub
2
1 Department of Physics, Goethe University of Frankfurt am Main, Frankfurt am Main,
Germany, E-Mail: [email protected]
2 Institute for Mathematics, Mechanics and Informatics, Kuban State University
Krasnodar, Russia, E-Mail: [email protected] and [email protected]
3 Institute of Mechanics, Helmut Schmidt University, Hamburg, Germany
Abstract
In this paper, the global and local temperature effects are considered and their influence
on ultrasonic guided waves (GW) excitation, propagation and scattering are investigated
numerically and experimentally for metallic and polymer plate-like specimens.
Computer simulation of the phenomena relies on semi-analytical and mesh-based
approaches as well as on recently developed hybrid schemes combining both
approaches.
Firstly, global temperature effects are addressed by fitting data from pitch-catch
experiments in the environmental chamber and the implemented mathematical model.
This allows the estimation of temperature dependent material properties by solving an
inverse problem. Secondly, local temperature changes occurring near surface mounted
low-profile piezoelectric actuator after its prolonged continuous ultrasound excitation.
Such local heating is visualized with an infrared camera. The influence of the obtained
non-neglectable heating on actuator GW generation and sensing capabilities is
illustrated. In addition, local temperature increases at the damaged areas (flat-bottom
holes (FBHs) are considered as the defects) being a result of acoustic activation. This
effect is shown in pitch-catch signals acquired by the sensor network surrounding the
obstacle location. While temperature effects are usually unwanted in structural health
monitoring (SHM) systems, this observation may lead to a novel type of contrast
mechanism for ultrasound-based damage detection in SHM systems.
1. Introduction
Ultrasonic guided waves (GW) are widely employed in structural health monitoring
(SHM) systems due to the relative ease of their activation and measuring and the ability
to interrogate prolonged thin-walled constructions with a distributed actuator-sensor
network. Along with the structural mechanical properties and geometry features,
environmental conditions influence strongly GW dynamic characteristics, with
temperature effects being among the most important ones. The latter might have the
global nature, when the whole inspected object is exposed to ambient temperature
fluctuations (cooling or heating), or be of local nature near structure peculiarities, such
as operating piezoelectric actuators utilized for GW excitation or temperature increase
at the defect in response to acoustic activation. Temperature variation results in changes
Mor
e in
fo a
bout
this
art
icle
: ht
tp://
ww
w.n
dt.n
et/?
id=
2340
2
2
in GW amplitudes and dispersion properties and, therefore, should be properly
addressed for the reliable operation of GW-based SHM systems.
In the literature, the global temperature effects have been well studied. Algorithms for
compensation of the temperature effect have been widely employed which are based on
Optimal Baseline Selection (OBS) and/or Baseline Signal Stretch (BSS) [1]. The
baseline stretch approach has been extended to larger temperature gaps for instance in
[2]. Other temperature compensation methods are based on the independent component
analysis (ICA) [3] and singular value decomposition (SVD) [4].
Local temperature effects at a structural defect are widely used in the context of non-
destructive testing (NDT). One possible approach is pulsed thermography where
thermal energy is delivered to the sample of interest by an external source such as
infrared lamps or flash lamps [5]. Images recorded by a thermal camera indicate the
damage position and size. Vibrothermography, on the other hand, uses either a
mechanical shaker [5] or a high power narrowband ultrasound stimulation [6], [7] that
initiates heating in the defect either by Coulomb friction or damping/internal friction
[8]. The temperature increase can be visualized by a thermal camera system. A
combination of wideband ultrasound excitation and local defect resonances have been
studied in [10] where the locally induced temperature increase is visualized by a
sensitive IR camera. An overview of thermographic methods for condition monitoring
applications can be found in [9].
The goal of the present paper is to investigate both, the global as well as the local
temperature effect. Therefore, Section 2 focuses on the global temperature effect,
particularly on the temperature-dependent Young’s modulus. Section 3 analyses the
local temperature increase at the defect as a result of acoustic activation. Finally,
conclusions are drawn at the end.
2. Assessment of global temperature effects
2.1 Experimental setup for temperature-controlled pitch-catch measurements
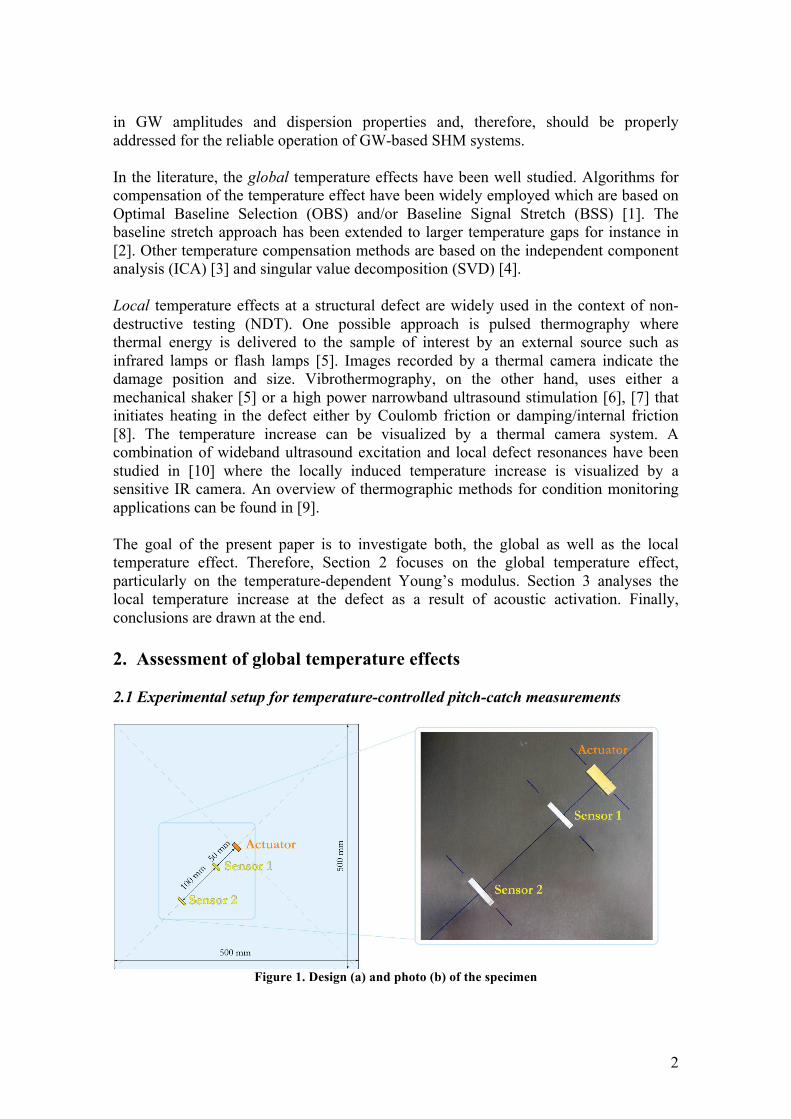
Figure 1. Design (a) and photo (b) of the specimen

3
The experimental setup used in this study is based on an isotropic plate on which three
piezoelectric wafer active sensors (PWAS) are attached to the surface as shown in
Figure 1. The structure has been put in a climate chamber to perform controlled
temperature experiments. A Hann-windowed toneburst voltage signal with central
frequency 0f kHz is employed and the guided wave response is sensed at the two
receiver positions that have a distance to the actuator of 50mm and 160mm, respectively
(see Figure 1).
Figure 2. Hilbert transforms of the signals acquired by Sensor 2 at different temperatures
Measurements have been repeated at different temperatures T in the climate chamber.
Figure 2 demonstrates the Hilbert transform applied to the signals )(1 tu and )(2 tu
recorded by the Sensors 1 and 2 for temperatures T from 0 Co to 51 C
o at central
frequencies of 40kHz and 240kHz. The antisymmetric wave mode A0 is the dominant
wave mode at lower frequencies, while the symmetric mode S0 is clearly seen at higher
frequencies. The increase of temperature causes decrease of the amplitudes excited by
the actuator and increase of the time-of-flight of wave package generated. The latter is
in a good agreement with results obtained in [11]. However further analysis is necessary
for the understanding of the influence of the temperature on Lamb wave propagation.
2.2 Group velocity estimation by means of wavelet transform
Time-frequency analysis is applied to the signals )(1 tu and )(2 tu correspondingly. The
continuous wavelet transform (CWT)
∫ ⎟⎟⎠
⎞⎜⎜⎝
⎛ −−=
2
100
)()(),]([
t
t
G df
fttu
f
ftfuW ξξψξ (1)

4
gives the spectrum of a signal )(ξu recorded during the period of time ],[ 21 tt∈ξ . The
CWT is implemented in terms of the kernel wavelet function )(tG
ψ and the central
frequency 0f of the input voltage signal applied to the Actuator. The Gabor wavelet
( ).i)/(5.0exp)/()( 0
2
0
5.0
0
25.0 tftfftGabor +−= γγπψ
with the parameter 336.52ln/2 ≈= πγ is selected as a kernel function for CWT due
to its correspondence to the generated signal [12].
The CWT of a signal can be calculated at an arbitrary moment of time within the time-
domain considered. Correspondingly, the time-of-flight a of a given frequency f in
the signal is defined as a maximum of the absolute value of the CWT (1), i.e.:
),]([max)(],[ 21
tfuWfabbt∈
= . (2)
The interval ],[ 21 bbt∈ defines the part of the signal to be interpreted using the CWT,
the latter can be used in order to separate different Lamb waves. Thus, the time-of-flight
)( fa j of the frequencies f can be performed for the signals )(tuj
measured by j -th
Sensor ( 2,1=j ). Due to the distance 110=D mm between the centres of Sensor 1 and
Sensor 2 is known the group velocities of Lamb waves can be estimated as follows:
)()(
)(12
gfafa
Dfc
−= . (3)
The values of )( fa j are calculated using the relation (2) for each Lamb wave
separately via the appropriate choice of the time-domain interval ],[ 21 bbt∈ .
2.3 Temperature influence on group velocity of antisymmetric Lamb wave A0

5
Figure 3. Group velocity variation with temperature increase (measured) and with Young’s
modulus increase (theoretically predicted)
The experimental setup described in (2.1) was used to record the wave motion at
sensors 1 and 2. The latter are processed via the CWT so that the frequency dependence
of the group velocity )(g fc is estimated at different temperatures in accordance with
formulae (3). An example of group velocity variation for A0 mode at different
temperatures is demonstrated in Figure 3, the estimated velocities are shown by solid
lines. Analysis of the obtained data shows that group velocity increases with
temperature decrease.
Let us consider group velocities of an elastic plate with Poisson ratio ν , Young’s
modulus E and density ρ have been examined. In order to examine the influence of
the temperature on elastic properties of the plate, it has been assumed that aluminium
plate has the same Poisson ratio 34.0=ν and density 3kg/m2700=ρ for arbitrary
temperature T . The theoretically predicted group velocities of A0 mode are shown in
Figure 3 by dashed lines. The performed analysis of the obtained data allows concluding
that temperature effects can be taken into account during simulations via a
corresponding change of the elastic moduli. However, the obtained data is not enough
for careful estimating of the values of the Young’s modulus E , further studies with
circular shaped piezoelectric transducers are to be done for this purpose using the
technique presented above.
3. Assessment of local temperature effects
The work presented in the following section is based on very preliminary studies for
temperature increase at the defect in response to acoustic activation. Further work is
needed to better understand the underlying mechanisms. While preparing the
experimental setup, we have first observed that a temperature increase by acoustic
activation cannot be achieved for metal structures due to the better thermal conductivity
which leads to a quick temperature balance in the structure. This is the reason for
choosing a plexiglass plate in this work, in which thermal conductivity is reduced.
Moreover, high power acoustic activation may also lead to melting of the plastic
structure due to strong temperature increase at the exciting piezoelectric transducer,
especially at high output power and high frequencies.
3.1 Experimental setup for temperature-controlled pitch-catch measurements
Figure 4 depicts the experimental setup for analysing local temperature increase at the
defect. A plexiglass plate of dimensions 500×500×2 mm3 is serving as specimen. It is
equipped with six small circular PWAS adhesively attached in the vertexes of a regular
hexagon, circumscribed around a circle of radius 100 mm centered at the plate mid-
point. The experiment had several phases: In the first phase, all actuator-sensor
combinations using the multiplexer proposed in Ref. (I)1 are recorded of the damage-
1 K. Neuschwander, A. Shrestha, J. Moll, and V. Krozer, “Multichannel Device for
Integrated Pitch Catch and EMI Measurements in Guided Wave Structural Health
Monitoring Applications,” in 11th International Workshop on Structural Health
Monitoring (Stanford, USA), 2017, pp. 1723–1730.

6
free structure at frequencies up to 300kHz. This measurement serves as the baseline
measurement. In a next step, a circular FBH of radius r=1.8 mm and depth d=1.55 mm
has been introduced on the ray passing between the second T2 and the third T3 sensor
60 mm away from the plate centre, and measurements have been taken without and with
acoustic activation using the rectangular block transducer TA adhered on the same path
at the 120 mm off-centre location.
Figure 4. Experimental setup for analysing local temperature increase at the defect. A rectangular
block transducer (TA) is used for acoustic stimulation. Six circular transducers (T1-T6) are
positioned around the plate centre to measure all actuator-sensor combinations in a round-robin
fashion. Signal generation is performed by a Handyscope HS3 arbitrary waveform generator. A
thermal camera takes snapshots of the temperature distribution in the plate.
To determine the frequency, on which TA should be excited to achieve the temperature
increase at the obstacle, GWs have been measured at the FBH with a scanning lased
Doppler vibrometer Polytec PSV-500 after the broadband 1µs rectangular pulse
excitation with TA. The acquired out-of-plane velocities v3 at the mid-point of the defect
and the corresponding spectrum are summarized in Figure 5. Several clear local maxima
are visible, e.g., at f1 = 96.5 kHz and f2 = 176.5 kHz. Since the heating in plexiglass is
expected mainly due to high oscillation amplitudes, further the acoustic activation is
based on a harmonic sinusoidal excitation at 96.5kHz at 50Vpp.

7
Figure 5. Transient out-of-plane velocities v3 (left) measured at the centre of the FBH after the
broadband excitation of TA; spectrum of this signal (right, blue line); red line corresponds to the
spectrum of the signal v3(t > 0.1 ms) (the results are scaled for the consistency).
3.2 Results of local temperature increase
The first result is shown in Figure 6 in form of a thermal image showing the local
temperature increase at the defect during acoustic activation. The temperature increase
at the defect is approximately 0.3K which can be clearly discriminated from the
homogeneous surrounding domain.
Figure 6. Snapshot of the thermal camera showing the local temperature increase at the flat bottom
hole (FBH), the strong heating of the stimulation block transducer TA as well as the slight
temperature increase at the adjacent transducer due to electromagnetic coupling.
Figure 7 shows the frequency spectra and time-domain data of the unfiltered and filtered
signals. Since the measurement has been conducted during parallel acoustic activation,
the strong 96.5kHz signal had to be filtered. This filtering has been conducted for all
measured signals to achieve a consistent result.

8
Figure 7. (top) frequency spectra of unfiltered and filtered signals (bottom) time domain signals of
unfiltered and filtered signals.
In a next step, ultrasound signals shall be compared for three different cases: (1)
undamaged structure (2) structure with damage, i.e. a FBH, (3) structure with damage
plus acoustic activation. The results are shown in Figure 7 and Figure 8 for two different
actuator-sensor paths, namely T1-R3 (FBH on direct path) and T4-R6. It is important to
note that a temperature sensor has been placed below the flat bottom hole where
temperature differences <0.2K have been measured between subsequent measurements.
It can be clearly observed that a signal change can be measured between measurements
from the undamaged and the damaged structure (conventional approach). Interestingly,
a significant signal change can also be found for the case when the damaged structure is
compared with the damaged structure plus acoustic activation. Two ultrasound
measurements are shown here to demonstrate consistency of the measurements.
Differential signals are plotted on the bottom parts of Figure 8 and Figure 9 to illustrate
signal differences.

9
Figure 8. Transducer pair T1-R3 at 300kHz: (Top left) Raw signals for the pristine structure, two
measurements for the structure with the flat bottom hole (FBH) and two measurements with the
FBH plus acoustic activation. (top right) Zoom of the raw signals plot showing a change in time-of-
flight. (bottom) Differential signals showing a residual after subtraction.
3.3 Discussion of temperature elevation at the defect at off-resonance frequencies
Along with the temperature increase itself it is interesting to reveal the nature of local
peaks observed in the frequency response curve for the point inside the FBH shown in
Figure 5. For a severe damage of this type their location in frequency domain is
typically associated with resonance frequencies of the considered GW diffraction
problem [13]. At such frequencies the incoming GWs not only interact with the obstacle
through scattering but also initiate high-amplitude prolonged motion at its vicinity.

10
Figure 9. Same plot as Figure 7, but for transducer pair T4-R6 at 300kHz.
To check whether this phenomenon explains local maxima in out-of-plane velocity
spectrum curve in Figure 5, theoretical complex eigenfrequencies of the FBH have been
at first evaluated with finite element method (FEM) employing COMSOL 5.3 software
as it is described in [14]. The following values for the first two resonance frequencies
have been obtained: f1,FEM = 84.12-6.19i kHz and f2,FEM = 164.02-19.85i kHz. It is
observed that the values of their real parts differ from the corresponding frequencies f1
and f2. Moreover, due to high values of imaginary part amplitudes the corresponding
resonance motion could be only slightly pronounced. Nevertheless, the first
experimental eigenfrequency f1,exp = 83 kHz is clearly identified in the spectrum of the
signal from Figure 5 (red line, scaled), if the Fourier transform is applied only to the
signal part, measured after the incoming wave package left the obstacle area, i.e. for
t > 0.1 ms, and its value is very close to the predicted one f1,FEM.
Therefore, it might be decided that the introduced FBH is not severe enough to make
resonance diffraction being the only source of high amplitude motion at the obstacle. In
our case local peaks in frequency response occur probably due to the peculiarities of the
FBH-PWAS TA mutual location and could be interpreted by the in-phase summation of
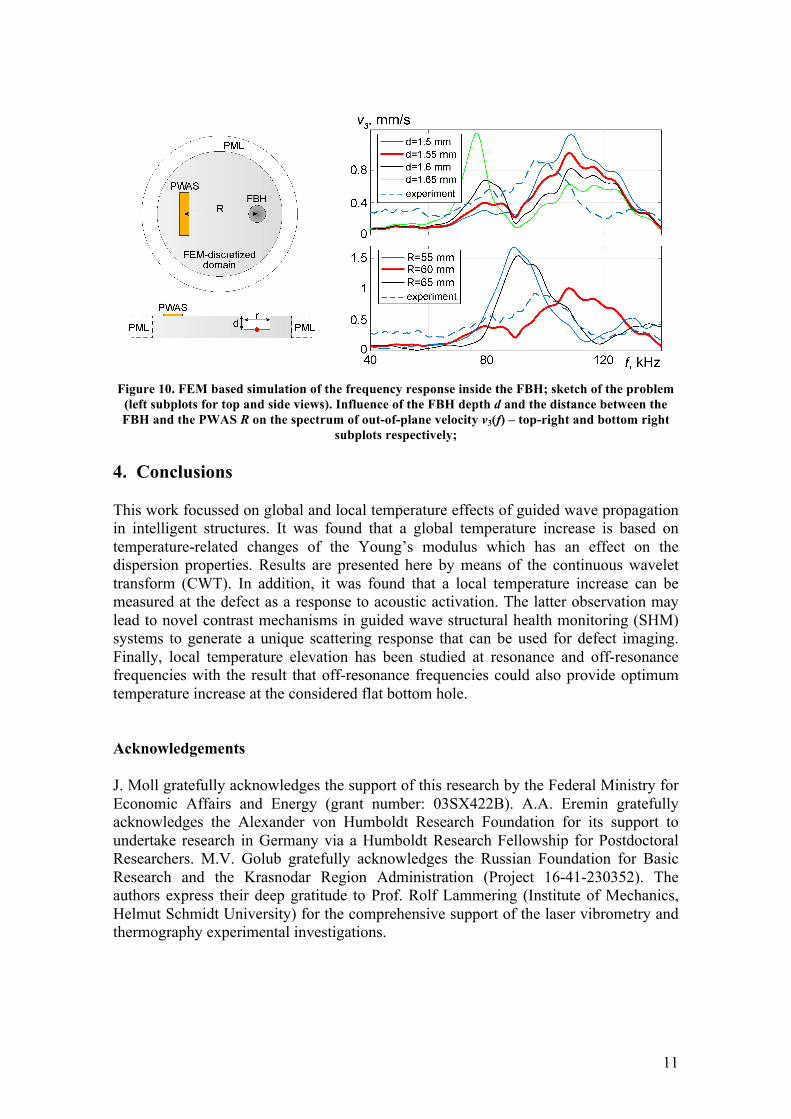
the incoming and reflected GWs at some certain frequencies. The preliminary 3D FEM-
based simulations confirm this guess. While the increase of FBH depth strengthens the
influence of resonance localization (Figure 10, top right subplot, where v3(f) curves
evaluated at the obstacle mid-points for various FBH depths are shown), even slight
changes in the distance between PWAS TA and FBH result in considerable shift of local
peaks in the frequency domain (Figure 10, bottom-right subplot).
11
Figure 10. FEM based simulation of the frequency response inside the FBH; sketch of the problem
(left subplots for top and side views). Influence of the FBH depth d and the distance between the
FBH and the PWAS R on the spectrum of out-of-plane velocity v3(f) – top-right and bottom right
subplots respectively;
4. Conclusions
This work focussed on global and local temperature effects of guided wave propagation
in intelligent structures. It was found that a global temperature increase is based on
temperature-related changes of the Young’s modulus which has an effect on the
dispersion properties. Results are presented here by means of the continuous wavelet
transform (CWT). In addition, it was found that a local temperature increase can be
measured at the defect as a response to acoustic activation. The latter observation may
lead to novel contrast mechanisms in guided wave structural health monitoring (SHM)
systems to generate a unique scattering response that can be used for defect imaging.
Finally, local temperature elevation has been studied at resonance and off-resonance
frequencies with the result that off-resonance frequencies could also provide optimum
temperature increase at the considered flat bottom hole.
Acknowledgements
J. Moll gratefully acknowledges the support of this research by the Federal Ministry for
Economic Affairs and Energy (grant number: 03SX422B). A.A. Eremin gratefully
acknowledges the Alexander von Humboldt Research Foundation for its support to
undertake research in Germany via a Humboldt Research Fellowship for Postdoctoral
Researchers. M.V. Golub gratefully acknowledges the Russian Foundation for Basic
Research and the Krasnodar Region Administration (Project 16-41-230352). The
authors express their deep gratitude to Prof. Rolf Lammering (Institute of Mechanics,
Helmut Schmidt University) for the comprehensive support of the laser vibrometry and
thermography experimental investigations.
12
References and footnotes
[1] A. J. Croxford, J. Moll, P. D. Wilcox, and J. E. Michaels, “Efficient Temperature
Compensation Strategies for Guided Wave Structural Health Monitoring,”
Ultrasonics, vol. 50, no. 4–5, pp. 517–528, 2010.
[2] M. Salmanpour, Z. Sharif Khodaei, and M. Aliabadi, “Guided wave temperature
correction methods in structural health monitoring,” J. Intell. Mater. Syst. Struct.,
vol. 28, no. 5, pp. 604–618, Mar. 2017.
[3] J. Dobson and P. Cawley, “Independent Component Analysis for Improved
Defect Detection in Guided Wave Monitoring,” Proc. IEEE, pp. 1–12, 2015.
[4] C. Liu, J. B. Harley, M. Bergés, D. W. Greve, and I. J. Oppenheim, “Robust
ultrasonic damage detection under complex environmental conditions using
singular value decomposition,” Ultrasonics, vol. 58, pp. 75–86, Apr. 2015.
[5] T. Uhl, M. Szwedo, P. Hellstein, and L. Pieconka, “Image-based structural health
monitoring of composite structures,” in 29th Congress of the International
Council of the Aeronautical Sciences, 2014, pp. 1–6.
[6] R. B. Mignogna, R. E. Green, J. C. Duke, E. G. Henneke, and K. L. Reifsnider,
“Thermographic investigation of high-power ultrasonic heating in materials,”
Ultrasonics, vol. 19, no. 4, pp. 159–163, Jul. 1981.
[7] D. A. Derusova, V. P. Vavilov, and S. S. Pawar, “Evaluation of equivalent defect
heat generation in carbon epoxy composite under powerful ultrasonic stimulation
by using infrared thermography,” IOP Conf. Ser. Mater. Sci. Eng., vol. 81, p.
012084, Apr. 2015.
[8] M. Rahammer, I. Solodov, W. Bisle, D. Scherling, and M. Kreutzbruck,
“Thermosonic Testing with Phase Matched Guided Wave Excitation,” J.
Nondestruct. Eval., vol. 35, no. 3, Sep. 2016.
[9] S. Bagavathiappan, B. B. Lahiri, T. Saravanan, J. Philip, and T. Jayakumar,
“Infrared thermography for condition monitoring – A review,” Infrared Phys.
Technol., vol. 60, pp. 35–55, Sep. 2013.
[10] I. Solodov, D. Derusova, and M. Rahammer, “Thermosonic Chladni figures for
defect-selective imaging,” Ultrasonics, vol. 60, pp. 1–5, Jul. 2015.
[11]. P. Kijanka, P. Packo, X. Zhu, W. J. Staszewski and F. L. di Scalea, “Three-
dimensional temperature effect modelling of piezoceramic transducers used for
Lamb wave based damage detection,” Smart Materials and Structures, vol. 24,
065005, 2015.
[12]. K. Kishimoto, H. Inoue, M. Hamada and T. Shibuya, “Time Frequency Analysis
of Dispersive Waves by Means of Wavelet Transform”, Journal of Applied
Mechanics, Vol 62, pp 841–846, 1995.
[13]. E. Glushkov, N. Glushkova, A. Eremin, R. Lammerign, “Trapped mode effects in
notched plate-like structures”, Journal of Sound and Vibration, Vol 358, pp 142-
151, 2015
[14]. A. Eremin, E. Glushkov, N. Glushkova, R. Lammering, “TInteraction of elastic
guided waves with localized three-dimensional thickness changes in plate-like
metallic structures”, in Proceedings of the International Conference Days on
Diffraction 2017, 2017, pp. 100–103.


![A Pulsed Thermographic Imaging System for Detection and ......Pulse-phase thermography is an analytical technique for pulsed thermographic analysis [27]. In this technique, the changing](https://img.dokumen.tips/doc/110x75/6075e906a530e32a413fd52d/a-pulsed-thermographic-imaging-system-for-detection-and-pulse-phase-thermography.jpg)