Embed Size (px)
Citation preview
THE INFLUENCE OF AGGREGATE STIFFNESS
ON THE MEASURED AND PREDICTED CREEP
BEHAVIOUR OF CONCRETE
George C Fanourakis
A project report submitted to the Faculty of Engineering, University of the
Witwatersrand, Johannesburg, in partial fulfilment of the requirements for the
degree of Master of Science inEngineering.
Johannesburg, 1998

ii
DECLARATION
I, George C Fanourakis, hereby declare that this project report is my own, unaided
work. It is being submitted for the degree of Master of Science in Engineering in
the University of the Witwatersrand, Johannesburg. It has not been submitted
before for any degree or examination in any other University.
Dated this .2 oS· £;;; day of cU'! ,,';;'<:~t't!;'1//
,1998

iii
ABSTRACT
Aggregate stiffness is known to influence the magnitude of creep of concrete. The
purpose of this research project was to quantify the influence of aggregate stiffness
on the measured and predicted long-term creep behaviour of plain concrete.
Basic and total creep tests were conducted on concrete specimens of two different
strength grades for each of three different commonly used South African aggregate
types (quartzite, granite and andesite). In addition, elastic modulus tests Were
conducted on cores of the aggregate types considered.
The test results revealed that no correlation exists between the creep of concrete
and the stiffness of the included aggregate. These results appear to be attributable
to the stress-strain behaviour of the aggregate/paste interfacial zone, in the case of
aggregates with an elastic modulus in excess of 70 GPa.
The experimental basic and total creep values from this investigation were
compared with those predicted for each mix at the corresponding ages by the BS
8110 (1985), ACI 209 (1992), AS 3600 (1988), CEB-FIP (1970), CEB-FIP
(1978), CEB-FIP (1990) and the RILEM Model B3 (1995). This comparison
indicated that the results predicted by each model vary widely and that no
correlation exists between the magnitude of the aggregate stiffness and the creep
strains predicted by each model.

iv
ACKNOWLEDGEMENTS
I acknowledge, with gratitude, the assistance of the following persons and
organisations who contributed to the completion of this project:
Dr Y Ballim who supervised the project and offered enthusiastic support and
advice during the execution of this research;
Mr L Russell and Mr S Masondo of the Department of Civil Engineering of the
University of the Witwatersrand, Johannesburg, for their assistance with the
laboratory work;
The Cement and Concrete Institute for the use of their library facilities and Mrs H
Turner, Mrs L de Bernier and Mrs A Martinek for their professional assistance;
Alpha Limited and, in particular, Mr W A Coull and Mr L Nematswerani for
providing tle cement and aggregates used in the research;
The Foundation for Research Development and the Cement Industries Fund for
providing financial assistance;
Ms J C Coetzee for typing Chapter Three;

v
IVIrG Hartzenberg for his support;
Finally, I am extremely grateful to my wife Ursula for her love manifested in the
patience, understanding and support which she offered throughout the course of
this project.

vi
Thanks be to the Almighty God, the source of all strength, guidance, knowledge
and wisdom. For all glory, honour and worship belong to You, Father, Son and
Holy Spirit, now and forever. Amen.

vii
TABLE OF CONTENTS
CONTENTS Page
DECLARATION ii
ABSTRACT iii
ACKNOWLEDGEMENTS iv
CONTENTS vii
LIST OF FIGURES xiv
LIST OF TABLES xix
1 INTRODUCTION
1.1 Creep Strain and its Significance 1
1.1.1 Creep strain 1
1.1.2 Factors affecting creep 2
1.1.3 The effects of creep 3
1.2 The Determination of Creep Strain 4
1.2.1 Accuracy of estimations 4
1.2.2 Prediction models 5
1.3 Motivation for this Investigation 6
1.4 Objectives of this Investigation 7
1.5 Organisation of this Dissertation 9

viii
2 LITERATURE REVIEW 11
2.1 The Phenomenon of Creep 11
2.1.1 Total strain 11
2.1.2 Creep strain 12
2.1.3 Creep-time functions 15
2.1.4 Shrinkage strain 15
2.2 Factors Affecting Creep of Concrete 18
2.2.1 Intrinsic factors 19
2.2.2 Extrinsic factors 23
2.3 Mechanisms of Creep 26
2.3.1 Mechanical deformation theory 27
2.3.2 Plastic theory 28
2.3.3 Viscous and visco-elastic flow theory 28
2.3.4 Elastic after-effect theory 29
2.3.5 Seepage solution theory 29
2.4 Creep Hypotheses 30
2.4.1 American Concrete Institute (1972) 30
2.4,2 Powers' hypothesis 31
2.4.3 Ishai's hypothesis 32
2.4.4 Feldman and Sereda's hypothesis 33
2.4.5 Kesler's hypothesis 34
2.5 The Influence of Aggregate Stiffness on Creep 35

IX
2.5.1 Aggregates outside South Africa
2.5.2 South African aggregates
2.6 Conclusions
36
39
40
3 REVIEW OF CREEP PREDICTION METHODS 42
3.1 Levels of Creep Estimation 42
3.1.1 Lowest level 42
3.1.2 Intermediate 1evel 43
3.1.3 Highest level 43
3.2 Creep Prediction Methods 44
3.2.1 General structure of methods 44
3.2.2 The BS 8110 (1985) method 45
3.2.3 The ACI 209 (1992) method 50
3.2.4 The AS 3600 (1988) method 54
3.2.5 The CEB-FIP Model Code (1970) 58
3.2.6 The CEB-FIP Model Code (1978) 60
3.2.7 The CEB-FIP Model Code (1990) 64
3.2.8 The RILEMModelB3 (1995) 70
3.3 Conclusions 76
4 EXPERIMENTAL DETAILS
4.1 Introduction
4.2 Materials
78
78
78
x
4.2.1 Cement 78
4.2.2 Aggregates 79
4.3 Laboratory Procedures 79
4.3.1 Mix proportions 79
4.3.2 Mixing procedure 81
4.3.3 Compaction 81
4.3.4 Cm-ing 81
4.3.5 Preparation of specimens 82
4.4 Testing of Hardened Concrete 82
4.4.1 Compressive strength 824.4.2 Creep and associated shrinkage tests 83
4.4.3 Determination of elastic moduli of the aggregates 88
5 RESULTS AND DISCUSSION 90
5.1 Compressive Strength of Concrete 90
5.2 Measured and Inferred Strains 91
5.2.1 Measured strains 91
5.2.2 Inferred strains 91
5.3 Calculation of Creep Strains and Creep-Time Functions 95
5.4 Drying Shrinkage Strains 99
5.5 Creep 102
5.5.1 Correlation of total creep with E of aggregate 102
5.5.2 Total creep strains 105

xi
5.5.3 Basic creep strains 1085.5.4 Comparison of total and basic creep 1095.5.5 Correlation of secant modulus of concrete and creep strain 1115.6 Conclusions 1125.6.1 Shrinkage strains 1125.6.2 Effect of aggregate stiffness on creep strain 112
5.6.3 Comparison of results with those of Davis and Alexander 11\
(1992)5.6.4 Effect of secant modulus of concrete at age of loading on creep 115
strain
6 COMPARISON OF MEASURED AND PREDICTED 116
CREEP STRAINS
6.1 Introduction 116
6.2 Assumptions Made: in Analysis 117
6.2.1 General assumptions 117
6.2.2 Method specific assumptions 119
6.3 Statistical Techniques Employed 122
6.3.1 T-Test 122
6.3.2 Coefficient of variation of errors 123
6.4 Discussion of Results 125
6.4.1 Elastic moduli of concrete 125
6.4.2 Rapid initial flow 128

xii
6.4.3 Total creep strain 129
6.4.4 Basic creep strain 135
6.5 Comparison of Results Obtained with Results of Other 141
Investigations
6.5.1 Davis and Alexander (1992) 141
6.5.2 RILEM Data Bank 144
6.5.3 Brooks et aI., (1992) 148
6.5.4 McDonald et aI., (1988) 148
6.5.5 Alexander (1986) 149
6.6 Conclusions lSI6.6.1 Elastic moduli of concrete 151
6.6.2 Total and basic creep 152
6 6.3 Comparison of results from this project with results of other 154
investigations
7 CONCLUSIONS AND RECOMMENDATIONS 158
7.1 Conclusions 158
7.1.1 Measured creep strains 158
7.1.2 Comparison of measured and predicted creep strains 161
7.2 Recommendations for Further Research 166
7.2.1 Influence of aggr=gate type and stiffness on creep 166
7.2.2 Further verification ofthe creep prediction models 167

xiii
APPENDIX A DESIGN VALVES FOR ESTIMATING 168
ELASTIC MODULUS OF CONCRETE
APPENDIXB KESULTS OF GRADING ANALYSES OF 170
CRUSHER SANDS
APPENDIXC CUBE TEST RESULTS 173
APPENDIXD STRAIN MEASUREMENTS RECORDED ON 174
TEST PRISMS
APPENDIXE AUTOGENOUSSHRrnKAGES~S 180
APPENDIXF RELATIVE CREEP COEFFICIENT DETAILS 181
APPENDIXG SPECIFIC STRAINS OF TEST SPECIMENS 182
APPENDIXH VARIABLES USED FOR CREEP 185
PREDICTIONS
APPENDIX I MEASURED AND PREDICTED CREEP 201
COEFFICIENTS
APPENDIXJ MEASTJRED Al'TJ) PREDICTED SPECIFIC 207
CREEP VALUES
REFERENCES 213
xiv
LIST OF FIGURES
Figure Page
2.1 Concrete strain components under sustained stress 12
2.2 Creep components in a drying specimen (after Gilbert, 1988) 13
2.3 Comparison ofRHPC (mix 2.2) and OPC (mix 2.1) drying and 17
autogenous shrinkage strains (after Alexander, 1994b)
2.4 Effect ofw/c ratio on creep of cement paste (after Ruetz, 1969) 19
2.5 Effect of previous drying on basic creep of cement paste 20
(afterWittmann, 1970)
2.6 Thirty year creep coefficient versus volume: surface ratio for 23
sealed concrete and for drying concrete stored at a relative
humidity of 60 per cent (after Neville and Brooks, 1987)
2.7 Effect of relative humidity on creep of concrete 24
(after Troxell et al., 1958)
2.8 Influence of temperature on creep 25
(after Neville lind Brooks, 1987)
2.9 Influence of age ofload application on creep of concrete 26
relative to creep of concrete loaded at 7 days and stored at a
relative humidity of approximately 75 pel' cent
(after Neville et at, 1983)

xv
2.10 Creep of concretes made with different aggregates; ale ratio = 36
5.67; w/c = 0.59; applied stress = 5.5 MFa (after Troxell et at,
1958)
2.11 The effect of aggregate stiffness on creep of concrete 37
(after The Concrete Society, 1974)
2.12 Relationship between absorption and modulus of elasticity of 38
different aggregates (after Kordina, 1960)
2.13 Relative creep of different South African aggregates 39
(after Davis and Alexander, 1992)
3.1 Effects of relative humidity, age ofloading and section 47
thickness upon creep factor (after BS 8110, 1985)
3.2 Creep factor coefficient (k2) for various environments 57
(after AS 3600, 1988)
3.3 Maturity coefficient (ks) values (after AS 3600, 1988) 57
4.1 Schematic arrangement of the creep loading frame 84
(after Ba11in1,1983)
4.2 Loaded prisms in creep frame 85
4.3 Companion drying shrinkage samples 85
5.1 Average cube strengths of concretes with different 90
aggregates for the two w/c ratios
5.2 Cumulative autogenous shrinkage strain versus time for mixes 94
with a w/c ratio ofO.56

xvi
5.3 Cumulative autogenous shrinkage strain versus time for mixes 94
with a wlc ratio of 0.4
5.4 Cumulative drying shrinkage strain versus time of drying for 101
shrinkage specimens with a wlc ratio of 0.56
5.5 Cumulative drying shrinkage strain versus time of drying for 101
shrinkage specimens with a wlc ratio of 0.4
5.6 Relationship between relative creep and elastic modulus of 104
aggregates
5.7 Specific total creep versus time since loading 106
5.8 Specific basic creep versus time since loading 108
5.9 Relationship between specific creep at 168 days and 111secant modulus of concrete at 1.2(1 days
6.1 Measured and predicted elastic moduli values at 28 days after 126
casting
6.2 Measured and predicted specific total creep versus time since 130
loading for mix Q1 specimens
6.3 Measured and predicted specific total creep versus time since 130
loading for mix Q2 specimens
6.4 Measured and predicted specific total creep versus time since 131
loading for mix G1 specimens
6.5 Measured and predicted specific total creep versus time since 131
loading for mix G2 specimens
xvii
6.6 Measured and predicted specific total creep versus time since 132
loading for mix A1 specimens
6.7 Measured and predicted specific total creep versus time since 132
loading for mix A2 specimens
6.8 Measured and predicted specific basic creep versus time since l36
loading for mix Q1 specimens
6.9 Measured and predicted specific basic creep versus time since 136
loading for mix Q2 specimens
6.10 Measured and predicted specific basic creep versus time since l37
loading for mix G1 specimens
6.11 Measured and predicted specific basic -reep versus time since 137
loading for mix G2 specimens
6.12 Measured and predicted specific basic creep versus time since l38
loading for mix Al specimens
6.l3 Measured and predicted specific basic creep versus time since 138
loading for mix A2 specimens
6.14 Comparison between measured and predicted creep strains of 150
South African concretes at 60 days after loading
(after Alexander, 1986)
B.1 Results of grading analysis of quartzite crusher sand as 170
received from the crusher
B.2 Results of grading analysis of granite crusher sand as received 171
from the crusher

xviii
B.3 Results of grading analysis of andesite crusher sand as received 172
from the crusher
G.l Specific strains versus time since loading for mix Ql 182
specimens
G.2 Specific strains versus time since loading for mix Q2 182
specimens
G.3 Specifio strains versus time since loading for mix G1 183
specimens
G.4 Specific strains versus time since loading for mix G2 183
specimens
G.S Specific strains versus time since loading for mix Al 184
specimens
G.6 Specific strains versus time since loading for mix A2 184
specimens
xix
LIST OF TABLES
Table Page
2.1 Concrete mix proportions of mixes 2.1 and 2.2 18
(after Alexander, 1994b)
3.1 Summary off actors accounted for by different prediction 46
methods
3.2 ¥3 correction factors anplicable when h.):::; l50mm 53
(after ACI 209, 1992)
::3.3 Basic creep factors (after AS 3600, 1988) 56
3.4 Values ofHc for various notional thicknesses 63
(after CEB-FIP, 1978)
3.5 Characteristic cube and cylinder strength values 65
(after CEB-FIP, 1990)
4.1 Mix proportions and slump test results of the concrete used in 80
the investigation
4.2 Average unconfined compressive strength values for the 89
different aggregate types and maximum stresses applied to the
rock samples
5.1 Results of creep measurements on quartzite-aggregate 96
concretes

xx
5.2 Results of creep measurements on granite-aggregate concretes 97
5.3 Results of creep measurements on andesite-aggregate concretes 98
5.4 Results of elastic moduli tests on cores 103
5.5 Statistics pertaining to the correlation of relative creep to 105
average modulus of elasticity of aggregates
5.6 Average of specific basic creep to specific total creep ratios 110
(expressed as a percentage) for the six month loading period
6.1 Measured and predicted modulus of elasticity values for 127
different concrete mixes
6.2 Measured and predicted specific rapid initial :flowvalues 129
6.3 Coefficients of variation of errors (expressed as a percentage) 129
of creep predictions for various models
6.4 Coefficients of vadation of errors (expressed as a percentage) 139
ofbasic creep predictions for various models
6.5 Relative creep coefficients for different aggregate types 143
6.6 Coefficients of vadation for specific total creep predictions for 145
the RILEM Model B3 (1995), ACI 209 (1992) and CEB-FIP
(1990) methods (after RILEM Model B3, 1995)
6.7 Coefficients of vadation for specific basic creep predictions for 147
the lULEM Model B3 (1995), ACI 209 (1992) and eEB-PIP
(1990) methods (after RILEM Model B3, 1995)
7.1 Summary of predicted specific strain magnitudes relative to the 163
measured values

xxi
A.1 Design values for estimating elastic modulus of concrete for 168
ages from 3 to 28 days (after Davis and Alexander, 1992)
A.2 Design values for estimating elastic modulus of mature 169
concretes of 6 months or older days
(after Davis and Alexander, 1992)
C.l Compressive strengths of the cubes of the different mixes 173
D.1 Strain measurements recorded on quartzite prisms (Mix Q1) 174
D.2 Strain measurements recorded on quartzite prisms (Mix Q2) 175
D.3 Strain measurements recorded on granite prisms (Mix G1) 176
D.4 Strain measurements recorded on granite prisms (Mix G2) 177
D.5 Strain measurements recorded on andesite prisms (Mix AI) 178
D.6 Strain measurements recorded on andesite prisms (Mix A2) 179
E.l Inferred autogenous shrinkage strains 180
F.1 Adjusted specific creep values, elastic moduli and relative 181
creep coefficients
H.l Variables used for creep predictions according to the BS 8110 185
(1985) and BS 8110 (1985) - Modified methods
H.2 Calculated ratio of final creep assumed to develop at different 186
loading ages (BS 8110, 1985)
H.3 Variables used for creep predictions according to the ACI 209 187
(1992) method
H.4 Variables used for creep predictions according to the AS 3600 188
(1988) method

xxii
H.5 Creep factor coefficients (k2) for different ages after loading 18~
(after AS 3600, 1988)
H.6 Variables used for creep predictions according to the CEB-FIP 189
(1970) method
H.7 Calculated k, coefficients for different loading ages 190
(after CEB-FIP, 1970)
H.8 Variables used for creep predictions according to the CEB-FIP 191
(1978) method
H.9 Flow coefficient variables used for creep predictions according 191
to the CEB-FIP (1978) method
H.I0 Calculated values of the Pd(t - r) and Pr(t) - Pr('t) functions 192
for different ages of loading (after CEB-FIP, 1978)
H.11 Variables used for creep predictions according to the CEB-FIP 193
(1991') method
H.12 Calculated values of the pc (t - to) function for different ages of 194
loading (after eEB-FIP, 1990)
H.l3 Variables used tor creep predictions according to the RlLEM 195
ModelB3 (1995) method
H.14 Calculated values of the Z (t, 't) and () (t, r) functions for 196
different ages ofloading required for the , 1'('d~~tiOllof basic
creep (RILEMModelB3, 1995)

xxiii
H.15 Calculated values of the E (t) for different ages of'loading 197
required for the prediction of drying creep
(RILEM Model B3, 1995)
R16 Calculated values Ofesh""S(t), H(t) and qs at different ages of 198
loading for quartzite-aggregate concretes
(RII.EM Model B3, 1995)
H.17 Calculated values Ofesh""S(t), H(t) and qs at different ages of 199
loading for granite-aggregate concretes
(RILEM Model B3, 1995)
a.is Calculated values of est,,,,,Set), H(t) and qs at different ages of 200
loading for andesite-aggregate concretes
(RILEMModelB3,1995)
I.l Measured and predicted total creep coefficients and basic creep 201
coefficients for different ages ofloading for mix Ql concrete
specimens
1.2 Measured and predicted total creep coefficients and basic creep 202
coefficients for different ages ofloading for mix Q2 concrete
specimens
1.3 Measured and predicted total creep coefficients and basic creep 203
coefficients for different ages ofloading for mix Gl concrete
specimens

xxiv
I.4 Measured and predicted total creep coefficients and basic creep 204
coefficients for different ages of'loading for mix G2 concrete
specimens
I.5 Measured and predicted total creep coefficients and basic creep 205
coefficients for different ages ofloading for mix Al concrete
specimens
I.6 Measured and predicted total creep coefficients and basic creep 206
coefficients for different ages of loading for mix A2 concrete
specimens
J.l Measured and predicted specific total creep and specif'c basic 207
creep values for different ages ofloading for mix Ql concrete
specimens
J.2 Measured and predicted specific total creep and specific basic 208
creep values for different ages ofloading for mix Q2 concrete
specimens
J.3 Measured and predicted specific total creep and specific basic 209
creep values for different ages of'Ioading for mix G1 concrete
specimens
J.4 Measured and predicted specific total creep and specific basic 210
creep values for different ages of loading for mix G2 concrete
specimens

~~--------------
xxv
J.5 Measured and predicted specific total creep and specific basic
creep values for different ages ofloading for mix A 1 concrete
specimens
Measured and predicted specific total creep and specific basic
creep values for different ages ofloading for mix A2 concrete
specimens
J.6
211
212
CHAPTER 1
INTRODUCTION
1.1 Creep Strain and its Significance
1.1.1 Creep strain
Creep is the time dependent increase in strain of a solid body under constant or
controlled stress. Creep deformations are normally two to three times larger than
the instantaneous deformations of concrete (Bazant and Panula, 1978).
Creep strain (at any time) can be divided into a basic creep and a drying creep
component. If the concrete is sealed or if there is no moisture exchange between
the concrete and the ambient medium, only basic creep occurs. Drying creep is
the additional creep experienced when the concrete is allowed to dry while under
sustained load. The SUmof basic and drying creep is referred to as total creep.

2
1.1.2 Factors affecting creep
Creep of concrete is affected by many variables. Some of these variables are
intrinsic properties of the mix and others are associated with extrinsic
environmental factors.
The intrinsic factors include water/cement (w/c) ratio, degree of hydration, age of
paste, cement type, admixtures, moisture content, aggregate content and aggregate
properties. The extrinsic factors include stress/strength ratio, duration of load,
curing, age of loading, member geometry, relative humidity, temperature and rate
and time of drying.
With regard to the study of creep, concrete is generally considered as a two-phase
material consisting of the hardened cement paste and the aggregate. Creep strain
is assumed to occur in the cement paste, provided the aggregate does not exhibit
any time dependent deformation of its own. However, when the creep strain in the
cement paste under a sustained load increases with time, the actual deformation of
the concrete is restrained by the presence of the aggregate which is interspersed in
the paste (Neville et. al., 1983).
3
1.1.3 The effects of creep
Creep of concrete is both a desirable and an undesirable phenomenon. On the one
hand it is desirable as it imparts a degree of ductility to the concrete, without
which the concrete would be too brittle for use in the majority of structures
(Alexander, 1986). On the other hand, creep is often responsible for excessive
deflections at service loads which can result in the instability in arch or shell
structures, cracking, creep buckling of long columns and loss of prestress (RILEM
Model TIl, 1995). Frequently the detrimental results of creep are more damaging
to non-load-bearing components associated with the structure, such as window
frames, cladding panels and partitions, than they are to the structure itself (Davis
and Alexander, 1992). Often, damaged structures are either shut down or undergo
extensive repairs long before the end of their intended design life, resulting in
significant economic consequences. Creep strain is generally associated with its
detrimental effects.
Thus the magnitude of creep is a design consideration which is of importance for
the durability and the long-term serviceability of structures. Its importance has
been heightened by the increasing tendency to use highly stressed and slender
members.
4
1.2 The Determination of Creep Strain
1.2.1 Accuracy of estimations
The magnitude of creep, which is required for design purposes, can be estimated at
various levels of accuracy. The choice of level depends on the type of structure
and the time of prediction with regards to the information available. Therefore, in
cases where only a rough estimate of the creep is required, this estimate can be
made on the basis of a few parameters which are available at the design stage,
such as characteristic compressive strength of concrete, member thickness and
relative humidity. On the other extreme, in the case of deformation-sensitive
structures where an accurate estimate is required, an initial er .nate of the creep
can be made at the design stage using the procedure discussed above. The
accuracy of this estimate can subsequently be improved by utilising relatively
complex creep prediction models which require specific Information on the mix
design (such as 28 day compressive strength of the concrete, wlc ratio and binder
type) which is available at the early stages of construction. Further refinement of
the creep estimation may follow in the case of prestressed structures where post-
construction in-situ measurements can be used as a basis for adjusting the stresses
in the tendons, thereby ensuring that the structure conforms with the design.
Ideally, a compromise has to be sought between the simplicity of the prediction
procedure and the accuracy of results required.
5
As long-term testing is impractical and often not an option where accuracy is
required, short term tests, performed during a time period not exceeding 28 days
after exposure, may be used to adjust the relatively simple models which are
incorporated in design codes (code-type models) in order to obtain a more accurate
prediction of the long-term creep of concrete (Ojdrovic and Zarghamee, 1996).
Alternatively the results of short term creep tests on a given concrete may be
extrapolated to long term results by combining the measured data with prior
statistical information on the creep of concrete in general, using, for example, the
Bayesian statistical approach developed by Bazant and Chern (1984).
1.2.2 Prediction models
( reep predictions for structures that are net deformation-sensitive are usually
arrived at by means of the application of generally simple code-type models.
These models vary widely in their techniques, are empirically based and do not
require any results from laboratory tests as input. However, certain intrinsic
ancIlor extrinsic variables, such as mix proportions, material properties and age of
loading are required as input to these models. Such models include the:
• British Standards Institution - Structural Use of Concrete, BS 8110 - Part 2 -
(1985)
" American Concrete Institute (ACI) Committee 209 (1992)
• Standards Association of Australia - Australian Standard for Concrete
Structures ~AS 3600 (1988)

6
• Comite Euro-Intemational Du Beton - Federation Internationale De La
Precontrainte (CEB-FIP) Mudel Code (1970)
• CEB-FIP Model Code (1978)
• CEB-FIP Model Code (1990)
• International Union of Testing and Research Laboratories for Materials and
Structures (RILEM) Model B3 (1995)
1.3 Motivation for this Investigation
Although research on creep has been actively pursued for the past 90 years,
significant improvement of the present understanding and prediction capabilities is
justified for the following reasons:
• The realistic prediction of creep is difficult as this phenomenon is caused by
several interacting mechanisms and is affected by many factors (RILEM
Model B3, 1995). For this reason, despite the publication of many empirical
creep prediction methods, a unified approach incorporating all relevant factors
and which is applicable to all situations is yet to be developed;
• According to the RlLEM Model B3 (1995), Brooks et al., (1992), McDonald
et al., (1988), Alexander (1986) and Gilbert (1988), estimates of creep
obtained from the different code-type predictive methods vary widely.
Therefore, despite the research conducted to date, much more experimental

7
work is required before a model is produced which accurately accounts for the
many parameters which affect creep;
CI The uncertainty in the predictions from code type models may, to some degree,
be attributable to the fact that, of the methods listed above, only the BS 8110
(1985) method directly accounts for the influence of aggregate stiffness which
is known to effect the magnitude of creep Hobbs (1971);
• The accuracy of existing creep prediction models when applied to concretes
containing South African aggregate and binder types and exposed to South
African environmental conditions has not been assessed.
Hence. the above needs initiated the investigation project which is described in
this dissertation.
1.4 Objectives of this Investigation
The purpose of this investigation was to assess the influence of aggregate stiffness
on the long-term (up to six months) creep behaviour of plain concrete and to
determine the suitability of a number of existing prediction models.
The specific objectives of this investigation were to:

8
It Evaluate the effect of different w/c ratios (0.56 and 0.4) on the basic and total
creep behaviour of concrete;
It Assess the effect of aggregate stiffness on the basic and total creep behaviour
of concretes containing one of three different commonly used South African
aggregate types. The aggregate types considered were quartzite from the Ferro
quarry in Pretoria, granite from the Jukskei quarry in Midrand and andesite
from the Eikenhof quarry in Johannesburg, South Africa;
• Confirm, and possibly supplement, the findings of Davis and Alexander (1992)
who conducted research on the total creep of concretes containing either
quartzite, granite or andesite from the same sources as those used in this
investigation;
o Compare the exp erimental basic and total creep values from this investigation
against those predicted at the corresponding ages by the BS 8110 (1985), ACI
209 (1992), AS 3600 (1988), CEB-FIP (1970), CEB-FIP (1978), CEB-FIP
(1990) and the RILEM Model B3 (1995) methods;
• Compare the accuracy of the above mentioned prediction methods established
in this investigation with the accuracy determined for the same methods from
results of other investigations;

9
• Identify the method or methods which provide the most accurate estimates of
creep strain of concrete made with either quartzite, granite or andesite
aggregates;
The ultimate objective of the investigation was to provide designers with
information regarding the most suitable method for predicting the creep of
concrete comprising any of the aggregates included in the investigation, thereby
obviating the need for laboratory creep tests where any of these aggregates are
used in concrete.
1.5 Organisation of this Dissertation
Chapter 2 provides a general review of the literature on creep with particular
attention on the factors affeoting creep, the physical mechanisms of creep and the
influence of aggregate stiffness on creep.
Chapter 3 provides an overview of the prediction methods used in this study. The
approach and applicability of each method is also discussed.
Details on the materials and equipment used and tests conducted in this
investigation are discussed in Chapter 4 and the results obtained are presented and
discussed in Chapter 5.

10
In Chapter 6, the measured strains are compared with the strains predicted at the
corresponding time periods by the seven prediction methods, six of which derive
from structural codes, included in this investigation. This chapter includes details
on any assumptions made in the predictive procedures and statistical techniques
employed in evaluating the accuracy of the predicted results. The findings are
discussed and compared with those of similar projects carried out by other
researchers.
Finally, Chapter 7 summarises the more important findings and conclusions of this
study and provides specific recommendations with regards to further research
based on these findings.
11
CRAPTIeR 2
LITERATURE REVIEW
2.1 The Phenomenon of Creep
2.1.1 Total strain
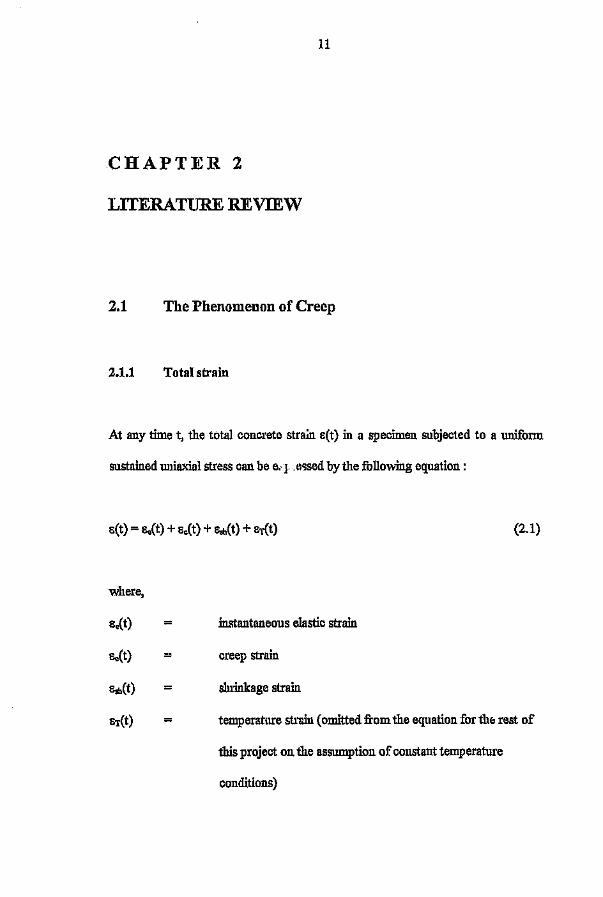
At any time t, the total concrete strain 8(t) in a specimen subjected to a uniform
sustained uniaxial stress can be e. I essed by the following equation:
s(t) = Ee(t) + Be(t)+ Bsh(t)+ BT(t) (2.1)
where,
B.(t) =
Be(t)
Bsh(t)
CT(t)
instantaneous elastic strain
creep strain
shrinkage strain
temperature strain (omitted from the equation for the rest of
this project on the assumption of constant temperature
conditions)

12
It is usual to assume that the creep and shrinkage components are independent and
may be calculated separately and summed to obtain the total non-elastic strain, as
shown in Figure 2.1. According to Neville et. al., (1983), Reutz (1965), Kovler
(1996), Powers (1966) and Pickett (1942) this principle of superposition is not
entirely correct since creep and shrinkage are not independent phenomena.
Nevertheless, all available information on creep and its prediction are based on the
assumption of the additive effects of creep and sluinkage.ITolal strain- - _- ------
Ec( I ) • Creep
E.( I) • Instantaneous
-------_ .._---_-E.h( I)· Shrinkage
0 't
[--Cia
0 't
Time, I
---+--------------------------~Time, I
Figure 2.1 Concrete strain components under sustained stress
2.1.2 Creep strain
Total creep strain, Ee(t), at any time t, can be divided into several components as
follows:
13
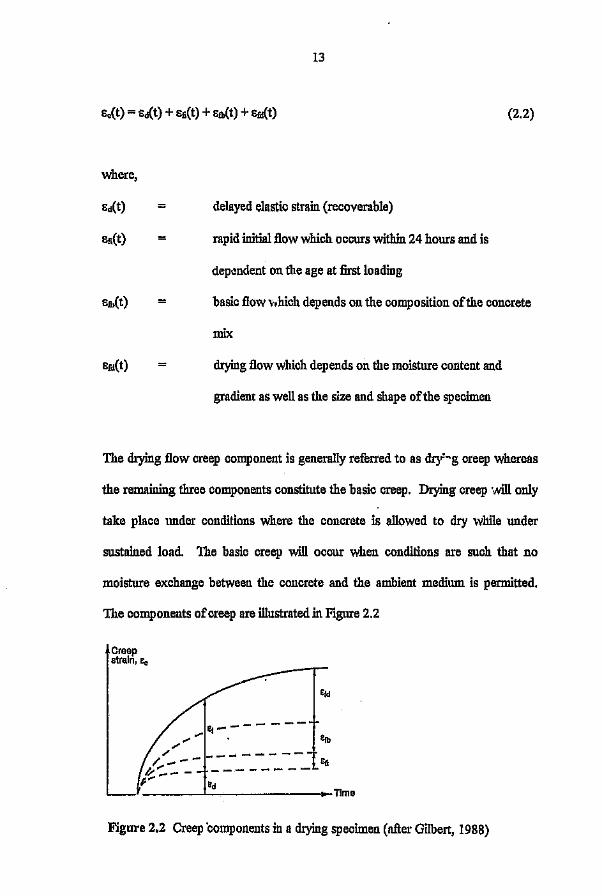
8e(t) = 8d(t) + 8fi(t)+ 8lb(t)+ efd(t) (2.2)
where,
delayed elastic strain (recoverable)
Efi(t) rapid initial flow which occurs within 24 hours and is
dependent on the age at first loading
basic flow which depends on the composition of the concrete
mix
8fd(t) drying flow which depends on the moisture content and
gradient as well as the size and shape of the specimen
The drying flow creep component is generally referred to as dry'-g creep whereas
the remaining three components constitute the basic creep. Drying creep will only
take place under conditions where the concrete is allowed to dry while under
sustained load. The basic creep will occur when conditions are such that no
moisture exchange between the concrete and the ambient medium is permitted,
The components of creep are illustrated in Figure 2.2
1
Creepstralri, Eo
Eil
_- ---
---------.------£d--------~------------_+-TIme
Figure 2.2 Creep 'components in a drying specimen (after Gilbert, 1988)
14
The above strain-time curves (Figures 2.1 and 2.2) are representative of situations
where the uniaxially applied sustained constant stress does not exceed 40 per cent
of the short term strength of the concrete. At higher stress levels the mechanisms
are different as significant load induced micro-cracking will occur between the
aggregate and the matrix and within the matrix, hence leading to an additional
creep component (Alexander, 1994a).
Pickett (1942) introduced the concept of drying creep to account for the difference
between the total creep and basic creep. Clearly this concept deviates from the
assumption that creep and shrinkage are additive. "This deviation will inevitably
arise if the deformation of a drying specimen is expressed through that of a sealed
one because these two specimens represent different materials, in spite of the same
structure and geometry, age and load conditions, and even the same total moisture
content (in the initial moment of sealing). The main difference is that the
distribution of moisture and vapour pressure in sealed specimens is changed
immediately after sealing. Therefore, the deformations of sealed concretes should
proceed according to their own law, as deformations of another material" (Kovler,
1996).
15
2.1.3 Creep-tlme functions
The specific creep (Cc), creep coefficient (<!J) and creep function (<ll), as defined
below, are generally used for the computation of comparative creep strain.
Specific creep (creep strain per unit applied stress) C=~o (j
(2.3)
Creep coefficient (creep strain divided by initial elastic strain) ~ = ~ (2.4)Be
Creep function (sum of instantaneous and creep strains) <P =__1_[1 +~(t, 'C)] (2. S)EO ('C)
where: ee is creep strain, e, is instantaneous elastic strain; 0' is the applied constant
stress, E, is the elastic modulus of the concrete; t is the age of the concrete and 'r
is the time at which the load was applied. Therefore (t-r) is the time under load.
2.1.4 Shrinkage strain
Shrinkage is defined as the time-dependent reduction in the volume of fresh or
hardened concrete. The shrinkage strain of hardened concrete that will occur at
any time t, esh(t), depends on the external environment and uccurs in the paste of

16
the concrete (unless shrinking aggregates are used) (Alexander, 1994a). Concrete
that is exposed to an environment where drying is permitted will exhibit drying
shrinkage whereas concrete that is sealed frorn the environment (eg. very large
members) will exhibit autogenous shrinkage. Concrete that is stored in water will
swell (negative shrinkage). Shrinkage due to carbonation may also occur in
hardened concrete. Drying shrinkage and autogenous shrinkage, which are of
relevance to this project, are briefly described below.
Drying shrinkage
Drying shrinkage is associated with the outflow of moisture from the concrete to
the environment, hence resulting in a decrease in the volume of the concrete. This
moisture loss occurs as conventional concrete contains more water than can
chemically be combined with the cement (Alexander, 1994a).
A utogeno us shrinkage
Autogenous shrinkage is often referred to as chemical shrinkage. Since the
products of hydration occupy less volume than the sum of the volumes of the
original separate components, the cement/water system contracts as hydration
proceeds. Furthermore, if no additional water is made available after mixing, the
consumption of the water in the concrete during the hydration process results in
autogenous shrinkage. The magnitude of the autogenous shrinkage relative to the
drying shrinkage is small (Alexander, 1986).

17
The results of shrinkage tests conducted by Alexander (1994b) on concrete
containing either ordinary portland cement (OPC) or rapid hardening portland
cement (RHPC) or blended cements (incorporating blastfurnace slag and
condensed silica fume) show the magnitudes of the autogenous shrinkage to be
significant. This finding is in contradiction with RILEM TC-I07 (1995) which
states that the magnitude of autogenous shrinkage is usually negligible. Figure 2.3
illustrates the shrinkage exhibited by the sealed and exposed RHPC (mix 2.2) and
OPC (mix 2.1) specimens. At present, in South Africa CEM I 42,5 cemen' is the
equivalent ofOPC cement. The mix proportions of the abovementioned concretes
are given in Table 2.1.
600
500
100
-a-OPC (mix 2.1) Drying
-e-OPC (mix 2.1) Autogenous
I-IF---.----------l -.Ir- RHPC (mix 2.2) Drying
-er- RHPC (mix 2.2) Autogenous
oo 300 35050 100 150 200 250
Time Since Loading (Days)
Figure 2.3 Comparison ofRHPC (mix 2.2) and OPC (mix 2,1) drying and
autogenous shrinkage strains (after Alexander, 1994b)
400

18
Table 2.1 Concrete mix proportions of mixes 2.1 and 2.2 (after Alexander, 1994b)
Cement Type OPC RHPCMix Number 2.1 2.2Water (11m3
) 190 190Cement (kg/nr') 370 33019l111llQuartzite Crushed Stone (kg/nr') 1150 1150Quartzite Crusher Sand (kg/nr') 560 578Natural Alluvial Filler Sand (kg/nr') 185 200W/CRatio 0.51 0.57A'CRatio 5.12 5.84
The results shown in Figure 2.3 indicate autogenous shrinkage strain magnitudes of
approximately 450 micro-strain at an age of 360 days. According to Alexander
(1998), these magnitudes are unusually high and, typically, autogenous strains not
exceeding 150 micro-strain would be expected at an age of360 days.
2.2 Factors Affecting Creep of Concrete
Creep of concrete is affected by many variables, Some of these variables are
intrinsic properties of the mix or specimen and others are associated with extrinsic
environmental factors (Alexander, 1994a). The influence of the different factors on
creep is discussed by Alexander (1994a) and others and is briefly summarised, for
the uniaxial compressive stress state, below.

2.2.1 Intrinsic factors
Water: cement ratio
19
A decrease in the w/c ratio of a mix results in an increase in the strength and
stiffhess and a decrease in the permeability of the cement paste. Hence, a decrease
in the w/c ratio causes a decrease in creep. This is shown in Figure 2.4, which has
been adapted by Alexander (1994a) from Ruetz (1965).
;£ 300~c:'6i;; Ag~ ot looding = 28 d2 RH during drying = 40 ·f.,~e'8'SI:. 2001l"i'"...ECci..,.,b 100~'0'"$
o~--~----~--~~--~----~a 0.2 0,4 0,6 0,8 1,0 W/C
Figure 2.4 Pffect ofw/c ratio-on creep of cement paste (after Ruetz, 1969)
Moisture content
The greater the moisture content of the cement paste at the time of loading and
20
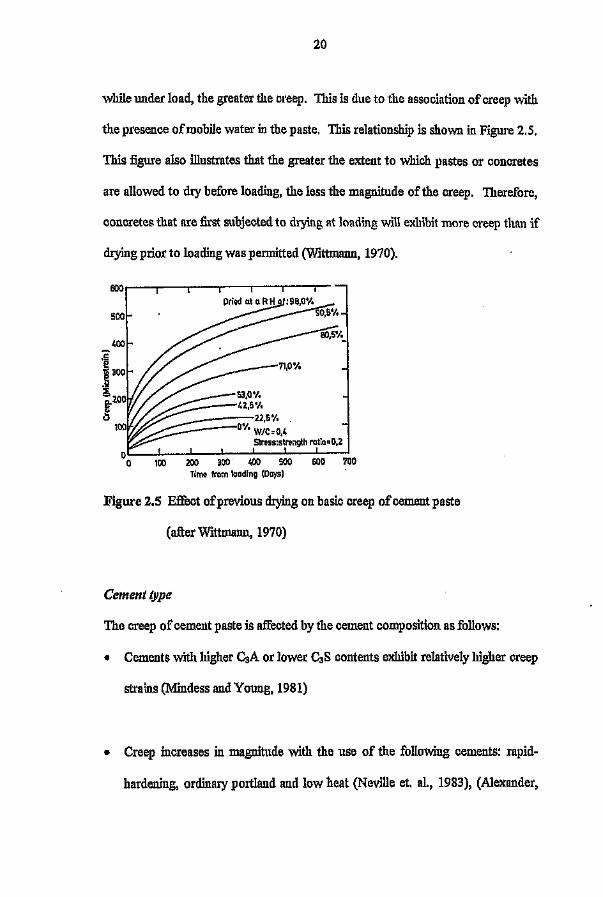
while under load, the greater the creep. This is due to the association of creep vv1th
the presence of mobile water in the paste. This relationship is shown in Figure 2.5.
This figure also illustrates that the greater the extent to which pastes or concretes
are allowed to dry before loading, the less the magnitude of the creep. Therefore,
concretes that are :firstsubjected to drying at loading win exhibit more creep than if
drying prior to loading was permitted (Wittmann, 1970).
500
_---22,5'1,~_-O'I. W/C:O,4
Stress:strengthratio:O,2
100 200 300 400 500 600 700Time from loading (Days)
Figure 2,5 Effect of previous drying on basic creep of cement paste
(after Wittmann, 1970)
Cement type
The creep of cement paste is affected by the cement composition as follows:
o Cements with higher C3A or lower C3S contents exhibit relatively higher creep
strains (Mindess and Young, 1981)
• Creep increases in magnitude with the use of the following cements: rapid-
hardening, ordinary portland and low heat (Neville et, a1., 1983), (Alexander,
21
1994a). According to Alexander (1994a), at least a difference of the portion of
the creep resulting from the use of different cements can be accounted for by
the variable strength gain rates which are affected by ,1 i) composition and
fineness of grinding.
Cement extenders
Work by Alexander (l994b) showed that the presence of ground granulated
blastfumace slag (GGBS) in ordinary portland cement (OPC) concretes caused a
possible small increase in creep (approximately 20 pel' cent) at early ages in drying
specimens, but that this effect was usually reversed at lager ages.
The use offly ash (FA) in portland cement concretes had the effect of reducing the
specific creep in comparison with plain mixes with similar 28 day strengths,
particularly in the case of sealed specimens (Grieve, 1991), (CSIR, 1982), (Dhir et.
al., 1986) and (Carette and Malhotra, 1986).
Limited research on the use of condensed silica fume (CSF) and OPC in concrete
indicated a reduction of the creep magnitude when compared with otherwise
similar ope mixes (Alexander, 1994b), (Luther and Hansen, 1989), (Bull and
Acker, 1985) and (Wolsiefer, 1982).
22
Admixtures
The effect of admixtures on creep has been found to be highly variable depending
on the composition and type of admixture used (Morgan, 1975), (Alexander,
1983) and (Brooks, 1989). Therefore, when the use of an admixture is proposed
for concrete where creep may detrimentally affect the structural performance, it is
recommended that the effect of the admixture on creep should be assessed by
means of laboratory tests (Alexander, 1994a).
Aggregate properties and content
Normal-density aggregates of crushed rock or hard gravel normally do not exhibit
creep at the stress levels to which they are subjected in normal concrete. Hence,
aggregates reduce the creep of concrete by diluting the paste and restraining its
movement. The particle shape, maxi-tum size and grading of the aggregate are an
important factor as they influence the volume fraction of aggregate in the concrete
(Ballim, 1983). From the above it is clear that creep of concrete is affected by both
the aggregate volume concentration and the stiffness of the aggregate (Alexander,
1994a). In addition, the profound influence of aggregate type on the deformation
properties of concrete was proved by Alexander (1996). A more detailed
discussion on the influence of aggregate stiffness on creep is given in Section 2.5.
2.2.2 Extrinsic factors
Member geometry and size
23
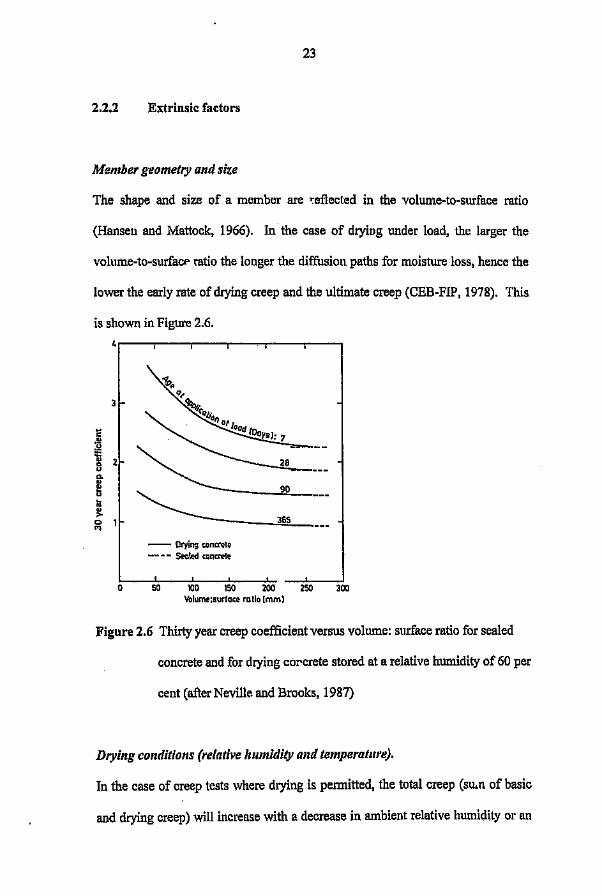
The shape and size of a member are reflected in the volume-to-surface ratio
(Hansen and Mattock, 1966). In the case of drying under load, the larger the
volume-to-surface ratio the longer the diffusion paths for moisture loss, hence the
lower the early rate of drying creep and the ultimate creep (CEB-FIP, 1978). This
is shown in Figure 2.6,
C.2,!,!:::1l 2'"Q..,e'"~'".,>g 1
90
~ __ ~36~S _
--- Drying concrete-~ - ~ Sealed concrete
250 300~--~----~--~-~a 50 tOO ISO 200
Volume:surfa~e ratio (mm)
Figure 2.6 Thirty year creep coefficient versus volume: surface ratio for sealed
cent (after Neville and Brooks, 1987)
concrete and for drying cor-crete stored at a relative humidity of 60 per
Drying conditions (relative humidity and temperature).
In the case of creep tests where drying is permitted, the total creep (su.n of basic
and drying creep) will increase with a decrease in ambient relative humidity or an

24
increase in temperature (Alexander, 1994a). This is confirmed by Bhal and Mitral
(1996) who found that the ultimate creep at 50 per cent relative humidity is
approximately three times the creep at 100 per cent relative humidity. According
to Troxell et al., (1958) concretes which are permitted to dry out for the first time
under load exhibit considerably higher creep magnitudes at lower relative
humidities. This effect is illustrated in Figure 2.7.
1200 r--;----r---,.-..,---..,----r-.....,...-,
O~-~-~--~-~~--~~_J10 26 90 10 20 30
(Days) (Years)TIme slnce loading (Log scole 1
Figure 2.7 Effect of relative humidity on creep of concrete (after Troxell et al.,
1958)
The effect of an increase in temperature on concrete creep is dependent on the
time at which the temperature rise occurs relative to the time of load application
(Bamforth, 1980), According to Neville and Brooks (1987) concretes which are
cured at test temperature will exhibit less creep than concretes which are cured at a
temperature of 21°C and then heated to test temperature at one week before
loading (refer to Figure 2.8). Note that the specimens were cured (saturated) at the
stated temperature from one day until loading at one year.

25
5 - Cured at 21'C and hectedto test I~mp~ralur~1 w~~k before loading
4
e,
'"eu
'" 3.~~
2
a
Cured at testtemperature
20 40 60 80 100
Figure 2.8 In.fluence of temperature on creep (after Neville and Brooks, 1987)
Temperature ('e)
Stresststrengtlt ratio, curing and age at loading
The stress: strength ratio incorporates the effect of a number of'factors which affect
concrete creep. These factors include the magnitude of stress, duration and type of
curing, age at loading and w/c cement ratio. For constant mix proportions and the
same aggregate type, creep increases with higher stress and decreases with
increasing strength at the time of load application (Alexander, 1994·a), The
relationship between stress.strength ratio and creep is assumed to be linear for
stress levels less than approximately 40 per cent of'the short term strength (Neville
et al., 1983). Furthermore, the later the age of load application, the less .he
expected creep (provided that adequate curing has been achieved), This trend is
shown in Figure 2,9 which is based on tests by different investigators (Neville et
al., 1983),

26
::>.Qle(J
.~ 0.5iii71i0:
I1.0~1 ................x
.................->(
C"............., x""'..... '".......... ........... ......... ...............
o
• Glanvillex Outran
'" Daviso LeCamusa Glangrcco
Age at application of load (log scale) - days
Figure 2.9 Influence of age ofload application on creep of concrete relative to
creep of concrete loaded at 7 days and stored at a relative humidity of
approximately 75 pel' cent (after Neville et at, 1983)
Time under load
Creep of concrete occurs as long as it is subjected to an external load, if not
indefinitely. It is evident fi'o~ Figure 2.7 that measurable creep still occurs at an
age of approximately 30 years after loading. ill general, approximately 50 per cent
of the 20 year creep occurs within a period of two to six months after loading,
while 80 pel cent occurs after about one or two years (Alexander, 1994a).
2.3 Mechanisms of Creep
rue results of many experiments have led to the development of models to explain
the mechanisms of creep. However, a review of the proposed mechanisms
indicated that many of these were subsequently discredited by new tests, This is an

27
indication that the mechanisms of creep are not yet clearly understood (Yunping
and Jennings, 1992). The broad mechanisms that have been identified are briefly
discussed below. These mechanisms are applicable to stresses in concrete not
exceeding 40 per cent of the ultimate compressive strength.
2.3.1 Mechanical deformation theory
According to this theory, when concrete is subjected to a compressive stress, the
form of the capillary structure in the cement paste changes due to the applied load
and resulting internal stresses (Freyssinet, 1936). This entails the deformation of
the capillaries and the outward displacement of the water menisci to points where
the capillary diameters are larger, resulting in a decrease in the tension under which
the capillary water is held. Consequently, the induced compressive stress is
reduced. Furthermore, the hy~al equilibrium is upset and water will evaporate
from the capillaries until the vapour pressure is reduced to the ambient value. The
tension in the capillary water rises and, ill order to maintain equilibrium, an increase
in the compression of the solid phase results. The resultant deformation is the
creep (Neville et at, 1983).
This theory describes a delayed elastic type strain, in which case the creep would
be reversed if the load were to be removed. As this hypothesis cannot explain
creep in water, it is not accepted.

28
2.3.2 Plastic theory
This theory suggest that the creep of concrete may be in the nature of the
crystalline flow. In other words creep occurs as a result of slipping along planes
within the crystal lattice, similar to plastic flow of metals. Although this theory
may be applicable to concrete subjected to stresses of neal' failure magnitude, this
type of behaviour is not of great significance to the creep behaviour of concrete
under normal loads (Neville et al., 1983).
2.3.3 Viscous and visco-elastic flow theory
Iliis theory states that the hydrated cement paste is a highly viscous liquid whose
viscosity increases with time due to chemical changes within the structure. This
was initially suggested by Thomas (1937) and was reiterated by Reiner (1949).
Hansen (1960) Was of the opiuion that the viscous flow in hydrated cement paste
took place at the grain or particle boundaries,
The viscous flow theory is one of the most important creep theories and there arc
strong reasons to believe that this flow contributes to the creep of concrete.
However, it is not clear whether it is the water or the gel that constitutes this
viscous phase (Neville et al., 1983).

29
2.3.4 Elastic after-effect theory
This theory denies the existence of creep and was expressed by Maney (1941).
The basis of this theory is that true creep is not appreciable at working loads and
that the effect of loading is simply an elastic change due to the change of 110n~
uniform shrinkage (Neville et al., 1983).
2.3,5 Seepage solution theory
This theory assumes that the hydrated cement paste is a rigid gel and that when a
load is applied to the concrete, an expulsion of the viscous components fi:om the
voids in the elastic skeleton results. This in nun leads to a redistribution of the
stresses from the viscous component to the elastic skeleton. Therefore, the creep
is due to the seepage of gel water under pressure. Note that only the gel water is
involved in this movement and not the capillary or chemically bound water (Neville
et al., 1983). This theory was supported by Lea and Lee (1946) and Seed (1948).
This theory provides an explanation for the large creep exhibited by drying
concrete in comparison to that of wet 01' dry concrete (Yunping and Jennings,
1992).

30
2.4 Creep Hypotheses
Each of the mechanisms described above may form the basis of a m, lematical
model for creep. However, the development of a comprehensive model may result
from the combination of one 01' more of the proposed mechanis ... To date no
universally accepted mechanism or hypothesis has been established, probably as
their is little evidence at a microstructural level to separate one mechanism from
another (Yunping and Jennings, 1992).
In view of the fact that not one of the abovementioned mechan' .counts for
the observed phenomena, integrated theories based on the combination of more
than one mechanism have been developed. A number of hypotheses representative
of the different schools of thought are briefly described below.
2.4.1 American Concrete Institute (1972)
The American Concrete Institute (ACI) (1972) have attributed creep to the
following four main mechanisms:
ViSCOllSj(OW
This occurs in the cement paste and is caused by sliding or shear of the gel particles
which are lubricated by layers of adsorbed water.

31
Seepage
Consolidation occurs due to seepage of adsorbed water or the decomposition of
interlayer hydrate water.
Delayed elasticity
This component accompanies viscous flow and seepage (above) and is due to the
cement paste which acts as a restraint on the elastic deformation of the aggregate
and gel crystals.
Permanent deformation
This is due to any local fracture, including micro cracking and crystal failure, as well
as formation of new physical bonds and recrystalization.
According to the ACI (1972) the bulk of creep exhibited by concrete is due to the
viscous flow and seepage mechanisms.
2.4.2 POWCl'S9 hypothesis
Powers (1966) states that the quasi-crystalline solid bodies comprising the hydrated
cement paste, which are mostly colloidal sized, are arranged in such a way that a
large proportion of the interstitial spaces are not wide enough to accommodate tlte
number of adsorbed water layers that can be held in the wider spaces at a given
relative humidity. This obstruction of adsorption results in a disjoining pressure
(Neville et a1., 1983).

32
Although this water is load bearing and represents a structural element of the
hardened cement paste it is more mobile than a solid. Therefore, when an external
stress is applied to the concrete, the load bearing water in the areas of hindered
adsorption is subjected to an additional pressure. To preserve hygral equilibrium,
this water diffuses to adjacent areas of unhindered adsorption, reducing the
swelling pressure as well as the thickness of the load bearing films, consequently
resulting in a reduction in inter-particle spacing. In the case of loaded concrete
which is permitted to dry, the water molecules are eventually transferred out of the
system.
The reduction is in the direction of the applied load and constitutes the creep. TIle
magnitude of the creep depends on the amount of water in the load-bearing area
that must be moved to restore the hygral equilibrium. According to this
hypothesis, which is concerned with reversible creep only, creep recovery is the
reversal of the above process which occurs when changes occur due to a drop in
the pressure of the load bearing water (Powers, 1966).
2.4.3 Ishai's hypothesis
According to Ishai (1968), the application of an external load to a concrete
member results in an instantaneous elastic response of the solid phase and of the
liquid in the cavities. Hence, the load is carried by the solid and the liquid phases.

33
Under sustained load the compressed liquid in the cavities diffuses to areas of
relatively lower pressure causing gradual load transfer from the liquid to the solid
phase.
The stress on the capillary water disappears within a few days by being transferred
to the surrounding gel. Similarly, the stress on the gel water disappears after a
number of weeks. It appears that the pressure on the inter- and intracrystalline
water acts almost indefinitely (Neville et al., 1983).
Furthermore, the reversible creep which occurs at an initially high rate and
generally stabilises within a two month period after loading is governed by the
migration of capillary and gel water. The irreversible creep takes place in the
interparticle and inter- and intracrystalline spaces and continues for many years
after the reversible creep has ceased (Neville et al., 1983).
'2.4.4 Feldman and Sereda's hypothesis
This hypothesis suggests that the relocation of inter- and intralayer water is of
utmost importance and the role of adsorbed water is not significant in the creep
process. The application of a load to the concrete causes the removal of the inter-
and intralayer water which results in a reduction in the layer thickness and
spacing. This process is responsible for the reversible creep component (Feldman
and Sereda, 1968 & 1969).
34
The irreversible creep occurs as a result of viscous flow of gel layers relative to
each other, introducing a process of breaking and remaking of mechanical and
chemical interparticle bonds (Feldman and Sereda, 1968 & 1969).
2.4.5 Kesler's hypothesis
Vaishnav and Kesler (1961) suggested that the mechanisms of seepage, delayed
elasticity and viscous flow are responsible for creep at lower stresses.
The initially high creep rate is probably due to seepage which is reversible,
provided the desorbed water is available for re-sorption. However, creep resulting
from permanent changes in the arrangement of the gel particles due to the
formation of new bonds and new gel particles by hydration during the intervening
period is not reversible. In addition to the seepage, after the initial period, viscous
deformation occurs at the points of contact of gel particles covered with adsorbed
water. This displacement of the gel particles is irreversible, The delayed elastic
behaviour may arise from the molecular diffusion of the amorphous components of
the gel, acting in parallel with the more or less crystalline components (Neville et
al., 1983).

35
2.5 The Influence of Aggregate Stiffness on Creep
In general, concrete is viewed as a two phase material consisting of the hardened
cement paste and the aggregate. The role of the paste is to tlrovide strength to the
concrete and the aggregate is relied upon to provided bulk, rigidity and
dimensional stability and normally reduce the cost When concrete is subjected to
an external stress, the resulting creep strain of the concrete is assumed to occur
mainly in the paste if the aggregate does not undergo any time-dependent
deformation of its own. The aggregate which is interspersed in the paste reduces
creep deformation of the paste by diluting the paste and by restraining its creep.
As creep continues to occur in the paste, more of the applied load is progressively
applied to the aggregate until a stage is reached where further deformation is
governed by the aggregate stiffness. Results of recent research indicate that creep
may also be affected by the lower density porous layer comprising the interfacial
zone around the particles (Mindess and Alexander 1995) and (Alexander and
Milr,e, 1995).
The following discussion describes how the creep of concrete is influenced h.Ythe
aggregate type and, in particular, aggregate stiffness.

36
2.5.1 Aggregates outside South Africa
Troxell et al., (1958) studied the iufluence of aggregate type on creep. The results
of their research, which clearly confirm the significant influence of aggregate type
on creep strain, are shown in Figure 2.10.
Sandstone ----,..Basalt ---- .....Gravel-----.
0.IIIQ)o ---a
'"I'2
Days YearsTime under load (log scale)
Figure 2.10 Creep of concretes made with different aggregates; alc ratio = 5.67;
wlc = 0.59; applied stress = 5.5 MPa (after Troxell et al., 1958)
It is evident from Figure 2.],0 that, all intrinsic and extrinsic parameters being
constant, the creep of sandstone concretes can exceed the creep of limestone
concretes by a factor of up to 2.5. Research by Rusch et al, (1962), also showed
that sandstone concretes exhibited a higher creep strain than concretes made with
other aggregates. However, the order of increasing creep with the use of the
different aggregates differed from that shown in Figure 2.10. This difference is

37
probably attributable to the variance in the mineralogical and petrological
composition (Alexander, 1994a) and physical properties ofthe aggregates usjd in
the two projects.
Tne results of research by The Concrete Society (1974) in London clearly indicate
that the higher the elastic modulus of an aggregate, the greater the restraint offered
by the aggregate to the creep of the paste. This is shown in Figure 2.11 where it
can be seen that the magnitude of creep of concretes containing low-modulus
aggregates may be up to four times that of concretes with relatively stiffer
aggregates. Furthermore, creep becomes insensitive to aggregate type in the case
of aggregates with a modulus of elasticity in excess of70 GPa (Alexander, 1994a).
c.OJeo
.~coa;0:
o Kordina (1960)A Counto (1964)o Brown and Blundell (1971)
.:Crushed quartzI r Rounded quartz
J 0 0 rBasaltRivergraVel) A / A .
1 -Granite
oM.odulusof elastlclly of aggregale .,..GPa
Figure 2.11 The effect of aggregate stiffuess on creep of concrete (after The
Concrete Society, 1974)
38
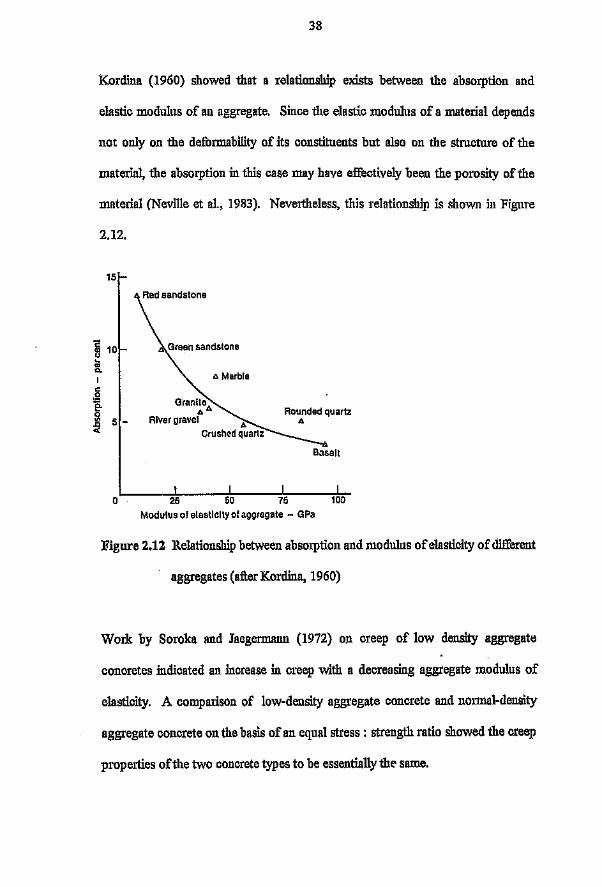
Korclina (1960) showed that a relationship exists between the absorption and
elastic modulus of an aggregate. Since the elastic modulus of a material depends
not only on the deformability of its constituents but also on the structure of the
material, the absorption in this case may have effectively been the porosity of the
material (Neville et al., 1983). Nevertheless, this relationship is shown in Figure
2.12.
c.,<J.....,0.
Ic:.2e-o11 5-4:
lJ. Marble
Granite£>£>
River gravel £>
Crushed quartz
Rounded quartz£>
----Basalto
Modulus of elasticity of aggregate - GPa
Figure 2.12 Relationship between absorption and modulus of elasticity of different
aggregates (after Kordina, 1960)
Work by Soroka and Jaegermann (1972) on creep of low density aggregate
concretes indicated an increase in creep with a decreasing aggregate modulus of
elasticity. A comparison of low-density aggregate concrete and normal-density
aggregate concrete on the basis of an equal stress: strength ratio showed the creep
properties of the two concrete types to be essentially the same.

39
2.5.2 South African aggregates
Extensive research on the creep properties of eight most commonly used South
(1992),
African aggregate types from 23 sources was carried cut by Davis and Alexander
The results of this investigation led to the establishment of relative creep values for
the different aggregates, which are shown in Figure 2.13. It is evident from this
sources exhibit different creep magnitudes.
figure that concretes with aggregates of the same generic origin from different
DOLOMITE (STI<FfN) . ... h::.:...~ .. =GRANITE (JUKS) <Xm'#$#A: 1W$,m'//.' 'mw/.,W&! W$&l
GRANITE (ROOD) ic==~=!'.zzI~=~==DOLOMITE (OUFANTS)== =-=1=1QUARTZITE (BUNDUJGRANITE (RHEE)QUARTZITE (SCOOPS) p....=.,..._"""I--iII!l'lIIImPo"""""""FmGREYWACI<E(pENIN) ~=~==~'m=~==t=FELSITE (MIDDEI )TlWTE (UMLAr'lS)QUARTlITE (FERRO)FELSITE (ZEEK)SILTSTONE (l&B)DOLERITE (NGAG)QUARTZITE (VER)QUARTZITE (COED)DOLERITE (l&B)QUARTZITE (DRD) ~ ~,I-""'"..,.f.;""""-~""",~"""""",,ANDESITE (El1<EN)ANDESITE (VAAl.)QUARTZITE (MOSS) ~ ~'I=:tim..,p.==q---mrl'''''''''''''''*",-DOLERITE (NAT CR)QUARTZITE (VLAK)
IIlIII Tililleo SiltstoneC3J Dolomite~ Granlte/Felslte_ Dolerlle/Andeslte
IilmiI GrcywnckeUI Quartzites
mY.MZZw. ~ • ~ W~ ~
------1=--
I
1,6° 0,2 0,4 '1.6 0,8 1:WI. live Creep Coclllclent
1,2 1,4
Alexander, 1992)
Figure 2.13 Relative creep of different South African aggregates (after Davis and

40
Alexander (1993a) found no correlation between the magnitude of the creep of
concrete and the elastic modulus of the aggregate used in the concrete.
2.6 Conclusions
There are many intrinsic and extrinsic factors that affect the creep of concrete,
including aggregate stiffness. Research into the affect of these different factors on
creep has led to the establishment of general relationships between creep
magnitude and eacii of these factors. Such results have been used to the
deveiopment of a number of models to explain the mechanisms of creep.
Since not one of the mechanism theories developed accounts for the observed
facts, a number of hypotheses have been proposed by different researchers, on the
basis of combining more than one mechanism, in an attempt to explain the
phenomenon of creep.
To date no universally accepted mechanism or hypothesis has been established,
probably as their is little evidence at a microstructural level to separate one
mechanism from another (Yunping and Jennings, 1992).
The results of creep tests conducted on concretes comprising South African
aggregate and binder types and exposed to a South African environment are
discussed in Chapter 5 of this report. In this discussion particular attention is

41
given to the influence of aggregate stiffness on the creep behaviour of these
concretes.
42
CHAPTER 3
REVIEW OF CREEP PREDICTION :METHODS
3.1 Levels of Creep Estimation
The magnitude of creep, which is required for design purposes, can be estimated at
various levels. The choice of level depends on the type of structure and the time of
prediction with regards to the information available. A three level approach proposed
by ruston et. al., (1979) is briefly described below:
3.1.1 Lowestlevel
At this level rough estimates which are suitable only for approximate calculations are
required. These estimates are based on a few input parameters, which are available at
the design stage, such as characteristic compressive strength of concrete, member
thickness and relative humidity. Such estimates are acceptable for structures that are
not sensitive to deformations but are not in accordance with the degree of accuracy
required for deformation-sensitive structures and hence would have to be revised at
the intermediate or highest level when more detailed information is made available.
43
The level at which the final estimates are required is dependent on the nature of the
structure.
3.1.2 Intermediate level
At this level estimates are made by utilising relatively complex creep prediction
models which require input data which is available at the early stages of construction.
This data typically includes information on the mix design such as 28 day
compressive strength of the concrete, wlc ratio, binder type and age of loading
3.i.3 Highest level
This level is relevant to structures where time dependent movements are critical. The
data required is usually produced by means of comprehensive laboratory testing and
mathematical and computer analyses, In the case of prestressed structures post-
construction in-situ measurements can be used as a basis for adjusting the stresses in
the tendons, thereby ensuring 'that the structure conforms with the design.
This chapter focuses on reviewing some of the better known methods WI •ch can be
applied to predict creep strains, generally at the intermediate level, without the need
for creep tests.

44
3.2 Creep Prediction Methods
3.2.1 General structure of methods
A total of seven different creep prediction methods are included in this investigation
and reviewed below. These are the:
• British Stanc'ards Institution - Structural Use of Concrete, BS 8110 - Part 2 -
(1985)
" American Concrete Institute (ACI) Committee 209 (1992)
• Standards Association of Australia - Australian Standard for Concrete Structures -
AS 3600 (1988)
• Comite Euro-International Du Beton - Federation Intemationale De La
Precontrainte (CEB-FIP) Model Code (1970)
• CEB-FIP Model Code (1978)
• CEB-FIP Model Code (1990)
• International Union of Testing and Research Laboratories for Materials and
Structures (RILEM) Model B3 (1995)
With the exception of the RILEM Model B3 (199,)), the above models derive from
structural design codes of practice and express creep strain as the product of the
elastic deformation of the concrete (at the time of loading) and the creep coefficient.
45
The creep coefficient accounts for the effect of one or more intrinsic and/or extrinsic
variables. The RILEM Model B3 (1995) is, by relative comparison, more complex
than the design code models and has a different structure as it enables the calculation
of separate compliance functions for the basic creep and drying creep (in excess of the
basic creep). Ali the methods employ one or more nomograms and/or algebraic
expressions to determine the creep strain. Table 3.1 shows which factors are
accounted for in each of the prediction models.
3.2.2 The BS 8110 (1985)method
The British Standard method (1985) is contained in BS 8110. This method was
earlier proposed by the British Concrete Society (1978) and is based on the CEB-FIP
(1970) recommendations and has been incorporated into the S.ABS 0100 (1992) code.
This method enables the estimation of final (30 year) creep strain (sec) using the
following equation:
(3.1)
where,
cr applied constant stress (MPa)
final creep coefficient
s, (t) elastic modulus of the concrete at tl'1t; time of loading (MPa)

Table 3.1 Summary of factors accounted for by different prediction methods
METIlOD
Intrinsic Factors Extrinsic Factors
,'f ~ ~ -e .. ?>
~ ) j ~ ! !l ~~ a ;a
~5 ~.§ .~
;a ~~ ~ g ~ p~ ~ I '" u j a ,il til '5 ..
~ u
§ ~i '0~j
-g ~ :0
~ u ~~ ."U
J;:;;,., ~~ ~ ~ ","5 5 "t .~u~
.~ 5j~ I ~~ ~H I~; ~ ~~j ~ ,~ ,~ " ~ _\l>g :::, ~ Ih ~l 9~ ue {j
8
BS 8110 (1985) X X X X X X x
IACI 209 (1992) X X X X X X X X X X X
AS 3600 (1988) X X X X X X X X
CEB - FIP (1970) X X X X X X X X X X
CEB - FIP (1978) X x x x x x x X
CEB - FIP (1990) X X X X X X X X X
-i-
RILEM MODEL B3 (1995) X X x I X x x x xx I x I x I x x x x x x x
i
47
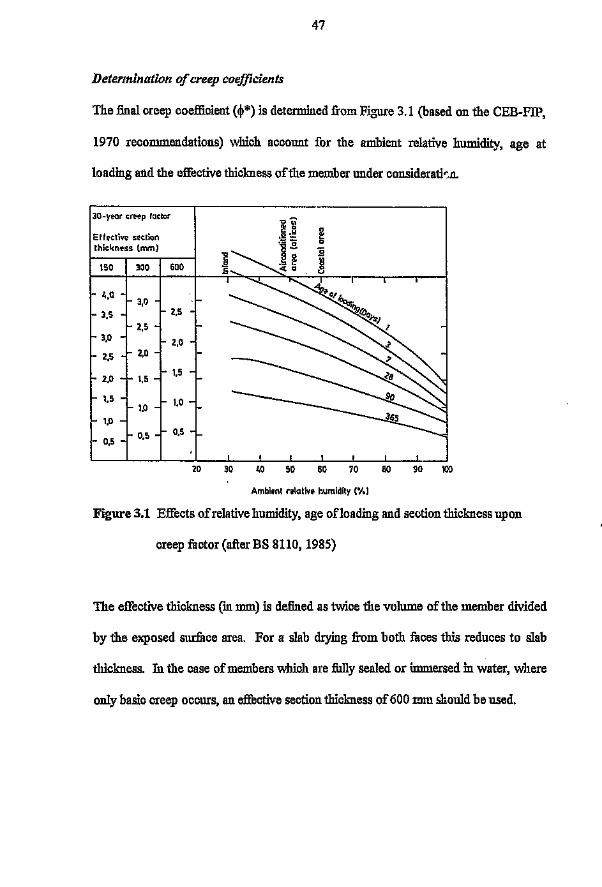
Determination of creep coefficients
The final creep coefficient (~*) is determined from Figure 3.1 (based on the CEB-FIP,
1970 recommendations) which account for the ambient relative humidity, age at
loading and the effective thickness of the member under consideration.
30 -yecr creep foetor
Ef I~ctive section sathickness (mm)
150 300 600
~,O3,0
3.5 2,5
2,53,0 2,0
2,5 2,0
2.0 1,5 -1,5
1,5 I,D1.0
1.0
D,S D,SD,S
20 30 ~O 50 60 70 80 90 100
Ambient relative humidity ('/0)
Figure 3,1 Effects of relative htunidity, age ofloading and section thickness upon
creep factor (after BS 8110, 1985)
The effective thickness (in mm) is defined as twice the volume of the member divided
by the exposed surface area. For a slab drying from both faces this reduces to slab
thickness. In the case of members which are fully sealed or immersed inwater, where
only basic creep occurs, an effective section thickness of 600 mm should be used.
48
Determination of elastic modulus
Acce-ding to the BS 8110 (1985) method, the elastic modulus at the time of loading
Ec(t) is derived from the following two empirical expressions:
Ec(t):::::Ee28[O,4+0,6 feu(t)], _ feu(28) (3.2)
EC,28 :::::Ko +o.zr; (28) (3.3)
where,
Ec,28 static clastic modulus of elasticity at 28 days for normal weight
concrete. This value is adjusted for lightweight concrete
fcu(t) compressive strength of the concrete at time t
fcu(28) = 28 day cube strength of the concrete in MPa
Ko constant dependent on the stiffness of the aggregate and may be
taken as 20 GPa for normal weight concrete.
MOdifications by Davis and Alexander
Research conducted by Davis and Alexander (1992), on the influence of South
African aggregate types on creep has led to a refinement of the BS 8110 (1985)
method for certain aggregate types. These modifications entail:
• the application of a Relative Creep Coefficient for certain aggregate types, and

49
• the establishment of an expression for the determination of elastic modulus, which
takes the aggregate type into account.
The Relative Creep Coefficient, obtained from Figure 2.13, is multiplied by the creep
coefficient obtained from Figure 3.1 to obtain the final creep coefficient. 111is
modification allows for the effect of the stiffuess of the particular aggregate type on
the final creep coefficient and is justified by the fact that the BS 8110 (1985) method is
a simple predictive method and omits to account for a number of secondary variables
such as temperature, ewing conditions and w/c ratio (Davis and Alexander, 1992).
Tests conducted by Davis and Alexander (1992) to determine the elastic modulus (E)
of concrete made with different South Afi:ican aggregates have led to the
establishment of the following expression for estimating E.
E =Ko+ a£:" (3.4)
where,
E = static modulus of elasticity for the particular age of concrete
being considered inGPa
the cube strength in :MPa (generally the characteristic strength)
constant related to the stiffuess of the aggregate inGPaKo =

50
strength factor which is also related to the aggregate
characteristics, expressed in GPalMPa.
The values of Ko and ex have been determined for South African aggregates for
different ranges of concrete age, namely 3 to 28 days and 6 months or older, as shown
in Tables A.l and A.2.
Rate of creep strain development
The BS 8110 (1985) method states that 40%, 60% and 80% of the final creep may be
aS5.'Ul11edto develop during the first month, six months and 30 months of loading,
respectively. This, however, is only applicable when concrete is exposed to constant
conditions of relative humidity (Davis and Alexander, 1992).
3.2.3 TheACI 209(1992)method
The ACI Committee 209 (1992) method of creep prediction is identical to the ACI
209 (1978) method. According to this method, the creep strain at time t for a constant
stress 0'0 first applied at age 't is :
(3.5)

51
where, G> is a creep coefficient and E, is the elastic modulus at the time of loading,
which is obtained from the following expression developed by Pauw (1990):
(3.6)
where,
p the density of the concrete (kg/m")
the mean compressive strength at the time of
loading (MPa) based on the average uniaxial
compressive strength measured on cylinders.
The values ofEc('t') given by this equation are applicable for applied stresses up to 40
per cent of the mean compressive strength of the concrete at the time of'Ioading. This
method also includes an equation for the prediction of concrete compressive strength
at the time of loading which takes into account the cement type used and the method
of curing employed.
Calculation a/the creep coefficient
The following hyperbolic function represents the creep-time relationship:
(3.7)

52
where, 'C is the age of the concrete at first loading (in days); t is the age of the
concrete (in days); ~*('C) is the final creep eoefficient and is expressed as :
(3.8)
Yl to Y6, are empirical correction factors (or partial coefficients), which account for the
majority of parameters which ate likely to influence the magnitude of creep. These
factors include the age of concrete at the time of loading and the method of curing
(moisture 01' steam), variations in relative humidity ("{2), size and shape of the member
(Y3), slump of the fresh concrete (Y4), ratio offine aggregate to total aggregate by mass
(Y5) and au' content in the concrete (Y6). The equations used to ca1cnlate 11 to Y6 are
given below.
Yl := 1.25'C,0.118 for 'C> 7 days - for moist cured concrete (3.9)
or
Yl= 1.13t·o.o94 for 'C> 3 days - for steam cured concrete (3.10)
Y2 = 1.27 - 0.0067"- for'}.. > 40 where '}..= relative humidity (%) (3.11)
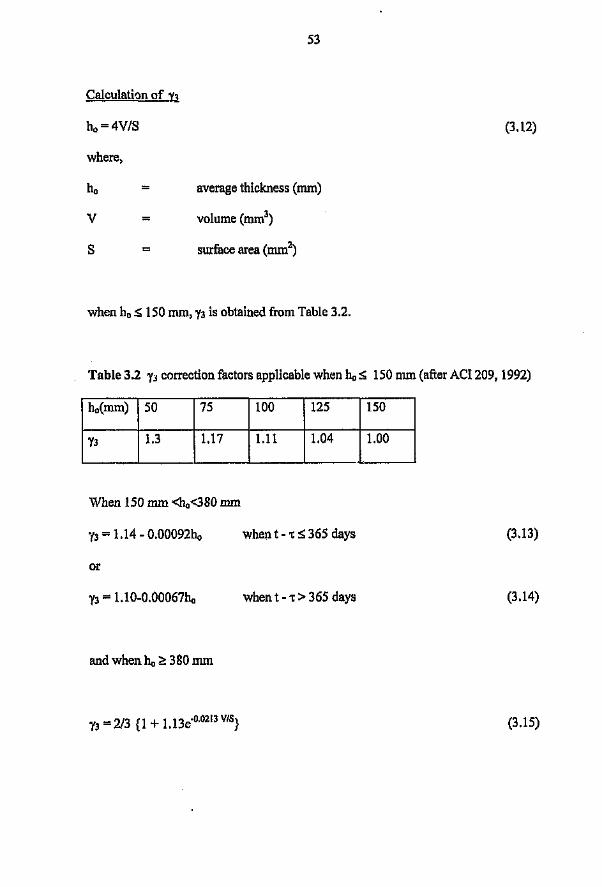
53
Calculati0n of "11
11o=4V/S (3.12)
where,
110
V
S
average thickness (mm)
volume (mnr')
surface area (mrrr')
when ho S; 150 mm, 'Y3 is obtained from Table 3.2.
Table 3.2 'YJ correction factors applicable when h, s 150 mm (after ACI 209, 1992)
ho(mm) 50 75 100 125 150
'Y3 1.3 1.17 1.11 1.04 1.00
When 150 rom <ho<380 rom
'Y3 = 1.14 - 0.00092ho when t - 't S 365 days (3.13)
or
'Y3 = 1.10-0.00067ho when t - 't > 365 days (3.14)
and when 110 ~ 380 mm
'Y3 = 2/3 {I + 1.13e"O.0213 VIS} (3.15)
54
Calculation of 'Y4..1Q__yQ
Y4 = 0.82 + 0.00264s (3.16)
(3.17)
(3.18)
Ys = 0.88 + 0.0024,1'
Y6 = 0.46 + 0.09a (but not less than 1.0)
where,
s slump of the fresh concrete (rom)
'" ratio of the fine aggregate to total aggregate by mass (%)
a air content (%)
3.2.4 The AS3600(1988)method
This method is intended to apply to structures with " characteristic compressive
strength at 28 days within the range of20 to 50 MPa.
The general expression for predicting creep strain at any time 8c (t) due to a sustained
stress 0'0 (in MPa) first applied at age 't (in days) is given by :
(3.19)
55
where, ~ is a creep coefficient and E, ('t) is the elastic modulus at the time ofloading,
which is obtained from the expression developed by Pauw (1990) which is given
below. This is the same equation that is used in the ACI 209 (1992) method for
estimating the value ofE.
(3.20)
where,
the density of the concrete (kg/nr')
the mean compressive strength at the time ofloading (MFa)
measured on cylinders.
The Australian Standard AS 3600 (1988) proposes the following mathematical
expression for predicting the creep coefficient (<I» at time t as a result of a sustained
stress first applied at age "C :
(3.21)
where,
~cc,b basic creep factor which is defined as the ratio of the ultimate
creep strain to elastic strain for a specimen loaded at 28 days

56
under a constant stress equal to 40 per cent of the compressive
strength (fc) of the concrete. This factor is obtained from the
Table 3.3 below.
creep factor coefficient (obtained from Figure 3.2) which depends
on the relative humidity, time after loading and the hypothetical
thickness (th). The hypothetical thickness (in rom) is equal to
twice the cross-sectional area of the member (in mm') divided by
the perimeter of the cross section exposed to drying (in rom).
maturity coefficient (obtained from Figure 3.3) which depends on
the age of the concrete at the time ofloading and is obtained from
the strength ratio fcm/fc(28), where fcmand fc(28) are the
compressive strength at the time ofloading and the compressive
strength at 28 days, respectively. These compressive strengths
are taken as the cylinder strengths.
Table 3.3 Basic creep factors (after AS 3600, 1988)
fc(MPa) 20 25 32 40 50
~cc.b 5.2 4.2 3.4 2.5 2.0
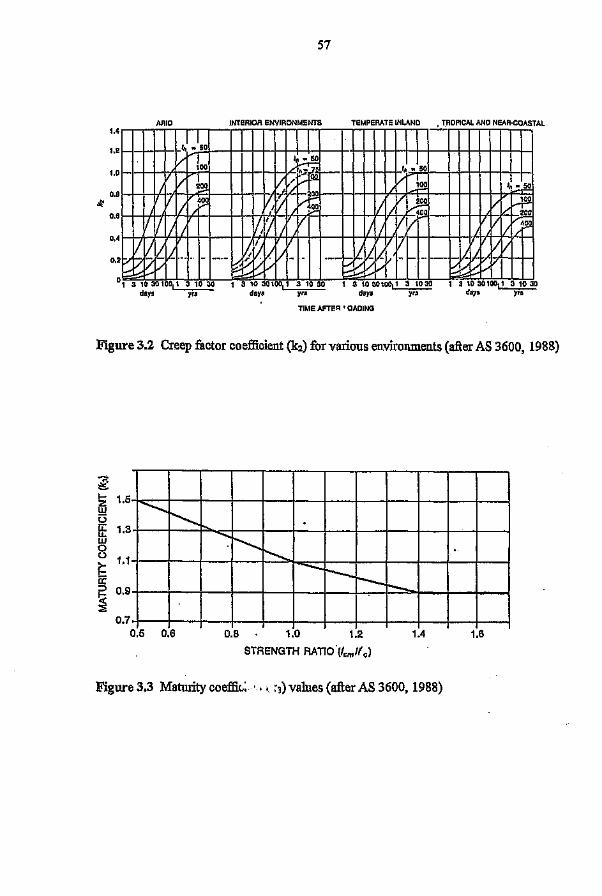
57
ARID INTERIOR ENVIRONMENTS TEMPERATE INLAND TROPICALAND NEAR·COASTAL1.4
1.2
1.0
O.B~
0.6
0.4
0.2
1.1"150
-
V 100I~ _,} )50f-l/ 5:--/ 100 100 n~/ '~(1: I,_::.,.§.!!I
f711 P ~r/ I~ 11/V~ [/1/ ~400 200
IIII II / I I, 'I / i7 II / !IV VII V'4J19/ /
[7 /1/~
17 JL II VV~b lL .~.. _ ..-..- VV -_._- V-lI-v .~,_... _. ._- _.IL 117- 1/ ~V ~v ~~ ~vVt::::L.,:: :_...V :.-'-':
01 3 10 30 100~ 1 3 10301001' 3 1030 1 3 10 30100~ 1 3 10 30100~- ~ - ~ ~ ~ - ~1'IME AFTF" ' OADING
Figure 3.2 Creep factor coefficient (k2) for various environments (after AS 3600, 1988)
gI- 1.5zUJt3u:: 1.3u,UJ0o 1.1~a::::l 0.9~::2
r=;r---.....f..,.-
"""" ~ r-;~ I-- r-- t--
0.70.5 0.6 O.B 1.0 1.2 1.4 1.6
STRENGTH RATIO (f,m/(,)
Figure 3.3 Maturity coeffic, ., :3) values (after AS 3600, 1988)

58
3.2.5 The CEB-FJP Model Code (1970)
This method was proposed in 1970 but has been superseded by the CEB-FIP (1978)
and CEB-FIP (1990) methods. According to Gilbert (1988), this model is still of
importance as it is included in many Australian building codes and has been shown to
be reasonably accurate (Hilsdorfand Muller, 1979).
The creep strain (8c) at time t, as a result of a constant sustained stress, 0'0 applied at
time 't' is predicted by applying the following equation:
(3.22)
Where Ec28 is the longitudinal modulus of deformation at 28 days (taken as the mean
value of the secant modulus) and is calculated, in MPa, using the following equation:
Ec28 = 5940 [fcU(28)]lJ2 (3.23)
Where icu(28) is the average compressive strength of the concrete at 28 days in MPa,
measured on cylinders.
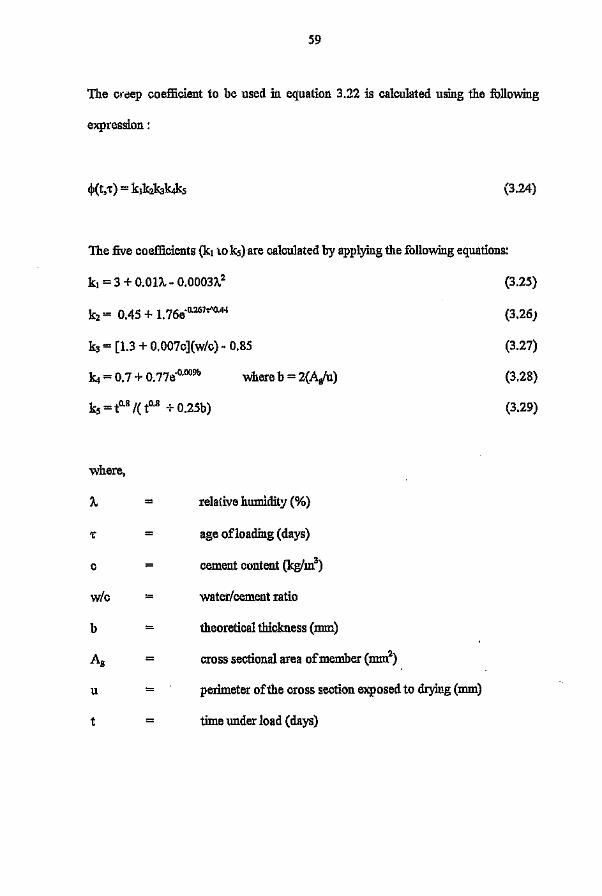
59
The creep coefficient to be used in equation 3.22 is calculated using the following
expression :
The five coefficien.ts (kJ to k5) are calculated by applying the following equation.s:
kJ = 3 + 0.01A, - 0.0003A,2
k2 = 0.45 + 1.76e-O.267t"O.44
k3 = [1.3 + 0.007c](w/c) - 0.85
k, = 0.7 + 0.77e-O.009b
k5 = to.8 I( to.s + 0.25b)
where b = 2(Aglu)
where,
A,
't
c =
wlc -
b
Ag
u
t
relative humidity (%)
age ofloading (days)
cement content (kg/nr')
water/cement ratio
theoretical thickness (rom)
cross sectional area of member (mnr')
perimeter of the cross section exposed to drying (mm)
time under load (days)
(3.24)
(3.25)
(3.26)
(3.27)
(3.28)
(3.29)

60
The validity of this method is restricted to normal quality concretes made with
portland cement whicn are subjected to a maximum working stress equal to 40 per
cent of their rupture stress as determined on cylinders.
3.2.6 The CEB-FIP Model Code (1978)
This method which is documented in the CEB ..FIP Model Code (1978) and concisely
summarised in Gilbert (1988), prescribes the same equation specified in the CEB-FIP
(1970) for the prediction of creep strain. This equation predicts the creep strain (so) at
time t, as a result of a constant sustained stress, 0'0 applied at time r, as follows.
(3.30)
Where E028 is the longitudinal modulus of deformation at 28 days (taken as the mean
value of the secant modulus) and is calculated, in :MFa, using the following equation:
Ec28 = 9500 [fcm]1/3 (3.31)
Where /ClII is the average compressive strength of the concrete at 28 days in :MFa,
measured on cylinders.

61
However, one of the differences between this method and the CEB-FIP (1970)
method is that this method enables the separate calculation of the reversible delayed
elastic strain and irreversible flow components of the creep coefficient at any age t
(including the final creep coefficient). The flow component is sub-divided into a
component representing flow during the first 24 hours under load (rapid initial flow)
and a subsequent flow component.
The creep coefficient, ~ (t.r), is estimated from the sum of the delayed elastic strain,
rapid initial flow and delayed flow components using the following equation.
~ (t.r) = ~d I3d(t - r) + 13.('t)+ ~f[l3f(t) -l3r('t)]
where,
t
=
I3d(t - r)
13.('t) =
~f =
(3.32)
=
age of specimen (in days) at which creep strain is required.
age of concrete at .first loading (in days)
the final delayed elastic creep coefficient which is taken as the
ratio of the final delayed elastic strain and the instantaneous strain
at 28 days which is equal to 0.4
describes the development of delayed elastic strain with time
rapid initial flow
flow coefficient

62
~f(t)
~f('r)
function describing the development of delayed flow with time
function to account for the age at application of'load (when t = 1:).
The equations used to calculate the creep components are as follows:
(3.3J)
[1:°.73"
~.(1:)=O.8 1- 073J5.27 +1: . (3.34)
<Pc = <PfI+<Pf2 (3.35)
where,
<PfI=.! [0.0002h3- 0.C43h 2 + 2.57h]- 2.2
9(3.36)
(3.37)
2Awhere h = 1._0
o u (3.38) .
and A. = 1+ 0.0004geo.1h when h::;;98 (3.39)
1.=30 whenh= 100 (3.40)
(t )X ( 1: )Xj3r(t)-~r('r)= -- ---
t+Hr 1:+Hf- for all values ofh, (3.41)
Alternatively, equation 3.42 by Gilbert (1988) may be used for more accurate results in
cases where 50 mm s h, ::;;1600 mm
(3.42)

63
where,
a. = 0.8+0.55e-0.003ho
!3 = 770+21 Oe-00043ho
(3.43)
(3.44)
age of concrete at first loading (days)
age of specimen (days)
h relative humidity (%)
notional thickness (mm)
humidity coefficient
cross-sectional area of member (mnr')
u perimeter exposed to drying (mm)
Hf constant depending on the notional thickness give in Table 3.4
Table 3.4 Values of Hr for various notional thicknesses (after CEB-FIP, 1978)
110 (mm) 50 100 200 400 800 1600
-Hr(days) 330 425 570 870 1500 2500
In cases where the ambient temperature during curing is significantly different from
20°C, the age of the concrete (t) to be used in equations 3.33 and 3.41 or 3.42 is
adjusted to an effective age (tc). This adjustment is dependent on the mean daily
temperature of the concrete and the type of cement used, as detailed below.
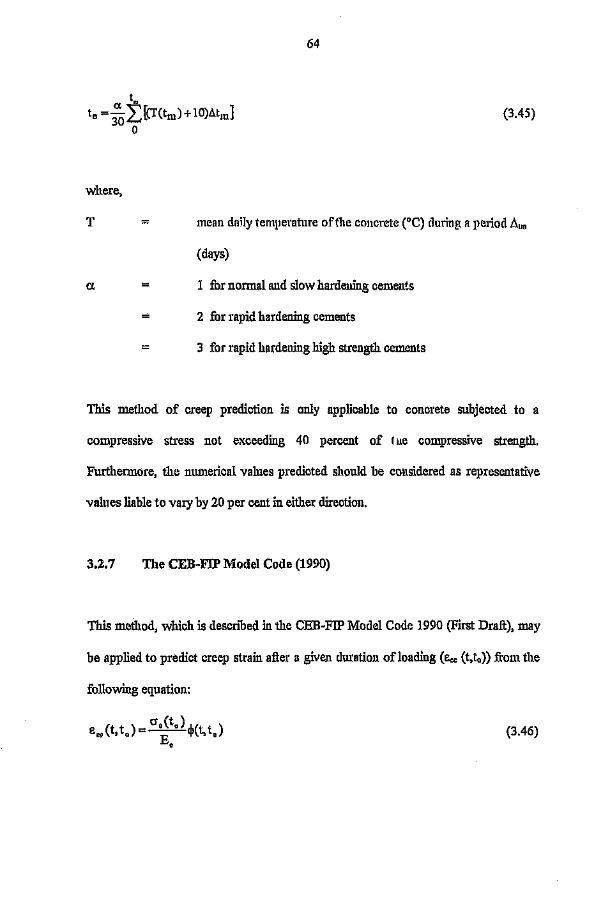
64
(3.45)
where,
T mean daily temperature of the concrete (OC)during a period illl11
(days)
1 for normal and slow hardening cements
2 for rapid hardening cements
3 for rapid hardening high strength cements
This method of creep prediction is only applicable to concrete subjected to a
compressive stress not exceeding 40 percent of t lle compressive strength.
Furthermore, the numerical values predicted should be considered as representative
values liable to vary by 20 per cent in either direction.
3.2.7 The CEB-FIPModelCode (1990)
This method, which is described in the CEB-FIP Model Code 1990 (First Draft), may
be applied to predict creep strain after a given duration ofloading (scc (t,to) from the
following equation:
(3.46)
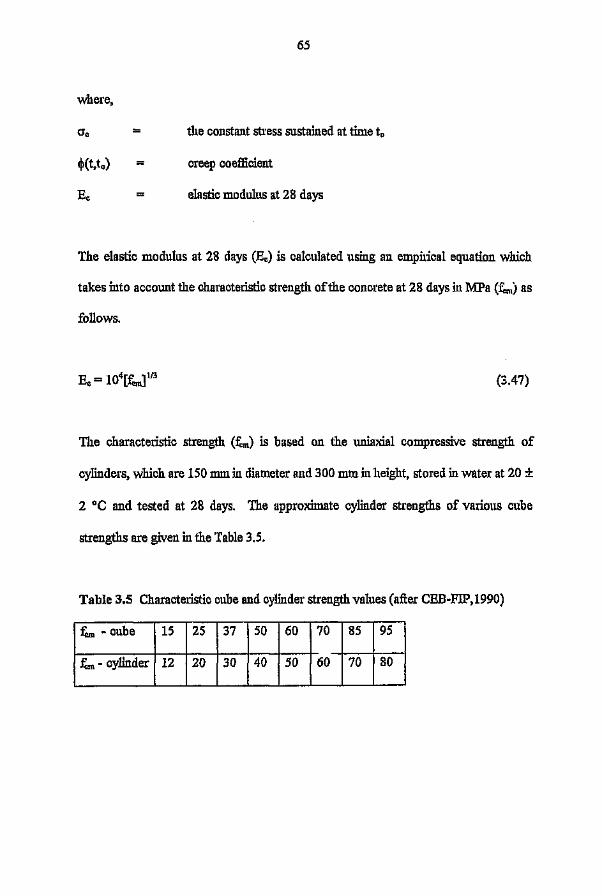
65
where,
~(t,to)
the constant stress sustained at time to
creep coefficient
elastic modulus at 28 days
The elastic modulus at 28 days (Ee) is calculated using an empirical equation which
takes into account the characteristic strength of the concrete at 28 days in lViPa (:f;,m) as
follows.
(3.47)
The characteristic strength (:f;,m) is based on the uniaxial compressive strength of
cylinders, which are 150 rom in diameter and 300 rom in height, stored in water at 20 ±
2 °C and tested at 28 days. The approximate cylinder strengths of various cube
strengths are given in the Table 3.5.
Table 3.5 Characteristic cube and cylinder strength values (after CEB-FIP,1990)
:f;,m - cube 15 25 37 50 60 70 85 95
km - cylinder 12 20 30 40 50 60 70 80
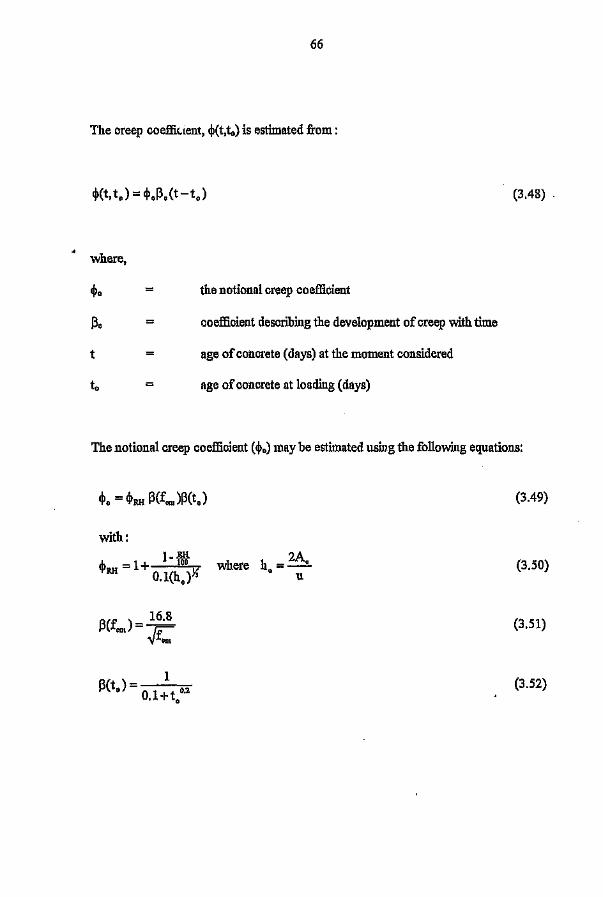
66
The creep coefficient, $(t,to) is estimated from:
$(t,tJ = $oP.(t-tJ (3.48)
where,
$0
~c =
t
to
the notional creep coefficient
coefficient describing the development of creep with time
age of concrete (days) at the moment considered
age of concrete at loading (days)
The notional creep coefficient ($0)may be estimated using the following equations:
(3.49)
with:1- RH
,h = 1+ 100'jIRH O.l(ho)X
where h = 2A.o u (3.50)
P(f )= 16.8em rr-
".JJ.''ttl(3.51)
1f3(to) = 0 1 t 0.2. + 0
(3.52)
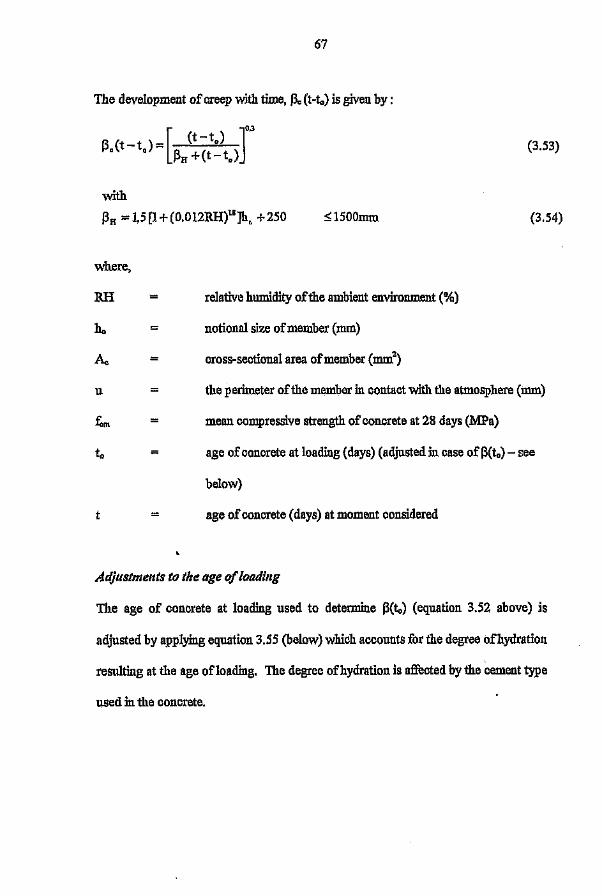
67
The development of creep with time, Pc (t-to) is given by :
(3.53)
withPH = 1,5 [1+ (0.012RH)18]h,. +250 :S;1500mm (3.54)
where,
RH
ho =
s;
11 =
£'m
to
relative humidity of the ambient environment (%)
notional size of member (rum)
cross-sectional area of member (mnr')
the perimeter of the member in contact with the atmosphere (rum)
mean compressive strength of concrete at 28 days (MPa)
age of concrete at loading (days) (adjusted in case of13(to) _. see
below)
t age of concrete (days) at moment considered
Adjustments to the age of loading
The age of concrete at loading used to determine 13(to) (equation 3.52 above) is
adjusted by applying equation 3.55 (below) which accounts for the degree of hydration
resulting at the age ofloading. The degree of hydration is affected by the cement type
used in the concrete.

68
to =to.T[ __ 9_+1)"2+tO•T1•2
to;::; 0.5
where,
ex -1 for slow hardening cements, SL;
o for normal or rapid hardening cements, N; R;
1 for rapid hardening high strength cements, RS;
(3.55)
or reduced temperatures on the maturity of the concrete
age of concrete at loading (days) adjusted to account for elevatedto,T
according to the equation 3.56.
n [( 4000 J]tT =Lexp - -13.65 ·~tl1=1 273 +T(~ti)
where,
temperature adjusted concrete age which replaces t in the
correspoading equations
temperature (0 C) during the time period ~ti
= number of days during which a temperature T prevails.
(3.56)
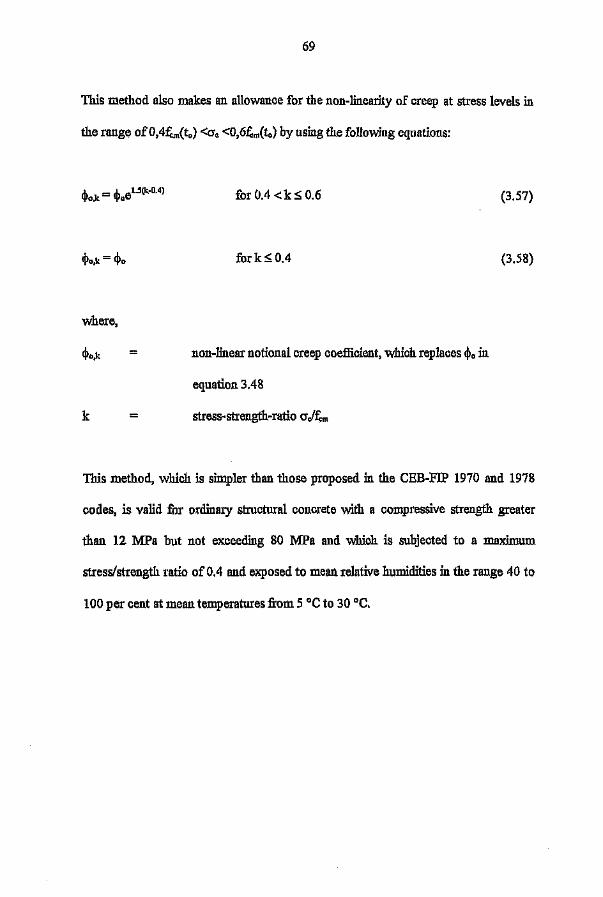
69
This method also makes an allowance for the non-linearity of creep at stress levels in
the range of O,4fc:n(to)<o, <O,6f.,m(to)by using the following equations:
'" == '" e1.5(k-O.4)'Vo,\< 'Vo for 0.4 <k s 0.6 (3.57)
<Po,\<== <Po fork50.4 (3.58)
where,
non-linear notional creep coefficient, which replaces <Poin
equation 3.48
k stress-strength-ratio crJf.,m
This method, which is simpler than those proposed in the CEB-FIP 1970 and 1978
codes, is valid for ordinary structural concrete with a compressive strength greater
than 12 MPa but not exceeding 80 MPa and which is subjected to a maximum
stress/strength ratio of 0.4 and exposed to mean relative humidities in the range 40 to
100 per cent at mean temperatures from 5 °C to 30°C,

70
3.2.8 TheRlLEMMadelB3(1995)
The creep and shrinkage prediction model for analysis and design of concrete
structures - model B3 ,1.995) has been published as a draft RlLEM Recommendation.
111ismodel is based on the work of'Bazant and Baweja (1994) and represents the third
major update of the models previously developed by Bazant and Pauu1a (1978 &
1979) and Bazant et al., (1991a & band 1992a, b and c) at North-Western University.
This model has been calibrated by a computerised data bank comprising data (about 15
000 points) obtained from different laboratories throughout the world and conforms
with the recently formulated RlLEM TC-I07 (1995) guidelines.
The equations included in this method are based on imperial units. These equations
have been converted to apply to 8I unit inputs in the description of this method below.
The main notations used in the expressions constituting this model are defined as
follows:
t time, representing the age of concrete in days
age at loading, in davs
age when drying begins, in days (only to ~ r is considered)

-------------------
CoCt;t)
CdCt, 't, to)=
h
Set)
'tsh
D
vis
c ==
w/c
w ==
alc ==
Pc -=
c
B(to)
71
compliance function for basic creep only in 10-6MPa-!
compliance function for additional creep due to drying in 10-6
MPa-!
shrinkage strain and ultimate (final) shrinkage strain, always
given in 10-6; Bsh considered negative (except for swelling, for
which the sign is positive)
relative humidity of the environment (expressed as a decimal
number, not as a percentage, 0:::; h::; 1)
time function for shrinkage
shrinkage half-time (in days)
2v/s = effective cross-section thickness in mm
volume-to-exposed surface ratio in rom
cement content of concrete in kg/nr'
ratio (by weight) of water to cementitious material
(w/c)c =water content of concrete in kg/nr'
ratio (by weight) of aggregate to cement
28-day standard cylinder compression strength in MPa (if only
design strength fckis known, then f c == fck+ 8,27 MPa)
stress applied in MPa
elastic modulus of concrete at age when drying begins (to), in
MPa
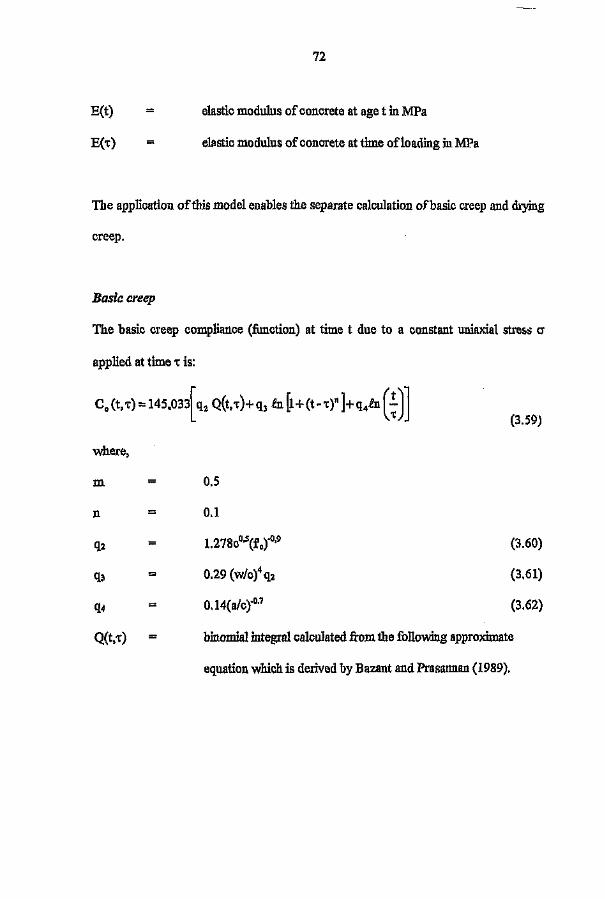
72
E(t)
E(1:)
elastic modulus of concrete at age t in :MPa
elastic modulus of concrete at time ofloading in MPa
The application of this model enables the separate calculation of basic creep and drying
creep.
Basic creep
The basic creep compliance (function) at time t due to a constant uniaxial stress c
applied at time 1:is:
Co (t,1:)::: 145.033[ qz Q(t, 1:)+ q3 £n ~ + (t _1:)n]+ q4£n (~)](3.59)
where,
m
n =
q2 =
q3 =
q4 -
Q(t,1:)
0.5
0.1
1.278co.5(£SO.9 (3.60)
0.29 (W/C)4q2 (3.61)
0.14{a/c)"o.7 (3.62)
binomial integral calculated from the following approximate
equation which is derived by Bazant and Prasannan (1989).

73
[ref)]-"r(,)
Q(t,'!) :::Qr(-r) 1+ (Qf(~»)Z(t, ~)
(3.63)
with
(3.64)
Z (t, r) :::(~rm 111[1+ (t - ~t] (3.65)
(3.66)
Drying creep
'The compliance fill•• don for additional creep due to <hying Cd(t,~,to) is given below.
This function is only applicable in situations where <hying commences prior to or at
the same time as the load application (r ;?; to).
(3,67)
inwhich
H(t) ::: 1 - (1 - h)S(t) (3.68)
and(3.69)
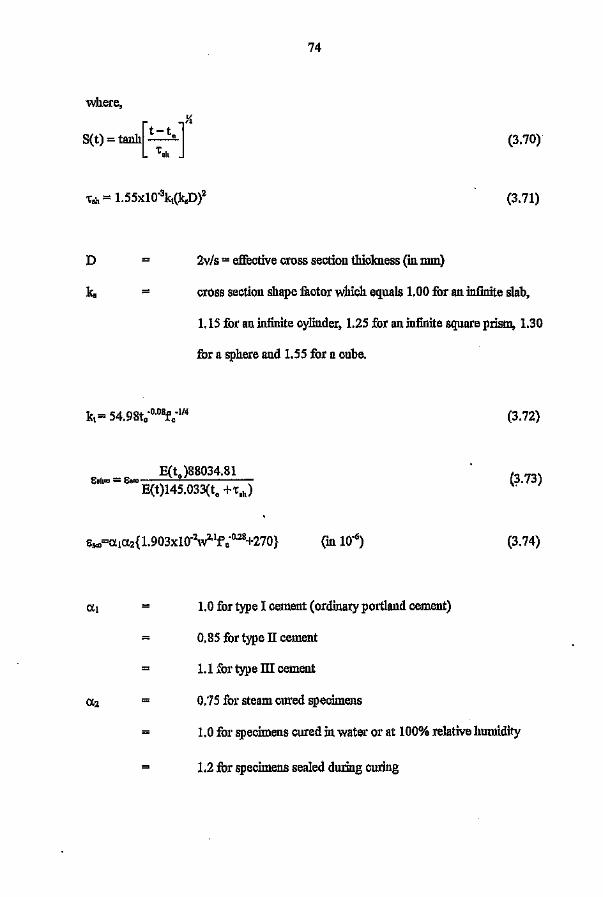
where,y.
Set) = tanh[t - to ]1:,h
D
=
74
(3.70)
(3.71)
2v/s = effective cross section thickness (in rum)
cross section shape factor which equals 1.00 for an infinite slab,
1.15 for an infinite cylinder, 1.25 for an infinite square prism, 1.30
for a sphere and l.55 for a cube.
(3.72)
E(to)88034.818.h",= 8,"'-----"-=-----E(t)145.033(to +1:,1.)
(~.73)
=
=
(3.74)
l.0 for type I cement (ordinary portland cement)
0.85 for type II cement
1.1 for type ill cement
0.'75 for steam cured specimens
1.0 for specimens cured. inwater 01' at 100% relative humidity
1.2 for specimens sealed during curing

75
E(t) == E(28)( t )J{4+0.85t
(3.75)
E(28) == 4733.Jf': (3.76)
Calculation of creep strain
Drying plus basic creep strain
Basic creep strain == [Co(t,t)]cr
(3.77)
(3.78)
Calculation of creep coefficient
The creep coefficients for basic plus drying creep ~hd and for basic creep only ~b are:
~hd == [Co(t.v) +Cu(t, r, to)JE(t)~b == [Co(t,t)]E(t)
(3.79)
(3.80)
Applicability of model
This model is intended for portland cement concretes for the following parameter
ranges:
17 MPa sr, ~70 MPa
160 kg/nr' ~c ~ 720 kg/m3
0.3 S w/c S 0.85
2.5 ~ alc ~ 13.5

76
3.3 Conclusions
The seven creep prediction models reviewed in this chapter are all empirically based
and vary with regards to their complexity and the number of factors that they account
for. Of these methods, the BS 8110 (1985) method prescribes .ne simplest procedure
and accounts for the least number of intrinsic and/or extrinsic variables. By contrast,
the RILEM Model B3 (1995) employs the most complex procedure and considers the
most variables. Furthermore, only the BS 8110 (1985) method directly accounts for
the stiffness of the aggregate.
With the exception of the RILEM Model B3 (1995), all the methods reviewed in this
chapter derive from structural design codes of practice and express creep strain as the
product of the elastic deformation of the concrete (at the time of loading) and the
creep coeffi.cient. The structure of the RILEM Model B3 differs from that of the
design code models as this model enables the calculation of separate compliance
functions for the basic creep and drying creep (in excess of the basic creep), which
may be added to obtain the total creep.
Chapter 6 assesses the accuracy of each of the seven models when applied to South
African conditions, by con p~1'i19 the values of the measured creep strains exhibited
by the specimens in this investigation against those predicted at the corresponding

77
ages by the different models. In this assessment, particular attention is given ',: the
influence of the aggregate stiffness on the predicted creep values.

78
CHAPTER 4
EXPERIMENTAL DETAILS
4.1 Introduction
This chapter gives details on the materials and equipment used as well as the
experimental techniques employed in this investigation. The material details
include the cement and aggregate types and their sources as well as the material
proportions comprising the different mixes. The experimental details include
descriptions on the preparation of the concrete samples and tests conducted on the
hardened concrete or on rock samples of the aggregates used in the concretes.
4.2 Materials
4.2.1 Cement
A single batch of CEM I 42,5 cement, complying with the SABS ENV 197-1
(1992) specification, was received from the Dudfield factory of Alpha Cement and
used for all the tests carried out in this investigation.

79
4.2.2 Aggregates
Three aggregate types from different Hippo Quarries sources in South Africa were
used in this investigation, These were quartzite fi:om the Ferro quarry ill Pretoria,
granite from the Jukskei quarry in Midrand and andesite from the Eikenhof quarry
in Johannesburg,
For each of the three aggregate types used, the coarse and fine aggregate were
from the same source. The coarse aggregate was 19 rum nominal size and the fine
aggregate was a crusher sand, The results of a grading analysis conducted on each
of the crusher sands are given in Figures B.1 to B.3 in the appendix These crusher
sands comply witll the grading requirements for .fine aggregate specified in SABS
1083 (1994), except in the case of the andesite where the dust content exceeds the
permissible value (ten per centjby approximately three pel' cent.
4.3 Laboratory Procedures
4.3.1 Mix proportions
The mixes were designed with the intention of investigating the following two
aspects of creep behaviour:
• the difference in the creep behaviour of concrete with varying w/c ratios, and

80
• the differences in the creep behaviour of concretes with the same wlc ratio but
different aggregate type.
Trial mixes were prepared to establish the water content which would yield a slump
of approximately 50 mm when using a wlc ratio of 0.4 and quartzite aggregate.
The quartzite aggregate was selected on the basis of its fineness modulus
coincidentally be-ing the average of the fineness modulus values of the three
different crusher sands. The water content decided upon was 195 11m3•
Thereafter, a total of six mixes were designed in accordance with the C & CI
method (formerly PCI method) which is described by Daly (199l). These
comprised two mixes with wlc ratios of 0.56 and 0.4., for each of the three
aggregate types included in the investigation. For each mix, a constant water
content of 195 lint was used. The wlc ratios of 0.56 and 0.4 were chosen to
respectively represent typical medium and high strength concretes used in practice.
Table 4.1 shows the mix proportions of the six mixes and the slump values
obtained for the concretes.
Table 4,1 Mix proportions and slump test results of the concrete used in this
investigation
Aggregate Type Quartzite Granite Andesite
Mix Number Q1 I Q2 G1 1 G2 Al I A2Water (11m3
) 195 195 195 195 195 195Cement (kg/rrr') 348 488 348 488 348 48819 mm Stone (kgJm3) 1015 1015 965 965 1135 1135Crusher Sand (kg/~3) 810 695 880 765 860 732W/CRatio 0.56 0.4 0.56 0.4 0.56 0.4NCRatio 5.24 3.50 5.30 3.55 5.73 3,83Slump (nun) 90 50 115 70 95 '55

81
4.3.2 Mixing procedure
Sufficient concr ..~eof each mix was prepared to fill three 101.6 x 101.6 x 700 mm
beam moulds and six 101.6 mm cube moulds. A 100 kg mixer was charged with
the materials in the order sand, cement, stone and water. The dry materials were
mixed and then water was added over a period of approximately one minute.
Thereafter, mixing was continued for a further three minutes. The slump tests
were carried out immediately after mixing.
4.3.3 Compaction
All the moulds were loosely filled with concrete and were hand held on a
mechanical vibrating table for approximately 10 seconds. Concrete was added to
the moulds which were then held on the vibrating table for a further 30 to 60
seconds, depending on the consistency of the mix.
4.3.4 Curing
The concrete filled moulds were covered with plastic sheets and the temperature in
the room was kept constant at 19 ± 1 °C for a period of approximately 20 hours.
Thereafter, the concrete was removed from the moulds and placed in a water bath.
The temperature of the water in the bath was maintained at 22 ± 1°C.

82
Approximately 20 days after casting, each concrete beam was accurately cut to
form three 101.6 x 101.6 x 200 mm prisms. The end faces of each prism were
ground in a high speed facing machine to ensure that they were parallel to each
other. Hence, nine prisms were obtained for each of the six mixes. The prisms
were then placed back into the curing bath.
4.3.5 Preparation of specimens
At approximately 21 days after casting, the prisms were removed from the curing
bath and Demec targets were glued onto two opposite formed sides of each prism,
on a vertical axis symmetrically about the middle of the specimen, to
accommodate a 100 mm Demec strain gauge. A quick-setting glue
(Schnellklebstoff X 60 Epoxy Glue) which adheres to wet concrete was used for
this purpose. After the glue had set (approximately 15 minutes after application)
the prisms were returned to the curing bath where they remained for a total of 28
days after casting.
4.4 Testing ofHardened Concrete
4.4.1 Compressive strength
The six cubes cast for each mix were tested in uniaxial coi.ipression in an Amsler
type 103 compression testing machine which has a capacity of 2 000 kN. Three
cubes were tested at seven days and three at 28 days after casting.
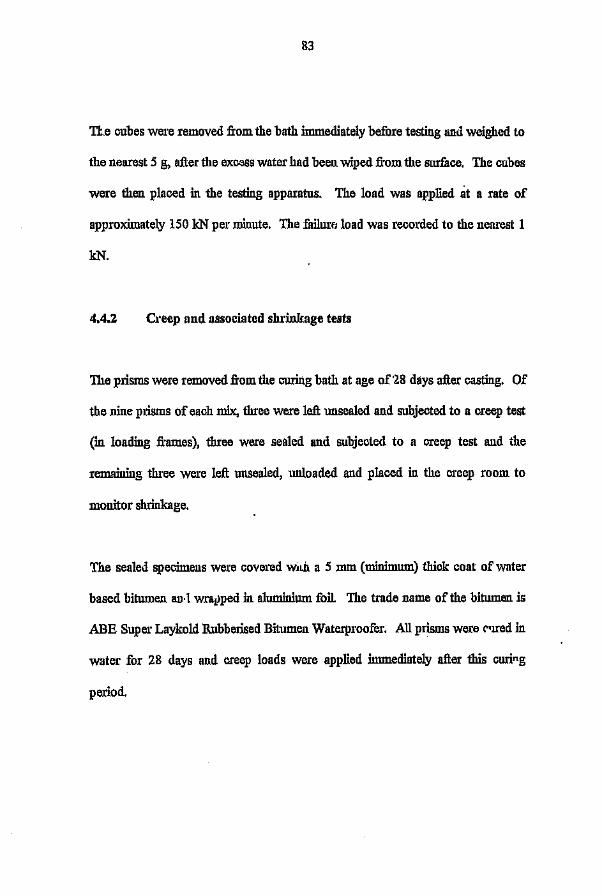
83
TIe cubes were removed from the bath immediately before testing and weighed to
the nearest 5 g, after the eXCI;JSSwater had been wiped from the surface. The cubes
were then placed in the testing apparatus. The load was applied at a rate of
approximately 150 kN per minute. The failure load was recorded to the n.earest 1
kN.
4.4.2 Creep and associated shrinkage tests
The prisms were removed from the curing bath at age of '28 days after casting. Of
the nine prisms of each mix, three were left unsealed and subjected to a creep test
(in loading frames), three were sealed and subjected to a creep test and the
remaining three were left unsealed, unloaded and placed in the creep room to
monitor shrinkage.
The sealed specimens were covered W1Lb. a 5 mm (minimum) thick coat of water
based bitumen an-I wrapped in aluminium foil. The trade name of the bitumen is
ABE Super Laykold Rubberised Bitumen Waterproofer, All prisms were clued in
water for 28 days and creep loads were applied immediately after this ewing
period.

84
Creep tests
Creep frames. These frames were developed by Ballirn (1983) and are based on
the ASTM C512·76 (1976) creep frame, except the load is applied by a hydraulic
:flat jack instead of a compressed spring. Figures 4.1 and 4.2 (overleaf) show
details of the creep frames, Each frame was loaded by pumping oil into the flat
jack by means of a hand pump. The load was maintained using a nitrogen pressure
accumulator and monitored using a proving ring and dial gauge arrangement. The
purpose of the dummy specimens at the top and bottom of the column was to
eliminate tile effects of end restraint from the loading plates on the specimens being
tested. By means of an ail' conditioner and humidifier, the temperature and relat' Ie
humidity in tile room in which the frames were house was kept between 23 ± 3 °C
and 65 ± 5°C, respectively.
Dummysample
Testsample
FlatJ .. ')I(
Figure 4.1 Schematic arrangement of the creep loading frame (after Ballim, 1983)
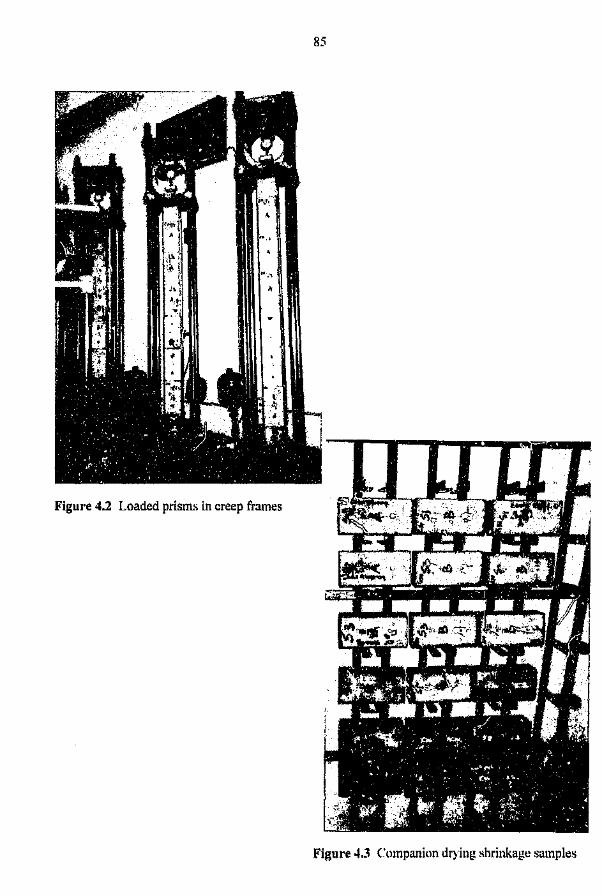
85
Figure 4.2 Loaded prisms in creep frames
Figure 4.3 Companion drying shrinkage samples

86
The six creep specimens (three sealed and three unsealed) of each mix were placed
in separate creep frames. The unsealed specimens were placed on top of the three
sealed specimens. The joints at the ends of the sealed specimens which were in
contact with other specimens were covered to prevent moisture loss, by means of
an adhesive tape which was placed around the prism perimeter at the joint.
Loading. The 28 day compressive strength tests (cube tests) were conducted
immediately before the frames were loaded. The prisms in each of the six creep
frames were subjected to a constant stress equal to 25 per cent of the 28 day
compressive strength of the relevant mix. Note that at higher stress levels of
above 40 to 50 per cent of short term strength, the creep mechanisms are different
as significant load - induced microcracking occurs (Alexander, 1994a). The
stresses were maintained to an accuracy of ± 0,5 MPa for a period of six months.
Specific details on the loading procedure are discussed in the section giving
information on the measurements (below).
Shrinkage tests
The shrinkage samples (three for each mix) were placed on a rack in the same
room as the creep samples and, in order to ensure a drying surface area equivalent
to the creep samples, the two 100 mm square ends were dipped in warm W" \ to
prevent drying from these surfaces. The rack, which is shown in Figur-, 4.3, is
designed to facilitate air movement around all the specimens and a minimum
distance of 10 mm between neighbouring specimens.
87
Measu rements
After the specimens were stacked in the creep frame, readings were taken during
the loading procedure described below:
fj The load corresponding to a stress/strength ratio of 25 pel' cent (a.) was
, applied in the frame, maintained for 60 seconds, and then unloaden;
• Thitty seconds later, a pre-load of approximately 1 MPa (os) was applied and
maintained for 60 seconds;
• The load was increased to 0'", maintained for 60 seconds and unloaded to O'b;
., Thitty seconds later a set of readings was taken (at O'b) and regarded as the
zero-strain readings;
• The load was increased to a. and a set of readings was taken within ten
minutes. These readings were taken as being the immediate elastic deflections
(ASTIr! C512-76, 1976).
After the above loading procedure, the total strains were determined daily for one
week, weekly until the end of one month, and approximately monthly thereafter.
The shrinkage strain or the unsealed (companion) specimens was measured on the
unloaded specimens which were exposed to the same environment as the loaded
specimens. The zero-strain readings of the shrinkage specimens was taken
immediately after the elastic strain readings of the creep specimens. Thereafter,
readings on the shrinkage specimens were taken at the same time as those taken on
the creep specimens.

88
At each measuring period, the strain of each prism was taken as the average of the
strains measured on the two oppcsi e faces of the prism. The strain of each group
of prisms, that is the three unsealed prisms or three sealed prisms or three
companion shrinkage prisms of a particular mix, was taken as the average of the
strains of the prisms in that group.
4.4.3 Determination of elastic moduli of the aggregates
Measurements of aggregate stiffness were carried out on boulders which were
collected from the area of each quarry where the aggregate, used in the concrete
specimens in this investigation, derived from. Therefore, the stiffness of each rock
type as determined on the boulders was taken to be representative of the stiffness
of the relevant aggregates used in the concrete specimens.
Two rock boulders were collected from each of the quartzite (Ferro) and andesite
(Eikenhof) quarries for the determination of the elastic modulus of the rock.
Since the appearance of the rocks observed in the Granite (Jukskei) quarry
appeared quite variable, two boulders of two different looking rocks occurring in
that quarry were collected lor testing.
Three cores measuring 42 mm in diameter and 82 mm long were cut from each set
of two boulders and these were tested, according to the procedure described in BS
1881 (1983), to determine the elastic modulus of the aggregates used in this
investigation. Two LVDT displacement gauges were attached diametrically

89
opposite each other on each core and strain measurements were taken over a
length of 50 mm. The cores were tested in the Amsler type 103 compression
testing machine which has a capacity of 2 000 kN. The load and axial
deformations of the specimens were autographically recorded by a Graphtech Data
Recorder on an XY plotter over ~ae cycle of loading and unloading. The Cores
were loaded to a maximum stress equal to approximately 25 per cent of the
average unconfined compression strength values determined for the relevant
aggregate types by Davis and Alexander (1992). Table 4.2 shows the average
unconfined compressive strength values determined by Davis and Alexander
(1992) and the maximum stresses exerted on the rock cores in this investigation.
Table 4.2 Average unconfined compressive strength values for the different
aggregate types and maximum stresses applied to the rock samples
Aggregate Unconfined Compressive Strength (UCS) Stresses Applied to Rock Samples Applied Stress asType (after Davis and Alexander. 1992) a Percentage of
Range Mean Core Stress Mean UCS(MPa) (MPa) Number (MPa)
Quartzite III 61.5 24.6(Ferro) 105·394 250 112 58.S 23.5
113 61.4 24.6
Granite lit 47.3 24.9(Jukskei) 112 48.6 25.6
1/3 47.5 25.070·310 190
2/1 47.4 24.9212 47.9 25.22/3 46.9 24.7
Andesite til 123.6 23.5(Eikenhof) 516·538 527 112 129.4 24.6,
..I..-. 113 t;\3.9 23.51
The results of all the tests conducted on the concrete specimens and on the rock
samples are presented and discussed in the following chapter.
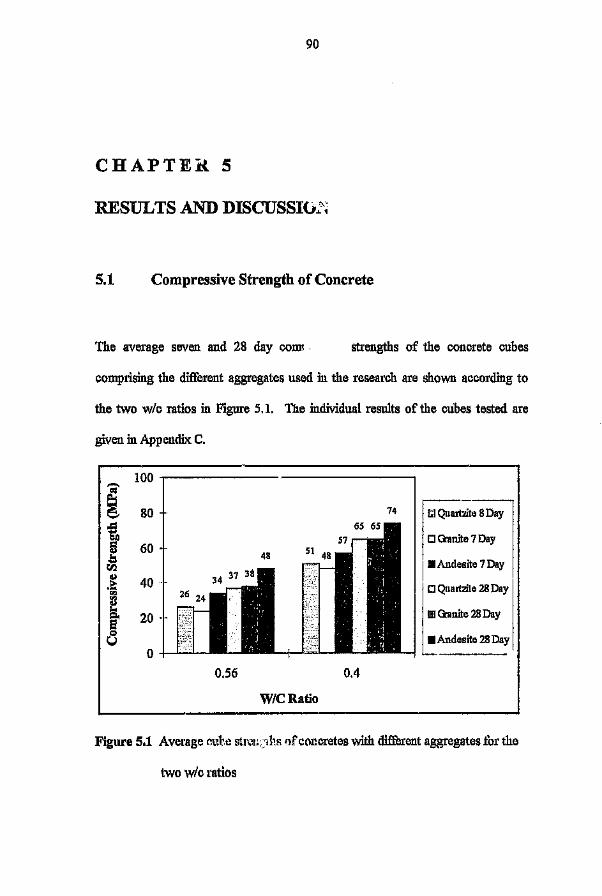
90
CHAPTEi{ 5
RESULTS AND DISCUSSI02~
5.1 Compressive Strength of Concrete
The average seven and 28 day com strengths of the concrete cubes
comprising the different aggregates used in the research are shown according to
the two w/c ratios in Figure 5.1. The individual results of the cubes tested are
given in Appendix C.
W/CRatio
100-~ 80 74 I:~ ..;>',o.ylilell Chnite7Day= 604.l.t:: I fIAndesite 7 DayCI.lQl
40.:=~ Quartzit 28 Day'"""<Iol
Ioc Ganite 28 DayS' 20
8 Andesite 28 Da!0
0.56 0.4
Figure 5.1 Average l)uh~stl\)); .b; of concretes with different aggregates tor the
two w/c ratios
91
It is clear from the figure above that the trend is for the andesite aggregate to yield
relatively high strengths. Furthermore, the strengths of the quartzite and granite
are generally of similar magnitude. This confirms that aggregates have a definite
influence on the compressive strength of concrete. This was also noted by
Hannant (1968), Ballim (1983) and Davis and Alexander (1992).
5.2 Measured and Inferred Strains
5.2.1 Measured strains
The strains measured on the laboratory specimens at the time periods mentioned in
paragraph 4.4.2, for each of the six mixes (Ql, Q2, Gl, G2, Al and A2) , together
with the temperature and relative humidity values are presented in Tables D.l to
D.6 in the appendix. These strains comprise the shrinkage strains exhibited by the
unloaded companion specimens and the total strains of the loaded sealed and
unsealed specimens.
5.2.2 Inferred strains
No provision was made in this project for the '. easurement of the actual
autogenous shrinkage strains of the sealed samples. Therefore, the autogenous
shrinkage strains were inferred from the test results of one of tl.e mixes used in a
research project conducted by Alexander (1994b). These rp'x1ts are presented in
92
Figure 2.3 and mix 2.1 was selected as the reference mix because it comprised
ope as well as a water content of 190 11m3which is of similar magnitude to that
used for all the mixes in this research (195 11m3). In addition, the cement content,
wlc ratio and ale ratio of Alexander's reference mix are of a similar magnitude to
the corresponding mix proportions of the three low strength mixes (Ql, G1 and
AI) in this project. The abovementioned similarities are evident from a
comparison of the mix proportions given in Tables 2.1 and 4.1.
For each of the six mixes included in this project, the autogenous shrinkage strains,
corresponding to the times at which total strains and drying shrinkage strains were
measured, were calculated by considering the alc ratio of the mix relative to the alc
ratio of Alexander's reference mix (by mass) which was 5.12. The premise was
adopted that if the alc ratio of a mix being considered (from this project) is higher
than 5.12 then the expected autogenous shrinkage at any age should be relatively
lower than that of Alexander's reference mix at the same age. This premise is
based on the fact that autogenous shrinkage occurs in the paste and should increase
with an increase in cement content relative to the aggregate content, for a constant
water content. The inferred autogenous shrinkage values were calculated using the
equations below (which assume a linear relationship) and are shown in Table E.l in
the appendix.
F = 5.12/(a/c) (5.1)

93
esho (t) = F x eshR (t) (5.2)
where,
alc
Factor accounting for the relative difference between the alc
ratios of Alexander's reference mix (5.12) and the mix being
considered
aggregate cement ratio of mix considered
Autogenous shrinkage strain of Alexander's reference mix at
time t (t = 0, 10, 30, 100 or 200 days), determined from
Figure 2.3
Autogenous shrinkage strain of the mix under consideration
at time t.
F
eshR
esh.
The autogenous shrinkage strains corresponding to the times at which total strains
and drying shrinkage strains were measured in this project were determined by
linearly interpolating between the esh. values at times t = 0, 10, 30, 100 or 200
days.
The cumulative autogenous shrinkage strains with time inferred for the mixes with
a wlc ratio 0[0.56 (Q1, Gl, AI) and for the mixes with a w/c ratio ofOA (Q2, G2,
A2) are shown in Figures 5.2 and 5.3.

----------------~~-
94
600",CO' 5006~= 0QJ"';~~ 4001:i.S-< co:: 300QJ .b>00~ c:.>c:: bIl 200=~S .S= r- 100u-=00
00
-El- Quartzite (QI)
h..r'------------------j-A-Granite(GI)--Q- Andesite (AI)
20 40 60 80 100 120 140 160 180
Time (Days)
Figure 5.2 Cumulative autogenous shrinkage strain versus time for mixes with a
w/c ratio of 0.56
600
100-El-Quartzite (QI)
h!ill'- ----I-A-Granite(GI)
-0- Andesite (AI)
500
400
300
200
o 20 40 60 80 100 120 140 160 180Time (Days)
Figure 5.3 Cumulative autogenous shrinkage strain versus time for mixes with a
w/c ratio ofOA
95
As the shrinkages in Figures 5.2 and 5.3 were inferred on the basis of their ale
ratio, they cannot be used to assess the actual effect of the aggregate type on
autogenous shrinkage. These figure- indicate the following intended trends:
• the low wlc ratio mixes (0.4) have higher shrinkage values than the high wlc
ratio mixes (0.56) as the former contain more cement, and
o in the case of the mixes of each of the wlc ratios, the higher the ale ratio, the
lower the autogenous shrinkage strain.
5.3 Calculation of Creep Strains and Creep-Time Functions
For each of the six mixes included in this project, the measured strains were used
to calculate the total creep strains (sum of basic plus drying), specific total creep,
total creep coefficients, basic creep strains, specific basic creep and basic creep
coefficients, pertaining to the times at which measurements were taken, which are
presented in Tables 5.1 to 5.3.
The average cumulative total creep (8e (tot) (t)) and basic creep (s, (bas) (t)) strains
were calculated from equations 5.3 and 5.4 (below), respectively. The specific
creep (Cs) and creep coefficient ($) values were calculated by applying equations
2.3 and 2.4, respectively.

Table 5.1 Results of creep measurements on quartzite-aggregate concretes
Mix No. Q1 Q2Applied 9.25MPa 16.30 MFaStress
Total Creep (sum of basic and drying) Basic Creep Total Creep (sum of basic and drying) Basic Creep
Average Specific Creep Average Specific Creep Average Specific Creep Average Specific CreepAge Cumulative Creep Coefficient Cumulative Creep Coefficient Cumulative Creep Coefficient Cumulative Creep Coefficient
(Days) Strain (xlOE-61 (Creep Strain (x10E-61 (Creep Strain ( IOE-61 (Creep Strain (x10E-61 (Creep(x10E-6) MFa) Factor) (xl0E-6) MFa) Factor) (xlOE 6) MFa) Factor) (x10E-6) MFa) Factor)
1 61 6.620 0.161 85 9.234 0.252 91 5.605 0.185 85 5.194 0.1822 III 12.036 0.293 73 7.937 0.217 125 7.654 0.252 78 4.773 0.1673 128 13.841 0.337 38 4.124 0.113 155 9.533 0.314 88 5.376 0.1884 175 18.957 0.461 7 0.721 0.020 186 1l.411 0.376 56 3.418 0.1205 178 19.258 0.469 22 2432 0.066 203 12.436 0.409 51 3.106 0.1096 186 20.160 0.491 27 2.941 0.080 205 12.606 0.415 63 :1.880 0.1367 223 24.072 0.586 21 2.245 0.061 242 14.826 0.488 65 3.971 0.13914 320 34.604 0.842 23 2533 0.069 353 21.656 0.713 51 3.113 0.10921 392 42.427 1.033 85 9.243 0.252 414 25.413 0.837 113 6.916 0.24228 423 45.737 1.113 94 10.128 0.276 437 26.779 0.882 133 8.157 0.28556 576 62.286 1.516 185 20.022 0.546 562 34.463 1.135 224 13.762 0.481
112 715 77.332 1.882 246 26.541 0.724 662 40.610 1.337 254 15.554 0.544140 757 81.845 1.992 304 32.888 0.897 709 43.513 1.433 302 18.543 0.649168 799 86.359 2.102 307 33.218 0.9061 745 45.733 1.506 298 18.287 0.640

Table 5.2 Results of creep measurements on granite-aggregate concretes
Mix No. G1 G2Applied 9.42MPa 16.30MPaStress
Total Creep (sum of basic and drying) Basic Creep Total Creep (sum of basic and drying) Basic Creep
Average Specific Creep Average Specific Creep Average Specific Creep Average Specific CreepI Age Cumulative Creep Coefficieut Cumulative Creep Coefficient Cumulative Creep Coefficient Cumulative Creep Coefficient(Days) Strain (xl0E-61 (Creep Strain (xIOE-61 (Creep Strain (xIOE-61 (Creep Strain exlOE-61 (Creep
(xl0E-6) MPa) Factor) (xl0E-6) MPa) Factor) (x10E-6) MPa) Factor) exIOE-6} MPa) Factor)
I 145 15.354 0.449 52 5.471 0.144 156 9.554 0.284 82 5.031 0.1412 178 18.900 0.553 40 4.197 0.111 214 13.140 0.391 78 4.785 0.1343 200 21.263 0.622 41 4.400 0.116 256 15.701 0.467 93 5.706 0.1604 239 25.400 0.743 71 7.558 0.199 273 16.726 '0.'198 117 7.178 0.2025 245 25.991 0.760 45 4.807 0.127 298 18.263 0.543 93 5.705 0.1606 275 29.241 0.855 42 4.420 0.117 320 19.629 0.584 93 5.7C6 0.1607 289 30.718 0.899 38 4.032 0.106 345 21.166 0.630 83 5.092 0.14314 376 39.878 1.167 69 7.376 0.195 437 26.801 0.79'1 118 7.239 0.20321 429 45.492 1.331 123 13.079 0.345 506 31.070 0.924 191 11.718 0.32928 479 50.810 1.486 156 16.607 0.438 554 33.972 1.010 215 13.190 0.371::>6 576 61.152 1.789 226 23.958 0.632 665 40.803 1.214 318 19.509 0.548112 696 73.857 . 2.161 340 36.079 0.952 793 48.657 1.447 397 24.356 0.684140 737 78.239 2290 379 40.244 1.062 835 51.219 1.523 412 25.276 0.710163 760 80.653 2359 389 41.265 1.089 846 51.902 1.544 422 25.890 0.728

Table 5.3 Results of creep measurements on andesite-aggregate concretes
M"lXNo. Al A2Applied 12.00MPa 18.47MPaStress
Total Creep (sum of basic and drying) Basic Creep Total Creep (sum of basic and drying) Basic Creep
Average Specific Creep Average Specific Creep Average Specific Creep Average Specific CreepAge Cumulative Creep Coefficient Cumulative Creep Coefficient Cumulative Creep Coefficient Cumulative Creep Coefficient
(Days) Strain (xlOE-61 (Creep Strain (xlOE-61 (Creep Strain (xlOE-61 (Creep Strain (xl0E-61 (Creep(xIOE-6) MPa) Factor) (xIOE-6) MPa) Factor) (xl0E-6) MPa) Factor) (xIOE-6) MPa) Factor)
1 120 9.965 0.390 25 2.088 0.072 131 7.093 0.291 69 3.750 0.1532 164 13.676 0.535 47 3.954 0.136 173 9.354 0.384 98 5.295 0.2163 175 14.604 0.571 39 3.269 0.112 176 9.505 0.390 81 4.375 0.1784 209 17.388 0.680 39 3.281 0.113 212 11.464 0.471 90 4.865 0.1985 225 18.779 0.734 42 3.524 0.121 228 12.368 0.508 90 4.848 0.1986 231 19.243 0.752 42 3.535 0.122 242 13.121 0.539 89 4.832 0.1977 256 21.331 0.834 56 4.706 0.162 273 14.779 0.607 93 5.021 0.20514 370 30.840 1.205 93 7.747 0.266 401 21.711 0.891 138 7.452 0.30421 448 37.335 1.459 134 11.147 0.383 482 26.081 1.070 183 9.915 0.40428 526 43.829 1.713 162 13.471 0.463 551 29.848 1.225 206 11.173 0.45656 693 57.746 2257 269 22.442 0.772 718 38.890 1.596 321 17.402 0.710112 846 70.503 2756 402 33.468 1.151 866 46.877 1.924 406 21.991 0.897140 882 73.518 2874 479 39.919 1.373 921 49.891 2.048 458 24.791 1.011168 924 76.997 3.010 495 41.268 1.419 955 51.699 2.122 462 25.029 1.020
1.000
99
Co (tot) (t) = c(t) - Ce - cshd (t) (5.3)
CO(bas)(t) = c(t) - ce - cshn (t) (5.4)
where,
Ce (101) (t)
Co(bas)(t)
c(t)
Csha (t) =
total creep strain at any time t
basic creep strain at any time t
total concrete strain at any time t
average instantaneous elastic strain recorded immediately
after loading
cumulative drying shrinkage strain at any time t (recorded
on the companion specimens)
autogenous shrinkage strain at any time t (inferred as
described in paragraph 5.2.2)
cshd (t)
5.4 Drying Shrinkage Strains
A detailed discussion of shrinkage strains is beyond the scope of this research.
However, as the shrinkage strain magnitudes were used in the calculation of the
creep strains in this research, it uppears relevant to comment on the shrinkage
exhibited by the companion samples. The average cumulative drying shrinkage
strain with time measured on the companion specimens of mixes with a WIC ratio of
0.56 (Ql, Gl , AI) and those measured on the specimens with a w/c ratio of 0.4
100
(Q2, G2, A2) are shown in Figures 5.4 and 5.5, which are plotted to the same
scale. The negative shrinkage values which were recorded for the Gl specimens
within the first two days of drying (shown in Table D.3 in the appendix) are not
included in Figure 5.4.
With reference to Figures 5.4 and 5.5, it is evident that, for each aggregate type,
the specimens with the higher w/c ratio (0.56) exhibited less drying shrinkage than
those with the lower w/c ratio (0.4). In addition, it was noted that the difference
between the shrinkage of the two strength grades of each aggregate type appears
to reduce with time and the rate of shrinkage of all the mixes decreases with time.
These trends are in agreement with the findings of Alexander (I 993b).
The decrease in cumulative shrinkage at an age of 168 days (after loading), which
is most pronounced for the quartzite concretes, is probably attributable to the
increase in both relative humidity and temperature (see Tables D.l to D,6) which
resulted from a temporary breakdown of the air conditioner during the week in
which those shrinkage strains were recorded.
Furthermore, the concretes containing quartzite aggregate displayed less shrinkage
than both the granite and andesite concretes, for both w/c ratios. The specimens
containing granite generally exhibited less shrinkage than those containing andesite
in the case of the high w/c ratio, but more shrinkage than the andesite in the
comparison of specimens with the lower w/c ratio.

500
101
-0- Quartzite (Mix Q1)~~~~--------------------------~-A- Granite (G1)_._ Andesite (AI)
o 100 140 16020 80 12040 60
Time of Drying (Days)
Figure 5.4 Cumulative drying shrinkage strain versus time of drying for
500
shrinkage specimens with a w/c ratio of 0.56
180
t-..I~[j --l-O-Quartzite (Mix Q2)-A- Granite (G2)___ Andesite (G2)
o 16080 120 14020 40 10060
Time of Drying (Days)
Figure 5.5 Cumulative drying shrinkage strain versus time of drying for
shrinkage specimens with a w/c ratio of 0.4
180

102
Extensive shrinkage tests carried out by Davis and Alexander (1992) on concretes
with aggregates from the same sources as those used in this project showed the
relative shrinkage of the concrete containing granite to be higher than that of
concrete containing quartzite but lower than andesite concrete. This order of
relative shrinkages with the use of different aggregates is indicated in Figure 5.4.
Nevertheless, according to Davis and Alexan.der (1992), the relative shrinkages are
merely intended for general gui-'ance as the shrinkage of concretes containing
aggregates from a particular source can vary.
5.5 Creep
5.5.1 Correlation of total creep with E of aggregate
The measured elastic moduli, ranges and averages for each of the three aggregate
types (determined in this research) are shown in Table 5.4. This table also includes
the ranges and average values determined by Davis and Alexander (1992) for the
same aggregates from the same sources.
For the purposes of comparing the influence of aggregate alone on specific total
creep, the specific total creep values at 168 days (six months) after loading were
modified to account for the different w/c ratios.
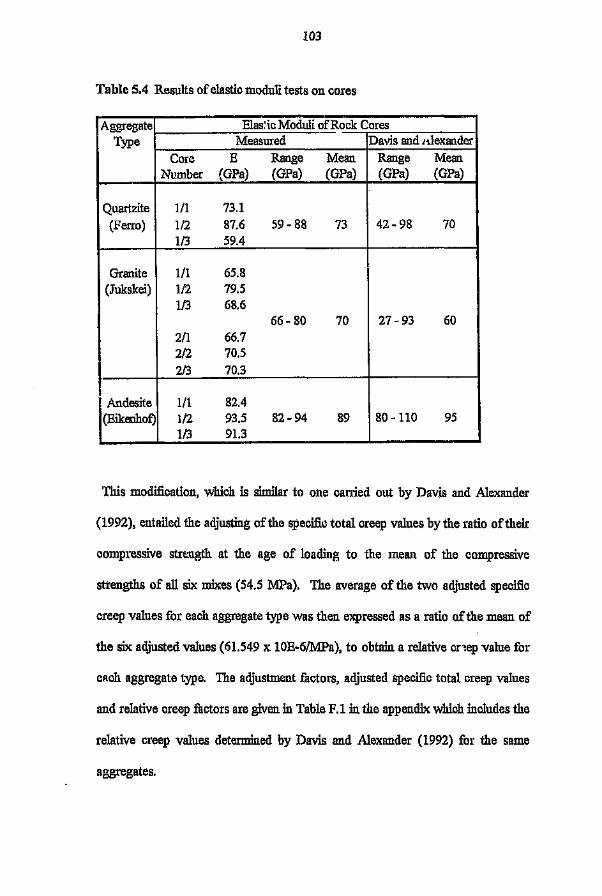
103
Table 5.4 Results of elastic moduli tests on cores
Aggregate Elastic Moduli of Rock CoresType Measured Davis and l1.lexander
Con) E Range Mean Range MeanNumber (GPa) (GPa) (GPa) (GPa) (GPa)
Quartzite 1/1 73.1(Ferro) 1/2 87.6 59 - 88 73 42 - 98 70
1/3 59.4
Granite 1/1 65.8(Jukskei) 1/2 79.5
1/3 68.666 - 80 70 27 - 93 60
2/1 66.72/2 70.52/3 70.3
Andesite 1/1 82.4(Eikenhof) 1/2 93.5 82 - 94 89 80 -110 95
1/3 91.3
This modification, which is similar to one carried out by Davis and Alexander
(1992), entailed the adjusting of the specific total creep values by the ratio of their
compressive strength at the age of loading to the mean of the compressive
strengths of all six mixes (54.5 MFa). The average of the two adjusted specific
creep values for each aggregate type was then expressed as a ratio of the mean of
the six adjusted values (61.549 x IOE-6IMPa), to obtain a relative cr iep value for
each aggregate type. The adjustment factors, adjusted specific total creep values
and relative creep factors are given in Table F.I in the appendix which includes the
relative creep values determined by Davis and Alexander (1992) for the same
aggregates.

104
Figure 5.6 shows a correlation ofthe relative creep with average elastic modulus of
the aggregate using the specific total creep results from this research and from the
work by Davis and Alexander (1992). The letters Q,G and A denote quartzite,
granite and andesite concretes, respectively. The results in Figure 5.6 indicate
significant variations in the stiffness of aggregates from a particular source.
Furthermore, the higher the average elastic modulus of an aggregate, the more the
relative creep of the concrete. The regression equations and correlation
coefficients applicable to the values from this research and from Davis and
Alexander's (1992) research, when considered separately and together, are given in
Table 5.5.
1.4
1.3
1.2
00., 1.1eu.,.~..~
0.9
0.8
0.7
I·Mensured• Dnvis and Alexander
~A/'
=:-/Q'
~,/'
~ \,,</oe
-'l? 1--.
:G:
50 60 70 80 10090
Average Modulus of Elasticity of Aggregate (Gl'n)
Figure 5.6 Relationship between relative creep and elastic modulus of aggregates

105
Table 5.5 Statistics pertaining to the correlation of relative creep to average
modulus of elasticity of aggregates
Line Data Regression rSource Equation
A Measured y = O.OlOx+ 0.229 0.941B Davis and Alexander y = 0.012x + 0.052 0.973
Combined y = 0.012x + 0.092 0.965
The correlations in Figure 5.6 show an opposite trend to those established by
Rusch et al., (1962) and The Concrete Society (1974) (see Figure 2.11) which
indicate that the higher the elastic modulus of the aggregate, the greater the
restraint offered by the aggregate to the creep of the paste. However, t.he work of
the abovementioned researchers shows creep of concrete to be relatively insensitive
to aggregate stiffness in the case of aggregates with a modulus of elasticity in
excess of approximately 70 GPa. Therefore, the correlations shown in Figure 5.6
do not disprove the trends which were established by other researchers on the basis
of an aggregate stiffuess range greater than that used in this research.
From the above, it is concluded that some other property of the aggregate, rather
than stiffuess, has a more significant effect on creep.
5.5.2 Total creep strains
Since the stress:strength ratio for all the mixes was constant (25 per cent), creep in
this case should be independent ofw/c ratio and applied stress if the differences in
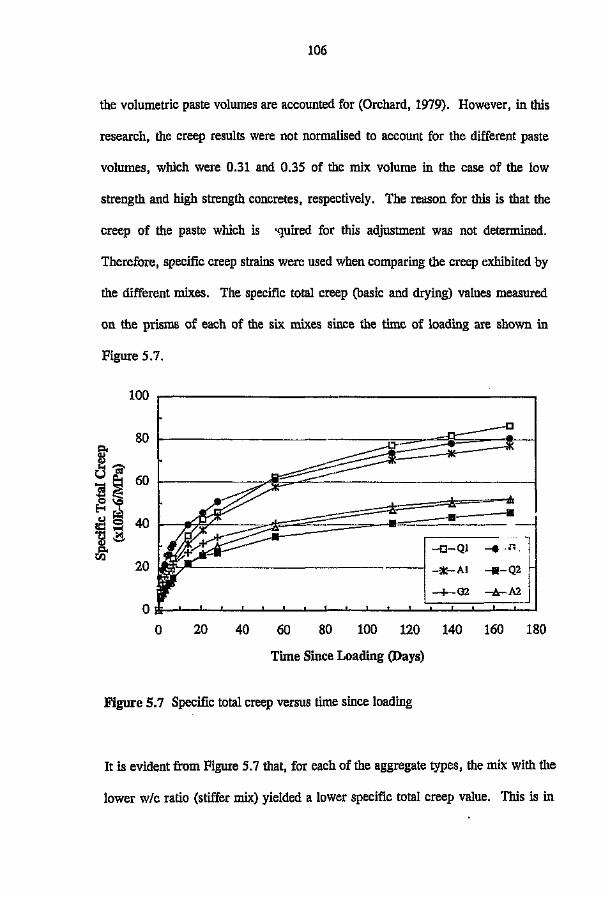
106
the volumetric paste volumes are accounted for (Orchard, 1979). However, in this
research, the creep results were not normalised to account for the different paste
volumes, which were 0.31 and 0.35 of the mix volume in the case of the low
strength and high strength concretes, respectively. The reason for this is that the
creep of the paste which is -quired for this adjustment was not determined.
Therefore, specific creep strains were used when comparing the creep exhibited by
the different mixes. The specific total creep (basic and drying) values measured
on the prisms of each of the six mixes since the time of loading are shown in
Figure 5.7.
100
80CI.CIJQ)
""''t?
~~60
0\0~I
c.Jr.l 40sS1rl-tJ,Cl.t:r.l 20
00 20 40 60 80 100 120 140 160 180
Time Since Loading (Days)
Figure 5.7 Specific total creep versus time since loading
It is evident from Figure 5.7 that, for each of the aggregate types, the mix with the
lower w/e ratio (stiffer mix) yielded a lower specific total creep value. This is in

107
accordance with the findings of Reutz (1965), Ballim (1983), Smadi et al., (1987),
Addis (1992) and Fiorato (1995).
The reason for the abovementioned trend is that the conr.ete with the higher
strength and stiffness has a relatively lower porosity of the hardened cement paste
matrix in comparison with the lower strength concrete (Muller and Kuttner, 1996).
Furthermore, the curves of the higher w/c ratio (0.56) mixes indicate that the order
of increasing specific total creep of concrete, for most of the test period, with the
use of the different aggregates, to be andesite, granite and quartzite. By relative
comparison, the positions of the specific total creep curves of the lower w/c ratio
(0.4) mixes differ in that the quartzite concretes yielded the lowest specific total
creep values. Hence, when considering the average elastic moduli values of the
three aggregate types, which are given in Table 5 4, it is evident that no
correlation exists between the specific total creep of the concrete and the stiffness
of the aggregate included in the concrete.
Research conducted by Davis and Alexander (1992) on creep of concretes with
various aggregates, including those used in this research, showed concrete creep
with the use of these aggregates to increase in the order granite, quartzite and
andesite. Referring to Figure 5.7, it is evident that the positions of the specific
total creep curve of the andesite concretes (in the case of the higher w/c ratio) and
the granite coi.cretes (in the lower w/c ratio) are in disagreement with the results
of Davis and Alexander (1992).

108
5.5.3 Basic creep strains
The specific b.sic creep of each of the six mixes since the time of loading are
shown in Figure 5.8.
45
40
105
Offi,~--~~~-~~--~~--~-~~~~~~-~~o 20 40 60 80 100 120 140 160 180
Time Since Loading (Days)
Figure 5.8 Specific basic creep versus time since loading
It is evident from Figure 5.8 that, for ea.ch of the aggregate types, the mix with the
lower w/c ratio yielded a lower specific basic creep value. This trend was also
observed in the specific total creep results (above). A comparison of the specific
basic. creep curves indicates the order (If increasing specific basic creep with the
use of different aggregates to be quartzite, andesite and granite in the case of both
w/c ratios. This trend indicates that, as was the case in the specific total creep
results, no correlation exists between the specific basic creep of concrete and the
stiffness of the aggregate included in the concrete. Furthermore, the relative
109
positions of the curves in Figure 5.8 differ from the findings of Davis and
Alexander (1992) which indicate the total creep with the use of these aggregates to
increase in the order granite, quartzite and andesite.
A comparison of the relative positions of the specific total creep and specific basic
creep curves for each of the w/c ratios (Figures 5.7 and 5.8), indicates only one
difference. This difference is the position of the quartzite curve in the higher w/c
ratio mixes which represent') the highest and lowest values in the case of the
specific total creep and specific basic creep, respectively. Note that the specific
basic creep values of the granite and andesite concretes of each w/c ratio are of a
similar magnitude.
It should be borne in mind that the measured specific basic creep values
incorporate the magnitude of the inferred autogenous shrinkage strain. The
autogenous shrinkage strains were inferred from data by Alexander (l994b),
pertaining to concrete containing only quartzite aggregates, which were of
magnitudes up to three times higher than anticipated (Alexander, 1998).
Therefore, the accuracy of the specific basic creep values in this research has not
been verified.
5.5.4 Comparison of total and basic creep
The specific total creep and specific basic creep strains of the six mixes exhibited
over the six month loading period are shown in Figures G.l to G.6 in the
appendix.

110
For each of the mixes, for the loading period considered, the specific basic creep
was expressed as a percentage of the specific total creep at each of the ages at
which measurements were taken. The average of these ratios for each mix are
given in Table 5.6.
Table 5.6 Average of specific basic creep to specific total creep ratios (expressed
as a percentage) for the six month loading period
Average Specific Basic/Total Creep (%)Mix Q1 I Mix Q2 T Mix G1 I Mix G2 I Mix Al I Mix A225.7 I 39.2 T 30.9 I 39.7 I 31.3 I 43.3
The average specific basic/specific total creep ratio given for mix Q1 in the table
above excludes the data pertaining to one day after loading, as the sealed samples
of this mix indicated the specific basic creep to exceed the specific total creep at
an age of one day after loading by approximately 39 per cent. This observation,
which contradicts the assumed fact that drying always enhances creep, is due to
swelling deformation of the sealed concrete. The swelling is due to the release of
surface tension of capillary water due to the change of vapour pressure above
water menisci in the capillaries (Kovler, 1996). This swelling usually takes place
if the concrete is subjected to drying prior to sealing.
From the data in Table 5.6 it appears that, for the concrete of each aggregate type,
the ratio of the average specific basic to total creep is larger in the case of the
lower w/c ratio mix. This indicates that the drying creep, Efd (t) in equation 2.2, is
less in the case of the lower w/c ratio mixes.

111
According to Muller and Kuttner (1996) this is due to the relatively lov, porosity
of the hardened cement paste of the high strength concrete, in comparison with the
low strength concrete, which affects (reduces) the diffusion properties of the
concrete. In addition, in the case of both w/c ratios, the drying creep of lh,.!
concretes comprising the three different aggregates increases in the order andesite,
granite and quartzite.
5.5.5 Correlation of secant modulus of concrete and creep strain
The relationship between the specific creep values at 168 days and secant modulus
of each concrete mix at the age of loading (28 days) is shown in Figure 5.9.
90.-----~------~----~------~----~----~80 -l---Q~~.- ~t ir--_--J-----Ir::::; }70 1-------;-, _--+I ~__ _+I __ ---'-Al L,--_ __
60 -1------+, ----+~----+------+!--+---___1J ! ..50 +----4-----~--------r-----I--'A""2:----+------I02 II: :
1 --I__,<>>L-__ I---_Q2..9+-- -I- +-_.~ _10l ~Ql A~
30 :------t-------"~~-t-----------r-----+----+-------i I c (
20 -I-----+-l-----02 +---+A2---+-------I Q2 I10 -1------+,------+-----
o~~~~i~~~~~~t'~~~~~~~~~25
40
------\-------- -
20 30 35 40 45 50
Secant Modulus of Concrete at 28 Days (GPa)
Figure 5.9 Relationship between specific creep at 168 days and secant modulus
of concrete at 28 days
112
With reference to Figu-e 5.9 ';t is evident that no correlation exists between the
secant moduli and the specific creep of any of the mixes used. Nevertheless, the
secant moduli used in Figure 5.9 are not accurate, as a difference of one division
on the Demec gauge (which is equal to 17 uiicro-stiain) could alter these values by
a difference ranging from 0.89 to 2.05 GPa.
5.6 Conclusions
5.6.1 Shrinkage strains
The results of this research indicate that, for each aggregate type, the specimens
with the higher wlc ratio (0.56) exhil ited less drying shrinkage than those with the
lower wlc ratio (0.4). Furthermore, no correlation was established between the
drying shrinkage magnitude and the stiffness of the included aggregate.
The autogenous shrinkage strain values used in this research were inferred from
data by Alexander (1994b). The accuracy of the inferred values was not
determined. Hence, further research is justified to establish the actual autogenous
shrinkage strain magnitudes for the mixes used in this project.
5.6.2 Effect of aggregatestiffnesson creep strain
At any age after loading, the specific basic creep values (for both wlc ratios) and
specific total creep values for the lower wlc ratio mixes, with the use of the
113
different aggregates included in this research, increase in the order quartzite,
andesite and granite. In the case of the specific total creep for the higher w/c
ratios, the values of the concretes made with different aggregates increase in the
order andesite, granite and quartzite. These results indicate that no correlation
exists between the creep of concrete and the stiffness of the aggregate included in
the concrete. Furthermore, the correlation between relative creep and aggregate
stiffness indicated that the creep of concrete increased with :. "easing stiffness of
the included aggregate. This trend is opposite to correlations established by Rusch
et al., (1962) and The Concrete Society (1974), on the basis of an aggregate
stiffness range greater than that used in this research. However, the
abovementioned relationships indicate the creep of concrete to be relatively
insensitive to aggregate stiffness in the case of aggregates with a modulus of
elasticity in excess of approximately 70 GPa.
The abovementioned conclusions appear to be attributable to the stress strain
behaviour of the aggregate/paste interfacial zone. Consideration of the behaviour
of the interfacial zone, which is dependent on bond strength and density of this
zone, is of significance and should not be overlooked by assuming that concrete is
a two phase material (Nilsen and Monteiro, (1993), Alexander, (1991), Alexander
and Davis (1992), Alexander (l993b) and Mindess and Alexander (1995».
Therefore, in this research the measured creep that was assumed to have taken
place in the paste may have included the magnitude of strains which occurred at
the interfacial zone. This important phenomenon was reiterated by Alexander
(1997). According to Alexander and Milne (1995), the size of the interfacial
114
region and perhaps the bonding of the aggregate to the matrix may be influenced
by the hydrophobic or hydrophilic nature of aggregates.
5.6.3 Comparison of results with those of Davis and Alexander (1992)
The relative magnitudes of concrete creep with the use of different aggregates,
obtained for the mixes in this research (see Section 5.6.2), are in disagreement
with the outcome of research conducted by Davis and Alexander (1992) on creep
of concretes with various aggregates, including those used in this research, which
shows concrete creep with the use of these aggregates to increase in the order
granite, quartzite and andesite. These disagreements appear to be mainly due to
the possible: inaccuracy of the findings of Davis and Alexander (1992), resulting
from a number of data adjustments, and to a lesser extent due to variations in the
properties of aggregates from the same source, as discussed below.
Adjustments to data used by Davis and Alexander (1992)
The creep data analysed by Davis and Alexander (1992) was applicable to
concretes with aggregates from 23 different sources which had different test
variables and hence a number of adjustments were made to the data before it could
be compared directly in order to establish the relative creep values. These
included:
• adjustments to account for different ages of loading, w/c ratios and cement
types

115
II extrapolation to obtain the creep at an age of five years after loading
• normalisation to account for effects due to differences in paste volumes
• adjustment of creep values such that their mean was equ=l to the value
predicted using the BS 8110 method at 5 years, assuming a c..mmon age of
first loading of one year
Il the relative creep of concretes of each aggregate type was determined relative
to the mean.
Variations ill aggregatesfrom the same source
Generically similar aggregates from different geographical regions, within South
Africa, and also within a particular quarry may vary in their mineralogical,
petrological and physical properties (Alexander, 1990).
5.6.4 Effect of secant modulus of concrete at age of loading 011 creep
For all the mixes considered, no correlation was established between the secant
modulus of the concrete at the age of loading (28 clays) and the specific creep
values at 168 days after loading.
116
CHAPTER 6
COMPARISON OF MEASURED AND PREDICTED
CREEP STRAINS
6.1 Introduction
The creep prediction methods reviewed in Chapter 3 were used to predict the
specific total creep (basic and drying creep) as well as the specific basic creep
strains, at the same ages at which measurements were taken (see Section 4.4.2),
for the concrete of each of the six mixes used in this investigation. The values of
the intrinsic and extrinsic factors pertaining to the test specimens and their
environment were used as the values for the relevant factors required as input by
the different prediction methods. The measured and predicted values are
compared and discussed in Section 6.4. These results are in turn compared with
the results of other research projects where experimental and predicted creep
values were compared, in Section 6.5.
The measured specific total creep and specific basic creep values recorded on the
concrete specimens of each of the six mixes since the time of loading are shown in
Tables 5.1 to 5.3 in Chapter 5.

117
The empirical factors as well as other variables used in each prediction method are
given in Tables H.l to H.18 in Appendix H. The measured and predicted total
creep coefficients and basic creep coefficients, for different times under load, for
each of the six mixes are given in Tables 1.1 to 1.6 in Appendix I. The measured
and predicted specific total creep and specific basic creep values, for the concrete
of each strength grade for each of the aggregate types investigated, are given in
Tables J.l to J.6 in Appendix J.
Specific creep values were used for comparative purposes and not creep
coefficient ($) values. The reason fer this is that the $ value and elastic modulus
(E) value are both considered in the calculation of the predicted creep in all the
design code models included in this investigation and the different models do not
81.1 prescribe the same equation for the estimation ofE.
6.2 Assumptions Made in Analysis
6.2.1 General assumptions
Absence of reinforcement
All the prediction methods used are applicable to plain (unreinforced) concrete. It
has however been shown that the creep in concrete members with symmetrically
distributed reinforcement is relatively less than that of identical unreinforced
members (Troxell et al., 1958 and Lambotte et al., 1983).
118
Elastic moduli values of concrete
With the exception of the RILEM Model B3 (1995), all the models reviewed in
Chapter 3 express creep strain as the product of the elastic deformation of the
concrete (usually at the time of loading) and the creep coefficient. Therefore, the
magnitude of the elastic modulus of the concrete has a significant influence on the
predicted creep values.
The elastic moduli used in the creep predictions were determined in accordance
with each method. It should be noted that the AS 3600 (1988) method also makes
provision for the use of an elastic modulus of the concrete determined by testing.
The BS 8110 (1985) method specifies the use of only characteristic strength as the
basis for determining elastic modulus. The CEB-FIP (1978) and CEB-FIP (1990)
methods make provision for the determination of the elastic moduli on the basis of
characteristic or act1'111concrete strength. In this investigation, the mean value of
the actual compressive strength of the concrete prisms of each mix, at 28 days,
was used for the prediction of elastic moduli.
With the exception of the BS 8110 (1995) method, all the creep prediction
methods included in this investigation prescribe that the 28 day compressive
strength of the concrete, used to calculate the elastic modulus (Ec), should be
determined on cylinders. Therefore, where the cylinder strengths were required,
the 28 day compressive strength values determined on 150 mm cubes were
reduced to their equivalent cylinder strengths in accordance with the conversions
given in Table 3.5, which derives from the CEB-FIP (1990) Model Code,

119
Relative humidity and temperature values
In the calculation of specific total creep, using methods that account for the
relative humidity of the ambient environment, variations in relative humidity were
ignored and a constant value of 65 per cent was assumed throughout. The reason
for this is that the relative humidity in the creep testing room was maintained at
65±5 per cent and was only recorded at times when readings were taken.
Therefore, it would be incorrect to assume that the relative humidity values that
were recorded when readings were taken prevailed during the periods between
readings. A relative humidity of 100 per cent was used in the basic creep
predictions. Where the actual temperature was required by a prediction method, a
temperature of 23°C was used.
6.2.2 Method specific assumptions
Assumptions and comments specific to each method used are discussed below.
BS 811 0 (1985)
The elastic moduli were determined using equation 3.4 and design values (Tables
A.1 and A.2) which were established by Davis and Alexander (1992).
The effective section thickness of the test specimens was 50 mm. Therefore, the
lowest section thickness of 150 mm was used when determining the creep
coefficient for total creep from Figure 3.1.
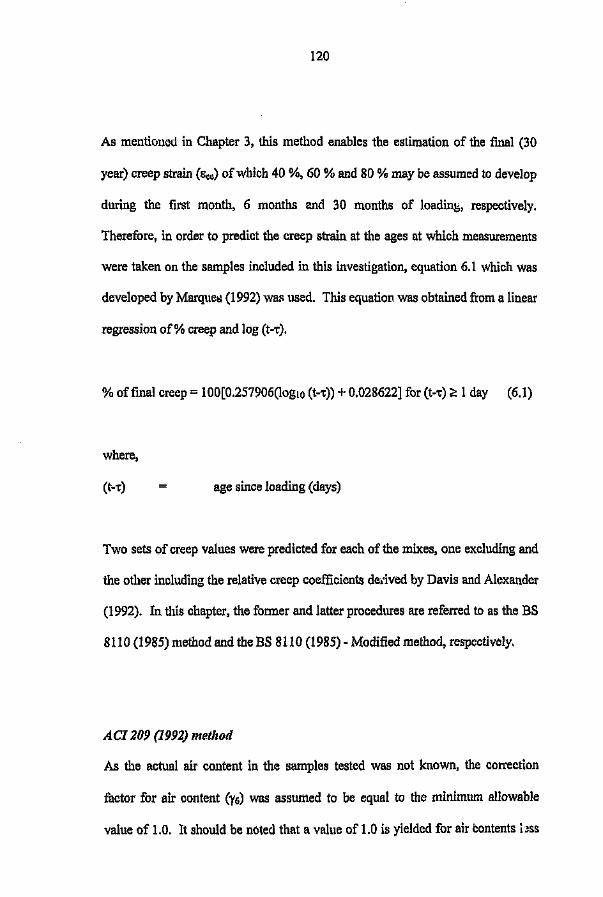
120
As mentioned in Chapter 3, this method enables the estimation of the final (30
year) creep strain (8ec) of which 40 %, 60 % and 80 % may be assumed to develop
during the first month, 6 months and 30 months of loading, respectively.
Therefore, in order to predict the creep strain at the ages at which measurements
were taken on the samples included in this investigation, equation 6.1 which was
developed by Marques (1992) was used. This equation was obtained from a linear
regression of% creep and log (t-r),
% of final creep = 100[0.2S7906(loglO (t-r) + 0.028622] for (t-r) ~ 1 day (6.1)
where,
(t-r) age since loading (days)
Two sets of creep values were predicted for each of the mixes, one excluding and
the other including the relative creep coefficients derived by Davis and Alexander
(1992). In this chapter, the former and latter procedures are referred to as the BS
8110 (1985) method and the BS 8110 (1985) - Modified method, respectively.
ACI209 (1992) method
As the actual air content in the samples tested was not known, the correction
factor for air content (r6) was assumed to be equal to the minimum allowable
value of 1.0. It should be noted that a value of 1.0 is yielded for air contents less

121
than eight per cent. In any event, these correction factors are normally not
excessive and in most cases tend to offset each other, they are therefore often
neglected for design purposes (ACI209, 1992).
AS 3600 (1988)
This method is intended to apply to structures with a characteristic compressive
strength at 28 days within the range of20 to 50 MPa. For this reason, this method
was only applied to predict creep strains for various ages after loading for the low
strength grade concretes of the aggregate types included in the investigation (i.e
mixes Q1, G1 and AI).
The basic creep factors were obtained by linearly interpolating between the values
given in Table 3.3. For the purposes of the basic creep predictions, the
hypothetical thickness (th) used for the determination of the creep factor
'coefficient (k2) was assumed to be the maximum of 400 mm.
CEB-FIP Model Code (1978)
The CEB-FIP (1978) method prescribes an adjustment tu the age at which die
prediction is made in cases where the curing temperature of the concrete is
significantly different from 20 "C, This adjustment was not implemented as the
concrete was cured at a temperature of22 ± 1 cC.
122
CEB-FIP Model Code (1990)
When calculating the notional creep coefficient (~o), the age of concrete at loading
(to) substituted into equation 3.52 to determine ~(to) was not adjusted to account
for the effect of elevated or reduced temperatures on the maturity of the concrete,
as the prevailing temperature was assumed constant for all the predictions.
Furthermore, the value of to was unaffected by the second possible adjustment
which accounts for the effect of cement type.
RILEM Model B3 (1995)
During the application of this method the cross-section shape factor (ks) for the
test prisms was taken to be that prescribed for an infinite square prism (1.25).
6.3 Statistical Techniques Employed
6.3.1 T-Test
The paired (two-tailed) t-Test was applied to paired data values to determine
whether the two samples are likely to have come from the same two underlying
populations that have the same mean (Moroney, 1984, Cohen, 1991 and Spiegel,
1992). Where applied, the null hypothesis was assumed (i.e. any observed
differences are due to fluctuations within the same population). The five percent
significance level was decided upon.
123
The probability calculated is associated with the Student's t-Test. The
significance levels established (P) indicate the probability that the magnitudes in
the paired readings arose by chance. Therefore, probability values exceeding five
per cent indicate that the discrepancies in the paired values are not significant. It
should be borne in mind that, in the statistical sense, the result 'not significant' is
not so much a complete acceptance of the null hypothesis but rather an outcome of
'significance of difference not established'.
6.3.2 Coefficient of variation of errors
The coefficient of variation of errors «(t)j) was initially defined in Part VI of Bazant
and Panula (1979) and subsequently used by Bazant et al., (1991a & band 1992a,
b & c), Bazant et al., (1993) and RILEM Model B3 (1995) to quantify the extent
to which predicted creep values at different ages after loading deviate from the
values measured at the relevant ages. The more accurate the prediction, the lower
the value of (OJ.
The coefficient of variation of errors ((OJ) was used to quantify the extent to which
predicted creep values at different ages after loading (determined by applying a
particular model) deviate from the values measured at the relevant ages on the
specimens of a particular concrete mix. This coefficient is expressed as a
percentage and is defined by the following equations:

124
(6.2)
in which
(6.3)
where,
coefficient of variation for data set j
the deviation (vertical) between the measured and predicted
value for data point i on data set j
the measured values (labelled by the subscript i) of specific
creep in the data set numbe .'j
n the total number of data PI'luts in the set
The overall coefficient of variation (roall) was used to estimate the average (pooled)
coefficient of variation of a number of independent coefficients of variation, as
follows:
(6.4)
where,
N the numbe: sets considered

125
6.4 Discussion of Results
6.4.1 Elastic moduli of concrete
All the creep prediction models applied in this investigation include an empirical
equation for the prediction of the elastic modulus of the concrete, which usually
takes the 28 day compressive strength of the concrete into account (see Chapter 3).
This equation is identical for the ACI 209 (1992) and AS 3600 (1988) methods
(Pauw, 1990). In the case of the RILEM Model B3 (1995), the predicted elastic
modulus is used in the calculation of the compliance function for additional creep
due to drying (CdCt,r, to)) and may be used to calculate the creep coefficient ($)
from the relevant compliance function, CoCt,r) or Cd(t, r, to) from equations 3.59
or 3.67, respectively. However, in the case of all the other creep prediction
models reviewed in Chapter 3, the predicted creep strain is directly dependent on
the value of predicted elastic modulus. Therefore, the predicted elastic modulus is
significant in the prediction of creep.
Figure 6.1 shows the elastic moduli predicted for each mix according to the
different creep prediction methods and the average measured elastic moduli of the
prisms of the six mixes (measured at 28 days after casting). The average of the
measured values was taken as the average of all the values measured on the sealed
and unsealed prisms of each mix.

126
iOMEASUREDI.CEB - FIP (1970)
~Rll..EM ModelB3 (1995)
o BS 8110 (1985) - modified ~ACI 209 (1992)
IIICEB - FIP (1978) !XlCEB - FIP (1990)
,-..
~ 40+------1 HI--------II------riOIl
-a 30"Ce~ 20CJ'.J:l~ 10~
oAl A2Ql G1 G2Q2
Mix No.
Figure 6.1 Measured and predicted elastic moduli values at 28 days after casting
The measured and predicted elastic moduli corresponding to the predicted values
are given in Table 6.1. The statistical parameters at the bottom of the table pertain
to the elastic moduli values of each mix (columns) and the t-Test results pertain to
paired comparison of the measured values and the predicted values determined by
each of the methods (rows).
It is evident from Table 6.1 that a relatively larger variance occurred in the values
predicted for the lower w/c ratio mixes (Q2, G2 and A2) in comparison with tl'e
higher w/c ratio mixes. Furthermore, in the case of both w/c ratio mixes, the
variance of the predicted elastic moduli with the use of different aggregates
increases in the order quartzite, granite and andesite.
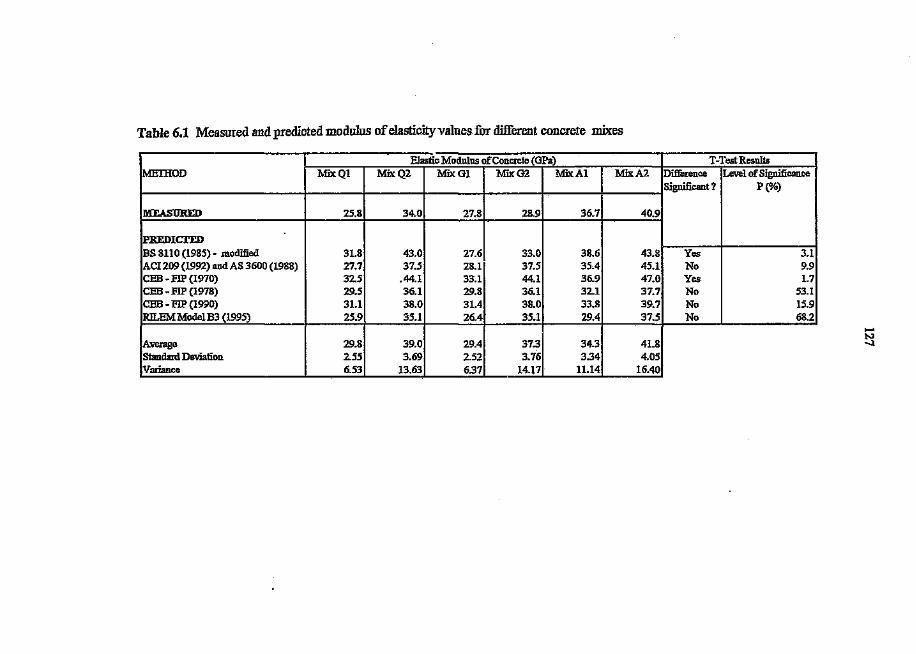
Table 6.1 Measured and predicted modulus of elasticityvalues for different concrete mixes
Elastic Modulus of Concrete (GPa) T-Test ResultsMETIIOD :MixQ1 MixQ2 MixG1 MixG2 Mix Al MixA2 Difference Level of Significance
Significant? P(%)
ME..4.SURED 25.8 34.0 27.8 28.9 36.7 40.9
PREDIcrEDBS 8110 (1985) - modified 31.8 43.0 27.6 33.0 38.6 43.8 Yes 3.1•ACI 209 (1992) and AS 3600 (1988) 27.7 37.5 28.1 37.5 35.4 45.1 No 9.9CEB - FIP (1970) 32.5 .44.1 33.1 44.1 36.9 47.0 Yes 1.7CEB - FIP (1978) 29.5 36.1 29.8 36.1 32.1 37.7 No 53.1CEB - FIP (1990) 31.1 38.0 31.4 38.0 33.8 39.7 No 15.9RILEMModelB3 (1995) 25.9 35.1 26.4 35.1 29.4 37.5 No 68.2
Average 29.8 39.0 29.4 37.3 34.3 41.8Standard Deviation 2.55 3.69 2.52 3.76 3.34 4.05Variance 6.53 13.63 6.37 14.17 11.14 16.40

128
According to the t-Test results shown in Table 6.1, the discrepancies between the
measured and predicted elastic moduli values, for the different mixes, were only
significant in the case of the BS 8J 10 (1985) - modified method (P = 3.1) and the
CEB-FIP (1970) method (P = 1.7). Figure 6.1 indicates the abovementioned
significant differences to be attributable to the general over-estimation of elastic
moduli values for each mix. The RILEM Model B3 (1995) yields the most
accurate predictions (P = 68.2).
6.4.2 Rapid initial flow
As mentioned in Section 3.2.6, the CEB-FIP (1978) method enables the separate
calculation of the reversible delayed elastic strain and irreversible flow
components of the creep coefficient at any age t. The flow component is sub-
divided into a component representing flow during the first 24 hours under load
(rapid initial flow, ~a('C) and a subsequent flow component.
- -The predicted and measured specific rapid initial flow creep values, for the six
mixes included it: the investigation, are given in Table 6.2. As the calculation of
~a('C) does not consider whether moisture exchange between the concrete and the
ambient environment is permitted, the measured value for each mix was taken as
the average of the values measured for all the specimens (sealed and unsealed) of
that mix.
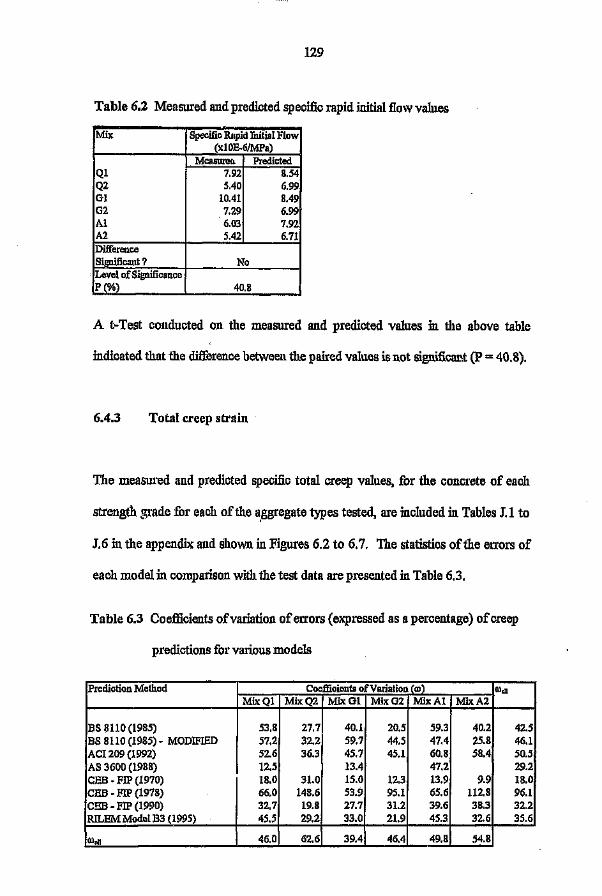
129
Table 6.2 Measured and predicted specific rapid initial flow values
Mix Specific Rapid Initial Flow(xlOE-6IMPa)
Mensurea PredictedQ1 7.92 8.54Q2 5.40 6.99G1 10.41 8.49G2 7.29 6.99Al 6.03 7.92A2 5.42 6.71DifferenceSignificant? NoLevel of SignificanceP(%) 40.8
A t-Test conducted on the measured and predicted values in the above table
indicated that the difference between the paired values is not significart (P = 40.8).
6.4.3 Total creep strain
The measured and predicted specific total creep values, for the concrete of each
strength grade for each of the a.ggl'egate types tested, are included in Tables J.I to
J.6 in the appendix and shown in Figures 6.2 to 6.7. The statistics of the errors of
each model in comparison with the test data are presented in Table 6.3.
Table 6.3 Coefficients of variation of'errors (expressed as a percentage) of creep
predictions for various models
Prediction Method Coefficients ofVaria!ion (00) mall
MixQl Mix Q2 IvIix G1 MixG2 Mix Al MixA2
BS SllO (1985) 53.8 27.7 40.1 20.5 59.3 40.2 42.5BS 8110 (1985) - MODIFIED 57.2 32.2 59.7 44.5 47.4 25.8 46.1ACI 209 (1992) 52.6 36.3 45.7 45.1 60.8 58.4 50.5AS 3600 (1988) 12.5 13.4 47.2 29.2CEB • FIP (1970) 18.0 31.0 15.0 12.3 13.9 9.9 18.0CEB - FIP (1978) 66.0 148.6 53.9 95.1 65.6 112.8 96.1CBB - FIP (1990) 32.7 19.8 27.7 31.2 39.6 38.3 32.2RILEM Model B3 (1995) 45.5 29.2 33.0 21.9 45.3 32.6 35.6
mnll 46.0 62.6 39.4 46.4 49.8 54.8

130
-0- MEASURED-A-BS 8110 (1985) - MODIFIED-+- AS 3600 (1988)-C-CEB-FIP (1978)-A-RlLEM Model 133(1995)
-B- BS 8110 (1985)~ ACI 209 (1992)-e-CEB-FIP (1970)-i-CEB-FIP (1990)
o 20 40 60 80 100 120 140 160 180Time Since Loading (Days)
Figure 6.2 Measured and predicted specific total creep versus time since loading
for mix Q1 specimens
o 20 40 60 80 100 120 140 160 180Time Since Loading (Days)
Figure 6.3 Measured and predicted specific total creep versus time since loading
for mix Q2 specimens

131
-0- MEASURED-.- BS 8110 (1985~ - MODIFIED-+- AS 3600 (1988-<r--CEB-FIP (197 )-I:t:- RILEM Model 133(1995)
-ll-BS 8110 (1985~~ ACI 209 (1992-----CEB-FIP (197 )--I-CEB-FIP (1990)
o 20 40 60 80 100 120 140 160 180Time Since Loading (Days)
Figure 6.4 Measured and predicted specific total creep versus time since loading
for mix Gl specimens
o 20 40 60 80 100 120 140 160 180Time Since Loading (Days)
Figure 6.5 Measured and predicted specific total creep versus time since loading
for mix G2 specimens

132
-0- MEASURED-It-BS 8110 (l985~ - MODIFIED-+-AS 3600 (1988-<>-CEB-FIP(197 )-Ir- RILEM Model B3 (1995)
.-11- BS 8110 (1985)-M- ACI 209 (1992)-+-CEB·FIP (1970)-I-CEB·FIP (1990) 1
140120
o 20 40 60 80 100 120 140 160 180Time Since Loading (Days)
Figure 6.6 Measured and predicted specific total creep versus time since loading
for mix Al specimens
140
120
o 20 40 60 80 100 120 140 160 180
Time Since Lo-ding (Days)
Figure 6.7 Measured and predicted specific total creep versus time since loading
for mix A2 specimens
133
From Figures 6.2 to 6.7 it is clear that for all six mixes, for the loading period
considered, the CEB-FIP (1978) method overpredicted the specific total creep
yielding an overall coefficient of variation (ro.n) of 96.1. The average
overpredictior, yielded by the CEB-PIP (1978) method for each of the mixes lies
within the range of 49 to 155 per cent higher than the measured values.
Furthermore, the degree of over prediction increased with time since loading.
The CEB-FIP (1970) method generally underpredicted the specific total creep at
earlier ages (within the first eight days after loading) and then yielded
overpredictions, the extent of which decreased with time, for the remainder of the
period considered. For the six mixes, the overprediction at 168 days after loading
ranged from 0.3 to 21 per cent. The remaining creep prediction methods generally
underpredioted the specific total creep.
A comparison of all the underpredicted values revealed the following:
• In the case of the both the Ql and Gl mixes the most and least accurate
predictions were yielded by the AS 3600 (1988) method and BS 8110 (1985)-
Modified method, respectively. However this trend is not applicable in the case
of the other mix with w/c ratio of 0.56 (i.e, mix AI) where the CEB-FIP
(1990) method yielded the most accurate and the ACI 209 (1992) the least
accurate predictions.
134
8 For the mixes with the w/c ratio of 0.4 (mixes Q2, G2 and A2) no particular
method yielded the most accurate predictions. However, the ACI 209 (1992)
yielded the least accurate prediction in all three of these mixes.
.. The accuracy of the predictions at any time after loading was greater in the
case of the concrete with the lower w/c ratio mix of each aggregate type, in
comparison with the higher w/c ratio mix of that aggregate type.
On the basis of all the predictions the following was concluded:
Only in the case of the andesite concretes did one method, the CBB·FIP (1970),
yield the most accurate predictions for both w/c ratio mixes.
The methods that yielded the most accurate prediction, greatest overprediction and
greatest under prediction (on average) were the CBB·FIP, 1970 (0).11 = 18), CBB·
FIP, 1978 (O)all = 96.1) and the ACI 209, 1992 (0).11 = 50.5), respectively.
Referring to the discussion on the predicted elastic moduli values (Section 6.4.1), if
the eEB-FIP (1970) did not overpredict the elastic modulus for all six mixes, the
extent of overprediction of specific total creep would be larger and hence this
method would be less accurate. Therefore, a ssumlng that the elastic moduli values
predicted by the different methods were accurate, the creep coefficients yielded by
the CBB-FIP (1978) would have to be lower in order to result in more accurate

135
predicted specific creep values. Similarly, the creep coefficients of all the methods
that underestimated specific creep (excluding the RILEM Model B3, 1995) would
need to be higher to improve the accuracy of these methods.
The above results also indicate that the accuracy of the predictions did not increase
with the complexity of the method used. Inparticular, this is evident in the case of
the CEB-FIP (1978) and CEB-FIP (1970) methods, where the former method is a
relatively complex method and yielded the least accurate overall results, whereas
the latter method yielded the most accurate overall results.
An increase in the number of variables accounted for by a prediction method (see
Table 3.1) does not necessarily increase the accuracy of the predicted values. 'This
was observed in the case of the ACI 209 (1992) method.
6.4.4 Basic creep strain
The measured and predicted specific basic creep strains, for the concrete of each
strength grade for each of the aggregate types investigated, are included in Tables
J.1 to J. 6 in Appendix J and shown in Figures 6.8 to 6.13. The statistics of the
enol'S of each model in comparison with the test data are presented in Table 6.4,
which is located after the abovementioned figures.

136
-D-MEASURED -II- BS 8110(19850_._ BS 8110(1985~- MODIFIED ~ ACI209 (1992)-.-AS 3600 (198& ---CEB-FIP (1970)--<>-CEB-FIP (197 ) -t-CEB-FIP (1990)-6- RILEMModelB3 (1_99_5..!-) . _
70
60g- 50 -ClJ....._c.? ~.~~ 40~\O
~Iul"'l 30 -!SO1""'1
~~ 20~10
00
•
A ",,,-_-"' ___ ""~-_....--
20 40 60 80 100 120 140 160Time Since Loading (Days)
Figure 6.8 Measured and predicted specific basic creep versus time since loading
for mix Q1 specimens
70
60
o 20 60 120 14080 10040Time Since Loading (Days)
Figure 6.9 Measured and predicted specificbi.(\ic creep versus time since loading
for mix Q2 specimens
160
180
180

137-0-MEASURED
I -4- BS 8110 (1985~ - MODlFIED
~
AS 3600 (1988-<>-CEB-FlP (197 )-I:r-RILEM Model B3 (1995)
-Ill- BS 8110 (1985~"""*-ACI 209 (1992--e-CEB-FIP (197 )-I-CEB-FlP (1990)
7060
10
o 20 120 16040 60 80 100 140Time Since Loading (Days)
Figure 6.10 Measu:ed and predicted specific basic creep versus time since loading
for mix G1 specimens
7060
o 20 60 80 100 120 140 16040
Time Since Loading (Days)
Figure 6.11 Measured and predicted specific basic creep versus time since loading
for mix G2 specimens
180
180

138
-0- MEASURED-Jr- BS 8110 (1985~ - MODlFIED_._ AS 3600 (1988O-¢-CEB-FIP (197 )-A-RJLEM Model B3 (1995)
---BS 8110 (1985)~ ACI 209 (1992)-+-CEB-FIP (1970)-t-CEB-FIP (1990)
70
60 -
o 20 40 60 80 100 120 140 160 180Time Since Loading (Days)
Figure 6.12 Measured and predicted specific basic creep versus time since loading
for mix Al specimens
70
60 -
~ =:20
100
0 20 40 60 80 100 120 140 160 180Time Since Loading (Days)
Figure 6.13 Measured and predicted specific basic creep versus time since loading
for mix A2 specimens

139
Ta ble 6.4 Coefficients of variation of errors (expressed as a percentage) of basic
creep predictions for various models
Prediction Method Coefficients ofVnriation (00) ooal!MixQl MixQ2 MixGl MixG2 Mix Al MixA2
BS 8110 (1985) 72.9 72.3 49.2 48.8 54.4 30.3 56.6B£ 8110 (1985) - MODIFIED 68.5 64.9 48.2 2'i.0 52.2 46.9 52.9ACI 209 (1992) 67.2 52.\! 39.0 18.3 51.1 28.9 45.9AS 3600 (1988) 79.8 91.1 114.0 96.0CEB - FIP (1970) 81.4 60.1 39.2 19.0 44.3 21.1 49.2CEB - FIP (1978) 171.1 218.1 107.4 115.1 114.8 127.3 147.8CEB - FIP (1990) 57.8 35.9 63.9 58.0 78.8 62.0 60.7RILEM Model B3 (1995) 188.3 193.2 124.4 98.9 114.7 98.2 141.9OOoD lOS 3 120.7 76.8 65.6 83.5 69.8
The following is evident from Figures 6.8 to 6.13 and Table 6.4.
• The predictions are more accurate for the lower w/c ratio mix of each
aggregate type. This is as a result of the relatively lower measured specific
basic creep rate in the case of the lower w/c mix of each aggregate type.
• The CEB-FIP (1990) and AS 3600 (1988) methods generally underpredicted
the specific basic creep values at all ages. Note that the AS 3600 (1988)
method was not applied to predict values for the lower w/c ratio mixes (0.4).
• The CEB-FlP (1978) method overpredicted the specific basic creep for all six
mixes and was the least accurate method, yielding the highest overall
coefficient of variation «(0011 = 147.8). This method also yielded the lowest
overall coefficient of variation for the specific total creep predictions.
140
• When considering the values predicted by the different methods for all six
mixes, the ACI 209 (1992) method yielded the best overall predictions (roall ::;:
45.9).
c The RILEM Model B3 (1995) overpredicted the specific basic creep at all ages
in five of the six mixes (mix Al excluded).
• In the case offive of the mixes (mix Q2 excluded), the application of the ACI
209 (1992) method resulted in the overprediction of the specific basic creep at
earlier ages and underprediction at later ages. This trend was also applicable to
predictions made by the BS 8110 (1985), BS 8110 (1985) - modified and the
CEB-FIP (1970) methods for a minimum offour mixes per method.
• The lowest coefficient of variation for both w/c ratio mixes of each aggregate
type for the quartzite, granite and andesite was yielded by the CEB-FIP (1990),
ACI (1992) and CEB-FIP (1970) methods, respectively. These results indicate
that one particular method is best suited for predicting the specific basic creep
of concrete containing quartzite 01' granite or andesite. However, this does not
imply that all the prediction methods are generally more accurate for concrete
containing a particular aggregate type.
• With the exception of the specific basic creep versus time curve corresponding
to the values predicted by the BS 8110 (1985) and ACI 209 (1992) methods,
141
the relative positions of the other curves are generally identical for all six
mixes. These positions do not correspond with those of the same methods for
the specific total creep versus .i. -ie since loading relationships (see Figures 6.2
to 6.7).
In conclusion, a comparison of the measured versus predicted results for the
two wlc ratios of each aggregate type revealed that no particular trend was
attributable to the aggregate stiffness or type.
As was the case in the specific total creep predictions, the accuracy of the
specific basic creep predictions did not increase with the complexity of the
method used. This is evident in the overall coefficients of variation yielded by
the CEB~FIP (1978) and the RILEM Model B3 (1995) methods which were
much higher than the overall coefficient of variation yielded by the relatively
simple CEB~FIP (1970) method.
6.5 Comparison of Results Obtained with Results of Other
Investigations
6.5.1 Davis and Alexander (1992)
The BS 8110 (1985) creep prediction method does not make it possible to predict
structural deformations with much precision (Davis and Alexander, 1992). This is

142
confirmed by the results of this investigation where neither the SABS 8110
(1985) method nor the SABS 8110 (1985) Modified method yielded the most
accurate predicted specific total creep or specific basic creep for any of the six
mixes. Only in the case of the specific total creep predictions for the andesite
concretes (mixes Al and A2) did the SABS 8110 (1985) Modified method yield
more accurate results than those predicted by the SABS 8110 (1985).
With regard to the specific basic creep values, the BS 8110 (1985) Modified
method yielded a lower coefficient of variation than the BS 8110 (1985) method
for aU the mixes except mix A2.
As the measured specific total creep values were calculated (using equation 5.3)
from the strains recorded on the test specimens, their degree of accuracy was
assumed to 1-,~ greater than the "measured" specific basic creep values which were
affected by the inferred autogenous shrinkage strain values (see equation 5.4).
Revised relative creep coefficients (to be applied with the BS 8110 (1985)
method) were calculated for each of the aggregate types included in this
investigation from the measured and predicted specific total creep values for each
of the mixes. The revised coefficients were determined for each w/c ratio of each
aggregate type (i.e each mix) by taking the average of the factors by which the
predicted values at the various ages of that mix must be multiplied in order to
obtain the measured value. These coefficients are given together with the
corresponding coefficients determined b, Davis and Alexander (1992) in Table
6.5.
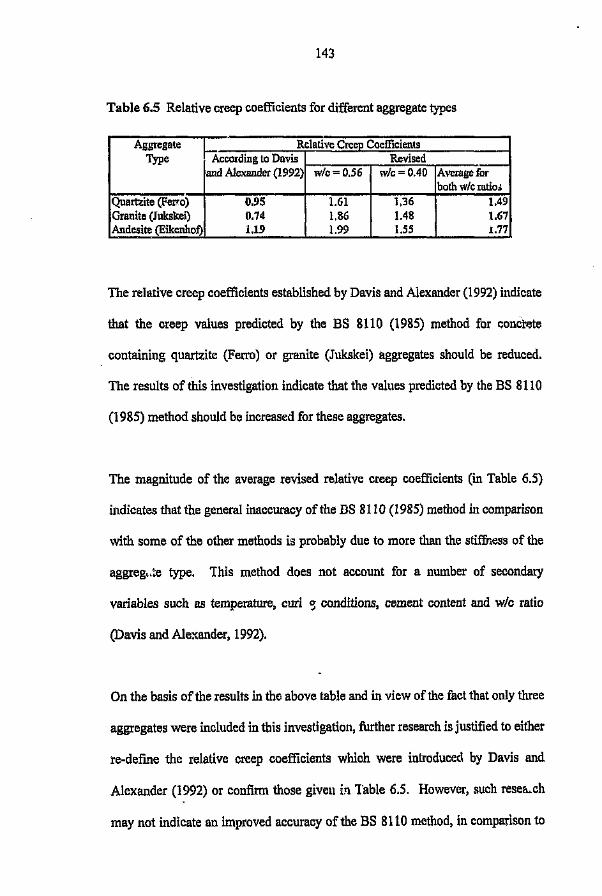
143
Table 6.5 Relative creep coefficients for different aggregate types
Aggregate f- Relative Creep CoefficientsType According to Davis Revised
and Alexander (1992) w/c= 0.56 wlc = 0.40 Average forboth wlc ratio.
Quartzite (Ferro) 0.95 1.61 1.36 1.49Granite (Jukskei) 0.74 1.86 1.48 1.67Andesite (Eikenhof) i.19 1.99 1.55 1.77
The relative creep coefficients established by Davis and Alexander (1992) indicate
that the creep values predicted by the BS 8110 (1985) method for concrete
containing quartzite (Ferro) or granite (Jukskei) aggregates should be reduced.
The results of this investigation indicate that the values predicted by the BS 8110
(1985) method should be increased for these aggregates.
The magnitude of the average revised relative creep coefficients (in Table 6.5)
indicates that the general inaccuracy of the DS 8110 (1985) method in comparison
with some of the other methods is probably due to more than the stiffness of the
aggreg t . te type. This method does not account for a number of secondary
variables such as temperature, curi ~ conditions, cement content and w/c ratio
(Davis and Alexander, 1992).
On the basis of the results in the above table and in view of the fact that only three
aggregates were included in this investigation, further research is justified to either
re-define the relative creep coefficients which were introduced by Davis and
Alexander (1992) or confirm those given i.'l Table 6.5. However, such resea.ch
may not indicate an improved accuracy of the BS 8110 method, in comparison to

144
other existing methods, in situations where the intrinsic and/or extrinsic variables
differ significantly from those pertaining to the tests conducted in this project.
It is therefore recommended that the BS 8110 (1985) method which was
incorporated in the SABS 0100 (1992) be replaced by one of the other existing
methods or by a newly developed model. The former option would be preferable.
6.5.2 RILEM Data Bank
In the justification of the RILEM Model B3 (1995), comparisons were made
between the coefficients of variation of errors (mj) for specific creep at drying
(total) and specific basic creep preaictions for the RILEM Model B3 (1995), the
ACI 209 (1992) and the CEB-FIP (1990) methods (RILEM Model B3, 1995). The
data used in these comparisons derived from the RILEM Data Bank, which was
compiled by subcommittee 5 of RILEM Committee TC-I07 (1995), comprising
approximately 15 000 data points from various laboratories around the world. The
drying (total) creep and basic creep comparisons are discussed below.
Total creep
The coefficients of variation for the specific total creep comparisons are given in
Table 6.6.

145
Table 6.6 Coefficients of variation for specific total creep predictions for the
RILEM Model B3 (1995), ACI 209 (1992) and CEB-FIP (1990)
methods (after RILEM Model B3, 1995)
Test Coefficients of Variation «Q)Data RILEM ACI209 CEB-FIP
Model B3 (1992) (1990)(1995)
Hansen and Mattock (1966) 5.8 32.> 11.9Keeton (1965) 31.4 46.3 37.9Troxell et al., (1958) 5.9 33.0 7.9L'Hennite et al., (1965) 14.0 55.8 25.5Rostasy et al., (1972) 6.5 20.9 14.8York et al., (1970) 5.8 42.1 45.1McDonald (1975) 10.9 404 38.9Hununel et aI., (1962) 15.3 46.2 24.6L'Hermite and Mamillan (1970) 20,6 62.5 15.2Mossiossian and Gamble (1972) 11.3 71.7 30.8Maity and Meyers (1970) 62.8 45.9 83.7Russel and Burg (1993) 10.7 41.2 19.1OOall 23.1 46.8 35.5
From Table 6.6 it is evident that the overall coefficients of variation for the three
models increase in the order Model B3 (1995) (Wall = 23.1), CEB-FIP (1990) (Wall
= 35.5), and ACI 209 (J.992) (Wall :=; 46.8). The total creep results for the present
investigation (Table 6.3) are in disagreement with the above relative order in that
the CEB-FIP (1990) method yielded a iower value (Wall = 32.2) than the Model B3
(Wall = 35.6). This disagreement may be attributable to the fact that the RILEM
data bank does not include data for South African concretes. The relative
magnitude of the overall coefficients of variation, with the three prediction
-nethods, established in this investigation is in agreement with that obtained by
York et al., (1970) and Maity and Meyers (1970) in Table 6.6.

146
However, the results of this investigation agree with the findings presented in
Table 6.6 in the following two aspects:
• the values predicted by the ACI 209 (1992) method in this investigation also
yielded a relatively higher overall coefficient of variation (roall = 50.5) in
comparison with the other two methods and,
• the overall coefficient of variation for the CEB-FIP (1990) and ACI 209
(1992) are of a similar order of magnitude in the two sets of results compared.
Basic creep
The coefficients of variation for the specific basic creep comparisons are given in
Table 6.7. It is evident from this table that the overall coefficients of variation
pertaining to basic creep for the three models increase in the same order as the
overall coefficients of variation for drying creep (i.e, Model B3 (1995), CEB-FIP
(1990) and ACI 209 (1992». The basic creep results of this investigation (Table
6.4) indicate an opposite trend to that described above, with the overall
coefficients of variation 0.::' the three relevant methods increasing in the order' ACI
209 (1992), CEB-FIP (1990) and Model B3 (1995). In addition, a large
discrepancy exists between the magnitude of the overall coefficient of variat Ion
obtained by each method in this investigation and that obtained I'y tl-e
corresponding method on the basis of the RILEM data bank.

147
Table 6.7 Coefficients of variation for specific basic creep predictions for the
RILEM Model B3 (1995), ACI 209 (1992) and CEB-FIP (1990)
methods (after RILEM Model B3, 1995)
Test Coefficients of Variation (ro)Data RlLEM ACI209 CEB-FIP
Model B3 (1992) (1990)(1995)
Keeton (1965) 1.9.0 37.5 42.8Konunendant et aI., (1976) 15.3 31.8 8.1L'Hermitc ~taI., (1965) 49.4 133.4 66.2Rostasy et a1., (1972) 15.2 47.6 5.0Troxell et al., (1958) 4.6 13.9 6,2York et al., (1970) 5,6 37,7 12.8McDonald (1975) 6.9 48.4 22.2Maity and Meyers (1970) 33,8 30.0 15.7Mossiossian and Gamble (1972) 18.6 51.5 47.3Harboe et al., (1958) 14.1 51.2 31.1(Ross Dam)Browne and Bamforth (1975) 44.7 47.3 53.3(Wylfa vessel)Harboe et al., (1958) 22.7 107.8 43.1(Shasta Dam)Brooks and Wainwright (1983) 12.6 14,9 15.4Pirtz (1968) (Dworshak Dam) 12.5 58,2 32.5Harboe et al., (1958) 33,3 70.2 56.9(Canyon ferry Dam)Russel and Burg (1993) 15.7 19.3 31.5(Water Tower Place)Hanson (1953) 14.1 63.3 12,1
maU 23.6 58.1 35.0
In view of the above, the basic creep results obtained in this investigation appear
to be questionable, The probable inaccuracy of the basic creep results may be
attributable to the inferred autogenous shrinkage values,
· 148
6.5.3 Brooks et al., (1992)
Brooks et al., (1992) carried out laboratory creep tests on two high strength
concrete prisms (seven day cube strength of 50 MPa). The measured total creep at
eight months (after casting) was compared to the creep predicted at the same age
using a number of methods including the CEB-FIP (1970), CEB-FIP (1978) and
BS 8110 (1985) methods.
The ratios of the predicted to the measured strains in the case of the CEB-FIP
(1970), CEB-FIP (1978) and BS 8110 (1985) were 2.35, 1.52 and 1.6,
respectively. Therefore, all the methods overestimated the total creep strain. {he
only trend that is in agreement with the results of this investigation is that both the
CEB-FIP (1970) and the CEB-FIP (1978) methods overestimated the creep.
Nevertheless, there is no cause for concern, over the differences in results of this
research and Brooks' research, as the results of the latter project are based on only
two samples of high strength concrete and many of the intrinsic and/or extrinsic
factors differed from those of the this project.
6.5.4 McDonald ct al., (1988)
McDonald et al. (1988) assessed the accuracy of a number of creep prediction
methods including the CEB-FIP (1978) and AS 3600 (1988) methods. Only total
creep was considered. The experimental data, which was compared to the values
predicted at the corresponding ages by the different models, comprised over 1000
149
Lata points from 29 creep tests (conducted on Australian concretes) from five
different sources.
The results of this assessment led to the following conclusions:
• None of the prediction methods investigated exhibited a consistent trend with
regards to over andlor underpredict.on.
.. The overall coefficients of variation (mall) yielded by the CEB-FIP (1978) and
AS 3600 (1988) methods were 72.1 and 22.4 per cent, respectively. These
overall coefficients of variation (COnll) are in fair agreement with the
coefficients established for the corresponding methods in this investigation
(see Table 6.3).
6.5.5 Alexander (1986)
Alexander (1986) gives details of an investigation carried out to assess the
accuracy of the C & CA (1979), CEB-F!P 1.1970), CEB-FIP (1978) and ACI
(1982) creep prediction methods when applied to South African concretes. The C
& CA (1979) and ACI (1982) method.s appear to be identical to the BS 8110
(1985) and ACI 209 (1992) methods, respectively. With regards to the C & CA
(1979) method, the procedures described by Alexander (1986) and in this
investigation differed in that equations 3.2 and 3.3 were used to calculate the
elastic modulus in the former case as opposed to the application of equation 3.4 in
the latter case.
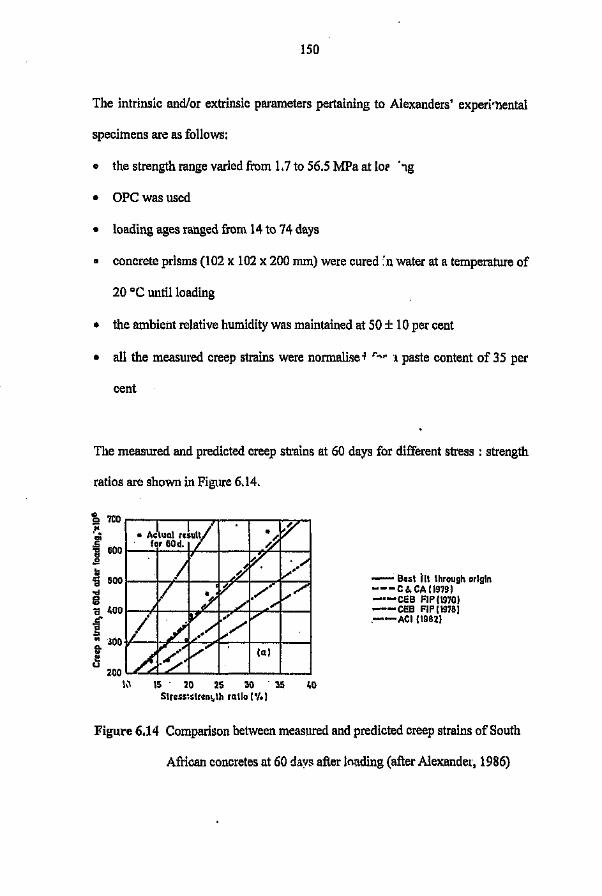
150
The intrinsic and/or extrinsic parameters pertaining to Alexanders' experrnental
specimens are as follows:
CD the strength range varied from 1.7 to 56.5 MPa at 10C' • '1g
• OPC was used
• loading ages ranged from 14 to 74 days
• concrete prisms (102 x 102 x 200 rom) were cured: n water at a temperature of
20°C untilloading
• the ambient relative humidity was maintained at 50 ± 10 per cent
• all the measured creep strains were normalise -l r",~ 1 paste content of 35 pel'
cent
The measured and predicted creep strains at 60 days for different stress : strength
ratios are shown in Figure 6.14.
- Bast tu through origin--- C to. CA 11979)-'-CEe FIP(1970)_ .•_ CEe FIP 11978).--ACI (1982)
IS 20 25 30 3SStress:stren~th ratio I'J,)
Figure 6.14 Comparison between measured and predicted creep strains of South
African concretes at 60 davs after loading (after Alexander, 1986)

151
A comparison of the results in Figure 6.14 to those obtained for total creep at 60
days after loading in this investigation (Figures 6.2 to 6.7) led to the conclusion
that the only similarity in the comparison is that the ACI (1992/1982) method and
the CEB-FIP (1970) methods underestimated and overestimated the creep strain,
respectively. Furthermore, the results of this investigation show the extent of
overprediction yielded by the CEB-FIP (1970) to be significantly less than that
established by Alexander (1986).
In conclusion, the results of this investigation generally disagree with those
obtained by Alexander (1986).
6.6 Conclusions
6.6.1 Elastic modu1iof concrete
All the creep prediction methods included in this project consider the value of ,q
predicted elastic modulus of the concrete in calculating predicted creep strain. A
comparison of the predicted elastic moduli, determined for each mix by the
different creep prediction methods, with the measured elastic moduli of the
relevant mixes indicated that the differences were only significant in the case of
the BS 8110 (1985) modified method and the CEB-FIP (1970) ethod,

152
6.6.2 Total and basic creep
A comparison of the experimental specific total creep and specific basic creep
values from this investigation with those predicted at the corresponding ages by
the BS 8110 (1985), BS 8110 (1985) - Modified, ACI 209 (1992), AS 3600
(1988), CEB-FIP (1970), CEB-FIP (1978), CEB-FIP (1990) and the RILEM
Model B3 (1995) methods revealed the following;
Total creep
• The CEB-FIP (1978) method overpredicted the specific total creep for all the
mixes;
• The CEB-FIP (1970) method generally underpredicted the specific total creep
at earlier ages (within the first eight days after loading) and then yielded
overpredictions;
• The remaining creep prediction methods generally underpredicted the specific
total creep;
• The accuracy of the predictions at any time since loading was generally greater
in the case of the concrete with the lower wlc ratio mix of each aggregate type,
in comparison with the higher wlc ratio mix of that aggregate type;

153
• Only in the case of the andesite concretes did one method, the CEB-FIP
(1970), yield the most accurate predictions for both wlc ratio mixes.
• The methods that yielded the most accurate prediction, greatest overprediction
and greatest under prediction (on average) were the CEB-FIP (1970), CEB-FIP
(1978) and the ACI 209 (1992), respectively.
Basic creep
• The CBB-FIP (1978) and RILEM Model B3 (1995) methods generally
significantly overpredicted the specific basic creep for all the mixes;
• The CEB-FIP (1990) and AS 3600 (1988) methods generally underpredicted
the specific basic creep values at all ages, with the latter being the more
accurate of the two methods;
• The remaining methods generally overpredicted the specific basic creep at
earlier ages and underpredicted this value at later ages;
• The predictions are more accurate for the lower wlc ratio mix of each
aggregate type;
• The methods that yielded the most accurate and least accurate predictions (on

154
average) were the ACI 209 (1992) and the CEB-FIP (1978) methods,
respectively.
All the above creep results indicate that the accuracy of the predictions does not
increase with the complexity of the method applied or with increasing number of
variables accounted for in the method. Furthermore, none of the observed trends
were attributable to the aggregate stiffness or type.
6.6.3 Comparison of results from t\hisproject with results of other
investigations
A comparison of the accuracy of the prediction methods included in this
investigation with the accuracy determined for some of these methods in separate
research projects by Davis and Alexander (1992), RILEM Data Bank, McDonald
et al., (1988) and Alexander (1986) revealed the following.
Davis and Alexander (1992)
The relative creep coefficients established by Davis and Alexander (1992) indicate
that the creep values predicted by the BS 8110 (1985) method for concrete
containing quartzite (Ferro) or granite (Jukskei) aggregates should be reduced.
The results of this investigation indicate that the values predicted by the BS 8110
(1985) method should be increased for these aggregates.

155
The magnitude of the average revised relative creep coefficients indicates that the
general inaccuracy of the BS 8110 (1985) method in comparison with some of the
other methods is probably due to more than the stiffness of the aggregate type.
RILEM Data Bank
Results from the RILEM Data Bank, comparing the relative accuracy of the total
creep and basic creep predictions yielded by the RlLEM Model B3 (1995), CEB·
FIP (1990) and ACI 209 (1992) methods showed the accuracy of these methods to
increase in the abovementioned order. The total creep results of this investigation
are in disagreement with the above relative order in that the CEB-FIP (1990)
method yielded a more accurate results than the RILEM Model B3 (1995). This
disagreement may be attributable to the fact that the RILEM data bank does 110t
include data for South African concretes. However, the agreements in the two sets
of results compared outweigh the above disagreement. In the case of the accuracy
of the basic creep predictions, significant disagreement exists between the results
of tins investigation and those based on the RILEM Data Bank. Therefore, the
basic creep results obtained in this investigation appear to be questionable. The
probable inaccuracy of the basic creep results may be attributable to the
magnitudes of the inferred autogenous shrinkage values.
Brooks et al., (1992)
Brooks et aI., (1992) compared the accuracy of total creep predictions using a
number of methods including the CEB-FIP (1970), CEB-FIP (1978) and BS 8110
(1985) methods and concluded that the all abovementioned methods
156
overestimated the creep strain. This is in agreement with the predictions yielded
by the CEB-FIP (1970) and CEB-FIP (1978) methods in this investigation.
However, differences exist in the degree of over estimation yielded by these
methods in the two sets of data compared. Nevertheless, there is no cause for
concern, over the differences in results of this research and Brooks' research, as
the results of the latter project are based on only two samples of high strength
concrete and many of the intrinsic and/or extrinsic factors differed from those of
the this project.
Mclronald et al., (1988)
McDonald et al. (1988) assessed the accuracy of total creep predictions yielded by
a number of creep prediction methods including the CEB-FIP (1978) and AS 3600
(1988) methods, for Australian concretes. The results of this assessment
concluded that the AS 3600 (1988) method was more accurate than the CEB-FIP
(1978) method. This is in agreement with the results of this project.
Alexander (1986)
Alexander (1986) gives details of an investigation carried out to assess the
accuracv of the BS 8110 (1985), CEB-FIP (1970), CBB-FIP (1978) and ACI
(1982/1992) creep prediction methods when applied to South African concretes.
A comparison of the results of Alexander (1986) with those obtained for total
creep at 60 days after loading in this investigation led to the conclusion that the
only similarity in the comparison is that the ACI (1992/1982) method and the

157
CEB- FIP (1970) methods underestimated and overestimated the creep strain,
respectively. Furthermore, the results of this investigation show the extent of
overprediction yielded by the CEB-FIP (1970) to be significantly less than that
established by Alexander (1986). The results of this investigation generally
disagree with those obtained by Alexander (1986).

158
CHAPTER 7
CONCLUSIONS AND RECOMMENDATIONS
7.1 Conclusions
7.1.1 Measured creep strains
Specific creep (creep strain per unit applied stress) values were used for
comparing the creep strains exhibited by the different concrete mixes included in
this investigation. The results of this research revealed the following:
Effect oj different w/c ratios Oil creep strain
For the concretes made with each of the aggregate types, at any age after loading,
the mix with the lower w/c ratio (0.4) yielded a lower specific creep value. This
trend was observed in both the total and basic creep results and is agreement with
the findings of Reutz (1965), Ballim (1983), Srnadi et cl., (1987), Addis (1992)
and Fiorato (1995).

159
Effect of aggregate stiffness Oil creep strain
The average elastic modulus values of the quartzite, granite and andesite were
determined as 73, 70 and 89 GPa, respectively.
The creep test results indicated that, in the case of both total and basic creep, the
specific creep of concrete with a particular w/c ratio (for most of the test period)
with the use of different aggregates, generally increased in the order quartzite,
andesite and granite. This indicates that the creep behaviour of concrete
containing aggregate with a relatively high elastic modulus is significantly
influenced by some other property of the aggregate, rather than stiffness.
The specific total creep values at six months after loading were adjusted to
eliminate the influence of different w/c ratios on creep. These results indicated
that a significant positive correlation exists between the specific total creep of
concrete and the elastic modulus of the aggregate used in the concrete. For the
concretes of each aggregate type, the higher the elastic modulus of the aggregate,
the more the relative creep of the concrete. An identical trend was established
using data from Davis and Alexander (1992) for the same aggregates as those
considered in this investigation but pertaining to an age of five years after loading.
These correlations show an opposi te trend to those established by Rusch et aI.,
(1962) and The Concrete Society (1974), which indicate that the higher the elastic
modulus of the aggregate, the greater the restraint offered by the aggregate to the
creep of the paste. However, these relationships indicate creep of concrete to be
relatively insensitive to aggregate stiffness in the case of aggregates with a

160
modulus of elasticity in excess of approximately 70 GPa (Rusch et al., 1962 and
The Concrete Society, 1974).
The unexpected abovementioned results appear to be attributable to the stress
strain behaviour of the aggregate/paste interfacia. _. ne. Consideration of the
behaviour of the interfacial zone, which is dependent on bond strength and density
of this zone, is of significance and should not be overlooked by assuming that
concrete is a two phase material (Nilsen and Monteiro, (1993), Alexander, (1991),
Alexander and Davis (1992), Alexander (1993a) and Mindess and Alexander
(1995». Therefore, in this investigation the measured creep that was assumed to
have taken place in the paste may have included the magnitude of strains which
occurred at the interfacial zone.
Comparison of results with those of Davis and Alexander (1992)
The relative magnitudes of concrete creep with the use of different aggregates,
obtained for the mixes in this investigation, are in disagreement with the results of
research conducted by Davis and Alexander (1992) on creep of concretes with
various aggregates, including those used in this investigation. Their results show
concrete creep with the use of these aggregates to increase in the order granite,
quartzite and andesite. These disagreements appear to be due to the analytical
approach of the work of Davis and Alexander (1992) and to a lesser extent due to
variations in the properties of aggregates from the same source.

161
Accuracy of autogenous shrinkage strains
The calculated specific basic creep values for each of the mixes included in the
investigation, for different ages of loading, included a consideration of the
autogenous shrinkage strain values. As no provision was made for the
measurement of autogenous shrinkage strains, these strains were inferred from the
results of research conducted by Alexander (1994b). The data used for inferring
the autogenous strains were unusually high, comprising strains of magnitudes
approximately three times higher than anticipated at an age of 360 days
(Alexander, 1998). In addition, this data pertained to concrete containing only
quartzite aggregates. Therefore, the accuracy of the specific basic creep values in
this investigation has not been verified.
7.1.2 Comparison of measured and predicted creep strains
Accuracy of predictions
A comparison of the experimental basic creep and total creep values from this
investigation with those predicted at the corresponding ages for the loading period
considered by the BS 8110 (1985), BS 8110 (1985) Modified, ACI 209 (1992),
AS 3600 (1988), CEB-FIP (1970), CEB-FIP (1978), CEB-FIP (1990) and the
RILEM Model B3 (1995) methods revealed the following:
The creep strains predicted by the different methods vary widely. The specific
total and basic creep values predicted by the different methods for the loading
162
period considered (six months) generally indicated the trends that are shown in
Table 7.1, with regards to overpredictions and underpredictions.
It was established that, for all the mixes, the relative positions of the creep versus
time curves for the specific total creep did not correspond with those of the same
methods for the specific basic creep.
In the case of specific total creep, the methods that yielded the most and least
accurate predictions (on average) were the CEB-FIP (1970) and CEB-FIP (1978),
respectively. However, the ACI 209 (1992) and CEB-FIP (1978) methods yielded
the most and least accurate specific basic predictions, respectively.
The following conclusions were established for both the total and basic specific
creep predictions:
8 The CEB-FIP (1978) method significantly overestimated the specific creep
strain values and was the least accurate method;
• The accuracy of the predictions at any time after loading was generally greater
in the case of the concrete with the lower w/c ratio mix of each aggregate type,
in comparison with the higher w/c ratio mix of that aggregate type;

Table 7.1 SUI,mary of predicted specific strain magnitudes relative to the measured values
Specific Creep PredictionsMETHOD Specific Total Creep Specific Basic Creep
Overpredicted Underpredicted Underpredicted Overpredicted Overpredicted Underpredicted Underpredicted Overpredictedthen later then later then later then later
Overpredicted Underpredicted Overpredicted Underpredicted
BS 8110 (1985) X X
BS 8110 (1985) - modified X X
ACI 209 (1992) Xj
X
AS 3600 (l988) X X
CEB - FIP (1970) X X
CBB - FIP (1978) X X
CEB - FIP (1990) X X
RILEM Model B3 (1995) I X X

164
• The accuracy of the predictions does not increase with the complexity of the
method applied or with increasing number of variables accounted for in the
method.
The discrepancies between the results obtained by applying the different models
appear to be due to the large uncertainty in the understanding of creep mechanisms
which has led to the development of empirical models and not due to the failure to
directly account for the aggregate stiffness in these methods.
According to Davis and Alexander (1992) the BS 8110 (1985) method, which has
been incorporated into SABS 0100 (1992), does not make it possible to predict
structural deformations with much precision. This was confirmed by the results of
this investigation.
Furthermore, the magnitude of the aggregate stiffness is not reflected in any of the
trends established and only in the case of the andesite concretes did one method,
the CEB-FIP (1970) method, yield the most accurate predictions for both specific
total and specific basic creep.
Comparison witl: results of other research projects
A comparison of the accuracy of the prediction methods included in this
investigation with the accuracy determined for some of these methods by other
researchers indicated the following:

165
• The results of this investigation showed the relative creep coefficients, which
were established by Davis and Alexander (1992) with the intention of
improving the accuracy of the BS 8110 (1985) method, to be inaccurate;
• The accuracy of the RILEM Model B3 (1995), ACI 209 (1992) and CEB-FIP
(1990) established in this investigation is in fair agreement with the accuracy
established for these models for total creep on the basis of data from the
RILEM Data Bank (RILEM Model B3, 1995). However, significant
disagreement exists when comparing the accuracy of the two sets of results for
basic creep;
~ McDonald et al., (1988) established the accuracy of the CEB-FIP (1978) and
AS 3600 (1988) methods when predicting total creep only. The degree of
accuracy of these predictions is in fair agreement with the results of this
investigation;
o The accuracy determined by Alexander (1986) for the BS 8110 (1985)
(previously C & CA, 1979 method), CEB-FIP (1970), CEB-FIP (1978) and
ACI (1992/1982) methods is in general disagreement with the results of this
investigation.
166
7.2 Recommendations for Further Research
7.2.1 Influence of aggregate type and stiffness on creep
In order to evaluate the true influence of aggregate type and stiffness on both basic
and total creep strain, it is recommended that creep tests be conducted on scaled
and unsealed specimens and that all the intrinsic and extrinsic factors except for
the aggregate type be kept constant, as performed in this investigation. However,
it is proposed that a constant quantity of condensed silica fume be included in all
the samples to density '(he aggregate/paste interfacial zone, thereby obtaining
properties in this zone which are similar to those of the bulk hardened cement
paste in the concrete. Mindess and Alexander, 1995 as well as Alexander and
Milne (1995) found that the inclusion of silica fume in concrete densifies the
interfacial zone between the paste and aggregate resulting in the interfacial :i ':: ;
being smaller and less compressible than it would have been if only ope was
used.
Furthermore, in the case of the proposed basic creep specimens, companion
specimens should be cast (and sealed) for each mix and subjected to the same
environment as the loaded sealed specimens. These companion specimens should
be used for the purpose of recording the autogenous strains at the same times
when total strains are measured on the loaded sealed specimens.

167
7.2.2 Further verification of the creep prediction models
The experimental creep results from the abovementioned proposed research
should be compared with those predicted at the corresponding ages by the
methods included in this investigation, in order to establish which method
provides the most accurate estimates of creep strain of concrete made with either
quartzite or granite or andesite aggregates.
Since the BS 8110 (1985) method is incorporated in the SABS 0100 (1992) code,
the relative creep coefficients which were introduced by Davis and Alexander
(1992) to improve the accuracy of the BS 8110 (1985) method, should be re-
defined or confirmed. Should the accuracy of this method not be improved by
further research, it is recommended that consideration be given to replacing the BS
8110 (1985) method in the SABS 0100 (1992) with a more accurate existing
model, possibly the CEB-FIP (1970) model.
According to RILEM TC-107 (1995) basic creep and drying creep have different
properties, originate from different mechanisms and depend on different variables.
Hence basic creep and drying creep (in excess of the basic creep) should be
represented by separate terms in a creep model, which may be added to obtain the
total creep. The RlLEM Model B3 (1995) is the only model, of those included in
this investigation, that is structured in the manner described above. For this
reason, particular attention should be paid to verifying the RILEM Model B3
(1995) and hence confirm this particular recommendation with regards to the
structure of creep models.

168
DESIGN VALVES FOR ESTIMATING ELASTIC
~ODULUSOFCONCRETE
Table A.l Design values for estimating elastic modulus of concrete for ages from 3 to
28 days (after Davis and Alexander, 1992)
;-'
AGGREGATE TYPEDESIGN VALUESK" a
CAPE,Granite, (Rheebok) 21 0,25Greywacke , (penInsula) 24 0,25(Malmesbury Shale) ,,'
™ Quartzite (Mossel Bay 23 0,25NATALDolerite (Leach and Brown) 20 0,40Dolerite' {Natal Crushers} 18 0,30Dolerite (Ngagane) 22 0,40TM Quartzite (Coedmore) 19 0,30™ Quartzite (Verulam) 17 0,25Tillite (Umlaas Rd) 20 0,35Siltstone (Leach and Brown 21 0,15TRANSVAALAndesite (EikenhoO 29 0,20Andesite (Vaal) 24 0,35Dolomite (Sterkfontein) 25 0,45Dolomite (Ollfantsfonteln) 24 0,45Felsite (Mlddelburg) 18 0,35Felsite (Zeekoewater) 23 0,30Granite (Jukskei) 20 '0,20Granite (Roodekrans) 15 0,30Daspoort Quartzite (Bundu) 14 0,30Pretoria Quartzite (Ferro) 17 0,40Wits Quartzite (ORO) 19 0,25Wits Quartzite (Scoops) 18 0,25Wits Quartzite Makfonteln 22 0,20
Note: Except for felsite, the range of cube strengths for which the above val-ues are valid Is generally between 20 and 70 MPa, at ages from 3 to28 days, For strengths less than 20 MPa the expression will not beaccurate. In the case of felsites the expression lacks accuracy below25 MPa.The number of tests conducted to determine the above values variedbetween 8 and 16. Each test result was the average of at least threeIndividual specimens.
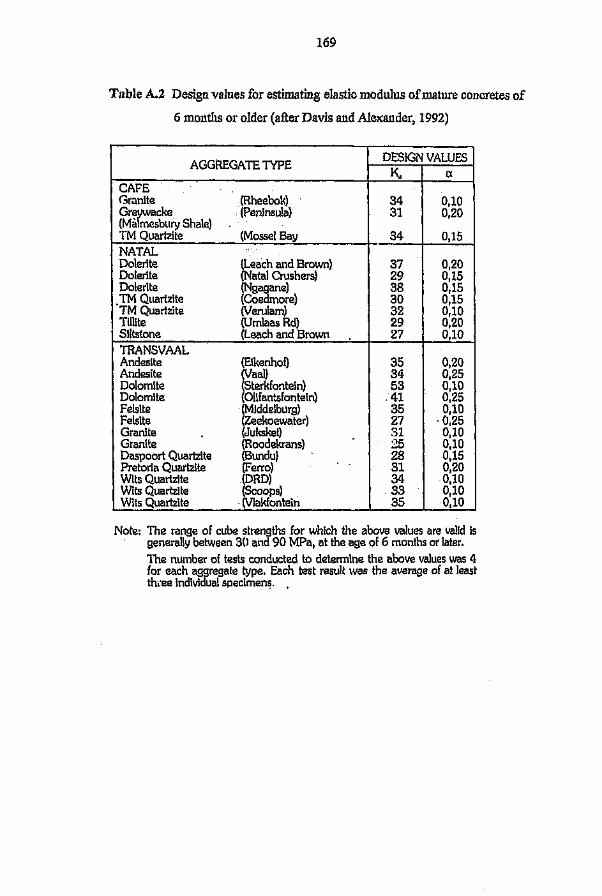
169
Table A.2 Design values for estimating elastic modulus of mature concretes of
6 months or older (after Davis and Alexander, 1992)
AGGREGATE TYPE DESIGN VALUESKo Ct
CAFEGranlte (Rheebok) 34 0,10Greywacke (Peninsula) 31 0,20(Malmcsbury Shale)™Quartzite (Mossel Bay 34 0,15NATALDolerite (Leach and Brown) 37 0,20Dolerite (Natal Crushers) 29 0,15Dolerite (Ngagane) 38 0,15™Quartzite (Coedmore) 30 0,15.™Quartzite (Verulam) 32 0,10Tillite (Umlaas Rd) 29 0,20Siltstone (Leach and Brown 27 0,10TRANSVAALAndesite (ElkenhoO 35 0,20Andesite (Vaal) 34 0,25Dolomite (Sterkfontein) 53 0,10Dolomite (Ollfantsfontein) 41 0,25Felsite (Middelburg) 35 0,10Felsite (Zeekoewater) 27 ·0,25Granite (Jukskei) 31 0,10Granite (Roodakrans) 25 0,10Daspoort Quartzite (Bundu) 28 0,15Pretoria Quartzite (Ferro) 31 0,20Wits Quartzite (ORO) 34 0,10Wits Quartzite (Scoops) 33 0,10Wits Quartzite (Vlakfontein 35 0,10
Note: The range of cubs strengths for which the above values are valid isgenerally between 30 and 90 MPa, at the age of 6 months or later.The number of tests conducted to determine the above values was 4for each aggregate type. Each test result was the average of at leastthree individual specimens. .
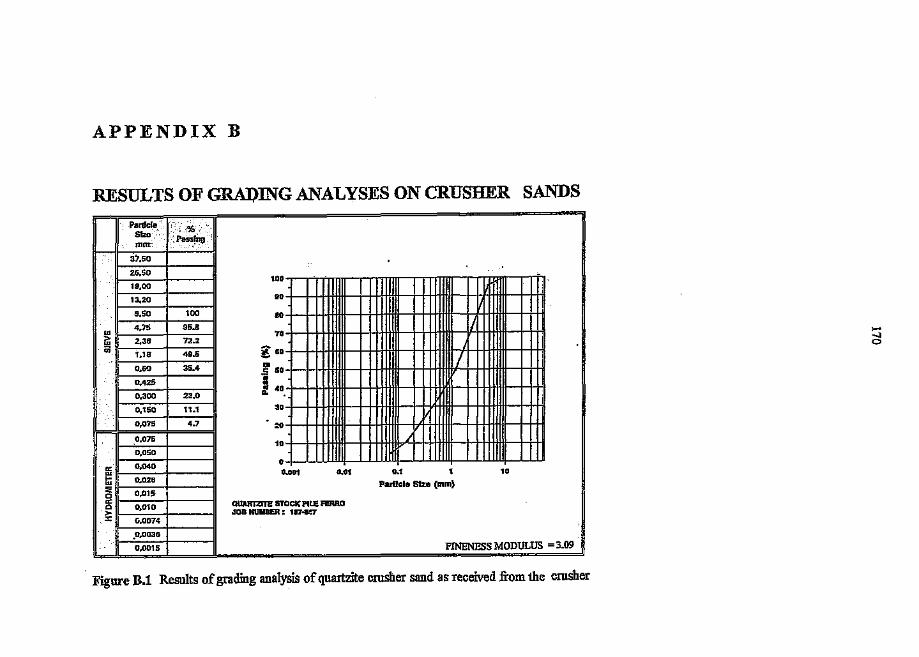
APPENDIX B
RESULTS OF GRAI)ING ANALYSES ON CRUSHER SANDS
ParticleSizo Passingmm
37,50
26,50 -10019,00
13,20 se I9,50 100 80
w 4,75 95,B v70> 2,36 72.2w
iii 1,18 49.5 g 80
0,60 35.4 01 !c 50
0,425 -:0,300 23.0
~ 40.
0,150 11.1 30
0,075 4.7 .:10
0,07510 /
0,050
I 0,040 a0::w 0.001 0.01 0,1 1 10I- 0,026w Particle Size (mm)::: 0,0150a: QUAmZrTE STOCK PILE FERRO0 0,010>- JOB HUMBER; 187~7:r: (;,0074
,0,0036
0,0015 FINENESS MODULUS =3.09
Figure B.1 Results of grading analysis of quartzite crusher sand as received from the crusher
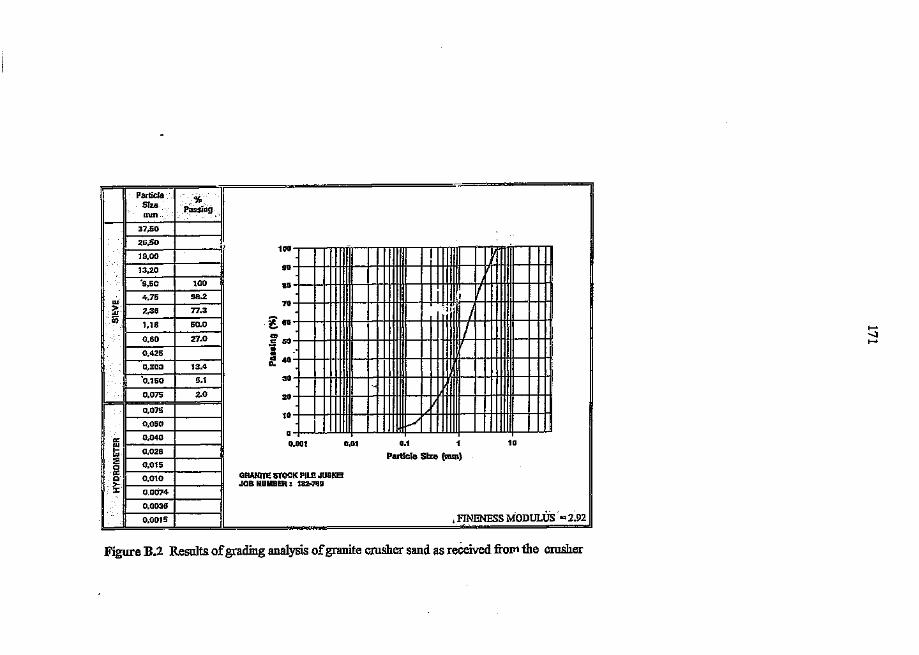
In -Particle % ISizemm Passing
I37,50
26,50.J 100 I19,00
13,20 80
'9.50 100 IIIl
4.75 98.2 i ;1 IIw 70~.2.36 77.3
" Iin g 8C1.18 50.0 /0.60 27.0 <II ,c so
0,425..•co 40
0,300 13.4 II.
'0,150 5.1 30 '.0,075 2.0 20 I0,075
10_../0,050
0,040 00: ,w 0.001 0.01 0.1 1 10
t:i 0,026 P&rtlclo Size (mm):;:0.0150
0: GRANITE &TO<:K PILE JUSKEI0 0,010>- JOB HUMBER: 182-7651:x: 0.0074
0,0036
0,0015 , FINENESS MODUUJS = 2.92
Figure B.2 Results of grading analysis of granite crusher sand as received from the crusher

Particle 0'
Size '0
mm Passing
37,50
26,50100
19,00
i3.20 ~o9,50 100 80
4,75 99.6 Iw 70
,iii 2,36 78.8 /Ui leo1,18 52.8 !70,60 34.11 '"'" 50
0.4250; I..II 40
0,300 24.8 a.
0,150 16.9 30
0,075 13.4 20'/"1t :/
0,07510
0,050
9,040 0a:aJ O,QOl 0.01 0.1 1 '10l- 0,026w Particle Size (mm):;:
0,015 Iaa: ANDESITE STOCK PILE E1KENHOF0 0,010>- JOB NUMBER: 1117-84gJ: 0,0074
0,0036
0,0015 FINENESS MODULUS = 3.27
Figure B.3 Results of grading analysis of andesite crusher sand as received :fromthe crusher
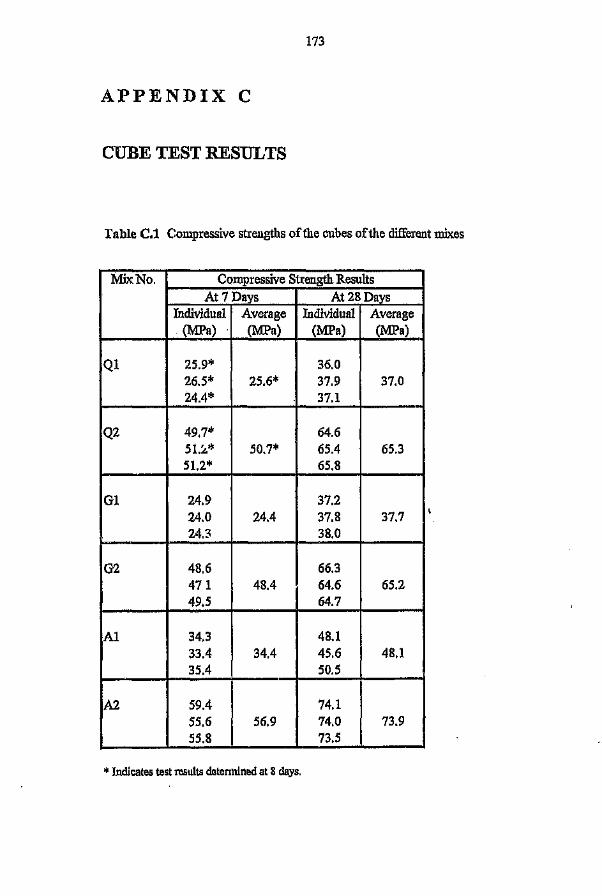
173
APPENDIX C
CUBE TEST RESULTS
Table C.l Compressive strengths of the cubes of the different mixes
Mix No. Compressive Strength ResultsAt 7 Days At 28 Days
Individual Average Individual Average(MPa) (MPa) (MPa) (MPa)
Q1 25.9* 36.026.5* 25.6* 37.9 37.024.4* 37.1 -
Q2 49.7* 64.651.~* 50.7* 65.4 65.351.2* 65.8
G1 24.9 37.224.0 24.4 37.8 37.724.3 38.0
G2 48.6 66.3471 48.4 64.6 65.249.5 64.7
Al 34.3 48.133.4 34.4 45.6 48.135.4 50.5
A2 59.4 74.155.6 56.9 74.0 73.955.8 73.5
* Indicates test results determined at 8 days.
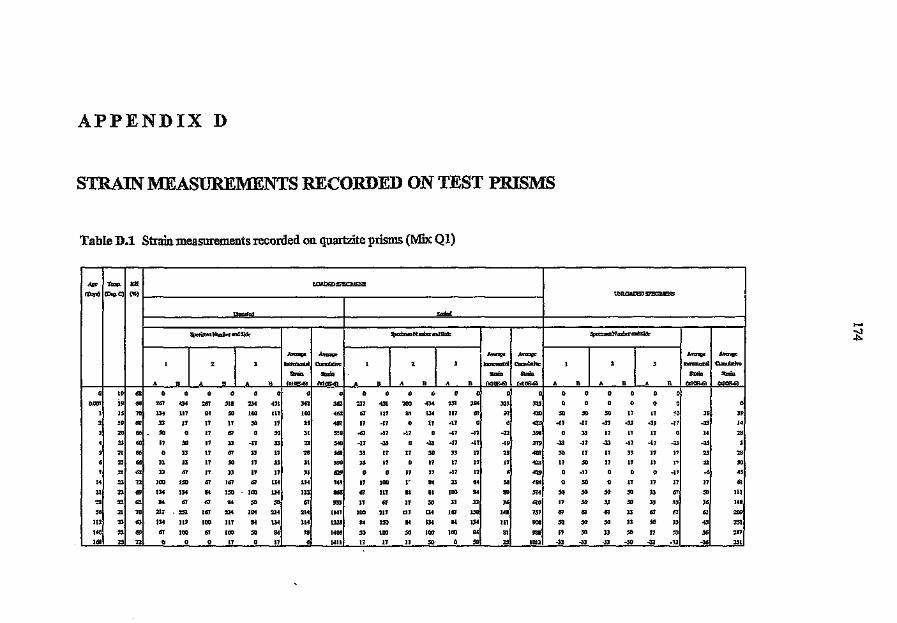
APPENDIX D
STRAIN :MEASUREMENTS RECORDED ON TEST PRISMS
Table D.l Strain measurements recorded on quartzite prisms (Mix Ql)
~ Ttap. RH
,,,,,.) (Dq,.C) (") 1--------------------,.--------------------; !.JNLOADED SPECIMENS
A B n D
Slnrin Stn:llo
B (:dQE.6') (:dOE-6\ A B .\ B
Stnoi.1. &rz:nB (xl0B-6) (xlOE-6).
QOO1
I
I. '"19 69 1.61 43-4 261 .:sIS m .oC.51
IS 10 131 111 84 50 100 III
19 re n 11 17 17 ~ 1710 66 "> 11 61 '0
:360 11.5011 33·17 33
A B A D
A~ A\'a¥_ <>=Ltiv<
Slr.lQ .sm::nxlO&6'I h:1C&El
1.1 66
II .. ""6T
ISO
134
6T
lSI
117
100
n17
17
6T..01
101
100
01
6T
so33
101
ISO...
33
3J
lCO
134...217IH01
I'II
1.1 6!
:3 12
n ..n 62
11 10
n 61
n ..2l 12
so112
1<0
I'"
117
100
17
"1717
61
100
SO
184
84
SO
11
II
11
134
134
'0mU4
84
17
m100
25
31
362 217 451 200 414 '251 384
<462 61 117 S-I 114 117 6f
481 11·17 17·11
5!S ...til .17.17 ·17·11
540 ·17 .33 ·33·11·17
Jl
31
114
sn
,..'09
"'.743
ses61
114
II.,.
""'017
17..64
so134
134
100
'0
11 11
!7
17
01
17
100...so17
17
I'...17
117
B4
SO
11
100
117
61
mISO
100
17
"17-17
3l
,00
33
167
B4
100
11
17
17...B4
33
1>0
13'...so
32J
"-n-I'2.17
J23
410 so so 50 11 11
410 ·17 ·11 ·n .JJ eJl
300 33 11 17 17
319 -33 -11 -ll ·17 -17
so..3'I'.III
ailS
407
4ll.,.'64
')4
610
7:11
90s,..1013
so17
'017
6T
so11
-33
11
so-nsososo6T
'0so-33
17
17
33
11
'033
67
'0n·33
17
'0so
"33so-so
17
17
17
33
33
67
SO
17
-33
-!1
-33
rtr--17
17
67
67
"so-J)
3' 3.I<
so.,61
III
14.109
lSI
-6
ir
soss61.,3.-J.
1.81
2>1

Table D.2 Strain measurements recorded on quartzite prisms (Mix Q2)
A~ IT- RH LOADEDSPE';ThtENS
(Do}') (D<o.C) (") t~WADEDSPECIMENS
"""'oJ """'"~NmlbcrJDilSid:: Sp«i:amNut:lbcrmdSiJe ~eci=nN=b!:rmdSi&::
.,_ A""'8< A""", A""", A""", A""""
• 1 3 -~ • 2 , -CU:l:ll.U:t.h-e • 2 , """"""'" CUruhti"
""'" SIr"" """" ""'" ""'" """"A B A B A n ,.0&61 (xlOE-6) A n A n A n (xllJE.6'J (xlQE.6) A n A n A B (xIOB-6\ (xlQE..6)
0 •• os 0 0 0 0 0 0 0 0 0 0 0 0 0 0 0 0 0 0 0 0 0 0
0.001 •• .. .68 >01 .>1 >0. .,. >I» 'lll .Ill '>1 '01 '01 m ". <10 '54 .,. 0 0 0 0 0 0 0
I 15 10 '34 117 '34 117 .00 rso 12> 6IJI .34 67 iso .. .00 .. .03 ,,, 33 33 33 33 33 33 33 33
1 I. sa 0 j() 11 11 0 so 22 030 ·11 0 11 33 11 ., II >OS ·33 ·11 0 -t , 11 ." ·11 :u3 20 66 33 so 11 51 " " 3. 66a 11 33 11 11 G7 11 '" ,.. 33 0 11 0 0 0 • 30
4 13 60 " 0 0 11 ." 11 a 671 0 ." ·11 ·11 11 -33 -I',., -33 -11 ·33 -11 -11 ·11 -aa S, 2. 66 33 11 67 so 3l so 42 11. 11 11 0 11 11 11 •• ,.. 33 33 11 33 11 11 zs 33
6 21 «6 33 >0 so so >0 3] ., 163 11 11 " >0 so 11 JI 621 3] so ,. 3l so 3l 42 "1 21 '" 3l 3l 11 " 0 33 " "8 11 11 33 33 11 0 10 616 -11 ·11 ·11 0 ·11 0 ·11 61
I< 13 12 '>0 134 '34 184 13. .34 145 ." 33 >0 >0 117 67 67 61 110 33 >0 " 11 33 33 3l st21 22 69 .34 100 117 Ij() IS> .34 131 106< 100 100 100 111 111 84 103 013 67 67 51 67 67 84 70 167
18 22 62 67 67 51 100 >0 84 12 1136 '0 84 67 67 >0 >0 6. 81. >0 3l so '0 67 so so 211
ss 21 10 184 HI-I 200 200 184 200 192 13:8 167 '>0 200 200 184 150 m .0>0 67 67 '" 67 '0 67 67 284
112- 23 63 84 100 100 117 84 111 100 1476 111 111 111 111 1>0 '00 120 1214 67 >0 51 >0 51 so ss 331
I" 22 .. 100 51 100 84 ... 84 86 1:<62 .. 61 '00 100 67 67 .. 12., 3l >0 " 33 33 so as 310
I'" " 12 ·11 0 -11 0 -11 0 -8 .",. 11 " 33 33 33 33 2B 1312 -so -61 -33 -33 ·33 -so -1~ 32S

Table D.3 Strain measurements recorded on granite prisms (Mix G1)
"" T"", RlI LClAI)B) SPECIMENS
(I>.>p) (D<u.C) (") t"!'."LOAI)EDSPECl\WS
""""'" ""'01
Spccinm.NunbcrmdStde ~NumbcrtndSid:: ~Nl.lmbcrItldSi&
A"".. A"""",A_
A""", A"""B< A",,«
I , ) ""=-' CU:m..ililivc 1 , , b=naUl cu.ruhti~ I 2 , """""" t\Jmu!!tive
""'" """" ,.,.., ,.,.., ""'" ""'"A B A B A B (dOE<;) (,,100-6) A 9 A B A B (x10&6) lxlO&6'l A 9 A 9 A 9 h:lD&1lt (xlOE<ij
0 :! 62 0 0 0 0 0 0 0 0 0 • 0 0 0 0 0 0 0 0 0 0 0 0
0.007 21 C52 200 lSI 267 '" 117 m 2",.. '01 '67 '" 16l '67 267 3)5 lIS 0 0 0 0 0 0 0
1 20 66 .. ,.. 100 150 134 167 ,,- 420 >0 ... !l4 67 67 50 .. 31. 0 -17 -17 -17 0 0 -s .a2 II 60 " 50 " !1 " 50 ss m 0 0 0 0 0 0 0 ". 0 0 0 11 .17 11 , -5, 21 66 50 " 50 67 " 50 47 so 11 11 0 17 17 11 14 ,., " " 0 17 " " ~$ 20
4 21 66 " .. 61 100 67 .. 72 >7. 50 " 61 " " " 42 -0.5 " so so " 17 17 " 53
5 11 C52 17 -17 -17 0 0 11 0 ,,- -ll 0 -17 -13 0 0 -14 4" -17 0 -17 0 0 0 -. ,.s 21 66 17 50 13 " J3 " " _'0 0 J7 17 J7 0 0 • 42• J7 0 0 0 0 0 , 50
7 22 63 17 J7 J7 11 J7 " I. "'. 0 0 J7 0 " 0 • 437 0 J7 0 17 -J7 17 6 56
" 24 65 .. 150 .. 167 117 150 '" ", B-1 134 67 B-1 50 .. .. So!! 50 >0 J7 50 " " ,. 95
21 22 .. .. '" B-1 134 100 134 '" 8&:. 61 .. .. .. 100 61 ., 602 50 :;0 61 '0 ., ., ss 153
28 21 60 67 100 ., 100 B-1 100 es m ., .. 67 50 50 50 s 663 " 50 " 50 " " ,6 tsose 21 70 134 200 134 200 150 2CO 110 1122 100 150 134 117 13. m '" 788 ., B-1 67 .. 50 .. 7Z 262
11l 21 7. 117 134 100 134 134 114 125 illS! 150 I,. .134 IJ7 150 117 13(- 991 67 ., 67 .. 67 ., 70 "0140 23 " 17 67 67 6l '0 6l 56 IlH " 67 67 67 67 67 " - lOll 0 " 0 11 0 J3 J4 "..168 24 7. 0 17 0 J7 17 17 11 13" 17 50 17 17 so " " 1093 -17 -17 0 -17 0 -17 -II '"

Table D.4 Strain measurements recorded on granite prisms (Mix G2)
I\IJC T_ RH LOIJ)EJ)SPECIMENS
(!»yo) (D<g.C) (") t"'LOADEDSPECD.!ENS
llida! Sd..
SpcciDl:nNurobcrmdSid:: ~Numbct:mdSide Spe:i:mall-'l.::mbcrmd.Sid:
A"""" A,= A""", A,"'I!< A""m~ A_
• 2 , -~~lIe • 2 , """'="" """""'"'" • : , In=matol """""''''""'" SIr.in ""'" ""'" """" ""'"A B A " A B xlO&6} (xlo&6l A D A B A D (xlCE-6'I (xlOE-6) A D A n A n xlO&6'\ xIOE-CS·
0 12 -, 0 0 0 0 0 0 0 0 0 0 0 0 0 0 0 0 0 0 Q Q 0 0
QD01 12 'OJ •68 '68 '0, sra ... • 90 ,.. ,,, '0' >IS >I. ". so• srs ". 0 0 0 0 0 0 0
• 20 661 t- UO '61 .84 UO "" .61 ." 117 84 84 .00 117 •eo .00 6•• 11 11 " 0 0 0 II 11
2 n w so '" "' 61 '" 6' ne 11 11 II 0 11 0 14 612 0 0 0 11 0 0 ,", 2' 66 61 61 61 ., 61 10 rss " II II " II II " 666 II II II 11 11 II 2. 42, 2. 66 , 61 61 61 '0 61 .. ." '0 3' II ,. sc II 41 "Y! se 33 so '0 '0 so " es
S 2. 62 11 11 11 • 11 11 ., ass ·11 0 0 ·11 0 0 .. 102 0 0 ·11 ·11 ·11 ·11 ·11 t •
6 2. ss 11 II II so 11 so II , 11 II 0 11 rr 11 11 ". n 11 0 n 0 n II ..1 21 "" 13 tt 11 II II n zs 0 n 0 0 n n 8 121 0 0 • • 0 0 0 as.4 2' ss .61 117 "0 .:<1 117 "4 136 " .1 13< .. H7 117 '00 "' ass 61 61 II Jl II II " III
11 l2 69 .34 117 134 .34 .34 .34 13' 1191 111 .00 117 .00 111 .34 II' P51 61 61 so 61 so 51 6' .9'28 11 60 .. 84 100 .. 84 84 86 tllS ., ., 84 '0
., so .. 1016 J3 so 3' so J3 J3 3' n,so 21 ro m .84 '61 '84 .84 184 res ".. 184 200 .61 184 '84 200 '8' 1203 '00 84 ., 51 ., ., 1S ,09III 2' ,. '34 111 '34 .SO •34 .34 .34 .... .SO ISO ISO 134 ,SO UO ". 1414 61 61 61 84 61 SO e: 316
'40 n " 84 II SO 51 '0 61 sa 1111 SO SO so J3 50 '0 41 Wi' n II 0 11 0 II 11 39l,68 " " 0 0 11 0 11 0 6 1123 61 " '0 II II II 42 1:SO' 0 ·11 0 0 0 ·11 ·6 '81
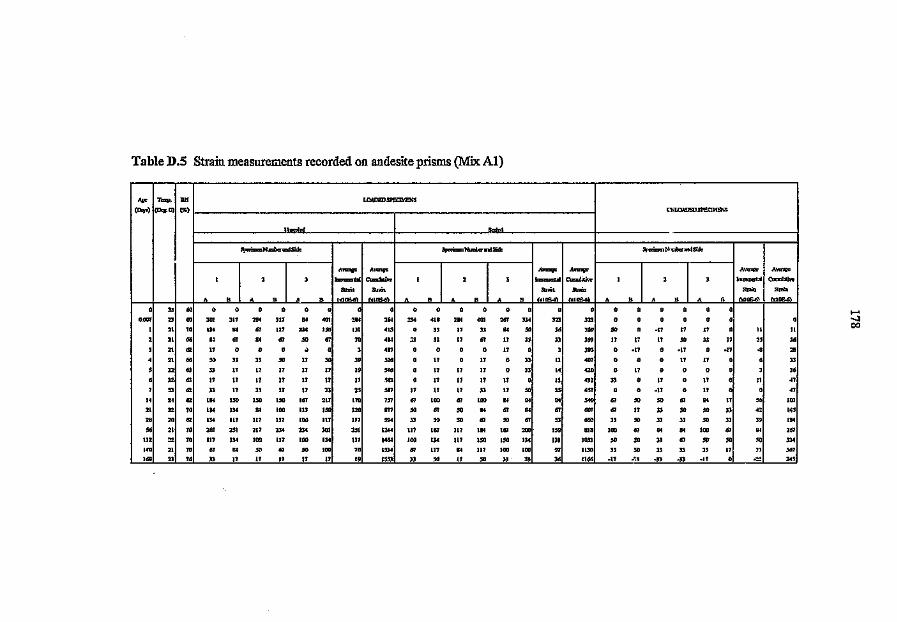
Table D.S Strain measurements recorded on andesite prisms (Mix AI)
All< Taq>. Rlt LQADEDSPECIMENS
(!»yo) (D<u.C) (%) t1't"LOADEDSrECIMENS
..".,.'" """'"~N1lllhttall1Sidc Spttimal Numlx:r md Silk SpccimInNI~mdSi&:
A""'Il< A>=II< A"""", A"""", "'''tToJ1i'C A""",
I 2 1 _,. <>=Ltiv< I 2 ] """"""" CIm>Wli" I 2 ] hrcoud:aI C\mllrtivt
"""" s:r.in SIn.. """" _I ""'"A 0 A n A n xl"",," ,IOJ!.<) A n A n A n (:dOf...6) xlOE-6'l A n A n A n (xlQE..6) "'0&6)
° :!J GO ° 0 0 o o • o o o o o o o o o o o o o o o °aoot 23 00 ]01 '" 2114 317 .. eot "'" "'" :!J4 "S 2114 401 261 '" m ]l] o o o o • ° °I 21 70 1]4 114 61 ll7 214 ". III ." • " IT " 84 SO ]. ". so o -17 IT IT o II II
2 21 66 .. 61 .. 61 so 61 70 ,.. " " IT 61 IT 11 3] ].] IT 17 17 so 3] 17 1S 3.
J 21 62 17 0 o 0 " o 3 487 ° 0 o 0 17 ° 3 3'S • -17 o -17 0 -11 ·s ,.• 21 66 SO " 3] so 17 so 3. S2. 0 IT 0 17 o 3] 11 ,., ° o 0 17 17 0 , 3]
S 22 63 3l IT 11 17 11 11 I',., o IT 17 17 0 3] 14 <20 o 17 o o o 0 ) rs, 22 Ii) 17 17 17 17 17 17 17 '162 o 17 17 17 17 0 II 412 3] • 17 0 17 o 11 41
7 :!J 61 3] 17 3] IT 17 3l 2S S87 17 17 17 3] 17 so lS m o o -17 0 17 0 0 41
14 " '" I'" ISO ISO 10. 161 217 170 7ST 61 100 61 100 .. 84 .. ,.0 61 SO SO 61 S4 IT ,. 1.,
21 22 7. 1]4 I" S4 100 111 ISO 110 8" SO 61 SO tJ.I 67 ., 67 <07 61 IT " SO SO " " I"28 2. 61 134 117 lIT ll7 100 ll7 Il7 ... 3] SO SO 51 SO 67 Sl 660 3] SO 3] 3] SO 3] " 184
56 21 70 267 lSI 2tI 23' ,]4 301 lSI 1144 ll7 167 117 184 167 200 IS. 81n 100 61 " 84 100 51 ., 261
m 22 70 117 I" 100 117 100 13. ll7 1461 100 13' 117 ISO ISO I" III IOJ' so SO " 67 SO SO '0 ll4
140 21 78 67 84 so 67 SO 100 70 IS" 67 117 84 117 100 100 97 1130 3] SO " 3] " 11 " '67168 23 76 3l IT IT 17 17 17 I' 1:551 3l so 17 so ]J 3] 36 1166 -17 p':.l .]J .l3 -17 o ·1~ ,,,

179
t i '! ~ 0 ~ :g :i 0 ~ ::: :; ::: ::: <! 10 §\ Ei ;;; :::-e j .
t 1 j ~0 ; ~ ~ = ~ :::~ ~ ~ fl = ~ ~ ;;;:;<.a ~
o 8 ~ N M ~ ~ ~ ~ ~ N ~ ~ S ~ §d
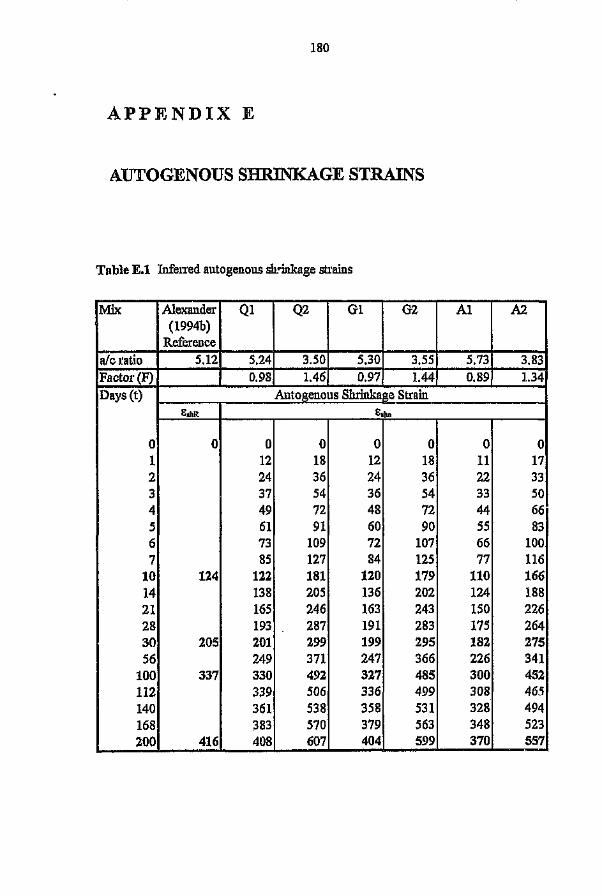
180
APPENDIX E
AUTOGENOUSS~GESTRAlNS
Table E.l Inferred autogenous shrinkage strains
Mix Alexander Ql Q2 Gl G2 Al A2(1994b)Reference
ale ratio 5.12 5.24 3.50 5,30 3.55 5.73 3.83Factor (F) 0.98 l.46 0.97 l.44 0.89 1.34Days (t) Autogenous Shrinkage Strain
eshR est.,
0 0 0 0 0 0 0 01 12 18 12 18 11 172 24 36 24 36 22 333 37 54 36 54 33 504 49 72 48 72 44 665 61 91 60 90 55 836 73 109 72 107 66 1007 85 127 84 125 77 116
10 124 122 181 120 179 110 16614 138 205 136 202 124 18821 165 246 163 243 150 22628 193 287 191 283 175 26430 205 201 299 199 295 182 27556 249 371 247 366 226 341
100 337 330 492 327 485 300 452112 339 506 336 499 308 465140 361 538 358 531 328 494168 383 570 379 563 348 523200 416 408 607 404 599 370 557

181
APPENDIX F
RELATIVE CREEP COEFFICIENT DETAILS
Table F.l Adjusted specific creep values, elastic moduli and relative creep coefficients
Measured Davis and AlexanderM"lXNo. Adjustment Specific Total Creep at 168 Days E Relative E Relative
Factor Actual Adjusted Mean (GPo) Creep (GPp) Creep(xlOE-61 (xl0E-61 forMPa) MPa) Aggregate
(xl0E-61MPa)
QI 0.679 86.359 58.638102 1.193 45.733 54.559 56.599 73 0.92 70 0.96
Gl 0.697 80.653 56.215G2 1.193 51.902 61.919 59.067 70 0.96 60 0.74
Al 0.880 76.997 67.757A2 1.358 51.699 70.207 68.982 89 1.12 95 1.19

1.82
APPENDIX G
SPECIFIC STRAINS OFTEST SPECIMENS
120
1.00~,.-., 80~~UCJ \0 60t:::,'y ~~ .-l
~~ 40
2: ~/,~;:::::::--o 20 40 60
..,._---,",.-,;;;,....---- ....-------160120 140 18080 100
Time Since Loading (Days)
Figure G.l Specific strains versus time since loading for mix Ql specimens
120 r:=!::~~::1100 ~·---- __ -- __ ---- __ ------------ __ --~------~J·I
2
0
0 .~r-;:;.::;':.7~,J-J~·~-):_-~:-,---------.;;..-----.- _-_-_--_ -_-_-...:::~...:::;"'=._::=:::;:::;:-=.'.:=' ===-:
.. '..
o 20 40 60
~.-.----------------------------------Ir
80 100 120 180140 160Time Since Loading (Days)
Figure G.2 Specific strains versus time siuce leading for mix Q2 specimens

183
120
100
o 20 40 60 80 100 120 140 160 180Time Since Loading (Days)
Figure G.3 Specific strains versus time since loading for mix G1 specimens
120
:,:'-. --- ---_.""
o 20 40 60 80 100 120 140 160 180Time Since Loading (Days)
Figure G.4 Specific strains versus time since loading for mix G2 specimens

184
120-D-Total Creep-,,:,~ BasicCreep100
o 20 40 60 80 100 120 140 160 180Time Since Loading (Days)
Figure G.5 Specific strains versus time since loading for mix Al specimens
120
100
80 100 120 140 160 180Time Since Loading (Days)
Figure G.6 Specific strains versus time since loading for mix A2 specimens
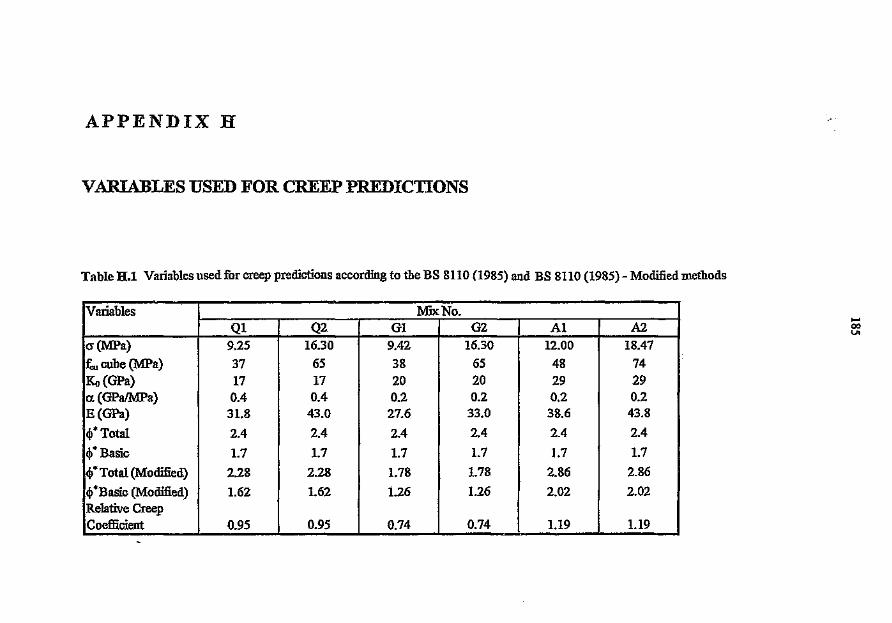
APPENDIX H
VARIABLES USED FOR CREEP PREDICTIONS
Table H.! Variables used for creep predictions according to the BS 8110 (1985) and BS 8110 (1985) - Modified methods
Variables MixNo.Q1 Q2 Gl G2 Al A2
cr(MPa) 9.25 16.30 9.42 16.30 12.00 18.47:f;,..cube(MPa) 37 65 38 65 48 74Ko(GPa) 17 17 20 20 29 29a. (GPa/MPa) 0.4 0.4 0.2 0.2 0.2 0.2E(GPa) 31.8 43.0 27.6 33.0 38.6 43.8
cjJ*Total 2.4 2.4 2.4 2.4 2.4 2.4
<j>* Basic 1.7 1.7 1.7 1.7 1.7 1.7
<1>* Total (Modified) 2.28 2.28 1.78 1.78 2.86 2.86
cjJ"Basic (Modified) 1.62 1.62 1.26 1.26 2.02 2.02Relative CreepCoefficient 0.95 0.95 0.74 0.74 1.19 1.19-
.....00VI

186
Table B.2 Calculated ratio of final creep assumed to develop at different loading ages
(BS siro, 1985)
Age Ratio of(Days) Final Creep
0 01 0.0292 0.1063 0.1524 0.1845 0.2096 0.2297 0.24714 0.32421 0.37028 0.40256 0.479
112 0.557140 0.582168 0.603

Table B.3 Variables used for creep predictions according to the ACI 209 (1992) method
Variables Mix No.Q1 Q2 Gl G2 Al A2
c (MPa) 9.25 16.30 9.42 16.30 12.00 18.47£:u cube (MPa) 37 65 38 65 48 74£:u cyl (MPa) 30 55 31 55 38.5 62.7E(GPa) 27.691 37.494 28.149 37.494 35.372 45.140
P concrete (kg/nr') 2400 2400 2400 2400 2600 I 2600Slump (rnm) 90 50 115 70 95
I55
\fI 43.7 39.8 47.7 44.2 43.1 39.2Yl (for r = 28 days) 0.844 0.844 0.844 0.844 0.844 0.844Yz Total creep 0.835 0.835 0.835 0.835 0.835 0.835yzBasic creep 0.6 0.6 0.6 0.6 0.6 0.6Y3 (forh,,= 100mm) 1.11 1.11 1.11 1.11 1.11 1.1114 1.058 0.952 1.124 1.005 l.071 0.965
15 0.985 0.976 0.994 0.986 0.983 0.97416 1 1 1 1 1 1cp*Total 1.915 1.708 2.053 1.821 1.935 1.728cp*Basic 1.376 1.227 1.475 1.309 1.390 1.242

188
Table H.4 Variables used for creep predictions according to the AS 3600 (1988)
method
Variables Mix No.QI GI Al
o (MPa) 9.25 9.42 12.00(", cube (MPa) 37 38 48.(., cy1.(l\1Pa) 30 31 38.5E (GPa) 27.691 28.149 35.372P concrete (kg/nr') 2400 2400 2600$cc.b 2.8 2.7 2.1k3 1.1 1.1 1.1th (mm) Total creep 50 50 50th (mm)Basic creep 400 400 400Environment Tropical and Near Coastal
Table H.S Creep factor coefficients (k2) for different ages after loading
(after AS 3600, 1988)
Age Creep Factor Coefficient (k2)(Days) Total Creep Basic Creep
1. 0.09 0.012 0.12 0.013 0.16 0.024 0.18 0.025 020 0.026 0.22 0.027 0.24 0.0214 0.34 0.0421 0.39 0.0528 0.47 0.0656 0.54 0.08
112 0.66 0.12 .140 0.67 0.12168 0.68 0.14

Table H.6 Variables used for creep predictions according to the eEB-PIP (1970) method
Variables MixNo.Ql Q2 Gl G2 Al A2
cr(MPa) 9.25 16.30 9.42 16.30 12.00 18.47£:u cube (MPa) 37 65 38 65 48 74£:u cyL (MPa) 30 55 31 55 38.5 62.7E(GPa) 32.534 44.052 33.073 44.052 36.857 47.035k, Total creep 2.38 2.38 2.38 2.38 2.38 2.38kl Basic creep 1 1 1 1 1 1k2 1.004 1.004 1.004 1.004 1.004 1.004k3 (for wlc = 0.56) 1.242 1.242 1.242 1.242 1.242 1.242k3 (for w/c = 0.4) 1.035 1.035 1.035 1.035 1.035 1.035
l~(mm)1.191 1.191 1.191 1.191 1.191 1.19150 50 50 50 50 50
......00\0

190
Table n.7 Calculated k, coefficients for different loading ages (after CEB-FIP, 1970)
Age ks(Days)
0 01 0.0742 0.1223 0.1624 0.1955 0.2256 0.2517 0.27514 0.39821 0.47728 0.53556 0.667112 0.777140 0.807168 0.828

Table H.8 Variables used for creep predictions according to the CEB-FIP (1978) memod
Variables MixNo.Q1 Q2 Gl G2 Al A2
c (MPa) 9.25 16.30 9.42 16.30 12.00 18.47(~1cube (MPa) 37 65 38 65 48 74feu cyl, (MPa) 30 55 31 55 38.5 62.7E (GPa) 29.519 36.128 29.843 36.128 32.078 37.741<!>d 0.4 0.4 0.4 0.4 0.4 0.4j3n (r) 0.253 0.253 0.253 0.253 0.253 0.253
Table H.9 Flow coefficient variables used for creep predictions according to the CEB-FIP (1978) method
Creep Type Variable
<Po <!>f2 cPr A. A., (mnr') u h.,Total Creep 2.278 1.8 4.078 1.33 1.00E+04 400 66.5Basic Creep 0.8 1.173 1.973 30 1.00E+04 400 1500

192
Table H.lO Calculated values of the j3d(t - "C) and j3r(t) - j3r("C)functions for different
ages of loading (CEB-FJP, 1978)
Duration of Load j3r(t) - j3f("C)(Days) j3d(t - "C) Total Creep Basic Creep
1 0.277 0.102 0.1092 0.284 0.137 0.1313 0.291 0.162 0.1464 0.299 0.182 0.1585 0.306 0.200 0.1686 0.313 0.216 0.1767 0.319 0.230 0.18414 0.365 0.305 0.22121 0.408 0.359 0.24628 0.448 0.402 0.26556 0.583 0.522 0.318112 0.762 0.656 0.380140 0.820 0.699 0.402168 0.864 0.734 0.421

Table B.ll Variables used for creep predictions according to the eEB-FIP (1990) method
..Variables Mix No.
Ql Q2 Gl G2 Al A2cr(MPa) 9.25 16.30 9.42 16.30 12.00 18.47(", cube (MPa) 37 65 38 65 48 74(",cyl (MPa) 30 55 31 55 38.5 62.7E(GPa) 31.072 38.030 31.414 i 38.030 33.767 39.727Q>RHTotal creep 1.95 1.95 1.95 1.95 1.95 1.95<PRHBasiccreep 1 1 1 1 1 1A.,(mm2) 10000 10000 10000 10000 10000 10000u(mm) 400 400 400 400 400 400,ho(mm) 50 50 50 50 50 50P(fcm) 2.762 2.084 2.725 2.084 2.425 1.953to (days) 28 28 28 28 28 28~ (to) 0.4885 0.4885 0.4885 0.4885 0.4885 0.4885<PoTotal creep 2.630 1.985 2.595 1.985 ~.310 1.860$0 Basic creep 1.349 1.018 1.331 1.018 1.185 0.954PHTotal creep 326 326 326 326 326 326i3HBasic creep 1500 1500 1500 1500 1500 1500

194
Table H.12 Calculated values of the Pc (t - to) function for different ages ofloading
(after CEB-FIP, 1990)
Duration of Load [30 (t - to)(Days) Total Creep Basic Creep
1 0.176 0.1112 0.217 0.1373 0.244 0.1554 0.266 0.1695 0.284 0.1806 0.300 0.1917 0.314 0.20014 0.384 0.24521 0.431 0.27728 0.467 0.30156 0.562 0.369112 0.664 0.449140 0.697 0.478168 0.724 0.502
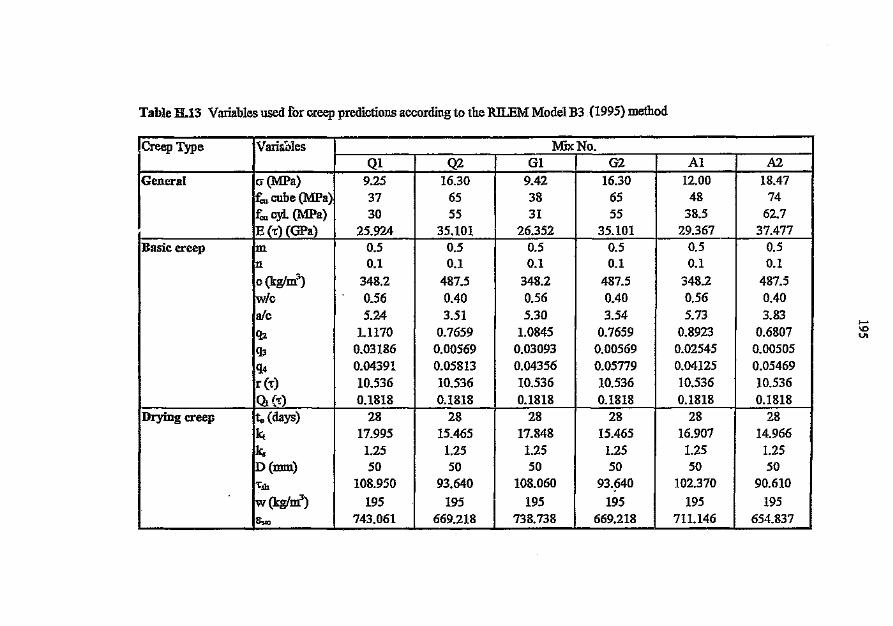
Table H.13 Variables used for creep predictions according to the R1LEM Model B3 .(1995) method
[Creep Type Variables Mix No.Ql Q2 Gl G2 Al A2
General cr(MPa) 9.25 16.30 9.42 16.30 12.00 18.47t;,." cube (MPa) 37 65 38 65 48 74£:u cyl (MPa) 30 55 31 55 38.5 62.7E (r) (GPa) 25.924 35.101 26.352 35.101 29.367 37.477
Basic creep m 0.5 0.5 0.5 0.5 0.5 0.5n 0.1 0.1 0.1 0.1 0.1 0.1c Ikg/nr') 348.2 487.5 348.2 487.5 348.2 487.5w/c 0.56 0.40 0.56 0.40 0.56 0.40ale 5.24 3.51 5.30 3.54 5.73 3.83q2 1.1170 0.7659 1.0845 0.7659 0.8923 0.6807q3 0.03186 0.00569 0.03093 0.00569 0.02545 0.00505q4 0.04391 0.05813 0.04356 0.05779 0.04125 0.05469r (r) 10.536 10.536 10.536 10.536 10.536 10.536<1('r) 0.1818 0.1818 0.1818 0.1818 0.1818 0.1818
Drying creep to (days) 28 28 28 28 28 28let 17.995 15.465 17.848 15.465 16.907 14.966k, 1.25 1.25 1.25 1.25 1.25 1.25D(mm) 50 50 50 50 50 50't"sh 108.950 93.640 108.060 93.640 102.370 90.610w(kglm3
) 195 195 195 195 195 195E,:c 743.061 669.218 738.738 669.218 711.146 654.837

196
Table H.14 Calculated values of the Z (t, 'C) and Q (t, 'C) functions for different ages
ofloading required for the prediction of basic creep (RILEM Model B3,
1995)
Days Function(t - 't) Z (t, 't) Q (t, r)
1 0.131 0.13]2 0.138 0.1373 0.142 0.1414 0.145 0.1435 0.147 0.1456 0.149 0.1477 0.150 0.14814 0.158 0.15521 0.162 0.15828 0.165 0.16056 0.173 0.165112 0.181 0.170140 0.183 0.171168 0.186 0.172

Table B.1S CalculatedvaluesoftheE (t) fordifferentages ofloadingrequiredforthe predictionofdryingcreep(RILEM Model B3, 1995)
Days E(t) (MFa)(t) MixQ1 MixQ2 MixG1 MixG2 MixA1 MixA2
29 26082 35315 26512 35315 29546 3770530 26143 35397 26574 35397 29615 3779331 26200 35475 26633 35475 29680 3787632 26254 35548 26688 35548 29741 3795433 26305 35617 26740 35617 29799 3802834 26354 35683 26789 35683 29854 3809835 26400 35745 26836 35745 29906 3816542 26664 36103 27105 36103 30206 3854749 26858 36366 27302 36366 30425 3882856 27007 36567 27453 36567 30593 39042
112 27546 37297 28001 37297 31204 39822140 27658 37448 28114 37448 31331 39983168 27733 37550 28191 37550 31416 40092196 27787 37623 28246 37623 31477 40170

Table H.16 Calculated values of Ssh"" S(t), H(t) and q5 at different ages of loading for quartzite-aggregate concretes (RlLEM Model B3, 1995)
Duration of'Load Mix No.(t --r) Q1 Q2(Days) &sh<o Set) H(t) q5 &sho> Set) R(t) qs
1 3273.509 0.096 0.967 1.354 3319.265 0.103 0.964 0.7322 3265.883 0.135 0.953 1.356 3311.532 0.145 0.949 0.7333 3258.732 0.164 0.942 1.357 3304.282 0.177 0.938 0.7344 3252.015 0.189 0.934 1.359 3297.471 0.204 0.929 0.735
5 3245.692 O.2ll 0.926 1.361 3291.059 0.227 0.921 0.736
6 3239.729 0.230 0.919 1.362 3285.013 0.248 0.913 0.737
7 3234.097 0.2481 0.913 1.364 3279.303 0.267 0.907 0.738
14 3201.996 0.344 0.880 1.372 3246.753 0.368 0.871 0.74221 3178.868 0.413 0.856 1.378 3123.302 0.441 0.846 0.74528 3161.412 0.468 0.836 1.382 3205.601 0.498 0.826 0.74856 3120.299 0.615 0.785 1.393 3163.914 0.649 0.773 0.754112 3087.015 0.767 0.731 1.402 3130.165 0.798 0.721 0.758140 3078.638 0.812 0.716 1.404 3121.670 0.840 0.706 0.760168 3072.640 0.846 0.704 1.406 3115.589 0.872 0.695 0.761

Tabl e H.17 Calculated values of 8sh"" S(t), H( t) and q, at different ages ofloading for granite-aggregate concretes (RILEM Model B3, 1995)
Duration of Load Mix No.(t --c) G1 G2(Days) esl>:o Set) H(t) qs esh"" Set) H(t) q5
1 3275.751 0.096 0.966 1.309 3319.265 0.103 0.964 0.7322 3268.119 0.135 0.953 1.311 3311.532 0.145 0.94~ 0.7333 3260.964 0.165 0.942 1.313 3304.282 0.177 0.938 0.7344 3254.242 0.190 0.933 1.315 3297.471 0.204 0.929 0.7355 3247.914 0.212 0.926 1.316 3291.059 0.227 0.921 0.7366 3241.948 0.231 0.919 1.318 3285.013 0.248 0.913 0.7377 3236.312 0.249 0.913 1.319 3279.303 0.267 0.907 0.73814 3204.189 0.345 0.879 1.327 3246.753 0.368 0.871 0.74221 3181.046 0.414 0.855 1.333 3223.302 0.441 0.846 0.74528 3163.577 0.469 0.836 1.337 3205.601 0.4981 0.826 0.74856 3122.436 0.617 0.784 1.348 3163.914 0.649 0.773 0.754112 3089.129 0.769 0.731 1.356 3130.165 0.798 0.721 0.758140 3080.746 0.814 0.715 1.359 3121.670 0.840 0.706 0.760168 3074.744 0.8'i-/1 0.703 1.360 3115.589 0.872 0.695 0.76~

Table H.lS Calculated values Ofcsl,oo,S(t), R(t) and q5 at different agesofloading for andesite-aggregate concretes (RlLEM Model B3, 1995)
,~uration of Load MjxNo.(t - 1:) Al A2(Days) Cs]m Set) R(t) q5 Es]m Set) R(t) qs
1 3291.031 0.099 0.966 1.051 3330.908 0.105 0.963 0.6412 3283.365 0.139 0.951 1.053 3323.148 0.147 0.948 0.6423 3276.176 0.170 0.941 1.054 3315.872 0.180 0.937 0.6434 3269.422 0.195 0.932 1.056 3309.037 0.207 0.928 0.6435 3263.065 0.217 0.924 1.057 3302.603 0.231 0.919 0.6446 3257.071 0.237 0.917 1.058 3296.536 0.252 0.912 0.6457 3251.409 0.256 0.911 1.059 3290.805 0.271 0.905 0.64614 3219.136 0.354 0.876 1.065 3258.141 0.374 0.869 0.65021 3195.884 0.424 0.851 1.070 3234.608 0.447 0.843 0.65228 3178.334 0.480 0.832 1.074 3216.845 0.505 0.823 0.654
56 3137.002 0.629 0.780 1.082 3175.012 0.656 0.770 0.660
112 3103.539 0.780 0.727 1.089 3141.144 0.805 0.718 0.664140 3095.117 0.824 0.712 1.091 3132.620 0.846 0.704 0.665168 3089.087 0.857 0.700 1.092 3126.517 0.877 0.693 0.666
tvoo

APPENDIX I
MEASURED .AND PREDICTED CREEP COEFFICIENTS
Table Ll Measured and predicted total creep coefficients and basic creep coefficients for different ages ofloading for mix Q1
concrete specimens
Duration creec CoclIicient!j> ICrecpFactorof Load Total Creep Basic Creep(D.~.) Measured Predicted Measured Predicted
BS 8110 BS8110 AC1209 AS 3600 CEB-FIP CEB-FIP CEB-FlP RILEM BS 8110 BS 8110 ACI209 AS 36CO CEB-FIP CEB-FlP CEB-FIP RILEM(1985) Modified (1992) (1988) (1970) (1978) (!99Q) ModelB3 (1985) Modified (1992) (1988) (1970) (1978) (l990) ModelB3
(1985) (1995) (1985) (1995)1 0.161 0.069 0.065 0.174 0277 0262 0.782 0.463 0.689 0252 0.049 0.046 0.125 0.031 0.110 0.579 0.150 0.6372 0293 0255 0242 0252 0.370 0.431 0.925 0.570 0.737 0217 0.181 0.172 0.181 0.031 0.181 0.626 0.185 0.6743 0.337 0.3&4 0.346 0.310 0.493 0.573 1.030 0.&43 0.769 0.113 0.258 0.246 0.223 0.062 0241 0.659 0209 0.6984 0.461 0.441 0.419 0.358 0.554 0.689 1.116 0.700 0.794 0.020 0.313 0.298 0257 0.062 0290 0.684 0.228 0.7165 0.469 0.501 0.476 0.398 0.616 0.795 1.191 0.748 0.81S 0.066 0.355 0.338 0.286 0.062 0.334 0.706 0244 0.7316 0.491 0.550 0.523 0.434 0.678 0.887 1.257 0.789 0.833 0.080 0.390 0.371 0.312 0.062 0.373 0.'126 0.257 0.7447 0.586 0.592 0.562 0.466 0.739 0.972 1.318 0.826 0.850 0.061 0.419 0399 0.335 0.062 0.408 0.743 0269 0.75614 0.842 G.778 0.i39 0.627 1.047 1.407 1.&43 1.010 0.936 0.069 0.551 0.525 0.451 0.U3 0.591 0.835 0.331 0.81621 1.033 0.887 0.843 0.734 1.201 1.686 1.880 1.134 0.999 0.252 0.628 0.599 0.527 0.154 0.708 0.902 0.373 0.85928 1.113 0.9&41 0.916 0.813 1.448 1.891 2.072 1.229 1.049 0276 0.683 0.651 0.585 0.185 0.795 0.956 0.406 0.89256 1516 1.151 1.093 1.011 1.663 2.358 2.614 1.479 1.191 0.546 0.815 0.777 0.727 0.246 0.991 1.114 0.498 0.986112 1.882 1.337 1.270 1.205 2.033 2.747 3.233 1.748 1.359 0.724 0.947 0.903 0.866 0.370 1.154 1.308 0.606 1.093140 1.992 1.397 1.327 1.2&4 2.0&4 2.853 3.433 1.834 1.416 0.897 0.990 0.943 0.908 0.370 1.199 1.375 0.&45 1.130168 2.102 1.446 1.374 1.310 2.094 2.927 3.591 1.904 1.462 0.906 1.024 0.976 0.941 0.431 1.230 1.430 0.678 1.161
tvo

Table L2 Measured and predicted total creep coefficients and basic creep coefficients for different ages ofloading for mix Q2
concrete specimens
Duration Creep Coefficient G> (Creep Factor)of Load Total Creep Basic Creep(Days) Measured Predicted Measured Predicted
BSS110 BS 8110 ACI209 CEB-FIP CEB-FIP CEB-FIP RILEM BS 81I0 B38110 ACI209 CEB-FIP CEB-FIP CEB-FIP RILEM(1985) Modified (1992) (1970) (1978) (1990) ModelB3 (1985) Modified (1992) (1970) (1978) (1990) Mode1B3
(1985) (1995) (1985) (1995)1 0.185 0.069 0.065 0.155 0.218 0.782 0.349 0.579 0.182 0.049 0.046 0.112 0.092 0.579 0.113 0.540
~ 0.252 0.255 0.242 0.225 0.359 0.925 0.430 0.624 0.167 0.181 0.172 0.162 0.151 0.626 0.140 0.576
" 0.314 0.364 0.346 0.277 0.477 1.030 0.485 0.655 0.188 0.258 0.246 0.199 0.201 0.659 0.158 0.6014 0.376 0.441 0.419 0.319 0.574 1.116 0.528 0.681 0.120 0.313 0.298 0.229 0.241 0.684 0.172 0.6215 0.409 0.501 0.476 0.355 0.663 1.191 0.564 0.703 0.109 0.355 0.338 0.255 0.279 0.706 0.184 0.6386 0.415 0.550 0.523 0.387 0.739 1.257 0.596 0.723 0.136 0.390 0.371 0.278 0.311 0.726 0.194 0.6547 0.488 0.592 0.562 0.415 0.810 1.318 0.623 0.740 0.139 0.419 0.399 0.299 0.340 0.743 0.203 0.66814 0.713 0.778 0.739 0.560 1.173 1.643 0.762 0.840 0.109 ".551 0.525 0.402 0.493 0.835 0.250 0.74721 0.837 0.887 0.843 0.655 1.405 1.880 0.856 0.915 0.242 0.628 0.599 0.470 0.590 0.902 0.282 080728 0.882 0.964 0.916 0.726 1.576 2072 0.927 0.977 0.285 0.683 0.651 0.521 0.662 0.956 0.307 0.85656 1.135 1.151 1.093 0.902 1.965 2.614 1.116 1.156 0.481 0.815 0.777 0.648 1).826 1.114 0.376 0.99/112 1.337 ].337 1.270 1.075 2.289 3.233 1.3]9 1.370 0.544 0.947 0.903 0.772 0.962 1.30S 0.457 1.1661140 1.433 ].397 1.327 1.127 2.377 3.433 1.384 1.443 0.649 0.990 0.943 0.810 0.999 1.375 0.487 1.2251168 1.506 1.446 1.374 1.168 2.439 3.591 1.436 1.504 0.640 1.024 0.976 0.839 1.025 1.430 0.511 1.2741
IVoN

Table L3 Measured and predicted total creep coefficients and basic creep coefficients for different ages ofloading for mix Gl
concrete specimens
Duration Creec Coefficient 4t (Creep FactorcfLcad Total Creep DasioC!~(D.)~) Measured
M8ll0Predicted MeasureJ~~ Predicted
DS8110 AC1209 AS 3600 CED-FIP CED-FIP CED FIP R.lLEM I DS 8110 DS 3110 AC1209 AS 3600 CED-Fll' CED-FlP CEll-FIP R.lLEM(1985) Modified (1992) (1988) (1970) (1978) (1990) Mode1D3 (1985) Modified (1992) (1988) (1970) (1978) (1990) ModalD3
(198j) (l995) (l985) (l995)1 0.448 0.069 0.051 0.187 0.267 0.262 0.782 0.457 0.680 0.144 0.049 0.036 0.134 0.030 0.110 0.579 0.148 0.6292 0.552 0.255 0.189 0.270 0.356 0.431 0.925 0.562 0.728 0.111 0.181 0.134 0.194 0.030 0.181 0.626 0.183 0.6653 0.621 0.364 0.270 0.333 0.475 J.573 1.030 0.634 0.759 0.116 0.258 0.191 0.239 0.059 0.241 0.659 0.206 0.6894 0.742 0.441 0.327 0.3&4 0.535 0.689 1.116 0.691 0.784 0.199 0.313 0.232 0.276 0.059 0.290 0.684 0.225 0.707s 0.759 0.501 0.372 0.427 0.594 0.795 1.191 0.738 0.805 0.127 0.355 0.263 0.307 0.059 0.334 0.706 0.240 0.722
~0.8~ 0.550 0.408 0.'165 0.653 887 1.257 0.779 0.823 0.1I7 0.390 0.289 0.334 0.059 0.373 0.726 0.254 0.7350.898 0.592 0.439 0.499 0.713 0.972 1.318 0.81) 0.839 0.106 0.419 0.311 0.359 0.059 0.408 0.743 0.266 0.747
_~1 1.166 0.778 0.577 0.673 !.OIO 1.407 1.643 0.997 0.925 0.195 O.SSI 0.409 0.483 0.119 0.591 0.835 0.327 0.80721 1.330 0.887 0.658 0.787 !.l58 1.686 1.880 1.119 0.987 0.345 0.628 0.466 0.565 0.149 0.708 0.902 0.368 O.a.;g28 1.485 0.964 0.715 0.872 1.396 1.891 2.072 1.213 1.038 0.438 0.683 0.506 0.627 0.178 0.795 0.956 0.401 0.883.0 1.788 1.151 0.853 1.084 1.604 2.358 2.614 1.459 1.180 0.632 0.8IS 0.604 0.779 0.238 0.991 i.na 0.491 0.977
112 2.160 1.337 0.992 1.292 1.960 2.747 3.233 1.724 1.347 0.952 0.947 0.702 0.928 0.356 1.154 1.308 0.598 1.085I"" 2.289 1397 1.036 1.355 1.990 2.853 3.433 1.810 1.403 1.062 0.990 0.733 0.973 0.356 1.199 1.375 0.636 1.122
-168 2.358 1.446 1.073 1.404 2.020 2.927 3.591 1.878 1.449 1.089 1.024 0.759 1.009 0.416 1.230 1.430 0.669 1.152
tvow
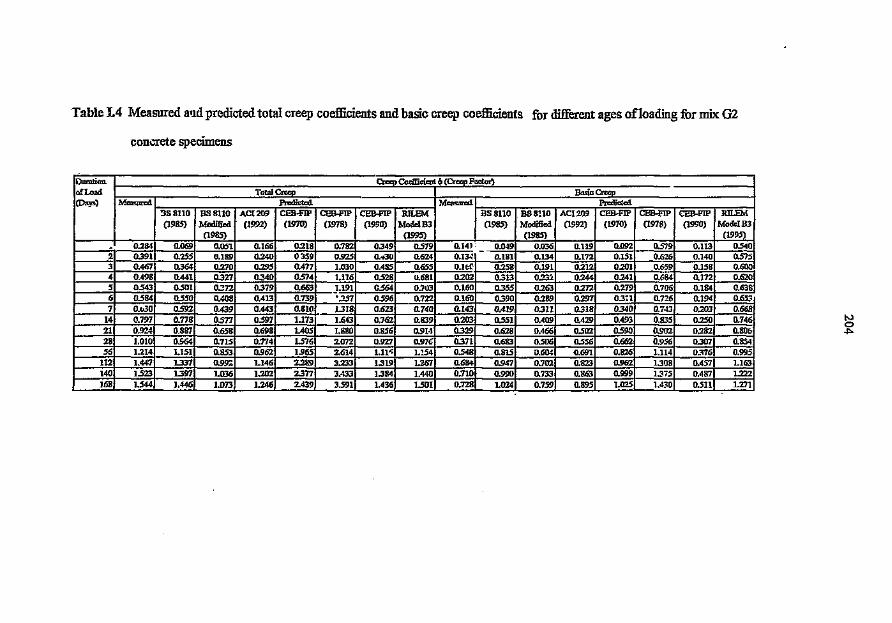
fable L4 Measured and predicted total creep coefficients and basic creep coefficients for different ages ofloading for mix: G2
concrete specimens
Dumtion Creep CoclIicien19 (Creep Factor)of Load Tol:llCreep Basic Creep(Days) Measured Predicted Measured Predicted
3S 8110 BS8110 ACI209 CES-FIP CEB-FIP CEB-FIP RILEM BS81l0 BS8110 AC1209 CEB-FIP CEB-FIP CEB-FIP RILEM(1985) Modified (1992) (1970) (1978) (1990) ModclB3 (1985) Modified (1992) (1970) (1978) (1990) ModeIB3
(1985) (1995) (1985) (1995). 0.284 0.069 o.osi 0.166 0.218 0.782 0.349 0579 0.14) 0.049 0.036 0.1l9 0.092 0579 0.113 05402 0.391 0.255 0.189 0.240 (1359 0.925 0.430 0.624 0.13~· 0.181 0.134 0.172 0.151 0.626 0.140 0.5753 0.467 0.364 0.270 0.295 0.477 1.030 0.485 0.655 o.iec 0.258 0.191 0.212 0.201 0.659 0.158 0.6004 0.498 0.441 0.327 0.340 05741 1.116 0528 u.681 0.202 0.313 0.232. 0.244 0.241 0.684 0.172 0.6205 0543 0501 0'::12 0.379 0.663 ].191 0.564 0.703 0.160 0"55 0.263 0.277. 0.279 0.706 0.184 0.6386 0584 0550 0.408 0.413 0.739 '.257 0.596 0.722 0.160 0.390 0.289 0.297 0.3:1 0.726 0.194 0.65:7 0.030 0.592 0.439 0.443 0.810 1318 0.623 0.740 0.143 0.419 0.311 0.318 0.340 0.743 0.203 0.66814 fJ.797 0.778 0577 0597 1.173 1.643 0.762 0.839 0.203 0551 0.409 0.429 0.493 0.835 0.250 0.74621 0.924 0.887 0.658 0.698 1.405 1.880 0.856 0.914 0.329 0.628 0.466 0.502 0.590 0.902 0.282 0.80628 1.010 0.$64 0.715 0.774 1.575 2.072 0.927 0.976 0.371 0.683 0.506 0.556 0.662 0.956 0.307 0.85456 1.214 1.151 0.853 0.962 1.965 2.614 1.11~ 1.:54 0548 0.815 0.604 0.691 0.826 1.114 0376 0.995112 1.447 1.337 0.99: 1.146 2.2&9 3.233 1.319 1.367 0.684 0.947 0.702 0.823 0.962 1.308 0.457 1.163140 1523 1.397 1.036 1.202 2.317 3.433 1.384 1.440 0.710 0.990 0.733 0.863 0.999 1375 0.487 1.222168 1.544 1.446 1.073 1.246 2.439 3.591 1.436 1.501 0.728 1.024 0.759 0.895 J.()25 1.430 0.511 1.271

Table L5 Measured and predicted total creep coefficients and basic creep coefficients for different ages ofloading for mix Al
concrete specimens
Duration C",,,,, Coefficient 4> (C""" Factor)of Load Total Creep Basic Crr:g>_ --(Days) Measured Predicted Measured Predicted
! BS8ll0 BS8ll0 ACI209 .AS 3600 CEB·F!P CEB·FIP CEB-HP RILEM ! BS 81I0 BS8ll0 ACI209 .AS 3600 CEB·F!P CEB·F!P CEB·F!P RILEMI ~19~5) Modified (1992) (1~88) (1970) (1978) (1990) ModelB3 I (1985) Modifi:::d (1992) (1988) (1970) (1978) (1990) ModelB3(1985) (1995) (1985) (1995)
1 0.390 0.069 o. ~~32 0.176 0.208 0.262 0.782 0.407 0.624 0.072 0.049 0.058 o.U6 0.023 o.no 0.579 0.132 O.5n2 0.535 0.255 ~,i04 0.255 0.277 0.431 0.925 O.SOO 0.668 0.136 0.181 0.215 0.183 0.023 0.181 0.626 0.163 0.6123 0.571 0.364 0.434 0'::13 O.37U 0.573 1.030 0.564 0.698 0.112 0.258 ;).306 0.225 0.046 0.241 0.659 0.183 0.6344 0.680 0.441 0.526 0.361 0.416 0.689 1.116 0.615 0.721 0.1I3 0.313 0.371 0.260 0.046 0.290 0.684 0.200 0.6515 0.734' 0.501 0.597 0.403 0.<:62 0.795 1.191 0657 0.741 0.121 0.355 0.422 0.289 0.046 0.334 0.706 0.214 0.6666 0.752 0.550 0.650 • 0.438 0.508 0.887 1.257 0.693 0.759 0.122 0.390 0.463 0.315 0.046 0373 0.726 0.226 0.6787 0.834 0.592 0.705 0.471 0.554 0.972 131t, 0.725 0.774 0.162 0.419 0.498 0.338 0.046 0.408 0.743 0.236 0.69014 1.205 0.778 0.927 0.634 0.785 1.407 1.643 0.887 0.857 0.266 0551 0.655 0.455 0.092 0.591 0.835 0.291 0.74921 1.45~ 0.887 1.057 0.742 0.901 1.686 1.880 0.990 0.918 0383 0.628 0.747 0.533 J.1I6 0.708 0.9!JZ 0.328 0.79228 1.713 0.964 1.149 0.822 1.086 1.891 "072 1.079 0.967 0.463 0.683 0.812 0.591 0.139 0.795 0.956 0357 0.82656 2.257 !.lSI 1371 1.022 1.247 2358 2.614 1.299 !.l06 o.m 0.E15 0.969 0.734 0.185 0.991 1.114 0.437 0.921112 2.756 1.337 ••593 1.217 1.525 2.747 3.233 1534 1.270 !.lSI 0.947 1.125 0.875 0.277 1.154 1.308 0.532 1.032140 2.874 1.397 1.665 1.277 1.548 2.853 3.433 1.610 1.326 1.373 0.990 1.176 0.917 0.277 1.199 1.375 0.566 1.070168 3.010 1.446 1.723 1323 1.571 2.')]"' 3.591 1.671 1.371 1.419 1.024 1.217 0.951 0.323 1.230 1.430 0.595 1.102

Table L6 Measured and predicted total creep coefficients and basic creep coefficients for different ages ofloading for mix A2
concrete specimens
Duration Creep Coefficient? (Creep Foetor)of Load Totaf Creep BasicCrccp(Dcys} Measured Predicted Measured Predicted
BS8110 BS 8IlU ACI209 CEB-FIP CEB-FIP CEB-FIP RILEM BS8110 BS 8110 ACI209 CEB-FIP CEB-FIP CEB-FIP RILEM(EIII5) .Modified (1992) (1970) (1978) (1990) .ModclB3 (1985) M-Jified (1992) (1970) (1978) \1990) .ModclB3
(1985) (1995) (1985) (1995)1 0.291 0.069 0.082 0.157 0.218 0.782 v.328 0.550 0.153 0.049 0.058 0.113 0.092 0.579 0.106 0.5132 0.384 0.255 0.304 0.227 0.359 0.925 0.403 0.593 0.216 0.181 0.215 0.163 0.15J 0.626 0.1:;1 0.5473 0.390 0.364 0.434 0.280 0.477 1.030 0.455 0.623 0.J78 0.258 0.306 0.201 0.201 0.659 0.148 0.5714 0.471 0.441 0.526 0.323 0.574 1.116 0.495 0.648 0.198 0.313 0.371 0.232 0.241 0.6R4 0.161 0.5915 0.508 0.501 0.597 0.359 0.603 1.191 0.529 0.669 0.198 0.355 0.422 0.258 0.279 0.706 0.172 0.6086 0.:539 0.550 0.656 0.392 0.739 1.257 0.558 0.688 0.197 0.390 0.463 0.281 0.311 0.726 0.182 0.6247 0.607 0.5?2 0.705 0.420 0.810 1.318 0.584 0.706 0.205 0.419 0.498 0.3!l2 0.340 0.743 0.190 0.63814 0.891 0.778 0.927 0.566 1.173 1.643 0.714 0.803 0.304 0.551 0.655 0.407 0.493 0.835 0.234 0.71521 1.070 0.887 1.057 0.662 1.405 1.880 0.802 0.877 0.404 0.628 0.747 0.476 0.590 0.902 0.264 0.77428 1.225 0.964 1.149 0.734 1.576 2_G72 0.869 0.938 0.456 0.683 0.812 0.527 0.662 0.956 0.287 0.82336 1.596 1.151 1.371 0.913 1.965 2.614 1.046 1.115 0.710 0.815 0.969 0.656 0826 1.114 0.352 0.964Jl2 1.924 1.337 1.593 1.087 2289 3.233 1.236 1.326 0.897 0.947 1.125 0.781 0.962 1.308 0.429 1.133140 2.048 1.39, 1.665 1.140 2.377 3.433 1.297 1.398 1.011 0.990 1.176 0.819 0.999 1.375 0.456 1.192168 2.122 1.4461 1.721 1.182 2.439 3.591 1.346 1.458 1.020 1.024 1.217 0.849 1.025 1.430 0.479 1.241

APPENDIX J
MEASURED AND PREDICTED SPECIFIC CREEP VALUES
Table .J.1 Measured and predicted specific total creep and specific basic creep values for different ages ofloading for mix Ql
concrete specimens
Duration Specific Creepof Load Specific'Tctal Creep (xlOE-5J?,Il'o SpecifieD esIc Creep (xlOR-6IMP.(D.},,) Measured Predicted Measured Predicted
DS8110 BS 8110 AC!209 AS 3600 CEh-FlP ICEB-FlP CEB-FlP RILEM BS8110 DS8110 AC1209 AS 3600 CEB-FlP CEB-FlP CEB-FlP RILEM(198~ Modified (1992) (1988) (1970) (l97&) (1990) ModalD3 (198~ Modified (1992) (198S) (1970) (1978) (1990) ModeIB3
(198~ (199~ (198S) (1995)1 6.620 2.160 2.052 6287 1O.0ln 8032 26.490 14.907 26.096 9234 J.j30 1.458 4.518 1.1121 3.375 19.619 4.840 24.1412 12.036 8.020 7.619 9_103 13.347 13241 2 i.m 1 18.336 27.920 7937 5.681 5.413 6.541 1.112 5.j64 - 21.206 5957 2~.5273 13.841 11.447 10.875 11204 17_796 17.583 34.884 20.689 29.131 4 ••24 8.108 7.727 8.050 2.225 7.388 22.309 6.726 26.4244 18957 13.879 13.185 12.920 20.021 21.164 37.812 22.533 30.077 0.721 9.831 9.368 9284 2.225 8.892 23.188 7.331 27.1145 19258 15.765 14977 14.186 22245 24.423 40.344 24.071 30.871 ::.432 11.167 10.642 10.337 2.225 10261 23.933 7.837 276866 20.1'0 17.307 16.441 U.672 24.470 27242 42.599 2$.401 31.565 2.941 12.259 Il.682 11261 2.225 11._ 24.587 8276 28.1827 24.(..,2 18.610 17.679 15.821 26.695 29.847 44.646 26.580 32.187 2245 13.182 12.562 12.087 2.225 12.541 25.174 8.666 28.62414 34.604 24.469 23246 22.655 37.817 43~197 55.670 32.520 35.466 2.533 17.332 16.517 16279 4.449 18.150 28.~87 10.654 3091321 42.427 27.897 26.j02 26.j03 43.379 51.771 63.704 36.502 37.826 9243 19.760 18.830 19.044 5.561 21.752 305'15 12.016 32.52428 45.737 30.329 28.812 29.375 52.277 58.066 70.196 39.555 39.729 10.128 21.183 20.472 21.10g 6.674 24.397 32.3851 13.081 33.80156 62.286 36.188 34.379 36.524 60.063 72.392 88.538 47.598 45.125 20.022 25.633 24.427 26245 8.898 30.417 37.743 16.017 37.334112 77.332 42.047 39945 43.509 73.410 84.331 109534 56244 51.473 26.541 29284 28.382 31264 13.347 35.433 44.316 19.511 41.408140 81 !l45 41.934 41.737 45.630 74.522 87.587 116214 59.030 53.621 32.888 31.120 29.655 3?7&8 13.347 36.801 46.:57& 20.754 42.803168 86.359 45.475 43201 47297 75.635 89.866 121.660 61267 55.378 33218 32.2ll ;10.696 33986 U.572 37.759 48.~28 21.310 43.965

Table J.2 Measured and predicted specific total creep and specific basic creep values for different ages of loading for mix: Q2
concrete specimens
Duration Sl'ecific CreepofLo,d ~recifi"TolDl Creep (x10E-6JMPo) Specific Bnsi., Creep (xl0E-6IMP.)(Do)'» Measured Predicted Measured Predicted
BS8UO BS81l0 ACl209 CEB.,FJp CEB-FIP CEB-FIP RlLEM BS 8110 BS8110 ACl209 CEB-FIP CEB-FIP CEB-FIP RlLEM(1985) Modified (1992) (1970) (1978) (1990) McdelB3 (1985) Modified (1992) (1970) (1978) (1990) Modell'l3
(1985) (1995) (1985) (1995)1 5.605 1.598 1.518 4.141 4.949 21.644 9.190 16.500 5.194 1.132 1.078 2.976 2.079 16.030 2.983 15.~2 7.654 5.931 5.634 5.996 8.158 25.591 1].304 17.777 4.773 4.201 4.003 4.309 3.428 17.326 3.672 ~3 9.533 8.466 8.042 7.380 10.833 28.502 12.754 18.671 5.376 5.996 5.714 5.303 4.552 18.228 4.147 17.1084 llAll 10.264 9.751 8.511 13.040 30.895 13.8S1 19.396 3.418 7.270 6.928 6.116 5.479 18.946 4.519 17.6835 12.436 II.659 11.076 9.476 15.046 32.964 14.839 20.023 3.106 8.258 7.870 6.809 6.322 19.555 4.831 18.1806 12.606 12.799 12.159 10.324 16.785 34.806 15.659 20.584 3.880 9.066 8.639 7.413 7.053 20.089 5.102 .~7 14.826 13.762 13.074 11.081 18.390 36.47'1 16.386 21.096 3.971 9.748 9.290 7.962 7.727 20.569 5.342 19.03114 21.656 18.096 17.191 14.923 26.615 45.486 20.048 23.929 3.113 12.818 12.215 10.723 11.183 23.113 6.568 21.28021 25.413 20.631 19.599 17.458 31.898 52.051 22.503 26.068 6.916 14.613 13.926 12.545 13.403 24.957 7.407 22.97728 26.779 22.429 21.308 19.350 35.777 57.355 24.385 27.833 8.157 15.887 15.140 13.904 15.032 2GA61 8.064 24.37356 34.463 26.162 25.424 24.059 44.604 72.341 29.343 32.936 13.762 18.957 18.065 17.288 18.741 30.838 9.874 28.392112 40.610 31.G95 29.541 28.661 51.960 89.497 34.673 39.034 15.554 22.026 20.989 20.595 21.832 36.209 12.028 33.214140 43.513 32.490 30.866 30.058 53.966 95.036 35.391 41.123 18.543 23.014 21.931 21.598 22.675 38.058 12.794 34.896168 45.733 33.630 31.949 31.156 55.370 99.405 37.770 42.847 18.287 23.821 22.700 22.388 23.265 39.569 13.445 36.308
tvo00

Table J.3 Measured and predicted specific total creep and specific basic creep values for different ages ofloading for mix Gl
concrete specimens
Duration Specific Creepcf'Load Specific Total Creep I x1OE~lMPa Specjj •• Basic Creep ("IO~lMPa)(Da)s) Measured Predicted Measured Predicted
BS81Kl BS8110 ACI209 ASJ60C CEB-FlP CEB-FlP CEB-FlP RILEM BS8110 BS 8110 AC1209 AS 3600 CEB-FlP CEB-FlP CEB-FlP RILEM(1985) Modified (1992) (1988) (1970) (1978) (1990) ModeIB] (1985) Modified (1992) (1988) (191~' (1978) (1990) ModeID3
(1985) (199S) (1985) (1995)1 1~.317 2489 1.~ 6.631 9.496 7.909 26.202 14547 23.8il'1 5.471 1.763 1.307 4.705 1.055 3.323 19.406 4.723 23.8742 18.862 9= 6.853 9.600 12.661 l3.039 'J.981 17.893 27.611 4.197 6.545 4.851 6.898 1.055 5.478 20.975 5.813 25.2483 2I.226 l3.189 9.782 11.816 15.882 17.314 34,j05 20.189 28.814 4.400 9.342 6.924 8.491 2110 7.275 22.067 6.564 26.1404 23.363 15.991 1l.860 l3.626 18.992 20.841 37.402 21.9S9 29.753 7.558 1l.32? 8.395 9.791 2110 8.757 22.937 7.1:54 26.8265 25.95'1 18.164 13.472 15.172 21.102 24.M7 39.906 23.490 30.542 4.807 12866 9.536 10.902 2.UO 10.1M 23.673 7.648 27.3966 29.204 19.940 14.789 16.529 23.212 26.826 42137 24.788 31.232 4.420 14.11A 10.469 11.877 z.no 11.271 24320 8.076 27.8917 30.681 21.442 1~.902 17.741 25.322 29391 44.162 25.938 31.851 4.032 IS.188 1l.257 12.74U 2110 12.349 24.901 8.457 28.33214 39.841 28.193 20.910 23.893 35.873 42536 55.066 31.735 35.118 7.376 19.970 14.801 17.169 4.220 17.872 27.980 10397 30.61921 45.455 32142 23.838 27.95~ 41.149 50.980 63.012 35.621 37.472 13 079 22.767 16.874 20.085 5.275 21.420 ,0.2l3 11.726 3223228 50.773 34.944 25.917 30.981 49.590 57.178 69.434 38.600 39.372 16.607 24.752 18.345 22.262 6331 24.025 32.033 12.765 33.51456 61.115 41.695 30.924 38.521 56.975 71.286 87.576 46.449 44.760 23.;58 29.534 21.890 27 .e79 8.441 29.9S2 37.333 15.630 37.062
112 73.820 48.446 35.931 45.888 69.637 83.04::: 108.345 54.887 5!.l00 36.079 34316 23A34 32.973 12.661 34.892 43.835 19.040 41.1l8140 78.252 50.619 37.543 48.125 70.692 86.249 1IS.OS1 57.606 53.245 40.244 35.855 26.575 34.581 12.661 36.239 46.072 20.253 42.562168 80.616 52.395 38.860 49.883 71.747 88.493 120.340 59.788 55.000 41.265 37.113 27.507 35.844 14.711 37.182 47.902 21.283 43.732

Table J.4 Measured ann predicted specific total creep and specific basic creep values for different ages ofloading for mix G2
concrete specimens
Durntion ~. Soecific Creeoof Load f..:,.- Specific Total Creep (x10E-6lMPn) ~ecifie Bosie Cr~ (x!OE-6lMPn)(D.}"s) ;,: . ",.<.:1 Predicted Measured Predicted
BS8110 BS8110 ACI209 CEB·F1P CEB·FIP CEB-FIP RILEM BS8110 BS 8110 AC1209 CEB·F1P CEB·FIP CEB·FIP RILEM(1985) Modified (1992) (1970) (1978) (1990) M:odelB3 (1985) Modified (1992) (1970) (1978:- (1990) Mode1B3
(1985) ·1995) (1985) (1995)1 :::554 2.082 1.544 4.416 4.949 21.644 9.190 16.498 5.031 1.474 1.093 3.173 2.079 16.030 2.983 15.3742 D.140 7.728 5.732 6.394 8.153 25.591 11.304 17.774 4.785 5.471 4.057 4.594 3.428 17.326 c672 16.395- "' • 1473 15.701 11.031 8.181 7.869 10.833 28.502 12.754 18.666 5.706 7.8 ., 5.655 4.552 18.22P 17.1034 16.726 13.374 9.919 9.075 13.040 30.895 13.891 19.390 7.178 9.4 ! 6.521 5.479 18.9·, 519 17.677
6.321 19.555.
4.831 18.1725 18.263 15.192 11.267 10.104 15.046 32.954 14.839 20.015 5.706 10.7, s 7.261f\ 19.629 16.677 12.369 11.008 16.785 34.806 15.659 20.574 5.706 11.813 L J;jtJ 7.910 7.053 2~.nS9 5.102 .~7 21.166 17.933 13.300 11.815 18.390 36.479 16.386 21.085 5.092 12.702 9.415 8.490 7.727 20.569 5.342 •. .nO14 26.801 23.579 17.488 15.912 26.615 45.486 20.048 23.909 7.239 16.702 12.379 11.434 11.183 23.113 6.568 21.26021 31.070 26.882 19.938 18.615 31.898 52.051 22.503 26.041 11.718 19.042 14.113 13.376 13.403 24.957 7.407 22.94928 33.972 29.226 21.676 20.633 35.777 57.355 24.385 27.798 13.190 20.702 15.343 14.826 15.032 26.461 8.064 24.33956 40.803 34.872 25.863 25.654 44.604 72.341 29.343 32.881 19.509 24.701 18.308 18.434 18.741 30.838 9.874 28.338112 48.657 40.518 30.051 30.560 51.960 89.497 34.673 38.955 24.356 28.701 21.272 21.960 21.832 36.209 12.028 33.134140 51.219 42.336 31.399 32.050 53.966 95.036 36.391 41.035 25.276 29.988 22.226 23.030 22.675 38.()58 12.794 34.808168 5U02 43.821 32.501 33.221 55.370 99.405 37.710 42.751 25.890 31.040 23.006 23.871 23.265 39.569 13.445 36.212

Table J.5 Measured and predicted specific total creep and specific basic creep values for different ages ofloading for mix Al
concrete specimens
Duration Specific CreepofI .oed SE<oifioTolal Cre"l'_(xIOiUIMPal Specific Basic Creep ("IOE-6IMP.(D.}.) Measured Predicted Measured Predicted
liS 8110 BSSllO ACI209 AS 3600 CEB-Fll' CEB-Fll' CEB-Fll' RllEM BS8110 BS8110 ACI209 AS 3600 CEB-Fll' CEB-Fll' CEB-Fll' RlLEM(1985) Modified (1992) (1988) (1970) (1978) (1990) ModelB3 ('985) Modified (1992) (1988) (1970) (1978) (1990) ModelB3
(1985) (1995) (1985) (1995)1 9.965 1.780 2.121 4.973 5.878 7.098 24.377 12.~ 21.245 2.088 1.261 1.498 3.537 0.653 2.982 18.054 3.910 19.6702 13.676 6.607 7.873 7.200 7.837 Il.102 28.822 14.314 22.756 3.954 4.680 5.561 5.122 0.653 4.917 19514 4.813 20.8283 14.60<1 9.431 11.238 8.862 IOM9 15538 32.101 16.715 23.770 3.269 G.6s{) 7.937 6.3M 1306 6.529 20530 5.434 21.5874 17.388 11.434 13.626 10.220 11.755 18.7M 34.796 18.205 24.568 3.281 8.099 9.624 7.270 1.306 7.859 21338 5.923 22.177S 18.779 12.988 15.477 11.379 13.061 21581 37.126 19.447 25.2U 3.524 9.200 10.932 8.094 1.306 9.068 22.024 6.332 22.6706 19.243 14.258 16.990 12.397 14.367 24.075 39.201 20522 25.832 3.535 10.099 12.000 8.818 1.306 10.116 22.625 6.686 23.1017 21.331 15.331 18.270 13.106 15.673 26.377 41.085 21.474 26363 4.706 10.860 12.904 9.465 1.306 11.083 23.166 7.001 23.48614 30.840 20.158 24.022 17.920, 22.204 38.175 51.229 26.273 29.194 7.747 14.279 16.967 12.747 2.612 16.040 26.031 8.608 25.51121 37.335 22.982 27.387 20.964 25.469 45.752 58.622 29.491 31.252 11.147 16.279 19.343 14.912 3.265 19.224 28.10g 9.708 26.95928 43.829 24.986 29.775 23.236 30.694 51.315 64596 31.957 32.920 13.471 17.698 21.030 16.528 3.918 21.561 29.802 10.568 28.11856 57.746 29.8- 35527 28.891 35.265 63.976 81.475 38.455 37.665 22.442 21.117 25.092 20551 5.224 26.881 34.732 12.940 31.356112 70.503 34.( .} 41.279 34.417 43.102 74.527 100.796 45.440 43.252 33.468 24.S37 29.155 24.481 7.837 31.314 40.781 15.763 35.127140 73518 36.194 43.131 36.094 43.755 77.41» 107.035 47.692 45.142 39.919 25.637 30.463 25.674 7.837 32.523 42.862 16.768 36.425
,__ 168 7G.997 37.464 44.644 37.413 44.408 79.419 HI.955 49.499 46.688 41.268 26.537 31.532 26.613 9.143 33.369 44.564 17.620 37.508
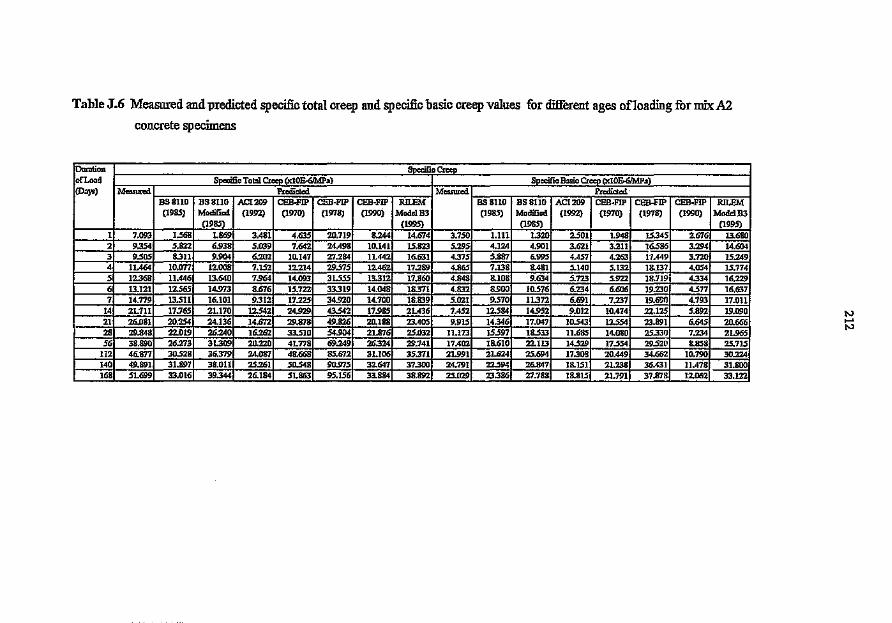
Table J.G Measured and predicted specific total creep and specific basic creep values for different ages ofIoading for mix A2
concrete specimens
Duration Specific Creepof Load Specific Total Creep (lClOE-&MP.) Specific Basic Creep ("10E~/MPa)(Days) Measured Predicted Measured Predicted'
BSBIlO BS SIlO ACI209 CEB-FIP ICEB-FIP CEB-FIP R1LEM BS 81I0 BS 8110 ACI209 CEB-FIP CEB-FlP CEB-FIP RILEM(1985) Modified (1992) (1970) (1978) (1990) ModelB3 (1985) Modllied (1992) (1970) (1978) (1990) ModelB3
(1985) (1995) (1985) (1995)1 7.093 1.568 1.869 3.481 4.635 20.719 8.244 14.674 3.750 Ull 1.320 2501 1.948 15.345 2.676 13.6802 9.354 5.822 6.938 5.039 7.642 24.498 10.141 15.823 5.295 4.124 4.901 3.621 3.211 16.586 3.294 14.6043 9.505 8.311 9.904 6.202 10.147 27.284 11.442 16.631 4.375 5.887 6.995 4.-157 4.263 11.449 3.720 15.2494 11.464 10.077 12.008 7.152 12214 29.575 12.462 17.289 4.865 7.138 8.481 5.140 5.132 18.137 4.054 15.7745 12368 11.446 13.640 7.964 14.093 31.555 13.312 17.860 4.848 8.108 9.634 5.723 5.922 18.719 4.334 16.2296 13.121 12.565 14.973 8.676 15.722 33.319 14.048 18.371 4.832 8.900 10.576 6.234 6.606 19.230 4.577 16.6377 14.779 i3.511 16.101 9.312 17.225 34.920 14.700 18.839 5.021 9.570 1l.372 6.691 7.237 19.690 4.793 17.01114 21.11l 17.765 21.170 12542 24.929 43.542 17.985 21.436 7.452 12.584 14.952 9.012 10.474 22.125 5.892 19.09021 26.081 20.254 24.136 14.672 29.878 49.826 20.188 23.405 9.915 14.346 17.047 10.543 12554 23.891 6.645 20.66628 29.848 22.019 26.240 16.262 33.510 54.904 21.876 25.032 11.173 15.597 18.533 11.685 14.080 25.330 7.234 21.96556 38.890 26.273 31.309 20.220 41.778 69.249 26.324 29.741 17.402 18.610 22.113 14.529 17.554 29.52[' e.858 25.715112 46.877 30.528 36.379 24.087 4&.668 85.672 31.106 35.371 21.991 21.624 25.694 17.308 20.449 34.662 10.790 30.224140 49.891 31.897 38.011 25.261 50.548 90.975 32647 37.300 24.791 22.594 26.847 18.151 21.238 36.431 11.478 31.800168 51.699 33.016 39.344 26.184 51.863 95.156 33.884 38.892 25.029 23.386 27.788 18.815 21.791 37.878 12.062 33.122
N.....N
213.
REFERENCES
Addis, B.J. (1992) Properties of High-Strength Concrete made with South
African Materials, PhD thesis, University of the Witwatersrand, Johannesburg.
Alexander, M.G. (1983) A limited laboratory study of the effects on hardened
concrete of a plasticizer and three superplasticizers, Concrete Beton, No. 31, pp.
17-24.
Alexander, M.G. (1986) Physical properties of hardened concrete, Fulton's
Concrete Technology, Ed. B.J. Addis, Sixth (revised) edition, Portland Cement
Institute, Midrand, South Africa, pp. 298, 323, 348-349.
Alexander, M.G. (1990) Properties of Aggregates in Concrete, Report on Phase 1
testing of concretes made with aggregates from 13 different quarries, and
associated design recommendations, Research Report, Department of Civil
Engineering, University of the Witwatersrand.
Alexander, M.G. (1991) Experimental critique of the BS 8110 method of
estimating concrete elastic modulus, Magazine of Concrete Research, Vol. 43, No.
157, Dec., pp, 291-304.

214
Alexander, M.G. (1993a) Properties of Aggregates in Concrete, Report on Phase
2 testing of concretes made with aggregates from a further 10 different quarries,
and associated design recommendations, Research Report, Department of Civil
Engineering, University of Cape Town, Rondebosch, pp. 23, 32, 75, 76, 85.
Alexander, M.G. (1993b) Two experimental techniques for studying the effects of
the interfacial zone between cement paste and rock, Cement and Concrete
Research, Vol. 23, No.3, May, pp. 567-576.
Alexander, M.G. (1994a) Deformation and volume change of hardened concrete,
Fulton's Concrete Technology, Ed. B.J. Addis, Seventh (revised) edition, Portland
Cement Institute, Midrand, South Africa, pp. 108, 117-122, 124, 130, 131.
Alexander, M.G. (1994b) Deformation properties of blended cement concretes
containing blastfumace slag and condensed silica fume, Advances in Cement
Research, 1994, Vol. 6, No. 22, Apr., pp. 73-81.
Alexander, M.G. (1996) Aggregates and the deformation properties of concrete,
AC! Materials Journal, Vol. 93, No.6, Nov./Dec., pp. 569.
Alexander, M.G. (1997) Personal Communication between the Author and
Professor Alexander, Young concrete engineers' and technologists' conference,
Midrand, South Africa, 30 Oct 1997.

215
Alexander, M.G. (1998) Telephonic Communication between the Author and
Professor Alexander, 7May 1998.
Alexander, M.G. and. Davis, D.E. (1992) Influence of aggregates on the
compressive strength and elastic modulus of concrete, Civil Engineer in South
Africa, Vol. 34, No.5, May.pp 161-170
Alexander, M.G. and Milne, T.I. (1995) Influence of cement blend and aggregate
type on stress-strain behavior and elastic modulus of concr. AC[ Materials
Journal, Vol. 92, No.3, May/June, pp.'227-235.
American Concrete Institute CACI) (1972), ACI Committee 209, Mechanisms of
Creep and Shrinkage, Report by Subcommittee ill, American Concrete Institute,
Detroit, Sept., pp. 105.
American Concrete Institute (ACI) (1978), ACI Committee 209, Subcommittee n.
Prediction of Creep, Shrinkage and Temperature Ef/~",f~, .2,' Draft Report, Detroit,
Oct.
American Concrete Institute (ACl) (1992), ACI Committee 209, Subcommittee n.
Prediction of Creep, Shrinkage and Temperature Effects in Concrete Structures,
Report ACI 209R-' 1., Detroit, March, pp. 1- 12.

216
AS 3600 (1988) Concrete Structures - AS 360(/-1988, Standards Association of
Australia, North Sydney, pp. 8-14,32-34.
A8TM C512-76 (1976) Standard Method of Test for Creep of Concrete in
Compression, ASTM Book of Standards, Part 14, Philadelphia: American Society
for Testing and Materials,
Ballim, Y. (1983) The ConcreteMaking Properties of the Andesite Lavas from
the Langeleven Formation of the Ventersdorp Supergroup, MSc 'thesis, University
of the Witwatersrand, Johannesburg, pp. 22-31, 67, 71-73, 80.
Bamforth, P. (1980) The Effect of Temperature Variation on the Creep of
Concrete,London: CIRIA.
Bazant, Z.P. and Baweja, S., (1994) Creep and Shrinkage Prediction Model for
Analysis and Design of Concrete Structures - Model B3, Structural Engineering
Report 94-10/b03c (Northwestern University, 1994).
Bazant, Z.P. and Chern, J.-C. (1984) Bayesian statistical prediction of concrete
creep and shrinkage, ACI Materials Journal, American Concrete Institute,
Jul.lAug., pp. 319-330.
217
Bazant, Z.P., Kim, J.K and Panula, L. (1991a) Improved prediction model for
time-dependent deformations of concrete, Materials and Structures, Part 1 -
Shrinkage, Vol. 24, pp. 327-345.
Bazant, Z.P., Kim, J.K. and Panula, L. (1991b) Improved prediction model for
time-dependent deformations of concrete, Materials and Structures, Part 2 - Basic
creep, Vol. 24, pp. 409-420.
Bazant, Z.P., Kim, J.K. and Panula, L. (1992a) Jmproved prediction model for
time-dependent deformations of concrete, Materials and Structures, Part 3 - Creep
at drying, Vol. 25, pp. 21-28.
Bazant, Z.P., Kim, J.I<. and Panula, L. (1992b) Improved prediction model for
time-dependent deformations of concrete, Materials and Structures, Part 4 -
Temperature effects, Vol. 25 pp. 84-94.
Bazant, Z.P., Kim, J.I<. and Panula, L. (1992c) Improved prediction model for
time-dependent deformations of concrete, Materials and Structures, Part 5 - Cyclic
load and cyclic humidity, Vol. 25, pp. 163-169.
Bazant, Z.P. and Panula, L. (1978) Practical prediction of time dependent
deformations of concrete, Parts I-VI, Materials and Structures, Vol. 11, pp. 307-
328, 425-434.

218
Bazant, Z.P. and Panula, L. (1979) Practical prediction of time dependent
deformations of concrete, Parts I-VI, Materials and Structures, Vol. 12, pp. 169-
183.
Bazant, Z.P. and Prasannan, S. (1989) Solidification theory for concrete creep, 1.
Formulation and II. Verification and application, Journal of the American Society
of Civil Engineers, Vol. 115, pp. 1691-1725.
Bazant, Z.P., Xi, Y. and Baweja, S. (1993) Improved prediction model for time-
dependent deformations of concrete, Part - 7, Short form of BP-KX model,
statistics and extrapolation of short-term data, Materials and Structures, Vol. 26,
pp. 567-574.
Bhal, N.S. and Mittal, M.K (1996) Effect of relative humidity on creep and
shrinkage of concrete, The Indian Concrete Journal, Vol. 70, No.1, Jan., pp. 21-
27.
British Concrete Society (1978) A Simple Design Method for Predicting the
Elastic Modulus and Creep of Structural Concrete, Technical Repoi ..London.
Brooks, J.I. (1989) Influence of'nilx proportions, plasticizers and superplasticizers
on creep and drying shrinkage of concrete, Magazine of Concrete Research, Vol.
43, No. 148, pp. 145-153.
219
Brooks, 11, Gamble, A.E. and Chouman, M.M. (1992) Assessment of methods of
predicting time-dependent deformations of plain and reinforced concrete, The
Structural Engineer, Vol. 70, No. 117, Jan.
Brooks, J.J. and Wainwright, P.l (1983) Properties of ultra-high strength
concrete containing superplasticizer, Magazine of Concrete Research, Vol. 35,
No. 125, pp. 205-213.
BS 1881 (1983) Testing Concrete, Part 121:Method for Determination of Static
Modulus of Elasticity in Compression, London: British Standards Institution.
BS 8110 (1985) Structural Use of Concrete, Part 2, Code of Practice for Design
and Construction, London, British Standards Institution.
Browne, R.D. and Bamforth, P.P. (1975) The long-term creep of the Wylfa P.v.
concrete for loading ages up to 12.5 years, Proceedings of the Third International
Conference on Struct. Mech. in Reactor Technology, Paper H 1/8, London, Sept.
Browne, R.D. and Blundell, R. (1972) The behaviour of concrete in prestressed
concrete pressure vessels, Nucle 11' Engineering and Design, Vol. 20, No.2, pp.
429-475.

220
Bull, M. and Acker, P. (1985) Creep of silica fume concrete, Cement and
Concrete Research, Vol. 15, pp. 463-466.
Carette, G.G. and Malhotra, V.M. (1986) Characterisation of Canadian fly ashes
and their relative performance in concrete, Pap> No, 6, The Use of Fly Ash, Silica
Fume, Slag and Natural Pozzolans in Concrete, Supplementary Papers from the
Second CANMET/ACI International Conference, Madrid, Apr.
CEB-FIP (1970) Comite Europeen du Beton - Federation Internationale De La
Precontrainte, International Recommendations for the Design and Construction of
Concrete Structures, Principles and Recommendations, FIP Sixth Congress,
Prague, pp. 27-28.
CEB-FIP (1978) Comite Euro-International du Beton - Federation Internationale
De La Precontrainte, International System of Unified Standard Codes of Practice
for Structures, Volume 11- CEE-FIP Model Code for Concrete Structures, 3rd ed.
Lausanne, pp. 56,331-344.
CEB-FIP (1990) Comite Euro-International du Beton, CEE-FIP Model Code
1990, First Draft. Lausanne, Mar., pp. 2-3,2-28 to 2-40 (Information Bulletin No.
195).
Cohen, S.S. (1991) Practical Statistics, Edward Arnold, London, pp. 107-108.

221
Counto, U.l (1964) The effect of the elastic modulus of the aggregate on the
elastic modulus, creep and creep recovery of concrete, Magazine of Concrete
Research, Vol. 16, No. 48, pp. 129-138.
CSIR (1982) The Use of PFA in Cement and Concrete: Research and Utilisation
in the Republic of South Africa, R/Bou 982, Council for Scientific and Industrial
Research, Pretoria.
Daly, D.D. (1994) Concrete mix design, Fulton's Concrete Technology, Ed. B.l
Addis, Seventh (revised) edition, Portland Cement Institute, Midrand, South
Africa, pp. 209-212.
Davis and Alexander (1992) Properties of Aggregates in Concrete (Part 2),
Hippo Quarries Technical Publication, Sandton, South Africa, Mar., pp. 1-27,42-
43,46-47.
Dhir, R.K, Munday, G.L. and Ong, L.T. (1986) Investigations of the engineering
properties of OPC/pulverised-fuel ash concrete: deformation properties, the
Structural Engineer, Vol. 64B, No.2, June, pp. 36-42.
Feldman, R.F. and Sereda, P.J. (1968) A new model of hydrated Portland cement
paste as deduced from sorption-length change and mechanical properties,
Materials and Structures, Paris, Vol. 1, No.6, pp. 509··519.
222
Feldman, RF. and Sereda, P.I (1969) A new model of hydrated Portland cement
paste as deduced from sorption-length change and mechanical properties,
Materials and Structures, Paris, Vol. 2, No.8, pp. 155-162.
Fiorato, A.E. (1995) Engineering properties of high-strength and conventional
strength concretes, Proceedings of the Third National Concrete & Masonry
Engineering Conference, San r'rancisco, California, June, pp. 13.
Freysinnet, E. (1936) Une Revolution dans les Techniques du Beton, Eyrolles:
Paris, pp. 118.
Gilbert, RI. (1988) Time Effects in Concrete Structures, Amsterdam: Elsevier,
pp. 18,31-36,45-48 (Developments inCivil Engineering, Vol. 23).
Grieve, G.RH. (1991) The Influence of Two South African Fly Ashes on the
Engineering Properties of Concrete, PhD thesis, University of the Witwatersrand,
Johannesburg.
Hannant, D.I (1968) Strain behaviour of concrete up to 95°C under compressive
stresses, Conference on Prestressed Concrete Pressure Vessels, London:
Institution of Civil Engineers, pp. 177-191.
223
Hansen, T.C. (1960) Creep and stress relaxation of concrete, Proceeding No. 31,
Swedish Cement and Concrete Research Instirute, Stockholm, pp. 112.
Hansen, T.C. and Mattock, A.H. (1966) The influence of size and shape of
member on the shrinkage and creep of concrete, ACI Materials Journal, Vol. 63,
pp. 267-290.
Hanson, J.A. (1953) A Ten-year Study of Creep Properties of Concrete, Concrete
Laboratory, Report No. Sp-38, US Department of the Interior, Bureau of
Reclamation, Denver, Colorado, July.
Harboe, E.M. et al., (1958) A Comparison of the Instantaneous and Sustained
Modulus of Elasticity of Concrete, Concrete Laboratory Report No. C-854,
Division of Engineering Laboratories, US Department of Interior, Bureau of
Reclamation, Denver, Colorado, Mar.
Hilsdorf H.K and Muller, H.S. (1979) Comparison of Methods to Predict Time-
Dependent Strains of Concrete, Institut fiir Baustoffiechnologie, Universitat
Karlsruhe (TH), pp.91.
Hobbs, D.W. (1971) Dependence of bulk modulus, Young's modulus, creep,
shrinkage and thermal expansion of concrete upon aggregate volume
concentration, Materials and Structures, Vol. 4, No. 20.
224
Hummel, A., Wesche, K, Brand, W. (1962) Der einfluss der zementart, des
wasser-zement-verhaltnisses und des belastungsalters auf das krieohen von beton,
Deutscher Ausschussfur Stahlbeton,Heft 146, Berlin.
Illston, J.M., Dimwoodie, J.M. and Smith, A.A. (1979) Concrete, Timber and
Metals, London, Van Nostrand Reinhold.
Ishai, O. (1%8) Time-dependent deformational behaviour of cement paste, mortar
and concrete, Proceedings of the International Conference 012 the Structure of
Concrete, Cement and Concrete Association, London, pp. 345-364.
Keeton, J.R. (1965) Study of Creep in Concrete, Technical Reports R333-I,
R333-II and R333-ill, US Naval Civil Engineering Laboratory, Port Hueneme,
California.
Kommendant, G.J. Polivka, M. and Pirtz, D. (1976) Study of ConcreteProperties
for Prestressed Concrete Reactor Vessels, Final Report No. UCSESM 76-3,
Department of Civil Engineering, University of California, Berkeley.
Kordina, K (1960) Experiments on the influence of the mineralogical character of
aggregates on the creep of concrete, RILEM Bulletin, Paris, No.6, Mar., pp. 7-22.

225
Kovier, K (1996) Why sealed concrete swells, ACI Materials Journal, Vo1. 93,
No.4, July/Aug., pp. 335-336.
Lambotte, H., Van Nieuwenburg, D. and Cocquyt, F. (1983) Influence of non-
prestressed steel on shrinkage and creep deformations and on steel-concrete stress
redistribution, Partial Prestressing,from Theory to Practice (NATO ASI Series
E: Applied Sciences, Vol. 2), Ed. M.A Cohn, Dordrecht, Martinus Nijhoff
Publishers, pp. 45-56.
Lea, F.M. and Lee, C.R. (1946) Shrinkage and creep in concrete, The Society of
Chemical Industry, Symposium on the Shrinkage and Cracking of Cementive
Materials, London, May, pp. 7-17.
L'Hermite, R.G. and Mamillan, M. (1970) Influence de la dimension des
eprouvettes sur Ie retrait', Annales de I'Institut Techn. Du Batiment et des
Travaux Publics, Vu1. 23, pp. 5-6.
L'Hermite, R.G., Mamillan, M. and Lefevre, C. (1965) Nouveaux resultats de
recherches sur la deformation et la rupture du beton, Annales de I'Institut Techn.
Du. Batiment et des TravauxPublics, Vol. 18, Nc ~207-208,pp. 323-360.
226
Luther, M.D. and Hansen, W. (1989) Comparison of creep and shrinkage of high-
strength silica fume concretes with fly ash concretes of similar strengths, Paper 27,
Fly Ash, Silica Fume, Slag and Natural Pozzolans in Concrete, Proceedings of the
Third ACIlCANMET Conference, Trondheim, Norway, Vol. 1, pp. 573-591. (ACI
SP 114).
Malty, K and Meyers, B.L. (1970) The Effect of Loading History on the Creep
and Creep Recovery of Sealed and Unsealed Plain Concrete Specimens, Keport
No. 70-7, Department of Civil Engineering, University ofIowa, Iowa City, Sept.
Maney, G.A. (1941) Concrete under sustained working loads; evidence that
shrinkage dominates time yield, Proceedings ASTM, Vol. 41, pp. 1021-1030.
Marques, E.T. (1992) Models for Predicting Creep and Shrinkage of Concrete
using South African Aggregates, MSc thesis, University of the Pretoria.
McDonald, J.E. (1975) Time-dependent Deformation of Concrete under
Multiaxial Stress Conditions, Technical Report C-75-4, US Army Engineer
Waterways Experimental Station, Vicksburg, Miss., Oct., Oak Ridge National
Laboratory, operated by Union Carbide Corporation for the US Energy Research
and Development Administration.

227
McDonald, D., Roper, H. and Samarin, A. (l(18S) Prediction accuracy of creep
and shrinkage models for Australian concrete, Proceedings of 14th ARRB
Conference,Vol. 14, Part 7, Canberra, Aug.lSept., pp. 66-78.
Mindess, S. and Alexander, M.G. (1995) Mechanical phenomena at
cement/aggregate interfaces, Materials Science of Concrete IV, The American
Ceramic Society, pp. 263-282.
Mindess, S. and Young, J.F. (1981) Concrete,New Jersey: Prentice-Han.
Morgan, D.R. (1975) Effects of chemical admixtures on creep and shrinkage in
concrete, Workshop on the Use of Chemical Admixtures in Concrete, Sydney;
University of New South Wales, pp. 113-148.
Moroney, M.J. (1984) Factsjrom Figures, Penguin Books, pp. 228.
Mossiossian, V. and Gamble, W.L. (1972) Time-dependent Behaviour of Non-
composite and Composite Prestressed Concrete Structures under Field and
Laboratory Conditions, Civil Engineering Studies, Structural Research Series, No.
385, Illinois Cooperative Highway Research Program, Series No. 129, University
oflllinois, Urbana, May.

228
Muller, H.S. and Kuttner, C.H. (1996) Creep of high-performance concrete -
characteristi. 1 and code-type prediction model, Proceedings of the Fourth
International Symposium on Utilization of High-Strength/High-Performance
Concrete, Paris, pp. 378,379.
Neville,A.M. andBrooks, I.I. (1987) Concrete Technology,Harlow:Longman.
Neville, AM., Dilger, W.H. and Brooks, J.I. (1983) Creep of Plain and
Structural Concrete, Longman Inc., New York, pp. 8, 17-26,38-;0, 57..61, 158-
179.
Nilsen, A.V. and Monteiro, P.I.M. (1993) Concrete: A three-phase material,
Cement and ConcreteResearch,Vol. 23, No.1, pp. 147-151.
Ojdrovic, RP. and Zarghamee, M.S. (1996) Concrete creep and shrinkage
prediction from short-term tests, ACI Materials Journal, Vol. 93, No.2,
Mar.lApr., pp. 169u177.
Orchard, D.F. (1979) Concrete technology, Property of Materials, Vol. 1,
Applied SciencePublishers,London.
Pauw, A. (1990) Static modulus of elasticity of concrete as affectedby density;
ACI Materials Journal, Vol. 57,No.6, Dec., pp. 679-687.
229
Pickett, C. (1942) Effect of change in moisture content on the creep of concrete
under a sustained load, ACI Materials Journal, Vol. 38, No. 24, Feb., pp. 333-
356.
Pirtz, D. (1968) Creep Characteristics of Mass Concrete for Dworshak Dam,
Report No. 65-2, Structural Engineering Laboratory, University of California,
Berkeley, Oct.
Powers, T.C. (1966) Some observations on the interpretation of creep data,
RlLEM Bulletin No. 34, Paris, Dec., pp. 381-391.
Reiner, M. (1949) On volume or isotropic flow as exemplified in the creep of
concrete, Applied Science Research, AI, pp. 475-488.
Reutz, W.A. (1965) A hypothesis for the creep of hal'dened cement paste and the
influence of simultaneous shrinkage, The Structure of Concrete, proceedings of an
international conference, London, Sept., pp. 319-344.
RILEM Model B3 (1995) Creep and shrinkage model for analysis and design of
concrete structures - model B3, draft RILEM Recommendation, prepared by
Bazant, Z.P. and Baweja, S., Materials and Structures, Vol. 28, pp. 357-365,415-
430,488-495, with Errata in Vol. 29 (19~!,) pp. 126.

230
Rfi,EM TC-I07 (1995) Guidelines for characterizing concrete creep and
shrinkage in structural design codes or recommendations, Materials and
Structures, Vol. 28, pp. 52-55.
Rostasy, F.S, Teichen, K-Th., Engelke, H. (1972) Beitrag zur Klarung der
Zusammenhanges von Kriechen und relaxation bei normal-beton, Amtliche
Forschungs-und Materialprufungsanstalt jill' das Bauwesen, Otto-Graf-Institut,
Universitat Stuttgart, Strassenbau und Strassenverkchrstechnik, Heft 139.
Rusch, H., Kordina, K and Hilsdorf H.K (1962) Der einfluss des
mineralogischen charakters der zuschlage auf das kriechen von beton, Deutscher
Ausschussfur Stahlbeton,Berlin, No. 146, pp. 19-1.33.
SABS 0100 (1992) Code of Practice for the Structural Use of Concrete, Parts 1
& 2, Part 1 : Design. Part 2 : Materials; Pretoria: South African Bureau of
Standards.
SABS 1083 (1994) Aggregates from Natural Sources -Aggregates for Concrete,
Pretoria: South African Bureau of Standards.
SABS ENV 197-1 (1992) Cement - Composition, Specifications and Conformity
Criteria, Part 1: Common Cements, Pretoria: : South African Bureau of
Standards.
231
Seed, H.B. (1948) Creep and shrinkage in reinforced concrete structures,
Reinforced Concrete Review, Vol. 1, No.8, pp. 253-267.
Smadi, M.M., Slate, F.O. and Nilson, A.H. (1987) Shrinkage and creep of higli-,
medium-, and low-strength concretes, including overloads, AC! Materials Journal,
Mar.lApr., pp. 229.
Soroka, I. and Jaegennann, C.H. (1972) Properties and possible uses of concrete
made with natural lightweight aggregate, Part 1, Repor: to the Ministry of
Housing, Haifa Technion.
Spiegel, M.R (1992) Theory and Problems of Statistics, Second edition in SI
units, Schaum's Outline Serle- London, McGraw-Hill International, pp. 230-231.
The Concrete Society (1974) The Creep of Structural Concrete, London: The
Society, Technical Paper No. 101.
Thomas, F.G. (1937) Creep of concrete under load, International Association of
Testing Materials, London Congress, Apr., pp. 292-294.
Troxell, G.B., Raphael, J.M. and Davis, RE. (1958) Long-time creep and
shrinkage tests of plain and reinforced concrete, Proceedings ASTM, Vo1. 58, pp.
1101-1120.

232
Vaishnav, R.N. and K' ,,1er,i""E. (1961) Correlation of creep of concrete, with its
dynamic properties, T. and A.M Report No. 603, University of Illinois, pp. 194.
Wittmann, F.R. (1970) The effect of moisture content on creep of hardened
cement pastes, Rheologica Acta, Vol. 9, No.2, pp. 282-287.
Wolsiefer, J. (1982) Ultra high strength :field placeable concrete in the range 10
000 to 18 000 psi (69 to 124 :MPa), Annual Convention, American Concrete
Institute, Atlanta, Georgia, Jan.
York, G.P, Kennedy, T.W. and Perry, E.S (1970) Experimental Investigation of
Creep in Concrete Subjected to i-Iultiaxial Compressive Stresses and Elevated
Temperatures, Research Report 2864-2 to Oak Ridge National Laboratory
operated by Union Carbide ,?orporation for US Atomic Energy Commission,
Dep~rtment of Civil Engineering, University of Texas at Austin, June.
Yunping, X. and Jennings, H.M. (1992) Relationships between microstructure and
creep and. shrinkage of cement paste, Material Science of Concrete Ill, Ed. J.
Skalny, American Ceramic Society, Westerville, Ohio, pp. 37-44.

Author: Fanourakis, George C.Name of thesis: The influence of aggregate stiffness on the measured and predicted creep behaviour of concrete.
PUBLISHER:University of the Witwatersrand, Johannesburg©2015
LEGALNOTICES:
Copyright Notice: All materials on the Un ive rs ity of th e Witwa te rs ra nd, J0 han nesb u rg Li b ra ry websiteare protected by South African copyright law and may not be distributed, transmitted, displayed or otherwise publishedin any format, without the prior written permission of the copyright owner.
Disclaimer and Terms of Use: Provided that you maintain all copyright and other notices contained therein, youmay download material (one machine readable copy and one print copy per page)for your personal and/oreducational non-commercial use only.
The University of the Witwatersrand, Johannesburg, is not responsible for any errors or omissions and excludes anyand all liability for any errors in or omissions from the information on the Library website.