Embed Size (px)
Citation preview

JOURNAL OF MAGNETIC RESONANCE 124, 61–71 (1997)ARTICLE NO. MN967482
The Influence of a Scalar-Coupled Deuterium upon the Relaxationof a 15N Nucleus and Its Possible Exploitation as a Probe for
Side-Chain Interactions in Proteins
JONATHAN BOYD, TAPAS K. MAL, NICK SOFFE, AND IAIN D. CAMPBELL
Department of Biochemistry and Oxford Centre for Molecular Sciences, South Parks Road,University of Oxford, Oxford, OX1 3QU, United Kingdom
Received June 24, 1996; revised September 11, 1996
The magnitude of the quadrupole coupling constant (e 2Qq /\ ) energy surface (7, 8) . A method for predicting hydrogen-of a deuteron is a good probe for hydrogen bonding. In protein bond lengths, which is applicable to the backbone amidestructures, hydrogen-bonding interactions between side chains, be- protons in proteins, has also been described (9, 10) . Thistween side chains and ligands, and between side chains and solvent technique involves a measurement of the difference betweenare frequently found. An experiment that detects, via scalar cou- the observed amide proton chemical shift and its randompling, the influence of a deuteron on the 15N nucleus of asparagine
coil chemical shift. The observed difference can then beor glutamine side chains is presented. The experiment dependsrelated to the length of the hydrogen bond.upon the resolution of the 1D 15N(D) isotope shifts that allow the
For a hydrogen bond of the form X– 2HrrrY, the magni-various isotopomers and isotopologues to be distinguished whentude of the deuterium quadrupole coupling constant (e 2Qq /15N-labeled samples are dissolved in solvent mixtures of H2O/D2O.
15N lineshapes with theoretical simulations that provide estimates \) has been correlated with the strength of hydrogen bond-for the 2H quadrupole coupling constants are presented. The in- ing. Theoretical (11, 12) and experimental evidence for thisfluence of 15N– 2H dipolar–quadrupole cross correlation and the relationship has been given. The experimental data haveresulting small frequency shifts in the 15N multiplet are resolved been obtained mainly by using solid-state NMR and NQRin some of the spectra. The experimental data are provided using techniques (13–19) , but there have also been investigationsthe free amino acids asparagine and glutamine for which the side in the liquid phase (20–22) . It seems to be the differencechains were isotopically enriched in 15N and the recombinant pair
between bond length of X– 2H and 2HrrrY that determinesof modules, fibronectin type 1 and epidermal growth factor, (F1-the value of the deuterium quadrupole coupling constantG) of tissue plasminogen activator, which were uniformly isotopi-(11, 13, 17) . As the hydrogen-bond strength increases, thecally enriched in 15N. q 1997 Academic Press
X– 2H bond length increases and the contribution of the Xnucleus to the electric field gradient at the 2H nucleus de-creases faster than the additional contribution arising fromINTRODUCTIONthe more distant charge distribution represented by the Yatom (11) . Very good correlations of the 2H quadrupoleMost 15N isotopically enriched recombinant proteins willcoupling constant have also been found with eithercontain several amino acids whose side chains also have a(2HrrrY)03 (15, 16) or (2HrrrY)01 (18) as well as with15N nucleus. There are several recent NMR structures whichthe difference [(X– 2H) 0 (2HrrrY)]. All these relation-highlight possible interesting hydrogen-bonding or saltships predict a decrease of the net field gradient with increas-bridge interactions involving amino acids with 15N nuclei ining strength of the hydrogen bond. Most of the publishedtheir side chains. These recent examples include hydrogen-data have been concerned with the O– 2HrrrO system.bond interactions between side chains in model peptides (1)However, similar arguments have been applied to the N–and between protein side chains and bound ligands (2–5) .2HrrrY system, where the 2H quadrupole coupling con-NMR has been used extensively to probe hydrogen bondsstant has been found to exhibit a large variation in magnitudein solution (6) . The measurement of primary isotope shiftsbecause of the influence of hydrogen bonding (15, 19) .which arise from substitution of a 2H or 3H for a hydrogen-
To estimate the 2H quadrupole coupling constant in abonded proton can be used to give precise information onmacromolecule in solution, we have used an experimentthe symmetry of the hydrogen bond. The magnitude andwhich observes, indirectly, the environment of a deuteriumsign of the primary isotope shift has been shown to give
information about the shape of the hydrogen-bond potential- nucleus through its influence upon the relaxation of a 15N
61 1090-7807/97 $25.00Copyright q 1997 by Academic Press
All rights of reproduction in any form reserved.
AID JMRB 7482 / 6o14h$$121 12-31-96 09:19:53 magbas AP: Mag Res, Series B
62 BOYD ET AL.
nucleus to which it is scalar coupled. The experiment de- with the single-transition operators are in the orderpends primarily upon the resolution of the fairly large r/14(v/
N ) ú r 025(v 0
N) ú r036(v0N ).
1D 15N(D) isotope shifts1 when a sample, containing aspara- The time evolution of the density matrix can be describedgine or glutamine, is dissolved in a solvent mixture compris- by (24)ing H2O and D2O. Theoretical simulations of the resulting15N lineshapes require a number of broad assumptions but d{s( t)}/dt Å 0{ iH0 / G} {s( t)}, [1]do yield estimates of the magnitude of the 2H quadrupolecoupling constant both in the free amino acids and when
where H0 is the nuclear spin superoperator and G is thethese residues are part of a protein. An important assumptionrelaxation superoperator. The diagonal elements of H0 foris that the interactions responsible for the tertiary proteinthe 15N– 2H spin system contain information about the spinstructure, some of which are hydrogen bonds, are not sig-variables such as resonance offset (V) and scalar couplingnificantly altered by the solvent mixture. This requires thatconstant (JND), as well as the dynamic frequency shifts (d)the strength of a particular hydrogen bond should remainarising from relaxation (28, 29) .essentially independent of the solvent ratio.
The main relaxation mechanisms contributing to 15Nrelaxation are quadrupole relaxation of the 2H nucleus,THEORYdipole–dipole relaxation of both the 15N– 1H and 15N– 2Hspin pairs, and anisotropic chemical-shift relaxation of theThe system to be investigated here comprises three15N and possibly 2H nuclei. These relaxation mechanismsspins, 15N, 1H, and 2H. However, during the 15N evolutioncan give rise to several cross-correlation phenomena;period of a 2D 15N– 1H correlated experiment, the scalarthese include dipolar–quadrupole ( 15N– 2H, 2H) , csa–coupling between the 15N and 1H nuclei is removed by 1Hquadrupole ( 2H, 2H) , and dipolar–csa ( 15N– 2H, 15N) .broadband decoupling, reducing the 15N resonance to aThe dipolar cross-correlation process ( 15N– 1H, 15N– 2H)three-line multiplet. The relaxation of a spin-1
2 nucleuswas assumed to be small and was neglected. A chemical-scalar coupled to a spin-1 nucleus has been described (23–exchange term, which is less well defined than those dis-31 ) . Perhaps the most striking feature of this spin systemcussed above, could also give rise to 15N line broadening.has been shown to arise from the dipolar–quadrupolarThis last process would reflect a fairly slow motion of thecross-correlation interaction. For a spin-1
2 three-line multi-complete side chain between several well-populated sitesplet, this relaxation process can give rise, in medium-sizedat a rate which is still fast enough to average any 15Nmolecules such as proteins, to quite large frequency shiftschemical-shift differences.for the individual components of a multiplet, leading to
The frequency properties of the correlation function arevery asymmetric lineshapes (28–31 ) .developed using the spectral-density function defined asThe labels, eigenstates and eigenvalues for a 15N– 2H sca-
lar-coupled spin system, where JND is negative, are É1 … ÅÉa/ … Å (£N 0 JND)/2 / £D, É2 … Å Éa0 … Å £N/2, É3 … Å j(av) Å (1/4p)tr / [1 / i(av)tr ] [2]Éa0 … Å (£N / JND)/2 0 £D, É4 … Å Éb/ … Å 0(£N 0 JND)/
Å (1/4p)[J(av) 0 iQ(av)] ,2 / £D, É5 … Å Éb0 … Å 0£N/2, É6 … Å Éb0 … Å 0(£N / JND)/2 0 £D, where a, b and /, 0, 0 refer to the spin states ofthe 15N and 2H nuclei, respectively. where J(av) and Q(av) are the real and imaginary terms
The matrix elements, transitions and characteristic fre- of the complex spectral density, j(av) (24, 28, 29, 34) . Itquencies (rads/sec) required for the three pÅ/1 15N single- has been shown (24, 35) that the significance of the imagi-quantum coherences associated with the /, 0, 0 spin states nary term of the spectral density, if nonzero, is to produceof the deuteron, expressed in terms of single-transition oper- a small frequency shift, d, the magnitude of which is depen-ators, are r/14 Å Éa/ … »b/É Å v/
N Å VN 0 2pJND, r 025 Å dent on the motional properties of the spins. The correlation
function is subdivided following the approach of Lipari andÉa0 … »b0É Å v 0N Å VN, r036 Å Éa0 … »b0É Å v0
N Å VN /2pJND, where vN is the Lamor frequency of spin N (in a Szabo (36) . In this case, the spectral density is of the form
j(av) Å (1/4p){S 2tr / [1 / i(av)tr ] / (1 0 S 2)t / [1 /frame of reference rotating at the carrier frequency vr f ) withoffset VN Å vN 0 vr f . Consequently, with 2pJND negative i(av)t]}, where tr is the isotropic rotational correlation
time and 1/t Å 1/tr / 1/ti , ti is the effective correlation(and úÉdÉ) , the relative transition frequencies associatedtime characterizing the rapid internal motions (where ti !tr ) , and S 2 is an order parameter. A justification for this
1 The definition, nDX(1H, 2H) Å nDX(D) Å dX(1H) 0 dX(2H), whichexpansion, in the presence of both auto- and cross-correlatedis used for the isotope shifts follows that in Ref. (48) , where dX(2H) ismotions, is given later.the chemical shift of the deuterated species. If the isotope shift is to lower
frequency then, with this definition, the sign is positive. The 3 1 3 matrix, G , is formed through summation of
AID JMRB 7482 / 6o14h$$122 12-31-96 09:19:53 magbas AP: Mag Res, Series B
63DEUTERIUM RELAXATION OF NITROGEN-15 IN PROTEINS
the individual relaxation contributions, where the interaction G 4 : G 41414 Å G 4
2525 Å G 43636 Å (DNH)2{2J(0)/3 / J(vH 0
constants are defined as vN)/6 / 0.5J(vN) / J(vH) / J(vN / vH)};d4
14 Å d425 Å d4
36 Å (DNH)2 {Q (vH-vN) / 6 / 0.5Q (vN) /Q (vH / vN)}, where Q (av) refers to the imaginary termdipolar, Dij Å (6p /5)1/2 (m0 /4p)gigj\ /r 3
ij ; of the complex spectral density.csa, Ci Å (8p /15)1/2giDsi B0 ; G 5 : G 5
1414 Å G 53636 Å (DND)2{8J(0)/3 / J(vD 0 vN)/3
/ 2J(vN) / J(vD) / 2J(vN / vD)};quadrupolar, QD Å (3p /40)1/2(e 2Qq /\) .G 5
2525 Å (DND)2{2J(vD 0 vN)/3 / 2J(vD) / 4J(vN /vD)};
The matrix G Å (iÅ1,8 Gi , where G 1 is the contribution G 5
1425 Å G 52514 Å G 5
2536 Å G 53625 Å (DND)2{J(vD)};
to relaxation from 2H quadrupolar relaxation, G 2 is a possible d 514 Å d 5
36 Å (DND)2{Q(vD 0 vN)/3 / 2Q(vN) / 2Q(vDcontribution to relaxation from 2H csa–quadrupole cross cor- / vN)};relation, G 3 is the contribution to relaxation from 15N– 2H, d 5
25 Å (DND)2{2Q(vD 0 vN)/3 / 4Q(vD / vN)}, where2H dipolar–quadrupolar cross correlation, G 4 and G 5 are the Q(av) refers to the imaginary term of the complex spectralcontributions from 15N– 1H and 15N– 2H dipolar relaxation density. The maximum dynamic frequency shift, d 5 , fromrespectively, G 6 is the contribution to relaxation from 15N this mechanism is in all the cases considered here õ8% ofcsa, G 7 is the contribution to relaxation from 15N– 2H, 15N the magnitude of the contribution to the dynamic frequencydipolar–csa cross correlation, and G 8 is a possible contribu- shift from d 3 , the dipolar–quadrupolar cross-correlationtion to relaxation from chemical exchange. mechanism.
The individual relaxation elements of the relaxation ma- G 6 : G 61414 Å G 6
2525 Å G 63636 Å (CN)2{2J(0)/3 /
trix, G , for each relaxation mechanism are given below, 0.5J(vN)}, where the 15N chemical-shift tensor for the side-where the superscript is used to denote the particular relax- chain amide of asparagine has been found to be axially sym-ation mechanism and the subscript identifies the matrix ele- metric to a good approximation (1 / h 2 /3) Å 1.05, andment: with DsN Å 0165 ppm (38) ; this value for DsN was alsoG 1 : G 1
1414 Å G 13636 Å 4(QD)2(1 / h 2 /3){J(vD) / used for simulations involving glutamine.
2J(2vD)}; G 7 : G 71414 Å 0G 7
3636 Å (DNDCN)P2cos(uDC){8J(0)/3 /0 0.5G 1
2525 Å G 11425 Å G 1
2514 Å G 12536 Å G 1
3625 Å 0 2J(vN)};4(QD)2(1 / h 2 /3){J(vD)}; d 7
14 Å 0d 736 Å (DNDCN)P2cos(uDC) {2Q(vN)}, where
G 11436 Å G 1
3614 Å 08(QD)2(1 / h 2 /3){J(2vD)}, where P2cos(uDC) is the second-order Legendre polynomial andh is the asymmetry parameter of the 2H electric-field-gradient uDC is the angle between the 15ND internuclear vector andtensor. h for 2H is usually small and axial symmetry is a the principal component of the axially symmetric 15N chemi-good assumption for a N–D spin system. cal-shift tensor and Q(vN) refers to the imaginary term ofG 2 : G 2
1414 Å 0G 21425 Å 0G 2
2514 Å G 22536 Å G 2
3625 Å 0 the complex spectral density. The principal component ofG 2
3636 Å 4(QDCD)P2cos(uQC)J(vD), where P2cos(uQC) is the 15N csa tensor lies in the same plane as the ND in-the second-order Legendre polynomial and uQC is the angle ternuclear vector but is not collinear with it, subtending anbetween the principal components of the assumed axially angle of 307 (or 1507) . A comment about the approximatesymmetric electric-field-gradient and chemical-shift tensors error introduced into the simulations by assuming collinear-of the deuteron. This relaxation mechanism does not contrib- ity for either of the Z-1-d or E-1-d isotopomers appears later.ute to the dynamic frequency shift (28) . Values for the 2H The maximum magnitude of the dynamic frequency shift,chemical-shift anisotropy, DsD, of a ND spin system are in d 7 , was found from the simulations to be about 0.1 Hz.the range of 014 ppm (37) . This magnitude is too small Using negative values for JND and DsN results in line broad-for line broadening from the cross-correlation process to be ening for the low-frequency component of the 15N multiplet.discernible in the experimental spectra reported here, and the G 8 : G 8
1414 Å G 82525 Å G 8
3636 Å Rex , where Rex is an exchangecontribution of this mechanism to relaxation was neglected. contribution to the 15N relaxation.G 3 : d 3
14 Å 00.5d 325 Å d 3
36 Å 04(QDDND)P2cos The complex eigenvalues and eigenvectors of Eq. [1] were(uQD)Q(vD), where P2cos(uQD) is the second-order Leg- obtained using NAG library routines (NAG Group Ltd., Ox-endre polynomial and uQD is the angle between the ND in- ford, UK).ternuclear vector and the principal component of the as-sumed axially symmetric electric-field-gradient tensor of the EXPERIMENTALdeuteron. Q(vD) refers to the imaginary term of the complexspectral density. The maximum magnitude of the dynamic The samples of 15N-labeled asparagine and glutamine
were used without further purification. The structure of thefrequency shift, d 325 , was found from the simulations to be
1.7 Hz. 15N isotopically labeled recombinant protein sample of fi-
AID JMRB 7482 / 6o14h$$122 12-31-96 09:19:53 magbas AP: Mag Res, Series B

64 BOYD ET AL.
cantly with temperature (46) . Using a value for KW of 4changes the [HOD]/[H2O] ratio by only about 1%. This isinside the anticipated experimental errors of the NMR inte-grals and a value for KW of 4 was assumed.
A part of the 15N scalar-coupled 750 MHz one-dimen-FIG. 1. The nomenclature for each species follows that in Ref. (43) , sional 1H NMR spectrum from a sample of the amino acid
where E-1-d and Z-1-d are referred to as isotopomers and the other two glutamine, 15N-labeled in the side-chain amide group, isspecies are called isotopologues.
shown in Fig. 2. It is usual for the HE (trans) proton to bedownfield of the HZ (cis) proton in primary amides (47) ,and this observation makes possible the assignment of theprotons HE and HZ in the free amino acid. The two-bond,bronectin type 1 and epidermal-growth-factor-like pair of2DH(D), isotope effect of 2H substitution is clearly distin-modules (F1-G) of tissue plasminogen activator, at pH 3,guished. The shift is to higher frequency for both the Z-1-has been reported (39, 40) . All NMR spectra were recordedd and E-1-d isotopomers and is largest for the E-1-d isoto-from samples at pH 3 and 107C. A temperature of 107C waspomer. The substitution of a lighter isotope by a heavy iso-chosen in order to reduce the rate of intermolecular solventtope usually leads to a shift to a lower frequency (48) .exchange. Using the data supplied in (41) , this rate wasHowever, for the ammonium ion, substitution of 1H by 2Hcalculated to be about 0.2 s01 for a fully exposed asparaginecauses a shift of the 1H resonances to a higher frequencyor glutamine at pH 3 in H2O. The pH values reported are(49) ; a possible explanation for this observation, based uponthe direct meter readings, uncorrected for isotope effects.the electronegativity of the nitrogen, has been provided (50) .The NMR spectra were obtained on a homebuilt spectrom-
eter, operating at 750 MHz for 1H, which was interfaced toan Oxford Instruments superconducting magnet and whichused a homemade RF probehead (42) with a three-axis gra-dient set.
The lock gating circuitry incorporated a fast GaAs RFswitch which enabled the probe lock coil to be connectedto the 2H lock or to the output of the 2H decoupler. Thisenabled interleaving of the decoupling while retaining nor-mal lock mode operation for long-term experiments. Theswitch has a very low insertion loss, ensuring that the locksensitivity is not degraded.
The chemical-shift range of the deuterons to be decoupledwas fairly small, approximately {85 Hz. A WALTZ16 RFfield strength of gB1 /2pÅ 350 Hz was found to be sufficient;this RF field strength also significantly exceeds JND andtypically it was found that (31) [gB1T1( 2H)]2 @ 1 whereT1( 2H) was estimated from the lineshape simulations.
The primary isotope shift, 1DH(D), was measured usingthe solvent HOD signal as a reference. Any additional contri-bution to the measured primary isotope shift of the aminoacid from an isotope shift in the HOD resonance was ne-glected. These 1H and 2H spectra were recorded unlocked. FIG. 2. The spectrum was recorded from a sample of glutamine 15N-
enriched in the side-chain amide dissolved in an equimolar mixture of H2O/D2O. (A) 15N– 1H scalar-coupled resonances from species 1(HE) and Z-RESULTS AND DISCUSSION1-d and (B) 15N– 1H scalar-coupled resonances from species 1(HZ ) and E-1-d. The spectrum, recorded without 15N decoupling, has a final digital
There are four distinct species, differing in the side-chain resolution of 0.19 Hz/pt, the major and minor tick marks are at 40 and 20amide group, when a sample of asparagine or glutamine is Hz, respectively, and the time-domain data were apodized with a Lo-
renztian-to-Gaussian resolution-enhancement function prior to Fourierdissolved in a solvent mixture of H2O and D2O, as shown intransformation. The chemical-shift difference between the resonances ofFig. 1. Provided there are no isotope effects on the chemical1(HE) and 1(HZ ) is 565 Hz (0.753 ppm), JHZ HE Å 2.0 Hz, J 15NHZ Åequilibria (see text) the relative proportions of each species089.3 Hz, J 15NHE Å 091.2 Hz, and the JHD coupling constant could not be
present in the solution can be estimated from the molar ratio resolved. The two-bond isotope shifts, 2DH(D), are 02.2 Hz (02.9311003
of the solvent with a value of 3.85 for KW (44, 45) , where ppm) and 03.0 Hz (04.011003 ppm) for the Z-1-d and E-1-d isotopomersrespectively.KW Å 4[HOD]2/[D2O][H2O]. KW does not vary signifi-
AID JMRB 7482 / 6o14h$$123 12-31-96 09:19:53 magbas AP: Mag Res, Series B
65DEUTERIUM RELAXATION OF NITROGEN-15 IN PROTEINS
Whether a similar consideration applies to glutamine (or toasparagine which exhibits similar shifts) is not known. Wenote that the isotope shift 1DH(14N, 15N), measured usingan equimolar mixture and 14N decoupling, is õ1 Hz forboth 1H resonances. The chemical exchange via the solventbetween the various species at this pH and temperature isclearly very slow as no significant broadening of the reso-nances is observed [kex ! É2p(2DH(D))É] .
In the absence of isotope effects on the chemical equilib-rium, the relative proportions of the various species, 15NH2,15NHD, and 15ND2, are given by the statistical formulas d 2 ,2d[1 0 d] , [1 0 d]2 , respectively, where d is the molefraction of H2O in the solvent. To measure the integrals fromthis sample, a 1D 1H spectrum was recorded using a binomialexcitation sequence, avoiding solvent saturation, with a recy-cle delay of 30 s. For each isotopomer, including a fairlylarge experimental error of about 10%, the integrals, derivedfrom curve fitting Lorentzian lines to the spectrum, indicatea deviation from the statistical proportions. The isotope ex-change equilibrium constants, defined as wE Å (15NHED/
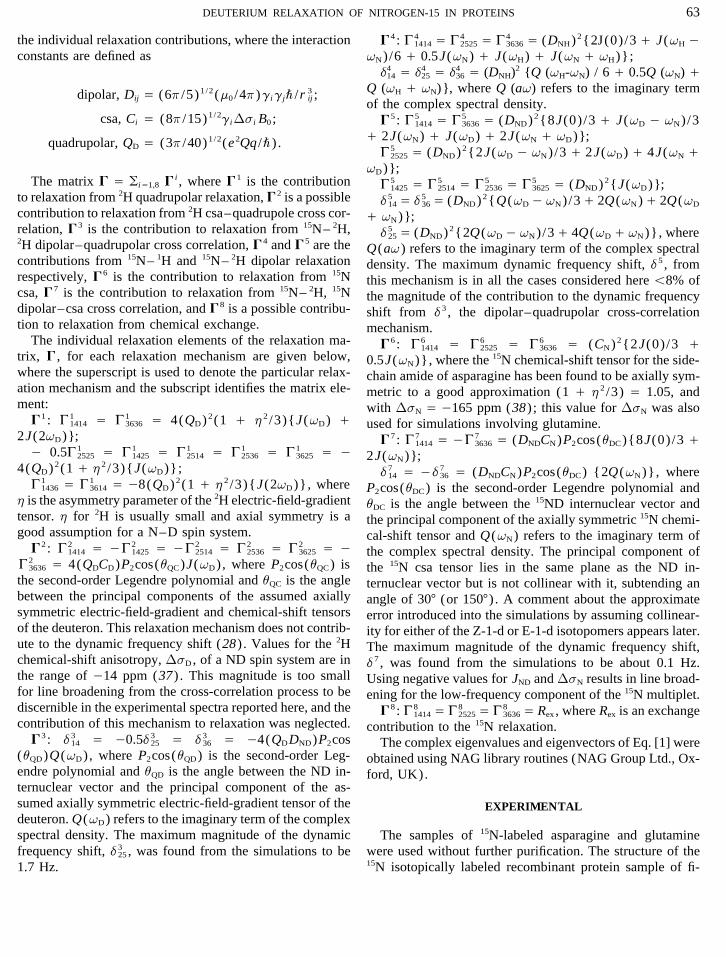
FIG. 3. ( A) One-dimensional 2H spectrum recorded at 115.1 MHz,15NHEHZ )(d / [1 0 d]) and wZ Å (15NDHZ/15NHEHZ )(d / [1with broadband WALTZ-16 15N decoupling, from a sample of aspara-0 d]) , were found to be 0.72{0.1 and 0.79{0.11 respec-gine dissolved in D2O. The solid line represents the sum of two simu-tively. The other isotope exchange equilibria, represented bylated Lorentzian lineshapes, with a T 2 of 44.9 ms for DZ and 75 ms for
w Å (15ND2/15NHD)(d / [1 0 d]) , cannot be measured from DE . The broad peak to high frequency of the 2H DE resonance is as-these spectra. signed to the 14ND3 group. The major and minor tick marks are at 50
and 25 Hz, respectively. ( B) 2H longitudinal inversion-recovery dataThere are many reported examples, including proteins,for the deuterons DZ ( filled circles ) and DE ( open circles ) recorded atwhich exhibit isotope exchange equilibrium constants (frac-115.1 MHz. The 2H T1 values were found to be 44.9 and 75.3 ms fortionation factors) different from unity (46, 48, 51) . A valuethe DZ and DE resonances, respectively. The three-parameter curve
for w less than unity indicates that both isotopomers have a fitting used a function of the form A {1 0 (W / 1 )e0t / T1 } to estimate
preference for 1H over 2H, suggesting both protons are in- the 2H T1 values.volved in hydrogen bonds either with the solvent or perhapsin some intramolecular interaction with the carboxyl group.If the amino acid is changed to asparagine, the chemical-
In the extreme-narrowing regime, assuming the only sig-shift characteristics of the 1H spectrum are similar at thisnificant mechanism contributing to 2H relaxation is that aris-pH and temperature.ing from fluctuations of the nuclear quadrupole moment, R1Measurement of the primary isotope shift, 1DH(D), from
either asparagine or glutamine for either the HZ or the HE Å R2 Å 20 Q 2D (1 / h 2 /3)J(0) Å 3p /2(e 2Qq /\)2(1 / h 2 /
3)J(0) (24) where h, the asymmetry parameter, is definedsite indicates that the shifts are positive and with a magnitudeof less than 0.03 ppm. The observation of a primary isotope as a positive quantity with a value between 0 and 1. The
asymmetry parameter for 2H is usually small (52) and theshift which is in each case positive and close to zero isconsistent with hydrogen bonds which may be described by principal component of the electric-field-gradient tensor for
a ND group has been shown to lie along or very close toa double-well potential energy surface where the equilibriumposition of the two isotopes is similar (7, 8) . the bond (52) . In the discussion which follows, we assume
that h is sufficiently small that it can be neglected in theA one-dimensional 2H spectrum of a sample of asparaginein D2O is shown in Fig. 3A. The most striking feature of determination of values for e 2Qq /\. The sign of e 2Qq /\
cannot be determined from these data but could be importantthis spectrum is the large difference in linewidth for the 2Hresonances. The linewidth for the DZ deuteron is significantly in the dipolar-quadrupolar cross-correlation process to be
considered later. With these assumptions, the probable basislarger than that observed for the DE deuteron. 2H inversion-recovery curves for these resonances are shown in Fig. 3B. for the 2H relaxation behavior is a different magnitude of
e 2Qq /\ for the DE and DZ deuterons.The 2H longitudinal relaxation times are also different andare found to have values closely similar to the 2H T2 values To act as a restraint on the motional parameters chosen
to model the 2H relaxation data, 15N T1 and 15N– 1H NOEderived from curve fitting Lorentzian lines to the spectrumin Fig. 3A. time-development data were recorded from a sample of as-
AID JMRB 7482 / 6o14h$$123 12-31-96 09:19:53 magbas AP: Mag Res, Series B
66 BOYD ET AL.
paragine in H2O, Fig. 4. The major contribution to 15N longi-tudinal relaxation is the 15N– 1H dipole–dipole mechanismfor each proton with a small contribution from 15N chemical-shift anisotropy. Anticipating a model of isotropic motion,which is justified later, in the extreme-narrowing regime, R1
Å rN Å (10/3D 2NH / C 2
N)J(0) / r*, where r* is used toindicate small contributions to 15N relaxation from othermechanisms such as trace paramagnetic impurities. Contri-butions to relaxation from the 15N– 1H, 15N dipolar–csacross-correlation process were experimentally removed(53) , and the 15N– 1H dipole–dipole cross-correlation termis small and can be neglected.
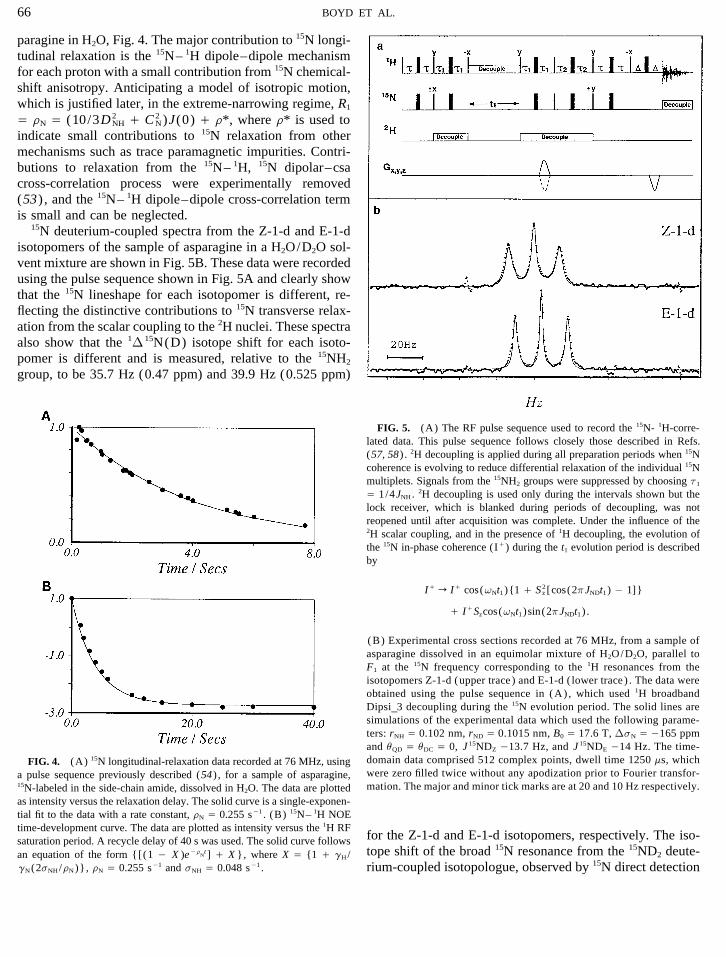
15N deuterium-coupled spectra from the Z-1-d and E-1-disotopomers of the sample of asparagine in a H2O/D2O sol-vent mixture are shown in Fig. 5B. These data were recordedusing the pulse sequence shown in Fig. 5A and clearly showthat the 15N lineshape for each isotopomer is different, re-flecting the distinctive contributions to 15N transverse relax-ation from the scalar coupling to the 2H nuclei. These spectraalso show that the 1D 15N(D) isotope shift for each isoto-pomer is different and is measured, relative to the 15NH2
group, to be 35.7 Hz (0.47 ppm) and 39.9 Hz (0.525 ppm)
FIG. 5. (A) The RF pulse sequence used to record the 15N- 1H-corre-lated data. This pulse sequence follows closely those described in Refs.(57, 58) . 2H decoupling is applied during all preparation periods when 15Ncoherence is evolving to reduce differential relaxation of the individual 15Nmultiplets. Signals from the 15NH2 groups were suppressed by choosing t1
Å 1/4JNH. 2H decoupling is used only during the intervals shown but thelock receiver, which is blanked during periods of decoupling, was notreopened until after acquisition was complete. Under the influence of the2H scalar coupling, and in the presence of 1H decoupling, the evolution ofthe 15N in-phase coherence (I/) during the t1 evolution period is describedby
I/ r I/ cos(vNt1){1 / S 2z [cos(2pJNDt1) 0 1]}
/ I/Szcos(vNt1)sin(2pJNDt1) .
(B) Experimental cross sections recorded at 76 MHz, from a sample ofasparagine dissolved in an equimolar mixture of H2O/D2O, parallel toF1 at the 15N frequency corresponding to the 1H resonances from theisotopomers Z-1-d (upper trace ) and E-1-d ( lower trace ) . The data wereobtained using the pulse sequence in (A) , which used 1H broadbandDipsi_3 decoupling during the 15N evolution period. The solid lines aresimulations of the experimental data which used the following parame-ters: rNH Å 0.102 nm, rND Å 0.1015 nm, B0 Å 17.6 T, DsN Å 0165 ppmand uQD Å uDC Å 0, J 15NDZ 013.7 Hz, and J 15NDE 014 Hz. The time-domain data comprised 512 complex points, dwell time 1250 ms, whichFIG. 4. (A) 15N longitudinal-relaxation data recorded at 76 MHz, usingwere zero filled twice without any apodization prior to Fourier transfor-a pulse sequence previously described (54) , for a sample of asparagine,mation. The major and minor tick marks are at 20 and 10 Hz respectively.15N-labeled in the side-chain amide, dissolved in H2O. The data are plotted
as intensity versus the relaxation delay. The solid curve is a single-exponen-tial fit to the data with a rate constant, rN Å 0.255 s01 . (B) 15N– 1H NOEtime-development curve. The data are plotted as intensity versus the 1H RF
for the Z-1-d and E-1-d isotopomers, respectively. The iso-saturation period. A recycle delay of 40 s was used. The solid curve followstope shift of the broad 15N resonance from the 15ND2 deute-an equation of the form {[(1 0 X )e0r
Nt] / X }, where X Å {1 / gH/
gN(2sNH/rN)}, rN Å 0.255 s01 and sNH Å 0.048 s01 . rium-coupled isotopologue, observed by 15N direct detection
AID JMRB 7482 / 6o14h$$123 12-31-96 09:19:53 magbas AP: Mag Res, Series B

67DEUTERIUM RELAXATION OF NITROGEN-15 IN PROTEINS
TABLE 1 of the rotational diffusion tensor show that asparagine mayRotational Correlation Time, tr , and Quadrupole Coupling be considered to be axially symmetric and that it is only
Constants, e2Qq/\, for the Z-1-d and E-1-d Isotopomers of the mildly anisotropic with Dx
/D⊥ õ 1.5. However, the freeFree Amino Acids Asparagine and Glutamine, 15N-Enriched in amino acid has significant internal motions associated withthe Side Chain, from Samples Dissolved in an Equimolar Mixture the side chain due to changes of the various torsion anglesof H2O/D2O, pH 3 and 107C caused by jumps between the potential energy wells. These
transitions between potential energy wells, which give risee2Qq/\ (kHz)to averaged 3JHH coupling constants, probably occur on atr
(ps) Z-1-d E-1-d time scale that approaches the time for rotational diffusionand may contribute to relaxation. In view of these uncertain-
Asparagine 18 290 225 ties, a spherical hydrodynamic model for asparagine wasGlutamine 21 290 225
assumed.Formamide 5.1 280 a 230a
The solid line through the data points in Fig. 5B is aNote. The data for formamide are taken from (22) and were obtained at simulated spectrum using a rotational correlation time, tr ,
a temperature of 257C. and quadrupole coupling constants shown in Table 1. Thea The assignment for the HZ and HE resonances was not given in Ref. parameters also simulate satisfactorily the experimental 2H
(22), and the allocation to a particular column is arbitrary.(T1 and T2) and 15N (T1 and NOE, with r* Å 0.045 s01)relaxation data. Using these parameters, the 15N linewidth isú98% dominated by the 2H quadrupolar-induced relaxationprocess. The dynamic frequency shift caused by the dipolar-without 2H decoupling (data not shown), is the additive sum
of the shifts for the E-1-d and Z-1-d isotopomers to within quadrupolar cross-correlation process (õ0.1 Hz) is too smallto be identifiable in these spectra.the digital resolution of the spectrum.
The dipolar interaction vector for 15N longitudinal and The different values found for the quadrupole couplingconstants of the DZ and DE deuterons in asparagine are simi-transverse relaxation is the 15N–H bond. The principal axis
of the assumed axially symmetric 2H electric-field-gradient lar in magnitude to those recently reported from liquid for-mamide (22) as seen from Table 1. Within the frameworktensor is assumed to be collinear with this 15N–D in-
ternuclear vector (52) . Chemical-shift anisotropy for 2H was of the relationship between e 2Qq /\ and hydrogen-bondstrength, these data for the free amino acid would implynot considered, because the reported values (37) are too
small to affect the spectra reported here. The axially symmet-ric 15N csa tensor was assumed to be collinear with either15N–D bond, although it may make an angle of 307 or 1507(38) . Neglect of this angle will overestimate the contributionof the (15N– 2H, 15N) dipolar-csa cross-correlation relaxationmechanism in those cases where it contributes significantly.For the free amino acids, this relaxation mechanism is quan-titatively negligible in comparison to the 2H-quadrupole-in-duced relaxation. For the protein data, it will cause an over-estimation of only about 5% to the total dynamic frequencyshift, d, or õ3% to the total relaxation matrix G . Further-more, the functions P2(cos uab ) which appear in the spectraldensity when cross correlations are present (54) will reduce,when using the above simplifications, in the limit that uQD
Å uDC Å 0, to the Lipari–Szabo notation where the orderparameter S 2 reflects details of the dynamics from processesinvolving auto and cross correlations.
A possible explanation for the observed relaxation differ-ences (2H and 15N) caused by a deuteron in the DZ or DE
position could be based on anisotropic rotational diffusion.The degree of anisotropy of the rotational diffusion tensorfor a rigid model of asparagine was calculated (55) by ap-
FIG. 6. Part of a two-dimensional 15N – 1H correlated data set re-proximating the structure as a set of nine identical spherical corded at 750 MHz from a sample of the protein F1-G at pH 3.0 andbeads, positioned at the coordinates of the heavy atoms of 107C. The assignments for all of the side-chain 1H and 15N resonances
of the asparagine and glutamine residues in this protein are indicated.the X-ray structure (56) . These hydrodynamic calculations
AID JMRB 7482 / 6o14h$$123 12-31-96 09:19:53 magbas AP: Mag Res, Series B

68 BOYD ET AL.
that the DE deuteron may be involved in a slightly strongerhydrogen bond than the DZ deuteron. Very similar 2H and15N spectral characteristics are observed if the amino acid ischanged to glutamine. Using a similar approach for the anal-ysis of 15N lineshape data, assuming isotropic motion, thevalues found for the quadrupole coupling constants of theDZ and DE deuterons are shown in Table 1.
In aniline derivatives, the magnitude of the 2D 13C(D)isotope shifts have been correlated to hydrogen-bondstrength (59) . Both the 1D 15N(D) and the 2DH(D) isotopeshifts are observed to be largest (although in opposite direc-tions) for the E-1-d isotopomer. Whether these particularisotope shifts correlate with H-bond energy in this type ofprimary amide is not established.
The 15N and 1H spectral regions corresponding to all theresonances from the asparagine and glutamine side chainsof the protein F1-G are shown in Fig. 6. A stereospecificassignment for the HE and HZ
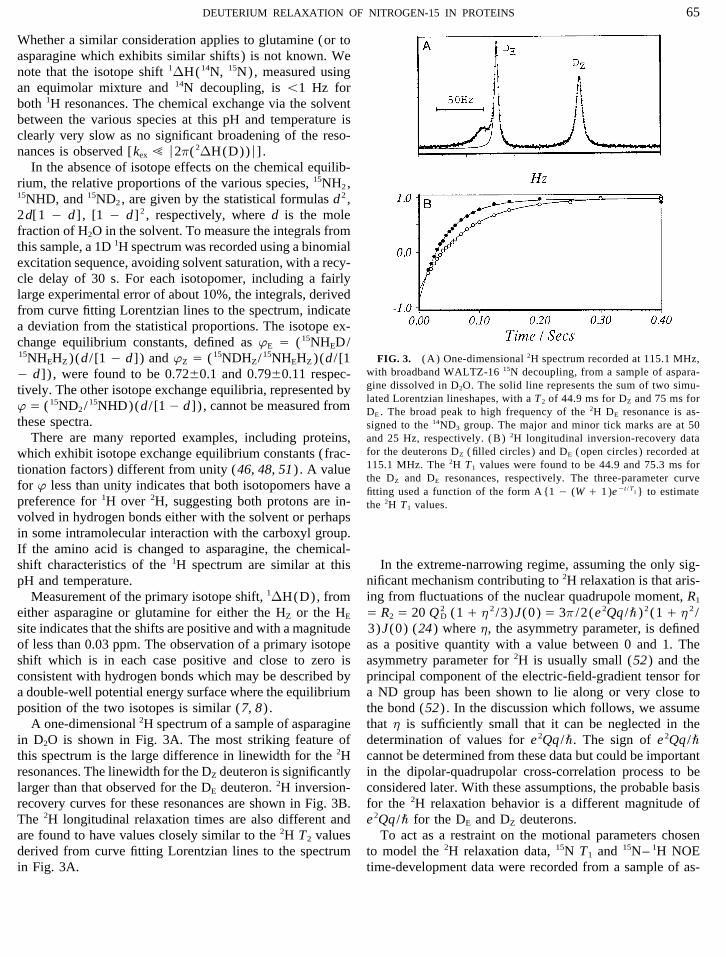
1H resonances was not at-tempted because of the uncertainty in the contributions tothe observed chemical shifts of these resonances from nearbyaromatic, carbonyl, or charged groups. 15N lineshapes fromresidues N37, Q63, Q17, Q74, and Q3 recorded from a sam-ple of the protein F1-G in an equimolar mixture of H2O/D2O are shown in Fig. 7, and quite asymmetric lineshapescan be observed for some of these resonances. In each dia-gram, the 15N resonance correlated to the 1H resonance athigh frequency is the lower trace.
As a restraint on the motional parameters necessary to fitthese data, an experimental measurement of the 15N– 1HNOE was made for the asparagine and glutamine side chainsfrom a sample of F1-G in a solvent ratio H2O/D2O of 95%/5%, at 15N frequencies of 76 and 50 MHz. The experimentalNOE values for the side-chain 15N resonances of residuesN37, Q63, Q17, Q74, and Q3 are shown in Table 2. For allof the asparagine and glutamine residues in F1-G, the side-chain 15N– 1H NOE values were found to either have thesame value, within an experimental error of {0.05, or in-crease as the 15N frequency increased. For the simple Lipari–Szabo model, using an isotropic rotational correlation time,tr , of 7.2 ns, these observations are only consistent if 10 psú t ú 300 ps independent of values for S 2 . If t lies withinFIG. 7. Experimental cross sections parallel to F1 at the 15N frequency,the range 10 to 300 ps, the NOE is predicted to significantlycorresponding to the 1H resonances from the unassigned isotopomers Z-1-
d and E-1-d, scalar coupled to 2H, recorded from the protein F1-G. The decrease with increasing 15N frequency. Three of the fiveexperimental data were obtained using the pulse sequence in Fig. 5A and residues chosen as examples (N37, Q63, and Q17) probablycomprised 128 complex points, dwell time 860 ms, which were apodized have similar motional characteristics as judged by the com-with a line broadening of 04 Hz and zero filled three times prior to Fourier
parable 15N– 1H NOE data, whereas the two remaining resi-transformation. The 15N spectra are from residues (A) N37, (B) Q63, (C)dues were found to have smaller NOE values, presumablyQ17, (D) Q74, and (E) Q3. Each diagram contains the experimental 15N–
2H coupled data (filled circles) and a simulation (solid line) . The dashed reflecting increasing mobility.line is the experimental data resulting from applying 2H and 1H decouplingduring the t1 evolution period (these data are displayed with an arbitraryvertical scale) . The vertical solid line is the first moment of the simulated defined in the legend to Fig. 5. The variables which are necessary andlineshape. The first moment was defined as SiAi /SAi , where Ai is the specific for each residue are shown in Table 2. In all cases, the resonanceamplitude of point i . The major and minor tick marks are at 50 and 25 Hz offset used for the simulations was obtained from the fully (1H and 2H)respectively. For the simulated lineshapes, the fixed parameters were as decoupled data set.
AID JMRB 7482 / 6o14h$$124 12-31-96 09:19:53 magbas AP: Mag Res, Series B

69DEUTERIUM RELAXATION OF NITROGEN-15 IN PROTEINS
TABLE 2Experimental 15N-1H Nuclear Overhauser Enhancements, h, for Some of the Asparagine and Glutamine Side Chains from the
Protein F1-G Measured at Field Strengths of 11.7 and 17.6 T, Quadrupole Coupling constants, e2Qq/\, Derived from Simulations tothe 15N Lineshapes Shown in Fig. 7, the Order Parameter S2, and t Used in the Simulations
e2Qq/\ (kHz)
h (11.7 T) h (17.6 T) a b S 2 t (ps)
N37 0.30 0.45 175 155 0.85 350Q17 0.35 0.45 215 195 0.83 350Q63 0.25 0.36 220 210 0.78 500Q74 00.02 0.04 190 150 0.70 350Q3 01.39 01.03 290 225 0.12a 360a
Note. The lower trace in each diagram (A–E) of Figure 7 is associated with the quadrupole coupling constant in column a.a For residue Q3, the extension to the Lipari–Szabo model of Clore et al. (60) was used where S2
s, S2f , and t were 0.3, 0.4, and 360 ps, respectively,
and S2 Å S2s 1 S2
f .
The values of e 2Qq /\ estimated from the simulations are estimate the experimental first moment. The first momentof the simulated data coincides in all cases with the peakshown in Table 2. For all the simulations, the asymmetry
parameter of the electric-field-gradient tensor was assumed maximum of the fully ( 1H and 2H) decoupled spectra, towithin the spectral digital resolution (1.2 Hz/point ) .to be small enough that it could be neglected. These values
for the quadrupole coupling constants have fairly large errors The magnitudes of e 2Qq /\ estimated for each deuteronsite from the spectra of residues N37 and Q74 are quitebecause of the relatively large number of input parameters
and assumptions necessary for the simulations. The quadru- different from the sample of the free amino acids ( seeTables 1 and 2) , whereas, those from Q63, Q17, and espe-pole coupling constants combined with the motional parame-
ters S 2 and t predict 2H T1 and T2 values (B0 Å 17.6 T) in cially Q3 are closer to the values found from a sample ofthe free amino acid glutamine. The motional parametersthe range of 9.3 to 21.6 ms and 0.7 to 3.2 ms respectively.
The composite parameter [10pT1( 2H)JND]2 is predicted, chosen for the simulated data adequately predict the ex-perimental 15N– 1H NOE measurements at both frequen-from the simulations, to vary from about 16 to 90. It has
been suggested (31) that whenever this parameter has a cies.The differences observed for the values of e 2Qq /\ andmagnitude greater than about 50, a lineshape with fine struc-
ture which may also be asymmetric will be observed; this the lack of a direct correlation to the 15N– 1H NOE data(N37, Q63, and Q17 have similar NOE values, but differ-is in agreement with the experimental and simulated spectra
shown in Fig. 7. The T1 of a 2H nucleus in a medium-sized ent quadrupole coupling constants were estimated forN37) could perhaps arise for several reasons. The varia-protein will be expected to increase as the magnetic field
strength increases so that these 15N asymmetric lineshapes tion in the quadrupole coupling constants of these threeresidues may indeed reflect aspects of hydrogen bonding.will only be observed at the highest currently available field
strengths when tr is around 7 ns. For instance, it has been noted previously that a departurefrom linearity in the hydrogen bond can produce a signifi-From the five simulated data sets, the dipolar–quadru-
polar cross-correlation term is, in all cases, positive, which cant change in the 2H quadrupole coupling constant (62 ) .Furthermore, the magnitude of the 2H electric-field gradi-implies that the quadrupole coupling constants are also
positive (with the assumption that uDQ Å 0) . The effect ent is determined largely by the charge distribution on theneighboring atoms (63 ) . The simulations have indicatedof 2H decoupling is to remove the contributions to 15N
relaxation from the 2H quadrupole and the ( 15N– 2H, 15N) that the quadrupole coupling constant of the deuteron ispositive. Consequently, a negative charge in some regioncsa–dipolar mechanisms (31 ) . A comparison of the 2H-
decoupled spectra with the 2H-coupled spectra, Fig. 7, along the ND axis, at the hydrogen-bond acceptor, shouldlead to a significant decrease in the electric-field gradientindicates that the chemical shift of the 15N resonance in the
presence of 2H decoupling occurs at the mean frequency of and to the observed quadrupole coupling constant. It isperhaps also possible that even if the CO of the amidethe 15N– 2H scalar-coupled multiplet. The mean frequency
of the 2H-coupled spectra can be calculated, if the S /N group participates as the acceptor in a hydrogen bond the2H nucleus, because of the resonance hybrid nature of theratio is high enough, via the first moment (61 ) of the
experimental spectrum or by using the simulated data to OCN group, may be sensitive to the charge density on the
AID JMRB 7482 / 6o14h$$124 12-31-96 09:19:53 magbas AP: Mag Res, Series B

70 BOYD ET AL.
17. N. Karlsbeek, K. Schaumberg, and S. Larsen, J. Mol. Struct. 299,carbonyl oxygen. In addition, if the side chain is exchang-155 (1993).ing rapidly between several different sites and if each site
18. U. Sternberg and E. Brunner, J. Magn. Reson. A 108, 142 (1994).gives rise to a different value for the quadrupole coupling19. N. J. Heaton, R. L. Vold, and R. R. Vold, J. Am. Chem. Soc. 111,constant, the observed value would reflect this exchange
3211 (1989).process. At this time, the definition of these side chains in20. W. Egan, G. Gunnarsson, T. W. Bull, and S. Forsen, J. Am. Chem.the NMR structures of F1-G is not sufficient to distinguish
Soc. 29, 4568 (1977).these possibilities.
21. L. M. Jackman, J. C. Trewella, and R. C. Haddon, J. Am. Chem.In this paper, we have demonstrated that it is possible Soc. 102, 2519 (1980).
to probe indirectly the environment of a 2H nucleus in a 22. R. Ludwig, J. Bohmann, and T. C. Farrar, J. Phys. Chem. 99, 9681protein, in a specific case, through the influence it has (1995).upon the transverse relaxation of a 15N nucleus to which 23. J. A. Pople, Mol. Phys. 1, 198 (1957).it is scalar coupled. Large differences have been observed 24. A. Abragam, ‘‘The Principles of Nuclear Magnetism,’’ Clarendonfor e 2Qq /\ of the deuteron in the side chains of asparagine Press, Oxford, 1961.and glutamine residues of the protein F1-G, derived from 25. R. K. Harris and N. C. Pyper, Mol. Phys. 20, 467 (1971).simulations of experimental 15N– 2H scalar-coupled line- 26. L. G. Werbelow, J. Magn. Reson. 67, 66 (1986).shapes. 27. L. G. Werbelow, A. Allouche, and G. Pouzard, J. Chem. Soc. Fara-
day Trans. 83, 871 (1987).
28. R. E. London, D. M. LeMaster, and L. G. Werbelow, J. Am. Chem.ACKNOWLEDGMENTSSoc. 116, 8400 (1994).
29. S. Grzesiek and A. Bax, J. Am. Chem. Soc. 116, 10,196 (1994).This work is a contribution from the Oxford Centre for MolecularSciences, which is supported by the BBSRC and MRC. The 750 MHz 30. L. G. Werbelow and R. E. London, J. Chem. Phys. 102, 5181NMR instrument was partly funded by the LINK protein engineering (1995).project with industrial partners Zeneca and Oxford Instruments. One of 31. N. Murali and B. D. Nageswara Rao, J. Magn. Reson. A 118, 202us, T.K.M., thanks the INLAKS foundation for financial support. (1996).
32. R. R. Ernst, G. Bodenhausen, and A. Wokaun, ‘‘Principles of Nu-clear Magnetic Resonance in One and Two Dimensions,’’REFERENCESClarendon Press, Oxford, 1987.
33. C. N. Banwell and H. Primas, Mol. Phys. 6, 225 (1963).1. B. M. P. Huyghues-Despointes, T. M. Klingler, and R. L. Baldwin,Biochemistry 34, 13,267 (1995). 34. C. E. M. Fouques and L. G. Werbelow, Can. J. Chem. 57, 2329
(1979).2. N. Dekker, M. Cox, R. Boelens, C. P. Verrijzer, P. C. Van der Vliet,and R. Kaptein, Nature 362, 852 (1993). 35. J. McConnell, ‘‘The Theory of Nuclear Magnetic Relaxation in Liq-
uids,’’ Cambridge Univ. Press, Cambridge, 1987.3. T. Yamazaki, S. M. Pascal, A. V. Singer, J. D. Forman-Kay, andL. E. Kay, J. Am. Chem. Soc. 117, 3556 (1995). 36. G. Lipari and A. Szabo, J. Am. Chem. Soc. 104, 4546 (1982).
4. R. X. Xu, J. M. Word, D. G. Davis, M. J. Rink, D. H. Willard, Jr., and 37. C. A. Michal, J. C. Wehman, and L. W. Jelinski, J. Magn. Reson.R. T. Gampe, Jr., Biochemistry 34, 2107 (1995). B 111, 31 (1996).
5. S. S. Narula, R. W. Yuan, S. E. Adams, O. M. Green, J. M. Green, 38. J. Herzfield, J. E. Roberts, and R. G. Griffin, J. Chem. Phys. 86,T. B. Philips, L. D. Zydowsky, M. C. Botfield, M. Hatada, E. R. Laird, 597 (1987).R. J. Zoller, J. L. Karas, and D. C. Dalgarno, Structure 3, 1061 39. B. O. Smith, A. K. Downing, T. J. Dudgeon, M. Cunningham, P. C.(1995). Driscoll, and I. D. Campbell, Biochemistry 33, 2422 (1994).
6. C. L. Perrin, Science 266, 1665 (1995). 40. B. O. Smith, A. K. Downing, P. C. Driscoll, T. J. Dudgeon, and I. D.7. G. Gunnarsson, H. Wennerstrom, W. Egan, and S. Forsen, Chem. Campbell, Structure 3, 823 (1995).
Phys. Lett. 38, 96 (1976).41. N. R. Krishna, K. P. Sarathy, D. Huang, R. L. Stephens, J. D. Glick-
8. L. J. Altman, D. Laungani, G. Gunnarsson, H. Wennerstrom, and son, C. W. Smith, and R. Walter, J. Am. Chem. Soc. 104, 5051S. Forsen, J. Am. Chem. Soc. 100, 8264 (1978). (1982).
9. A. Pardi, G. Wagner, and K. Wuthrich, Eur. J. Biochem. 137, 445 42. N. Soffe, J. Boyd, and M. Leonard, J. Magn. Reson. A 116, 117(1983). (1995).
10. G. Wagner, A. Pardi, and K. Wuthrich, J. Am. Chem. Soc. 105, 43. C. L. Perrin, J. D. Thoburn, and A. J. Kresge, J. Am. Chem. Soc.5948 (1983). 114, 8800 (1992).
11. M. Weissman, J. Chem. Phys. 44, 422 (1966). 44. M. Wolfsberg, Acc. Chem. Res. 20, 449 (1972).12. L. G. Butler and T. L. Brown, J. Am. Chem. Soc. 103, 6541 (1981). 45. G. Jansco and W. A. van Hook, Chem. Rev. 74, 689 (1974).13. R. Blinc and D. Hadzi, Nature 212, 1307 (1966). 46. K. B. Schowen and R. L. Schowen, Methods Enzymol. 87, 551
(1982).14. T. Chiba, Bull. Chem. Soc. Jpn. 43, 1939 (1970).
15. M. J. Hunt and A. L. Mckay, J. Magn. Reson. 15, 402 (1974). 47. A. G. Redfield and S. Waelder, J. Am. Chem. Soc. 101, 6151(1979).16. B. Berglund, J. Lindgren, and J. Tegenfeldt, J. Mol. Struct. 43, 179
(1978). 48. P. E. Hansen, Prog. NMR Spectrosc. 20, 207 (1988).
AID JMRB 7482 / 6o14h$$124 12-31-96 09:19:53 magbas AP: Mag Res, Series B

71DEUTERIUM RELAXATION OF NITROGEN-15 IN PROTEINS
49. G. Fraenkel, Y. Asahi, H. Batiz-Hernandez, and R. A. Bernheim, J. 57. A. Bax, M. Ikura, L. E. Kay, D. A. Torchia, and R. Tschudin, J. Magn.Reson. 86, 304 (1990).Chem. Phys. 44, 4647 (1966).
58. L. E. Kay, P. Keifer, and T. Saarinen, J. Am. Chem. Soc. 114, 1066350. M. Shporer and A. Loewenstein, Mol. Phys. 15, 9 (1988).(1992).
51. S. N. Loh and J. L. Markley, Biochemistry 33, 1029 (1994). 59. J. Reuben, J. Am. Chem. Soc. 109, 316 (1987).52. R. R. Vold and R. L. Vold, Adv. Magn. Opt. Reson. 16, 85 (1991). 60. G. M. Clore, A. Szabo, A. Bax, L. E. Kay, P. C. Driscoll, and A. M.
Gronenborn, J. Am. Chem. Soc. 112, 4989 (1990).53. J. Boyd, J. Magn. Reson. B 107, 279 (1995).61. J. A. Pople, W. G. Schneider, and H. J. Bernstein, ‘‘High Resolu-54. V. A. Daragen and K. H. Mayo, J. Phys. Chem. 98, 10,949 (1994).
tion Nuclear Magnetic Resonance,’’ McGraw–Hill, New York,55. J. Garcia de la Torre and V. A. Bloomfield, Q. Rev. Biophys. 14, 81 1959.
(1981). 62. L. G. Butler and T. L. Brown, J. Am. Chem. Soc. 103, 6541 (1981).63. L. C. Snyder, J. Chem. Phys. 68, 291 (1978).56. G. Kartha and A. de Vries, Nature 192, 862 (1961).
AID JMRB 7482 / 6o14h$$125 12-31-96 09:19:53 magbas AP: Mag Res, Series B