Embed Size (px)
Citation preview
Information and Knowledge Management www.iiste.org
ISSN 2224-5758 (Paper) ISSN 2224-896X (Online)
Vol.5, No.1, 2015
112
The Income Groups of Countries: An Approach of Management
Information Systems via Networked Readiness Index
Ass.Prof.Dr. Zehra Alakoç Burma*
Mersin Vocational High School, Mersin University, Tece Campus, 33290, Mersin, Turkey
* E-mail of the corresponding author: [email protected]
Abstract
The main aim of this study is to utilize discriminant analysis to explain the relationship between the income groups, which was determined by the World Bank for 148 countries, and the Networked Readiness Index (NRI) values calculated for the same 148 countries given in the "Global Information Technology" report 2014, which is published by the World Economic Forum since 2001. In addition, it is aimed to put forward the administrative uses necessary to increase the income levels of countries through utilization of the NRI, which is a performance analysis on the use of information technologies in a country and hence is an index that comparatively measures the level of readiness of countries to use Information and Communication Technologies (ICTs), according to the findings obtained by comparing the NRI 2013 and NRI 2014 values of these countries. In this study, July 2014 World Bank Income groups (low income, lower middle income, upper middle income, high income:Non-OECD and high income:OECD) were used as the dependent variables, and 4 main Indicators of the NRI 2014 values, and 54 sub-index values were used as independent variables. The hypothesis of this study investigates whether the income groups of each country can be predicted by the components of the NRI index correctly. For this purpose, five different Fischer discriminant analyses were carried out by using the sub-indexes of the NRI both individually and in combination to calculate the extent which these components explain the income groups, and the results were presented in tables and graphs. In addition, the data analysis was supported with ANOVA, MANOVA and Post Hoc Tukey's test. The accuracy rate was found to be 94.0% in explaining the income groups of the countries when all sub-index values of the NRI were taken into account with the help of the discriminant functions which can be formed in accordance with the findings of the study. Among these groups, it explained the most of the variance in the High income:Non-OECD - High income:OECD - Low income group (100%), and the least of the variance in the Upper middle income group (88.2%). Considering the differences between the NRI 2014 and NRI 2013, the differences in the High income:OECD, high income:Non-OECD and upper middle income groups were statistically significant. The Territorial map created by the NRI 2014 values revealed that the Upper middle income group is located at the center. Besides other few methods, the NRI is a completely effective criterion for a country in this group to rise into the high income:OECD and high income:Non-OECD groups, which are the next upper economic groups. This map also helps to determine which income group rises or falls to which income groups when they increase or decrease their NRI values. And, the NRI values that converge or diverge the countries or the NRI values common among the countries in the income groups are determined with the help of a network graph created.
Keywords: Global Information Technology Report, management, Networked Readiness Index (NRI), income group, Information and Communication Technologies (ICTs), discriminant analysis, big data
1. Introduction
World Economic Forum published the 2014 values for the NRI, which is a performance analysis on the use of information technologies in a country and hence is an index published since 2001 that comparatively measures level of readiness of countries to use Information and Communication Technologies (ICTs). The Forum called the 2014 report as "The Global Information Technology Report 2014 Rewards and Risks of Big Data". The importance of the big data concept, which is used in the report title for the first time, was emphasized in the report thoroughly. And, we used the global NRI big data values in this study. When The Global Information Technology Report (GITR) and the Networked Readiness Index (NRI) were created more than 13 years ago, the attention of decision makers was focused on how to develop strategies that would allow them to benefit from what Time Magazine had described as "the new economy": a new way of organizing and managing economic activity based on the new opportunities that the Internet provided for businesses (Alexander 1983). For more than 13 years, the NRI has provided decision makers with a useful conceptual framework to evaluate the impact of ICT's at a global level and to benchmark the ICT readiness and usage of their economies (Bilbao-Osorio et al. 2014).
Information and Knowledge Management www.iiste.org
ISSN 2224-5758 (Paper) ISSN 2224-896X (Online)
Vol.5, No.1, 2015
113
With innovations in the ICT technology moving at an amazing speed, almost on a monthly or even weekly basis new inventions are made and shared with the rest of the World through various avenues. People are the most important ones in new technologies that get to the market place. Customers are the ones who set the demand and consumption of the ICT products in the market place. This key point ensures that service delivery in government, which is (em)powered by technology, moves at an accelerated speed. (Gov-Tech 2014)
Today, all countries invest in information technologies most since it is known by everyone that only the countries which produce and use information efficiently will corner the world economy and the countries unable to perform this will fall behind. According to Susman & Santoz (2000:429), the information-based investments are for increasing "efficiency" and "effectiveness", and the main purpose of these investments is to accelerate the progress of these countries, as well as to increase their present welfare level.
And, the managers have to feel the conditions of organizations, make decisions and solve problems. As in every area, there have been certain changes in the management approach; and, the companies are not managed now as before. The managers now not only manage the current situation, but also recreate the organization with new products and services. The information technologies, which is one of the tools used by today's managers to deal with change, will play a significant role in creating and delivering new products and services, re-orientation and restructuring of the organizations by the managers (Laudon & Laudon 2010).
Smart phones, smart TVs and tablets are now not only a tool used for entertainment; instead they represent a new emerging computing platform today. Companies are adapting their software quickly to these smart mobile devices, and managers use these devices to coordinate the tasks, to communicate with employees, to make decisions and to manage the business.
Information flows and networks have spread across borders in ways that could not be imagined before the onset of the Internet, the global adoption of mobile telephony and social networks, and the rapid growth of broadband. Business models have been redefined, the workplace has been redesigned, small startups have evolved into large companies, and entire functions of society (education, health, security, privacy) are being rethought (Robert Crown Law Library Blog 2014).
The World Bank divides countries into several groups in their statistics and evaluations. The established main criterion is the Gross National Income (GNI) per capita. Based on the GNI, each country has been classified as the low income, middle income (divided into two, as the lower middle and upper middle) and high income (divided into two, as the High income:OECD and High income:Non-OECD) (Eksisozluk (2014).
2. Global Information Technology Report and the Networked Readiness Index
Definition of the Networked Readiness Index (NRI): Networked Readiness Index is published by the World Economic Forum since 2001. In 2014 the 14th edition of this index was published, which investigates the extent of readiness of countries to use information technologies, the extent of adoption of these technologies by individuals, businesses and public administration, and the transformative effects of these technologies on the economy and society. The number of countries changes each year in the report, and the report presents the NRI values and ranks of each country.
Developed by the Forum, the NRI also determines the level of participation of a country or a society in the developments in information technology. Since the NRI reveals also the strengths and weaknesses of a country with regard to informatics, it is also possible to follow competition between countries. The Networked Readiness Index (NRI) values and the rankings based on these values in the report show the social and economic impacts, as well as the impacts on countries' competitiveness caused by the information technologies. The NRI values, ranks and income groups of 30 prominent countries calculated for the 2014 are given in the following table-1:

Information and Knowledge Management www.iiste.org
ISSN 2224-5758 (Paper) ISSN 2224-896X (Online)
Vol.5, No.1, 2015
114
Table 1 : NRI values are related in some countries values and ranks are as follows. Rank Country Value Income Group Rank Country Value Income Group
1 Finland 6.04 High income:OECD 17 Canada 5.41 High income:OECD
2 Singapore 5.97 Highincome:nonOECD 18 Australia 5.40 High income:OECD
3 Sweeden 5.93 High income:OECD 20 New Zealand 5.27 High income:OECD
4 Netherland 5.79 High income:OECD 24 Un.Arab.Emir 5.20 Highincome:nonOECD
5 Norway 5.70 High income:OECD 25 France 5.09 High income:OECD
6 Switzerland 5.62 High income:OECD 32 Saudi Arabia 4.78 Highincome:nonOECD
7 United States 5.61 High income:OECD 34 Spain 4.69 High income:OECD
8 Hong Kong SAR 5.60 Highincome:nonOECD 50 Russian Fed. 4.30 Highincome:nonOECD
9 United Kingdom 5.54 High income:OECD 51 Turkey 4.30 Upper middle income
10 Korea Rep. 5.54 High income:OECD 58 Italy 4.18 High income:OECD
12 Germany 5.50 High income:OECD 62 China 4.05 Upper middle income
13 Denmark 5.50 High income:OECD 67 Thailand 4.01 Upper middle income
14 Taiwan, Chine 5.47 Highincome:nonOECD 83 India 3.85 Lower middle income
15 Israel 5.42 High income:OECD 100 Argentina 3,53 Upper middle income
16 Japan 5.41 High income:OECD 148 Chad 2,22 Low income
The report underlines the fact that there are limiting issues in the estimation of the index, therefore, while making comments regarding the position of countries and making comparisons, attention should be paid particularly to those social and economic peculiarities in countries like India, so as to reach proper interpretations (TUSIAD 2012)
Elements of the Networked Readiness Index: World Economic Forum uses 90 indicators and variables in the calculation of the NRI. These 90 indicators and variables are reduced to 54 variables and then to 10 sub-indexes of the NRI through a statistical analysis. The networked readiness framework translates into the NRI, comprising four sub-indexes that measure the environment for ICTs; the readiness of a society to use ICTs; the actual usage of all main stakeholders; and, finally, the impacts that ICTs generate in the economy and in society. The first three sub-indexes can be regarded as the drivers that establish the conditions for the results of the fourth sub-index, ICT impacts. NRI four main indexes: Environment Sub-index (A), Readiness Sub-index (B), Usage Sub-index (C) and Impact Sub-index (D). Information and Communication Technologies (ICTs) lead to positive developments in the organizations, management, productivity, and hence the welfare of countries. Regarding this positive impact, it is important to analyze and identify the position of countries accurately in terms of ICT indexes, which is an important factor for companies, and hence the countries, to achieve their targets by acquiring a sustainable competitive advantage. The final NRI score is a simple average of the four sub-index scores, while each of the 54 sub-factor's score is a simple average of those of the composing pillars.
Calculation of the NRI: World Economic Forum uses two types of data in the calculation of the NRI. The first of these is the data set obtained from the Executive Opinion Survey prepared for the Global Competitiveness Report, and the latter is the data obtained from international institutions such as the World Bank and the International Telecommunication Union (ITU). In the report, the use of the findings obtained from the global competitiveness report indicates the importance of ICTs for competition. In the calculation of the index, the data are scored first by a 7-point scale to ensure equal distribution of each part. Then each sub-index is calculated by taking the weighted average of the related data. And, the index of the components is calculated through the same method by taking averages of the sub-indexes. Finally, the NRI is calculated by taking the average of the indexes of the four components. The NRI indices are given in the following table-2.

Information and Knowledge Management www.iiste.org
ISSN 2224-5758 (Paper) ISSN 2224-896X (Online)
Vol.5, No.1, 2015
115
Table -2 : The Networked Readiness Index 2014
Environment
subindex
1/2 Political and regulatory environment 1/2 Business and innovation environment
1st pillar: Political and regulatory environment
1.01 Effectiveness of law-making bodies* 1.02 Laws relating to ICTs* 1.03 Judicial independence* 1.04 Efficiency of legal system in settling disputes* 1.05 Efficiency of legal system in challenging regulations* 1.06 Intellectual property protection* 1.07 Software piracy rate, % software installed 1.08 Number of procedures to enforce a contractd 1.09 Number of days to enforce a contract
2nd pillar: Business and innovation environment
2.01 Availability of latest technologies* 2.02 Venture capital availability* 2.03 Total tax rate, % profits 2.04 Number of days to start a businesse 2.05 Number of procedures to start a businesse 2.06 Intensity of local competition* 2.07 Tertiary education gross enrollment rate, % 2.08 Quality of management schools* 2.09 Government procurement of advanced technology products*
Readiness
subindex
1/3 Infrastructure and digital content 1/3 Affordability 1/3 Skills
3rd pillar: Infrastructure and digital content
3.01 Electricity production, kWh/capita 3.02 Mobile network coverage, % population 3.03 International Internet bandwidth, kb/s per user 3.04 Secure Internet servers per million population 3.05 Accessibility of digital content*
4th pillar: Affordability
4.01 Mobile cellular tariffs, PPP $/min. 4.02 Fixed broadband Internet tariffs, PPP $/month 4.03 Internet and telephony sectors competition index, 0–2 (best)
5th pillar: Skills
5.01 Quality of educational system* 5.02 Quality of math and science education* 5.03 Secondary education gross enrollment rate, % 5.04 Adult literacy rate, %
Usage subindex
1/3 Individual usage 1/3 Business usage 1/3 Government usage
6th pillar: Individual usage
6.01 Mobile phone subscriptions per 100 population 6.02 Percentage of individuals using the Internet 6.03 Percentage of households with computer 6.04 Households with Internet access, % 6.05 Fixed broadband Internet subscriptions per 100 population 6.06 Mobile broadband Internet subscriptions per 100 population 6.07 Use of virtual social networks*
7th pillar: Business usage
7.01 Firm-level technology absorption* 7.02 Capacity for innovation* 7.03 PCT patent applications per million population 7.04 Business-to-business Internet use*g 7.05 Business-to-consumer Internet use*g 7.06 Extent of staff training*
8th pillar: Government usage
8.01 Importance of ICTs to government vision of the future* 8.02 Government Online Service Index, 0–1 (best) 8.03 Government success in ICT promotion*
Impact subindex
1/2 Economic impacts 1/2 Social impacts
9th pillar: Economic impacts
9.01 Impact of ICTs on new services and products* 9.02 PCT ICT patent applications per million population 9.03 Impact of ICTs on new organizational models* 9.04 Employment in knowledge-intensive activities, % Workforce
10th pillar: Social impacts
10.01 Impact of ICTs on access to basic services* 10.02 Internet access in schools* 10.03 ICT use and government efficiency* 10.04 E-Participation Index, 0–1 (best)
Information and Knowledge Management www.iiste.org
ISSN 2224-5758 (Paper) ISSN 2224-896X (Online)
Vol.5, No.1, 2015
116
3. Materials And Methods
In this study, July 2014 World Bank Income groups (low income, lower middle income, upper middle income, high income:Non-OECD and high income:OECD) were used as the dependent variables; and 4 main indicators (A, B, C, D) from the NRI 2014 values, and 54 sub-index values were used as independent variables. The hypothesis of this study investigates whether the income groups of each country can be predicted by the components of the NRI index correctly. For this purpose, five different Fischer discriminant analyses were performed by using the sub-components of the NRI individually and in combination to calculate the extent that these components explain the income groups, and the results were presented in tables and graphs. In addition, the data analysis was supported with ANOVA, MANOVA and Post Hoc Tukey's test.
The Discriminant Analysis was first used in 1930 and is still used in various fields. First, it was used in the behavioral sciences and biology, and later it was started to be used also in the solution of financial problems (such as consumer loan assessment).
Discriminant analysis is a statistical technique used to classify observations into one of several a priori groups, depending on their individual characteristics (Altman 1965). It finds the dimension(s) that maximize the difference between groups and determines the group memberships based on the differences of the independent variables used (Alpar 2011). Particularly, it is used for classification or forecasting when the dependent variable consists of attributes, such as male/female or bankruptcy/non-bankruptcy. As a first step, it is necessary to know the groups in advance. Variables with two or more groups can be included in the study. The discriminant analysis tries to obtain the best discriminants between the groups with the help of linear combinations after creating the groups. For example, discriminant coefficients can be set by all measurable features of a company (financial ratios). These coefficients form a basis for mutually exclusive groups, when they are applied to the original rates (Altman 1965).
We used the accuracy rates to explain the effectiveness of the questions that form the NRI in differentiating the income groups, by assigning these groups as the dependent variable in our study. According to these results, the accuracy rate in explaining the income groups was found to be 94.0%, considering all the sub-groups that form the NRI index. Among these groups, High income:Non-OECD - High income:OECD - Low income groups were found to be explained most (100%), and the Upper middle income group was found to be explained least (88.2%). Looking at the individual criteria, the "Skills" criterion (5th criterion) has the highest accuracy rate (60.8%) in explaining the income groups. Among these groups, it explained the most of the variance in the High income:OECD (96.8%) group and the least of the variance in the Lower middle income (28.6%) group. If we group the criteria, the "Readiness sub-index: 1/3 infrastructure and digital content + 1/3 affordability + 1/3 skills" criteria (B3-B4-B5 criteria) have the highest accuracy rate (63.3%) in explaining the income groups. Among these groups, it explained the most of the variance in the Low income group (82.6%) and the least of the variance in the Lower middle income group (34.3%).
4. Research Methodology
The purpose of this study is to investigate the relationship between July 2014 World Bank Country Income groups and the NRI index values published in the World Economic Forum Global Information Technology Report 2014, and the extent that these values explain the country income-levels and whether this index accurately predicts the income groups of countries. In the study, it is tried to determine the predictive power of the NRI in the income groups and its success in differentiating the income groups. In addition, the differences between income groups were evaluated in terms of the NRI 2014 and NRI 2013 values.
In this study, the paired t-test was used to compare the means of two groups depending on the NRI 2014 and NRI 2013 index values for each group separately. One-way analysis of variance (ANOVA) was applied to the differences between the groups for each sub-item of the NRI index. A post Hoc evaluation was performed with Tukey's test. The Multiple Analysis of Variance (MANOVA) was applied to find the overall difference between groups by using a combination of all sub-items of the NRI index.
Two data sets were used in this study. The first data set was the 10 sub-indexes and the values of its 54 variables from the Networked Readiness Index created by the World Economic Forum for 148 countries in 2013 and 2014. The second data set consists of the World Bank income group values of these 148 NRI countries in July 2014. The income-group values are divided into low income, lower middle income, upper middle income, high income:Non-OECD and high income:OECD groups.
In the study, the multivariate discriminant analysis, which is a conceptually and mathematically powerful

Information and Knowledge Management www.iiste.org
ISSN 2224-5758 (Paper) ISSN 2224-896X (Online)
Vol.5, No.1, 2015
117
statistics method, was used. The discriminant analysis has two main goals of discrimination and classification (Özdamar, 1999:320), and it estimates the class membership of the independent variables (Johnson, 1988,217).
Discriminant analysis is used to classify individuals or entities by using discriminant prediction-equation (function), to test theories about the classification of individuals or entities based on the estimates, to investigate the differences between the groups, to determine the most conservative way of differentiating the groups, to determine the variance in the dependent variables explained by the independent variables, to assess the relative importance of the independent variables in a classification based on dependent variables, to eliminate insignificant variables or the variables with little importance in differentiating the groups, and so on (Büyüköztürk Ş. & Bökeoğlu, Ö.Ç. 2014).
Discriminant analysis also reveals the estimate variables effective in the differences between the groups. In addition, it identifies the exact group of an entity, which its groups are unknown (Ünsal, 2000).
Acknowledgment
Multivariate data analysis of this study was carried out by a professional consulting service ( http://www.mestacon.info/ http://turkey.mestacon.com/ ). The service cost was paid by the researcher without any project support or financial support.
Limitations
The NRI-2014 index has a total of 118 values for each of the 148 countries. These values consist of four main indicators, 54 sub-indexes and 59 rank values that indicate the order of these values among the countries. One of the factors in calling the report as a big data is its excessive amount of data. It was not possible to interpret the whole lot of data in this article. However, tables and graphs will help readers to draw their own conclusions.
5. Results
The findings we obtained by applying the Discriminant analysis in order to see the criterion with best predictive power among the factors of the NRI are given in Table-3. In the table, each criterion was examined separately in terms of its individual factors and the group(s), which these factors explained the most and the least of the variance were presented together with their accuracy rates.
Table 3 : According to the results of discriminant analysis occurary% of the criteria in the model
Criteria Accuracy
rate Highest group
Highest
group (%) Lowest group
Lowest
group (%)
1 65,1 High income: OECD 87,1 Upper middle income 32,4
2 60,1 Low income 91,3 High income: nonOECD-
Lower middle income 40
3 55,5 Low income 100 Lower middle income 0
4 32,4 High income: OECD 90,3 Upper middle income 7,7
5 60,8 High income: OECD 96,8 Lower middle income 28,6
6 68 Low income 100 High income: nonOECD 55
7 45,2 Low income 95,7 High income: nonOECD 0
8 43,8 Low income 69,6 Lower middle income 14,3
9 58,8 Low income 93,8 Lower middle income 43,3
10 54,5 Low income 77,3 Lower middle income 34,3
A1-A2 52,7 Low income 69,6 Lower middle income 42,9
B3-B4-B5 63,3 Low income 82,6 Lower middle income 34,3
C6-C7-C8 62,8 Low income 91,3 Lower middle income 42,9

Information and Knowledge Management www.iiste.org
ISSN 2224-5758 (Paper) ISSN 2224-896X (Online)
Vol.5, No.1, 2015
118
D9-D10 49,3 Low income 73,9 Lower middle income 22,9
A-B-C-D 58,8 Low income 69,6 High income: nonOECD 45
All sub Groups
94
High income: nonOECD- High
income: OECD- Low income
100 Upper middle income 88,2
Given the political and regulatory environment criterion (criterion 1), the accuracy rate in explaining the income groups was found to be 65.1%. Among these groups, it explained the most of the variance in the High income:OECD group (87.1%) and the least of the variance in the Upper middle income group (32.4%).
Considering the business and innovation environment (criterion 2), the accuracy rate in explaining the income groups was found to be 60.1%. Among these groups, it explained the most of the variance in the Low income group (91.3%) and the least of the variance in the High income:Non-OECD and Lower middle income groups (40.0%).
Given the infrastructure and digital content criterion (criterion 3), the accuracy rate in explaining the income groups was found to be 55.5%. Among these groups, it explained the most of the variance in the Low income group (100%) and the least of the variance in the Lower middle income group (0.0%).
Given the affordability criterion (criterion 4), the accuracy rate in explaining the income groups was found to be 32.4%. Among these groups, it explained the most of the variance in the High income:OECD group (90.3%) and the least of the variance in the Upper middle income group (7.7%).
Considering the skills-criterion (criterion 5), the accuracy rate in explaining the income groups was found to be 60.8%. Among these groups, it explained the most of the variance in the High income:OECD (96.8%) group and the least of the variance in the Lower middle income (28.6%) group.
Considering the individual usage criterion (criterion 6), the accuracy rate in explaining the income groups was found to be 68.0%. Among these groups, it explained the most of the variance in the Low income group (100%) and the least of the variance in the High income:Non-OECD group (55.0%).
Given the business usage criterion (criterion 7), the accuracy rate in explaining the income groups was found to be 45.2%. Among these groups, it explained the most of the variance in the Low income group (95.7%) and the least of the variance in the High income:Non-OECD group (0.0%).
Given the governmental usage criterion (criterion 8), the accuracy rate in explaining the income groups was found to be 43.8%. Among these groups, it explained the most of the variance in the Low income group (69.6%) and the least of the variance in the Lower middle income group (14.3%).
Given the economic impacts criterion (criterion 9), the accuracy rate in explaining the income groups was found to be 58.8%. Among these groups, it explained the most of the variance in the Low income group (93.8%) and the least of the variance in the Lower middle income group (43.3%).
And, given the social impacts criterion (criterion 10), the accuracy rate in explaining the income groups was found to be 54.5%. Among these groups, it explained the most of the variance in the Low income group (77.3%) and the least of the variance in the Lower middle income group (34.3%).
Environment sub-index: Looking at the 1/2 political and regulatory environment + 1/2 business and innovation environment criteria (A1-A2 criteria), the accuracy rate in explaining the income groups was found to be 52.7%. Among these groups, it explained the most of the variance in the Low income group (69.6%) and the least of the variance in the Lower middle income group (42.9%).
Readiness sub-index: Given the 1/3 infrastructure and digital content + 1/3 affordability + 1/3 skills criteria (B3-B4-B5 criteria), the accuracy rate in explaining the income groups was found to be 63.3%. Among these groups, it explained the most of the variance in the Low income group (82.6%) and the least of the variance in the Lower middle income group (34.3%).
Usage sub-index: Looking at the 1/3 individual usage + 1/3 business usage + 1/3 governmental usage criteria (C6-C7-C8 criteria), the accuracy rate in explaining the income groups was found to be 62.8%. Among these groups, it explained the most of the variance in the Low income group (91.3%) and the least of the variance in the Lower middle income group (42.9%).
Impacts sub-index: Considering the 1/2 economic impacts + 1/2 social impacts criteria (D9-D10 criteria), the

Information and Knowledge Management www.iiste.org
ISSN 2224-5758 (Paper) ISSN 2224-896X (Online)
Vol.5, No.1, 2015
119
accuracy rate in explaining the income groups was found to be 49.3%. Among these groups, it explained the most of the variance in the Low income group (73.9%) and the least of the variance in the Lower middle income group (22.9%).
Given the NRI's A-B-C-D criteria, the accuracy rate in explaining the income groups was found to be 58.8%. Among these groups, it explained the most of the variance in the Low income group (69.6%) and the least of the variance in the High income:Non-OECD group (45.0%).
Considering all subgroups, the accuracy rate in explaining the income groups was found to be 94.0%. Among these groups, High income:Non-OECD - High income:OECD - Low income groups were found to be explained most (100%), and the Upper middle income group was found to be explained least (88.2%).
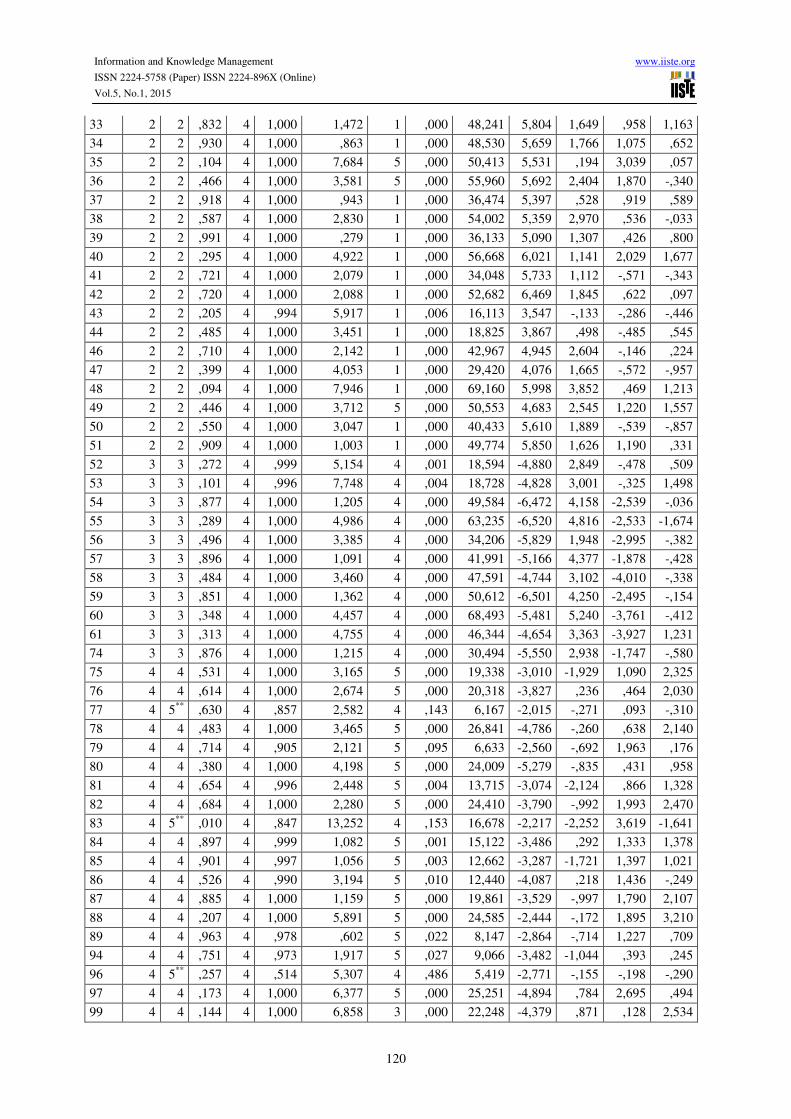
Estimated places and placement probabilities of the countries according to the discriminant analysis results are given in Table-4.
Table 4. Estimated places and placement probabilities of the countries according to the discriminant analysis results
Country
Actual
Group
Highest Group Second Highest Group Discriminant Scores
Predicted Group
P(D>d | G=g)
P(G=g | D=d)
Squared Mahalano
bis Distance
to Centroid
Group
P(G=g | D=d)
Squared Mahalan
obis Distance
to Centroid
Function 1
Function 2
Function 3
Function 4 p df
1 1 1 ,293 4 1,000 4,949 5 ,000 36,571 2,057 -3,737 -3,633 -1,220
2 1 1 ,465 4 1,000 3,585 5 ,000 41,304 1,684 -1,801 -4,610 1,081
3 1 1 ,607 4 1,000 2,715 5 ,000 24,991 2,158 -2,849 -2,624 -1,092
4 1 1 ,349 4 ,981 4,443 5 ,019 12,328 ,201 -1,326 -2,230 ,250
5 1 1 ,702 4 1,000 2,184 5 ,000 25,262 ,486 -2,259 -3,523 ,555
6 1 1 ,832 4 1,000 1,470 2 ,000 32,789 2,916 -2,223 -3,341 ,113
8 1 1 ,204 4 ,997 5,933 2 ,003 17,784 2,965 -1,844 -,980 1,077
9 1 1 ,112 4 ,716 7,491 5 ,284 9,341 1,216 -,621 -1,496 -,873
10 1 1 ,554 4 1,000 3,021 5 ,000 39,591 2,495 -3,496 -2,717 1,615
11 1 1 ,684 4 1,000 2,284 5 ,000 21,414 1,055 -3,156 -1,951 ,823
13 1 1 ,626 4 1,000 2,607 5 ,000 37,906 1,757 -3,220 -3,146 1,828
14 1 1 ,289 4 ,941 4,980 5 ,059 10,533 ,500 -1,486 -1,439 ,563
15 1 1 ,862 4 1,000 1,294 5 ,000 36,332 1,820 -2,407 -4,083 ,561
16 1 1 ,202 4 1,000 5,965 2 ,000 41,241 3,080 -1,508 -4,798 ,820
19 1 1 ,379 4 1,000 4,206 5 ,000 45,510 1,885 -4,067 -3,648 1,457
20 1 1 ,587 4 1,000 2,830 5 ,000 34,834 3,053 -2,912 -3,026 -,618
21 2 2 ,915 4 1,000 ,964 1 ,000 42,542 5,030 1,655 ,937 1,130
22 2 2 ,955 4 1,000 ,670 1 ,000 32,365 4,562 ,853 ,786 ,049
23 2 2 ,919 4 1,000 ,937 1 ,000 32,127 5,213 ,600 ,359 -,303
24 2 2 ,800 4 1,000 1,647 1 ,000 24,288 4,375 ,697 -,166 -,089
25 2 2 ,034 4 ,960 10,416 5 ,031 17,264 3,191 -,887 ,719 -1,005
26 2 2 ,204 4 ,998 5,936 5 ,002 18,280 2,895 ,628 1,119 -,042
27 2 2 ,509 4 1,000 3,297 1 ,000 48,058 6,888 1,044 ,256 ,085
28 2 2 ,146 4 ,981 6,820 1 ,019 14,744 4,388 -,712 -,720 ,958
29 2 2 ,705 4 1,000 2,168 1 ,000 41,394 5,123 2,199 -,062 1,310
30 2 2 ,843 4 1,000 1,405 1 ,000 38,385 5,932 1,293 -,228 -,099
31 2 2 ,473 4 1,000 3,532 5 ,000 56,956 5,286 2,744 1,498 1,087
32 2 2 ,820 4 1,000 1,540 1 ,000 35,867 5,779 ,474 ,408 -,310
Information and Knowledge Management www.iiste.org
ISSN 2224-5758 (Paper) ISSN 2224-896X (Online)
Vol.5, No.1, 2015
120
33 2 2 ,832 4 1,000 1,472 1 ,000 48,241 5,804 1,649 ,958 1,163
34 2 2 ,930 4 1,000 ,863 1 ,000 48,530 5,659 1,766 1,075 ,652
35 2 2 ,104 4 1,000 7,684 5 ,000 50,413 5,531 ,194 3,039 ,057
36 2 2 ,466 4 1,000 3,581 5 ,000 55,960 5,692 2,404 1,870 -,340
37 2 2 ,918 4 1,000 ,943 1 ,000 36,474 5,397 ,528 ,919 ,589
38 2 2 ,587 4 1,000 2,830 1 ,000 54,002 5,359 2,970 ,536 -,033
39 2 2 ,991 4 1,000 ,279 1 ,000 36,133 5,090 1,307 ,426 ,800
40 2 2 ,295 4 1,000 4,922 1 ,000 56,668 6,021 1,141 2,029 1,677
41 2 2 ,721 4 1,000 2,079 1 ,000 34,048 5,733 1,112 -,571 -,343
42 2 2 ,720 4 1,000 2,088 1 ,000 52,682 6,469 1,845 ,622 ,097
43 2 2 ,205 4 ,994 5,917 1 ,006 16,113 3,547 -,133 -,286 -,446
44 2 2 ,485 4 1,000 3,451 1 ,000 18,825 3,867 ,498 -,485 ,545
46 2 2 ,710 4 1,000 2,142 1 ,000 42,967 4,945 2,604 -,146 ,224
47 2 2 ,399 4 1,000 4,053 1 ,000 29,420 4,076 1,665 -,572 -,957
48 2 2 ,094 4 1,000 7,946 1 ,000 69,160 5,998 3,852 ,469 1,213
49 2 2 ,446 4 1,000 3,712 5 ,000 50,553 4,683 2,545 1,220 1,557
50 2 2 ,550 4 1,000 3,047 1 ,000 40,433 5,610 1,889 -,539 -,857
51 2 2 ,909 4 1,000 1,003 1 ,000 49,774 5,850 1,626 1,190 ,331
52 3 3 ,272 4 ,999 5,154 4 ,001 18,594 -4,880 2,849 -,478 ,509
53 3 3 ,101 4 ,996 7,748 4 ,004 18,728 -4,828 3,001 -,325 1,498
54 3 3 ,877 4 1,000 1,205 4 ,000 49,584 -6,472 4,158 -2,539 -,036
55 3 3 ,289 4 1,000 4,986 4 ,000 63,235 -6,520 4,816 -2,533 -1,674
56 3 3 ,496 4 1,000 3,385 4 ,000 34,206 -5,829 1,948 -2,995 -,382
57 3 3 ,896 4 1,000 1,091 4 ,000 41,991 -5,166 4,377 -1,878 -,428
58 3 3 ,484 4 1,000 3,460 4 ,000 47,591 -4,744 3,102 -4,010 -,338
59 3 3 ,851 4 1,000 1,362 4 ,000 50,612 -6,501 4,250 -2,495 -,154
60 3 3 ,348 4 1,000 4,457 4 ,000 68,493 -5,481 5,240 -3,761 -,412
61 3 3 ,313 4 1,000 4,755 4 ,000 46,344 -4,654 3,363 -3,927 1,231
74 3 3 ,876 4 1,000 1,215 4 ,000 30,494 -5,550 2,938 -1,747 -,580
75 4 4 ,531 4 1,000 3,165 5 ,000 19,338 -3,010 -1,929 1,090 2,325
76 4 4 ,614 4 1,000 2,674 5 ,000 20,318 -3,827 ,236 ,464 2,030
77 4 5** ,630 4 ,857 2,582 4 ,143 6,167 -2,015 -,271 ,093 -,310
78 4 4 ,483 4 1,000 3,465 5 ,000 26,841 -4,786 -,260 ,638 2,140
79 4 4 ,714 4 ,905 2,121 5 ,095 6,633 -2,560 -,692 1,963 ,176
80 4 4 ,380 4 1,000 4,198 5 ,000 24,009 -5,279 -,835 ,431 ,958
81 4 4 ,654 4 ,996 2,448 5 ,004 13,715 -3,074 -2,124 ,866 1,328
82 4 4 ,684 4 1,000 2,280 5 ,000 24,410 -3,790 -,992 1,993 2,470
83 4 5** ,010 4 ,847 13,252 4 ,153 16,678 -2,217 -2,252 3,619 -1,641
84 4 4 ,897 4 ,999 1,082 5 ,001 15,122 -3,486 ,292 1,333 1,378
85 4 4 ,901 4 ,997 1,056 5 ,003 12,662 -3,287 -1,721 1,397 1,021
86 4 4 ,526 4 ,990 3,194 5 ,010 12,440 -4,087 ,218 1,436 -,249
87 4 4 ,885 4 1,000 1,159 5 ,000 19,861 -3,529 -,997 1,790 2,107
88 4 4 ,207 4 1,000 5,891 5 ,000 24,585 -2,444 -,172 1,895 3,210
89 4 4 ,963 4 ,978 ,602 5 ,022 8,147 -2,864 -,714 1,227 ,709
94 4 4 ,751 4 ,973 1,917 5 ,027 9,066 -3,482 -1,044 ,393 ,245
96 4 5** ,257 4 ,514 5,307 4 ,486 5,419 -2,771 -,155 -,198 -,290
97 4 4 ,173 4 1,000 6,377 5 ,000 25,251 -4,894 ,784 2,695 ,494
99 4 4 ,144 4 1,000 6,858 3 ,000 22,248 -4,379 ,871 ,128 2,534

Information and Knowledge Management www.iiste.org
ISSN 2224-5758 (Paper) ISSN 2224-896X (Online)
Vol.5, No.1, 2015
121
100 4 4 ,887 4 ,999 1,143 5 ,001 15,740 -3,614 -,046 2,209 1,077
101 4 4 ,268 4 ,992 5,194 5 ,008 14,935 -3,063 -2,663 2,337 ,555
103 4 4 ,972 4 ,994 ,513 5 ,006 10,824 -3,501 -1,041 1,510 ,518
106 4 4 ,537 4 ,953 3,127 5 ,047 9,129 -1,944 -1,129 2,155 1,043
107 4 4 ,801 4 1,000 1,641 5 ,000 18,655 -3,476 -1,246 ,767 2,133
108 4 4 ,386 4 1,000 4,151 5 ,000 30,610 -4,565 -1,025 1,119 2,824
109 4 4 ,376 4 1,000 4,231 5 ,000 24,623 -4,609 ,187 2,851 1,032
110 5 5 ,241 4 1,000 5,490 4 ,000 29,177 -,161 -,569 1,951 -3,073
111 5 5 ,425 4 ,957 3,859 4 ,043 10,060 -2,561 -1,467 1,229 -1,790
112 5 5 ,055 4 ,927 9,253 4 ,059 14,776 -3,056 1,085 -,692 -1,498
113 5 5 ,122 4 1,000 7,267 1 ,000 28,222 ,100 -2,580 ,819 -2,879
114 5 5 ,588 4 ,997 2,821 4 ,003 14,295 -2,249 -,716 ,731 -2,366
115 5 5 ,439 4 1,000 3,763 4 ,000 19,195 -1,432 -1,778 1,446 -2,577
116 5 4** ,702 4 ,788 2,184 5 ,212 4,804 -2,410 -,547 ,869 ,293
117 5 5 ,008 4 1,000 13,709 2 ,000 30,167 1,004 1,649 -,417 -3,185
118 5 5 ,755 4 ,999 1,895 1 ,001 16,520 ,240 -,886 ,228 -,781
119 5 5 ,295 4 ,712 4,927 4 ,288 6,740 -2,383 -1,521 -,344 -,223
120 5 5 ,395 4 ,999 4,080 4 ,001 18,652 -,410 ,453 2,203 -1,532
121 5 5 ,547 4 ,998 3,063 4 ,001 16,655 ,090 -,156 ,013 -,145
122 5 4** ,702 4 ,941 2,184 5 ,059 7,717 -2,667 -,567 2,177 ,209
123 5 4** ,167 4 ,580 6,460 5 ,420 7,104 -1,370 -2,083 1,219 ,817
124 5 5 ,031 4 1,000 10,599 4 ,000 30,714 -2,287 ,288 -1,049 -3,576
125 5 1** ,095 4 ,911 7,909 5 ,071 13,000 1,981 -,411 -1,075 -,089
126 5 5 ,891 4 ,992 1,123 4 ,008 10,745 -1,434 ,219 ,927 -1,187
127 5 5 ,627 4 ,918 2,597 4 ,082 7,426 -1,149 ,074 ,987 ,057
129 5 5 ,604 4 ,995 2,733 1 ,005 13,461 -,359 -1,380 -,743 -1,199
130 5 5 ,701 4 ,999 2,188 4 ,001 16,732 -1,137 -1,391 -,647 -1,426
132 5 5 ,544 4 ,998 3,085 1 ,001 16,160 ,366 -1,351 ,538 -,376
133 5 5 ,664 4 1,000 2,391 4 ,000 20,403 -1,066 -1,739 ,190 -2,329
134 5 5 ,970 4 1,000 ,537 4 ,000 16,233 -,677 -1,184 ,885 -1,661
135 5 5 ,346 4 ,997 4,473 4 ,003 15,911 -,575 ,786 2,089 -1,022
136 5 5 ,494 4 ,996 3,392 4 ,004 14,658 -1,050 -2,483 ,808 -1,154
138 5 5 ,350 4 ,970 4,438 1 ,030 11,407 -,495 -1,262 -1,316 -,958
139 5 5 ,621 4 ,933 2,633 4 ,067 7,901 -2,236 ,248 ,447 -,979
140 5 5 ,835 4 ,993 1,455 4 ,007 11,357 -1,251 -1,023 1,729 -1,337
142 5 5 ,585 4 ,997 2,840 1 ,002 15,316 ,190 -,539 -,028 -,258
143 5 5 ,256 4 1,000 5,318 4 ,000 25,488 ,384 ,084 2,257 -1,877
145 5 5 ,862 4 ,983 1,295 4 ,017 9,385 -1,339 -1,567 ,753 -,767
146 5 5 ,867 4 ,961 1,269 4 ,039 7,688 -2,000 -,366 ,712 -1,067
147 5 5 ,462 4 1,000 3,609 2 ,000 22,945 ,813 -,006 ,910 -1,245
148 5 5 ,171 4 1,000 6,407 4 ,000 26,297 -1,559 ,227 1,271 -3,510
Since the highest rate was found in the combination of the sub-groups according to the accuracy rate result of discriminant analysis, a territorial map (Figure 1) was created based on this combination-group to examine the mutual proximity of groups.

Information and Knowledge Management www.iiste.org
ISSN 2224-5758 (Paper) ISSN 2224-896X (Online)
Vol.5, No.1, 2015
122
Figure 1 : Income group Territorial Map (Assuming all functions but the first two are zero)
(Canonical Discriminant, Function 2)
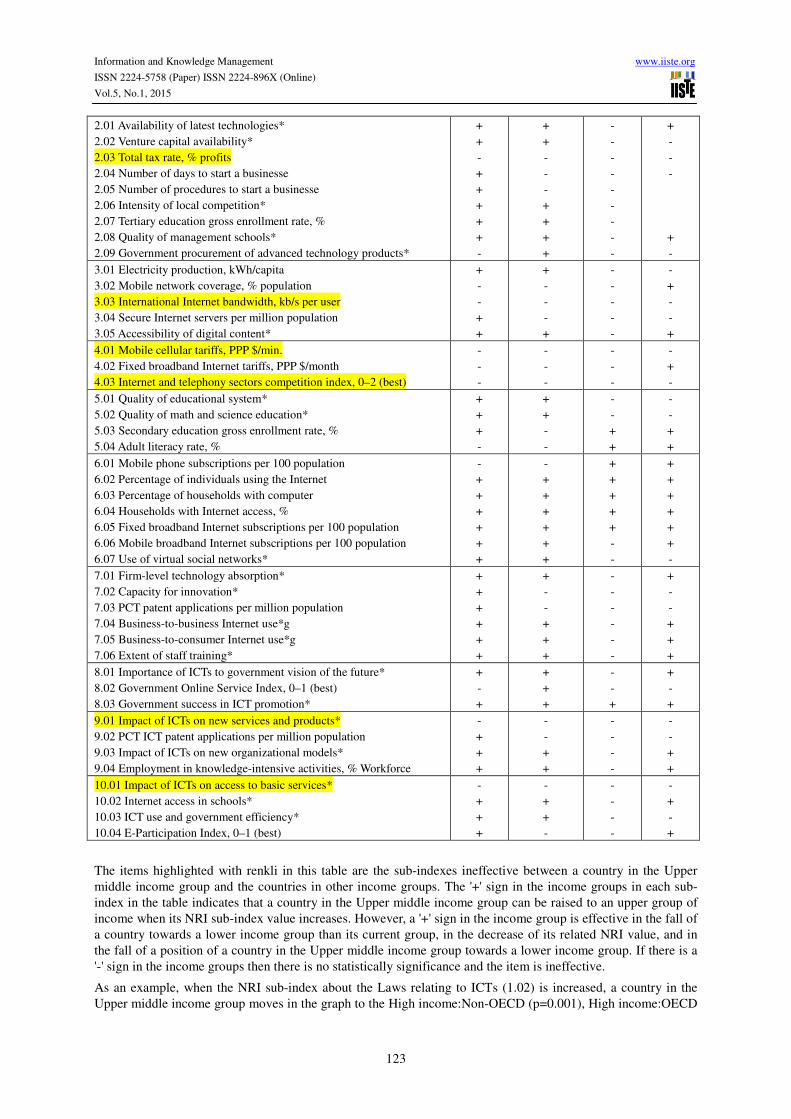
Figure 1 Symbol and Group Label : 1- High income: nonOECD, 2- High income: OECD, 3- Low income, 4- Lower middle income, 5- Upper middle income, *- Indicates a group centroid
According to the territorial map, the Upper middle income group is located at the center of the graph and has borders with all the groups. It is also seen in the graph that the Upper middle income group is located on the same ring with the overall mean. In the light of these graphical information, ANOVA and post hoc Tukey’s test was used in order to determine the direction --be it either towards the upper or lower income group-- of an average country, i.e. a country in the Upper middle income group, in the territorial map when its NRI value is changed. Test results are given in Table 5. According to these test results:
Table 5. Territorial map results
Territorial map finding results
NRI index
High
Income
OECD
High
Income
nonOECD
Lower
Middle
Income
Low
Income
1.01 Effectiveness of law-making bodies*
1.02 Laws relating to ICTs*
1.03 Judicial independence*
1.04 Efficiency of legal system in settling disputes*
1.05 Efficiency of legal system in challenging regulations*
1.06 Intellectual property protection*
1.07 Software piracy rate, % software installed
1.08 Number of procedures to enforce a contractd
1.09 Number of days to enforce a contract
+
+
+
+
+
+
+
+
-
+
+
+
+
+
+
-
-
-
-
-
-
-
-
-
-
-
-
-
+
-
-
-
-
+
-
-
Information and Knowledge Management www.iiste.org
ISSN 2224-5758 (Paper) ISSN 2224-896X (Online)
Vol.5, No.1, 2015
123
2.01 Availability of latest technologies*
2.02 Venture capital availability*
2.03 Total tax rate, % profits
2.04 Number of days to start a businesse
2.05 Number of procedures to start a businesse
2.06 Intensity of local competition*
2.07 Tertiary education gross enrollment rate, %
2.08 Quality of management schools*
2.09 Government procurement of advanced technology products*
+
+
-
+
+
+
+
+
-
+
+
-
-
-
+
+
+
+
-
-
-
-
-
-
-
-
-
+
-
-
-
+
-
3.01 Electricity production, kWh/capita
3.02 Mobile network coverage, % population
3.03 International Internet bandwidth, kb/s per user
3.04 Secure Internet servers per million population
3.05 Accessibility of digital content*
+
-
-
+
+
+
-
-
-
+
-
-
-
-
-
-
+
-
-
+
4.01 Mobile cellular tariffs, PPP $/min.
4.02 Fixed broadband Internet tariffs, PPP $/month
4.03 Internet and telephony sectors competition index, 0–2 (best)
-
-
-
-
-
-
-
-
-
-
+
-
5.01 Quality of educational system*
5.02 Quality of math and science education*
5.03 Secondary education gross enrollment rate, %
5.04 Adult literacy rate, %
+
+
+
-
+
+
-
-
-
-
+
+
-
-
+
+
6.01 Mobile phone subscriptions per 100 population
6.02 Percentage of individuals using the Internet
6.03 Percentage of households with computer
6.04 Households with Internet access, %
6.05 Fixed broadband Internet subscriptions per 100 population
6.06 Mobile broadband Internet subscriptions per 100 population
6.07 Use of virtual social networks*
-
+
+
+
+
+
+
-
+
+
+
+
+
+
+
+
+
+
+
-
-
+
+
+
+
+
+
-
7.01 Firm-level technology absorption*
7.02 Capacity for innovation*
7.03 PCT patent applications per million population
7.04 Business-to-business Internet use*g
7.05 Business-to-consumer Internet use*g
7.06 Extent of staff training*
+
+
+
+
+
+
+
-
-
+
+
+
-
-
-
-
-
-
+
-
-
+
+
+
8.01 Importance of ICTs to government vision of the future*
8.02 Government Online Service Index, 0–1 (best)
8.03 Government success in ICT promotion*
+
-
+
+
+
+
-
-
+
+
-
+
9.01 Impact of ICTs on new services and products*
9.02 PCT ICT patent applications per million population
9.03 Impact of ICTs on new organizational models*
9.04 Employment in knowledge-intensive activities, % Workforce
-
+
+
+
-
-
+
+
-
-
-
-
-
-
+
+
10.01 Impact of ICTs on access to basic services*
10.02 Internet access in schools*
10.03 ICT use and government efficiency*
10.04 E-Participation Index, 0–1 (best)
-
+
+
+
-
+
+
-
-
-
-
-
-
+
-
+
The items highlighted with renkli in this table are the sub-indexes ineffective between a country in the Upper middle income group and the countries in other income groups. The '+' sign in the income groups in each sub-index in the table indicates that a country in the Upper middle income group can be raised to an upper group of income when its NRI sub-index value increases. However, a '+' sign in the income group is effective in the fall of a country towards a lower income group than its current group, in the decrease of its related NRI value, and in the fall of a position of a country in the Upper middle income group towards a lower income group. If there is a '-' sign in the income groups then there is no statistically significance and the item is ineffective.
As an example, when the NRI sub-index about the Laws relating to ICTs (1.02) is increased, a country in the Upper middle income group moves in the graph to the High income:Non-OECD (p=0.001), High income:OECD
Information and Knowledge Management www.iiste.org
ISSN 2224-5758 (Paper) ISSN 2224-896X (Online)
Vol.5, No.1, 2015
124
(p<0.0001) (p<0.001). However, a decrease in the score of the sub-index 1.02 has no effect in the fall of a country in the Upper middle income group to the low income group. Or, there is no statistically significant difference between the Upper middle income group and other groups in terms of the NRI sub-index on the total tax rate, % profits (2.03), and hence this sub-index is ineffective.
The accuracy rates in the Table 6, Table 7, Table 8, Table 9 and Table 10 were compared by examining each criterion together with their sub-factors. The accuracy rates graphics in the Graph 1, Graph 2, Graph 3, Graph 4 and Graph 5 were compared by examining each criterion together with their sub-factors.
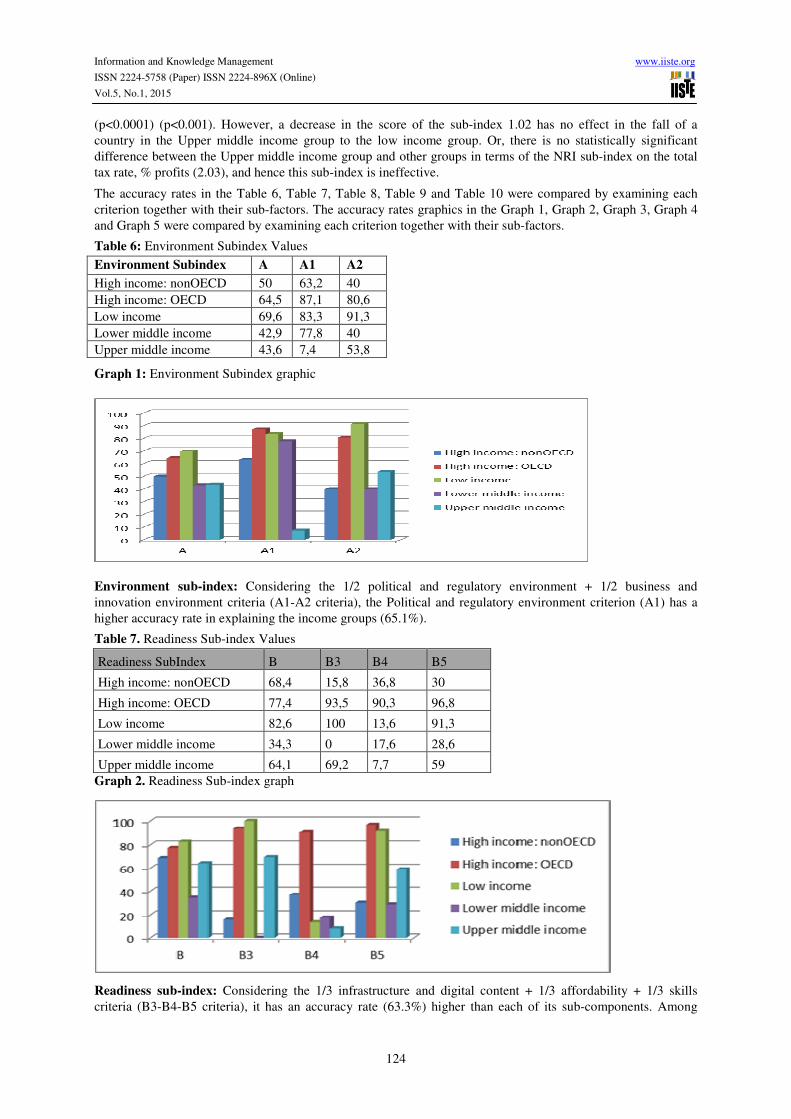
Table 6: Environment Subindex Values
Environment Subindex A A1 A2
High income: nonOECD 50 63,2 40 High income: OECD 64,5 87,1 80,6 Low income 69,6 83,3 91,3 Lower middle income 42,9 77,8 40 Upper middle income 43,6 7,4 53,8
Graph 1: Environment Subindex graphic
Environment sub-index: Considering the 1/2 political and regulatory environment + 1/2 business and innovation environment criteria (A1-A2 criteria), the Political and regulatory environment criterion (A1) has a higher accuracy rate in explaining the income groups (65.1%).
Table 7. Readiness Sub-index Values
Readiness SubIndex B B3 B4 B5
High income: nonOECD 68,4 15,8 36,8 30
High income: OECD 77,4 93,5 90,3 96,8
Low income 82,6 100 13,6 91,3
Lower middle income 34,3 0 17,6 28,6
Upper middle income 64,1 69,2 7,7 59 Graph 2. Readiness Sub-index graph
Readiness sub-index: Considering the 1/3 infrastructure and digital content + 1/3 affordability + 1/3 skills criteria (B3-B4-B5 criteria), it has an accuracy rate (63.3%) higher than each of its sub-components. Among

Information and Knowledge Management www.iiste.org
ISSN 2224-5758 (Paper) ISSN 2224-896X (Online)
Vol.5, No.1, 2015
125
these groups, it explained the most of the variance in the Low income group (82.6%) and the least of the variance in the Lower middle income group (34.3%).
Table 8. Usage Sub-index Values
Usage SubIndex C C6 C7 C8 High income: nonOECD 80 55 0 38,9 High income: OECD 71 71 67,7 64,5 Low income 91,3 100 95,7 69,6 Lower middle income 42,9 64,7 20 14,3 Upper middle income 48,7 56,4 41 41
Graph 3. Usage Sub-index graph
Usage sub-index: Given the 1/3 individual usage + 1/3 business usage + 1/3 governmental usage criteria (C6-C7-C8 criteria), the individual-usage criterion has a higher accuracy rate in explaining the income groups (68.0%).
Table 9. Impact Sub-index Values
Impact SubIndex D D9 D10
High income: nonOECD 50 72,2 66,7 High income: OECD 64,5 64,5 58,1 Low income 73,9 93,8 77,3 Lower middle income 22,9 43,3 34,3
Upper middle income 46,2 44,4 51,3 Graph 4. Impact Sub-index graph
Impacts sub-index: Considering the 1/2 economic impacts + 1/2 social impacts criteria (D9-D10 criteria), the economic-impacts criterion has a higher accuracy rate in explaining the income groups (58.8%).
Information and Knowledge Management www.iiste.org
ISSN 2224-5758 (Paper) ISSN 2224-896X (Online)
Vol.5, No.1, 2015
126
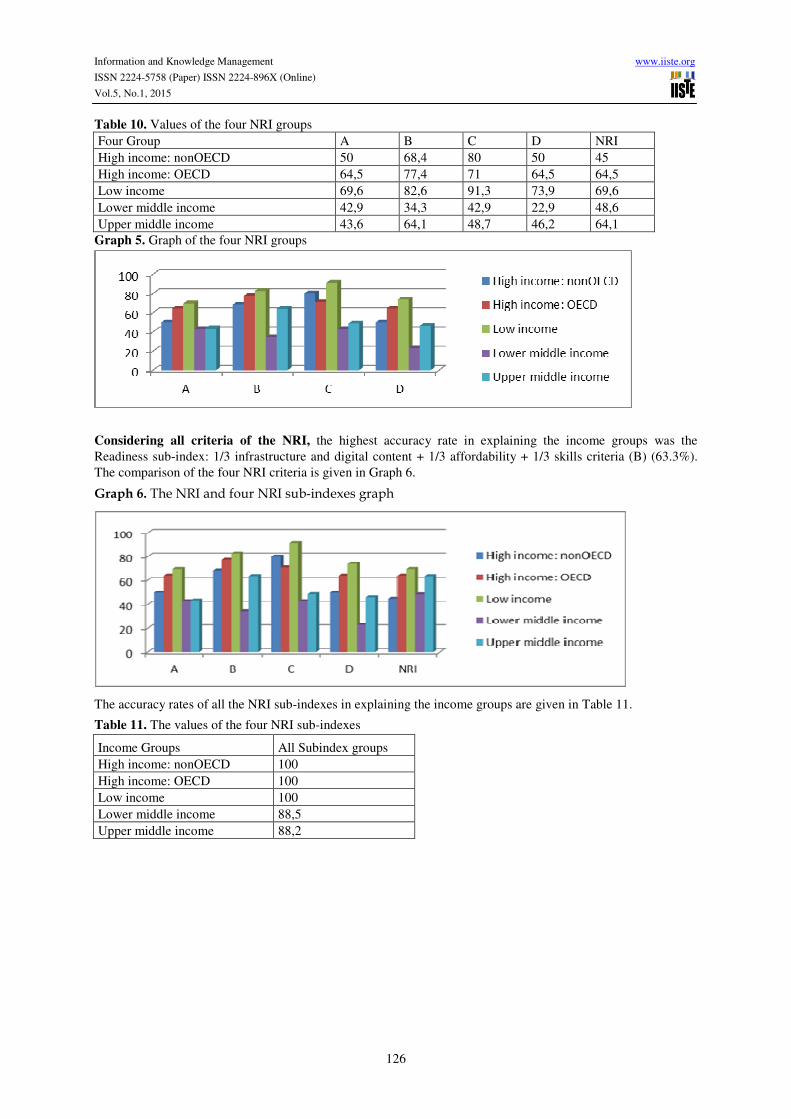
Table 10. Values of the four NRI groups Four Group A B C D NRI High income: nonOECD 50 68,4 80 50 45 High income: OECD 64,5 77,4 71 64,5 64,5 Low income 69,6 82,6 91,3 73,9 69,6 Lower middle income 42,9 34,3 42,9 22,9 48,6 Upper middle income 43,6 64,1 48,7 46,2 64,1
Graph 5. Graph of the four NRI groups
Considering all criteria of the NRI, the highest accuracy rate in explaining the income groups was the Readiness sub-index: 1/3 infrastructure and digital content + 1/3 affordability + 1/3 skills criteria (B) (63.3%). The comparison of the four NRI criteria is given in Graph 6.
Graph 6. The NRI and four NRI sub-indexes graph
The accuracy rates of all the NRI sub-indexes in explaining the income groups are given in Table 11.
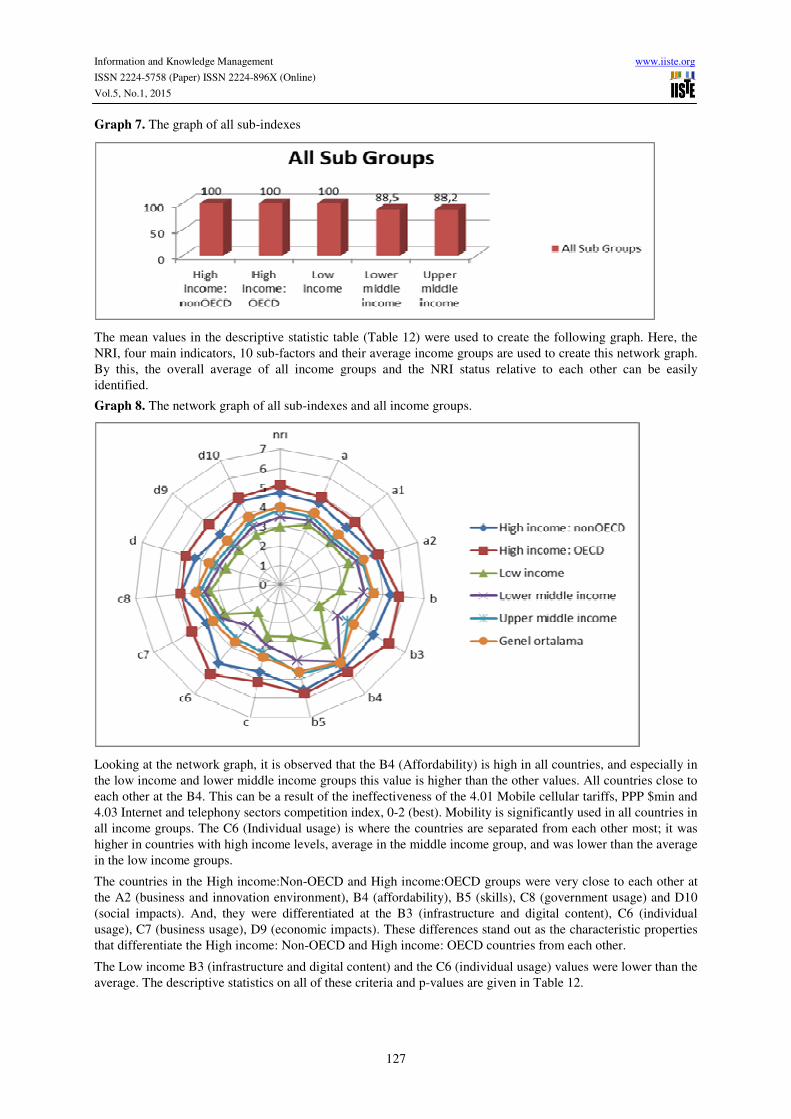
Table 11. The values of the four NRI sub-indexes
Income Groups All Subindex groups High income: nonOECD 100 High income: OECD 100 Low income 100 Lower middle income 88,5 Upper middle income 88,2
Information and Knowledge Management www.iiste.org
ISSN 2224-5758 (Paper) ISSN 2224-896X (Online)
Vol.5, No.1, 2015
127
Graph 7. The graph of all sub-indexes
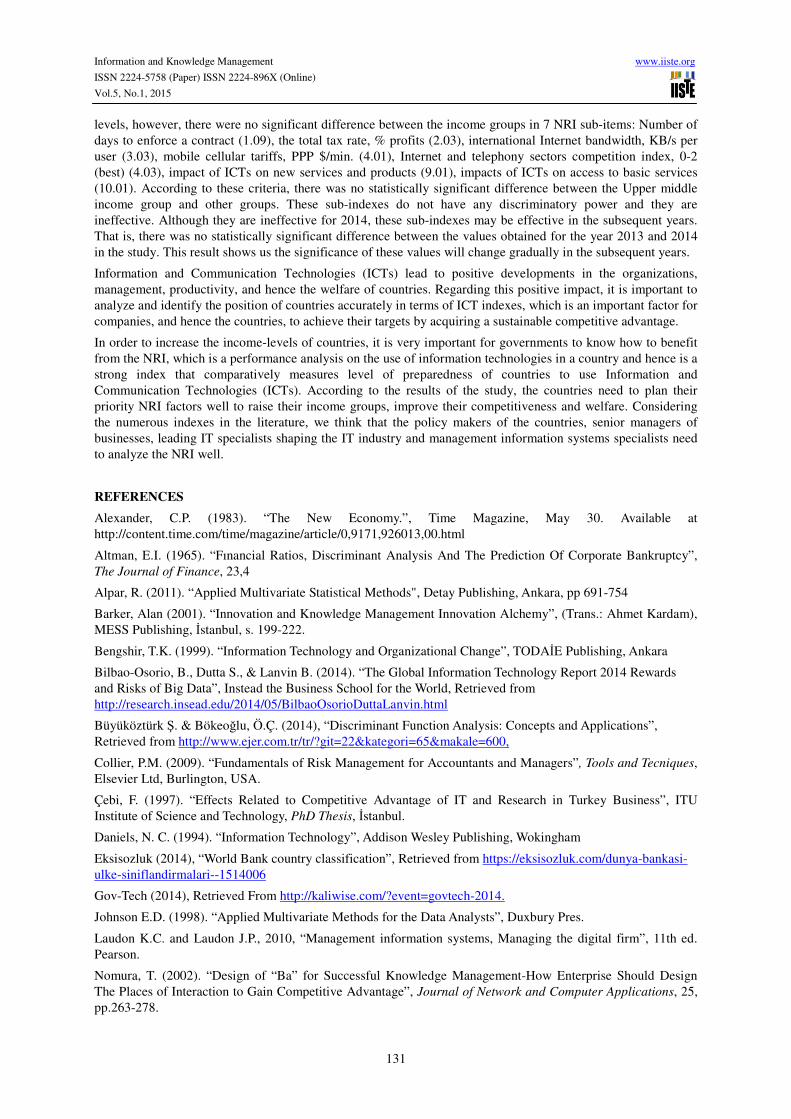
The mean values in the descriptive statistic table (Table 12) were used to create the following graph. Here, the NRI, four main indicators, 10 sub-factors and their average income groups are used to create this network graph. By this, the overall average of all income groups and the NRI status relative to each other can be easily identified.
Graph 8. The network graph of all sub-indexes and all income groups.
Looking at the network graph, it is observed that the B4 (Affordability) is high in all countries, and especially in the low income and lower middle income groups this value is higher than the other values. All countries close to each other at the B4. This can be a result of the ineffectiveness of the 4.01 Mobile cellular tariffs, PPP $min and 4.03 Internet and telephony sectors competition index, 0-2 (best). Mobility is significantly used in all countries in all income groups. The C6 (Individual usage) is where the countries are separated from each other most; it was higher in countries with high income levels, average in the middle income group, and was lower than the average in the low income groups.
The countries in the High income:Non-OECD and High income:OECD groups were very close to each other at the A2 (business and innovation environment), B4 (affordability), B5 (skills), C8 (government usage) and D10 (social impacts). And, they were differentiated at the B3 (infrastructure and digital content), C6 (individual usage), C7 (business usage), D9 (economic impacts). These differences stand out as the characteristic properties that differentiate the High income: Non-OECD and High income: OECD countries from each other.
The Low income B3 (infrastructure and digital content) and the C6 (individual usage) values were lower than the average. The descriptive statistics on all of these criteria and p-values are given in Table 12.

Information and Knowledge Management www.iiste.org
ISSN 2224-5758 (Paper) ISSN 2224-896X (Online)
Vol.5, No.1, 2015
128
Table 12. Descriptive statistics of (mean ± SD) NRI and NRI sub-indexes according to the income groups and p-values of the groups
High income:
nonOECD High income:
OECD Low
income Lower middle
income Upper
middle income pƗ
Nrı_2014 4,73±0,55 5,15±0,56 2,95±0,43 3,48±0,43 3,82±0,51 <0,0001 Ɨ
Nrı_2013 4,67±0,56 5,12±0,58 2,98±0,38 3,29±0,72 3,66±0,75 <0,0001 Ɨ
Nrı2014-
Nrı2013
0,07±0,12
(0,024)* 0,04±0,08 (0,019)*
0,01±0,16
(0,894)*
0,19±0,63
(0,082)*
0,17±0,40
(0,016)* 0,233 Ɨ
A 4,60±0,57 4,92±0,55 3,38±0,50 3,61±0,33 3,82±0,53 <0,0001 Ɨ
a1 4,35±0,66 4,84±0,77 3,27±0,64 3,36±0,43 3,53±0,62 <0,0001 Ɨ
a2 4,85±0,51 5,01±0,39 3,50±0,47 3,88±0,36 4,10±0,56 <0,0001 Ɨ
B 5,38±0,53 5,80±0,44 2,97±0,69 4,07±0,84 4,52±0,71 <0,0001 Ɨ
b3 5,24±0,72 6,07±0,69 2,21±0,62 3,23±0,79 3,79±0,77 <0,0001 Ɨ
b4 5,34±1,16 5,56±0,69 3,80±1,71 4,93±1,42 5,04±1,17 <0,0001 Ɨ
b5 5,58±0,51 5,75±0,37 2,79±0,63 4,02±0,99 4,74±0,73 <0,0001 Ɨ
C 4,63±0,58 5,15±0,65 2,75±0,38 3,20±0,38 3,62±0,50 <0,0001 Ɨ
c6 5,03±0,62 5,73±0,61 1,77±0,33 2,63±0,62 3,51±0,75 <0,0001 Ɨ
c7 4,06±0,63 4,89±0,84 3,06±0,35 3,37±0,32 3,46±0,43 <0,0001 Ɨ
c8 4,81±0,82 4,81±0,70 3,42±0,63 3,64±0,54 3,90±0,67 <0,0001 Ɨ
D 4,29±0,74 4,77±0,75 2,72±0,43 3,09±0,42 3,33±0,53 <0,0001 Ɨ
d9 3,87±0,74 4,63±0,81 2,64±0,40 2,93±0,35 3,09±0,39 <0,0001 Ɨ
d10 4,72±0,83 4,90±0,79 2,79±0,50 3,25±0,52 3,56±0,71 <0,0001 Ɨ
1.01 4,11±0,90 4,25±0,95 3,31±0,79 3,37±0,71 3,32±0,85 <0,0001 Ɨ
1.02 4,55±0,86 4,93±0,60 3,05±0,67 3,48±0,53 3,77±0,81 <0,0001 Ɨ
1.03 4,80±0,94 5,21±1,17 2,90±0,80 3,24±0,78 3,44±0,94 <0,0001 Ɨ
1.04 4,33±0,96 4,41±1,13 3,36±0,69 3,45±0,59 3,55±0,73 <0,0001 Ɨ
1.05 4,02±0,84 4,17±1,03 3,13±0,58 3,22±0,42 3,28±0,76 <0,0001 Ɨ
1.06 4,64±0,93 4,97±0,83 3,03±0,66 3,18±0,56 3,34±0,81 <0,0001 Ɨ
1.07 48,26±15,42 33,84±12,23 21,67±39,33 66,11±32,22 60,62±24,53 <0,0001 Ɨ
1.08 39,85±8,11 31,35±4,39 38,87±5,41 39,00±5,41 37,41±4,78 <0,0001 Ɨ
1.09 598,20±293,56 528,65±277,43 666,61±317,88 663,29±331,15 636,51±281,87 0,363 Ɨ
2.01 5,55±0,62 5,96±0,53 4,00±0,67 4,37±0,56 4,71±0,65 <0,000 Ɨ 1
2.02 3,24±0,79 3,08±0,77 2,23±0,46 2,57±0,47 2,58±0,61 <0,0001 Ɨ
2.03 28,26±13,15 41,26±12,13 53,38±52,54 38,89±15,64 42,31±18,62 0,029 Ɨ
2.04 18,20±22,33 11,35±7,64 31,52±31,18 25,74±21,23 31,10±41,52 0,027 Ɨ
2.05 6,75±3,14 5,10±2,26 7,39±3,47 7,60±3,20 7,59±3,68 0,010 Ɨ
2.06 5,31±0,54 5,46±0,41 4,43±0,52 4,70±0,48 4,62±0,74 <0,000 Ɨ 1
2.07 49,90±23,95 70,97±15,83 7,51±5,12 22,15±16,58 38,62±18,77 <0,0001 Ɨ
2.08 4,68±0,61 5,04±0,69 3,50±0,59 3,73±0,75 4,09±0,72 <0,0001 Ɨ
2.09 3,86±0,87 3,69±0,52 3,25±0,59 3,34±0,52 3,35±0,64 0,002 Ɨ
3.01 7488,94±4434,97 10323,22±9756,66 137,18±181,92 1496,48±2149,00 2710,10±1556,20 <0,0001 Ɨ
3.02 92,81±22,94 99,30±0,87 65,02±34,53 91,22±11,18 94,83±11,07 <0,0001 Ɨ
3.03 159,42±333,84 244,05±718,23 4,42±5,18 15,33±22,50 25,05±24,97 0,031 Ɨ
3.04 316,83±385,22 1169,90±866,52 1,37±1,20 40,85±189,31 45,15±52,54 <0,0001 Ɨ
3.05 5,79±0,39 5,98±0,46 3,69±0,70 4,56±0,58 4,74±0,73 <0,0001 Ɨ
4.01 0,23±0,15 0,29±0,18 0,24±0,20 0,27±0,19 0,32±0,18 0,386 Ɨ
4.02 32,74±17,61 30,50±8,34 210,23±460,93 50,72±46,66 35,76±20,78 0,002 Ɨ
4.03 1,45±0,54 1,93±0,12 1,38±0,61 1,56±0,55 1,61±0,48 0,001 Ɨ
5.01 4,37±0,85 4,47±0,82 3,22±0,61 3,43±0,71 3,41±0,76 <0,000 1 Ɨ
5.02 4,78±0,85 4,71±0,65 3,34±0,53 3,59±0,79 3,76±0,96 <0,0001 Ɨ
5.03 83,09±33,00 105,97±11,11 38,77±14,35 69,91±21,36 85,64±15,84 <0,0001 Ɨ
5.04 90,56±21,73 98,85±0,79 58,98±18,12 80,13±15,38 91,00±9,54 <0,0001 Ɨ

Information and Knowledge Management www.iiste.org
ISSN 2224-5758 (Paper) ISSN 2224-896X (Online)
Vol.5, No.1, 2015
129
6.01 142,85±33,89 121,91±21,05 55,87±27,92 96,51±26,83 115,99±32,08 <0,0001 Ɨ
6.02 68,31±11,55 80,41±11,04 6,69±7,18 23,91±14,34 41,85±16,48 <0,0001 Ɨ
6.03 73,46±10,74 81,23±10,34 4,33±2,64 19,39±13,16 38,20±18,53 <0,0001 Ɨ
6.04 66,15±13,35 79,65±12,51 3,50±2,34 15,24±11,89 33,57±17,92 <0,0001 Ɨ
6.05 16,48±8,85 28,24±7,58 0,10±0,16 2,59±3,14 7,70±5,23 <0,0001 Ɨ
6.06 47,61±29,39 64,93±24,97 4,00±7,46 9,06±9,84 19,37±16,39 <0,0001 Ɨ
6.07 6,05±0,33 6,10±0,36 4,53±0,56 5,22±0,51 5,52±0,56 <0,0001 Ɨ
7.01 5,24±0,59 5,51±0,58 4,03±0,51 4,37±0,47 4,57±0,58 <0,0001 Ɨ
7.02 3,75±0,62 4,64±0,79 3,03±0,43 3,31±0,46 3,37±0,51 <0,0001 Ɨ
7.03 10,95±27,63 118,81±93,94 0,01±0,05 1,14±4,35 2,40±4,59 <0,0001 Ɨ
7.04 5,33±0,51 5,60±0,48 4,12±0,52 4,50±0,50 4,63±0,64 <0,0001 Ɨ
7.05 4,91±0,54 5,48±0,51 3,45±0,52 4,04±0,60 4,29±0,75 <0,0001 Ɨ
7.06 4,36±0,52 4,57±0,64 3,42±0,52 3,77±0,48 3,86±0,52 <0,0001 Ɨ
8.01 4,57±0,95 4,29±0,70 3,71±0,69 3,66±0,73 3,77±0,77 <0,0001 Ɨ
8.02 0,63±0,22 0,76±0,15 0,25±0,12 0,37±0,14 0,47±0,17 <0,0001 Ɨ
8.03 4,85±0,86 4,46±1,00 4,09±0,71 4,02±0,64 4,11±0,68 0,001 Ɨ
9.01 4,71±0,63 5,04±0,58 3,79±0,57 5,08±6,27 4,16±0,60 0,431 Ɨ
9.02 3,69±11,86 34,07±33,07 0,00±0,00 0,09±0,19 0,62±1,42 <0,0001 Ɨ
9.03 4,56±0,62 4,79±0,58 3,53±0,55 3,82±0,54 3,96±0,62 <0,0001 Ɨ
9.04 31,93±8,61 39,96±8,02 3,56±4,45 14,55±10,02 19,65±9,33 <0,0001 Ɨ
10.01 5,00±0,75 5,11±0,66 3,50±0,59 12,41±50,91 4,88±5,81 0,625 Ɨ
10.02 5,37±0,64 5,60±0,76 2,73±0,79 3,49±0,80 3,91±0,92 <0,0001 Ɨ
10.03 4,78±0,85 4,68±0,66 3,60±0,69 3,79±0,63 3,94±0,76 <0,0001 Ɨ
10.04 0,39±0,28 0,52±0,28 0,05±0,08 0,16±0,17 0,24±0,22 <0,0001 Ɨ
All - - - - - <0,0001#
* :Paired t testi p değeri, # :MANOVA p değeri, Ɨ :ANOVA p değeri
The all pairwise comparisons between the groups were statistically significant, according to NRI 2013 and NRI 2014 indexes (p<0.05).
For the differences between NRI 2014 and NRI 2013, paired t-test for dependent groups was used in the analysis. The difference between NRI 2014 and NRI 2013 was statistically significant in terms of the High income: Non-OECD group. The difference between NRI 2014 and NRI 2013 was also statistically significant in terms of the High income:OECD group. And also, the difference between NRI 2014 and NRI 2013 was also statistically significant in terms of the Upper middle income group. There was no statistically significant difference between the groups in terms of the new variables obtained by subtracting the NRI 2013 values from the NRI 2014 values of all countries (p = 0.233). However, the indexes were not changed in the low income (0.01±0.16) (0.894)* and lower middle income (0.19±0.63) (0.082)* groups in terms of the differences between NRI 2014 and NRI 2013 values, therefore the difference between 2014 and 2013 was not significant.
And, the differences between groups in terms of the environment sub-index (political and regulatory environment, business and innovation environment), the readiness sub-index (infrastructure and digital content, affordability, skills), the usage sub-index (individual usage, business usage, governmental usage), the impacts sub-index (economic impacts, social impacts) criteria were significant at least the p<0.05 level. In addition, there were no significant difference between the income groups in 7 NRI sub-items: Number of days to enforce a contract (1.09), the total tax rate, % profits (2.03), international Internet bandwidth, KB/s per user (3.03), mobile cellular tariffs, PPP $/min. (4.01), Internet and telephony sectors competition index, 0-2 (best) (4.03), impact of ICTs on new services and products (9.01), impacts of ICTs on access to basic services (10.01). According to these criteria, there was no statistically significant difference between the Upper middle income group and other groups.
And, after incorporating all the variables into the model, there was a statistically significant difference between the groups according to MANOVA (multivariate analysis of variance) analysis results (p<0.001).
6. Conclusion And Discussion
Progress in the technology and informatics continue to increase at a dazzling speed each passing day and affect

Information and Knowledge Management www.iiste.org
ISSN 2224-5758 (Paper) ISSN 2224-896X (Online)
Vol.5, No.1, 2015
130
us in every area of life. The internet and information technologies have made our world smaller, globalized and removed the boundaries between countries in competition. Not money or natural sources but the information technology has become the most important competitive factor in businesses, as the world globalizes rapidly. Information technologies are formal information systems that utilize various sources to collect, process, store and report the information necessary for managers to make decisions (Tekin et al., 2000: 83). According to Nomura (2002:263-278), the information systems owned by businesses have become one of the traditional business resources such as land and capital, and these systems are now the backbone of modern business enterprises (Collier, 2009: 148).
NRI is a performance analysis on the use of information technologies in a country and hence is a strong index that comparatively measures level of readiness of countries to use Information and Communication Technologies (ICTs). The first data set, which was obtained from the findings from the Executive Opinion Survey prepared for the Global Competitiveness Report, shows the importance of the NRI in the competition between countries in terms of the ICTs. Although it has no direct economic items, it has very good sub-items in explaining the income groups of countries. Considering all subgroup values of the NRI, the accuracy rate in explaining the income groups was found to be 94.0%. The NRI is able to differentiate the High income:Non-OECD - High income:OECD- Low income (%100), Lower middle income (%88.5) and the Upper middle income (%88.2) groups correctly. And, when all the components were incorporated into the model, it was found that it is significantly correlated with the High income:Non-OECD - High income:OECD - Low income group countries (100%), and able to fully explain the income groups of these countries. The accuracy rate was found to be 94.0% in explaining the income groups of the countries when all sub-index values of the NRI were taken into account with the help of the discriminant functions which can be formed in accordance with the findings of the study.
The comparison of the NRI 2013 and the NRI 2014 values provided very good clues. Here, it was observed that the change in the NRI was not very fast. The fastest lower middle income group is the group with the highest standard deviation and variation between countries. The NRI variation is lowest in the High income:OECD group countries. Low income group decreased by 0.03 in 2014 compared to 2013. The resulting decline was not statistically significant.
Territorial map also provided important findings. According to the map, the Upper middle income group is located in the center of the graph and has borders with all groups. In the territorial map, the direction of an average country, i.e. a country in the Upper middle income group, was found depending on the change in the NRI; that is to say, it is possible to know whether a country in the Upper middle income group moves towards the upper income group or towards the lower income group by looking its NRI value change. In addition, it is easy to identify the impossible income groups for a country by looking at the NRI values in the map. For example, a country in the lower middle income cannot move to the high income:OECD group. Likewise, a country in the High income:Non-OECD group cannot fall to the low income group.
The overall average of all income groups and the NRI status relative to each other can be easily identified in the network graph created by using the NRI, 4 main indicators, 10 sub-factors and their average income groups or in the created by using the mean values in the descriptive statistics table (Table 11). Here, it is possible to see clearly the extent of effectiveness of the NRI sub-indexes in the income groups and the NRI sub-indexes common or different between the countries.
Looking at the network graph, it is observed that the B4 (Affordability) is high in all countries, and especially in the low income and lower middle income groups this value is higher than the other values. All countries close to each other at the B4. This can be a result of the ineffectiveness of the 4.01 Mobile cellular tariffs, PPP $min and 4.03 Internet and telephony sectors competition index, 0-2 (best). Mobility is significantly used in all countries in all income groups. The C6 (Individual usage) is where the countries are separated from each other most; it was higher in countries with high income levels, average in the middle income group, and was lower than the average in the low income groups.
The countries in the High income:Non-OECD and High income:OECD groups were very close to each other at the A2 (business and innovation environment), B4 (affordability), B5 (skills), C8 (government usage) and D10 (social impacts). And, they were differentiated at the B3 (infrastructure and digital content), C6 (individual usage), C7 (business usage), D9 (economic impacts). These differences stand out as the characteristic properties that differentiate the High income:Non-OECD and High income:OECD countries from each other.
The Low income B3 (infrastructure and digital content) and the C6 (individual usage) values were lower than the average.
Although the NRI has a very successful distinctive power to differentiate countries depending on their income
Information and Knowledge Management www.iiste.org
ISSN 2224-5758 (Paper) ISSN 2224-896X (Online)
Vol.5, No.1, 2015
131
levels, however, there were no significant difference between the income groups in 7 NRI sub-items: Number of days to enforce a contract (1.09), the total tax rate, % profits (2.03), international Internet bandwidth, KB/s per user (3.03), mobile cellular tariffs, PPP $/min. (4.01), Internet and telephony sectors competition index, 0-2 (best) (4.03), impact of ICTs on new services and products (9.01), impacts of ICTs on access to basic services (10.01). According to these criteria, there was no statistically significant difference between the Upper middle income group and other groups. These sub-indexes do not have any discriminatory power and they are ineffective. Although they are ineffective for 2014, these sub-indexes may be effective in the subsequent years. That is, there was no statistically significant difference between the values obtained for the year 2013 and 2014 in the study. This result shows us the significance of these values will change gradually in the subsequent years.
Information and Communication Technologies (ICTs) lead to positive developments in the organizations, management, productivity, and hence the welfare of countries. Regarding this positive impact, it is important to analyze and identify the position of countries accurately in terms of ICT indexes, which is an important factor for companies, and hence the countries, to achieve their targets by acquiring a sustainable competitive advantage.
In order to increase the income-levels of countries, it is very important for governments to know how to benefit from the NRI, which is a performance analysis on the use of information technologies in a country and hence is a strong index that comparatively measures level of preparedness of countries to use Information and Communication Technologies (ICTs). According to the results of the study, the countries need to plan their priority NRI factors well to raise their income groups, improve their competitiveness and welfare. Considering the numerous indexes in the literature, we think that the policy makers of the countries, senior managers of businesses, leading IT specialists shaping the IT industry and management information systems specialists need to analyze the NRI well.
REFERENCES
Alexander, C.P. (1983). “The New Economy.”, Time Magazine, May 30. Available at http://content.time.com/time/magazine/article/0,9171,926013,00.html
Altman, E.I. (1965). “Fınancial Ratios, Discriminant Analysis And The Prediction Of Corporate Bankruptcy”, The Journal of Finance, 23,4
Alpar, R. (2011). “Applied Multivariate Statistical Methods", Detay Publishing, Ankara, pp 691-754
Barker, Alan (2001). “Innovation and Knowledge Management Innovation Alchemy”, (Trans.: Ahmet Kardam), MESS Publishing, İstanbul, s. 199-222.
Bengshir, T.K. (1999). “Information Technology and Organizational Change”, TODAİE Publishing, Ankara
Bilbao-Osorio, B., Dutta S., & Lanvin B. (2014). “The Global Information Technology Report 2014 Rewards and Risks of Big Data”, Instead the Business School for the World, Retrieved from http://research.insead.edu/2014/05/BilbaoOsorioDuttaLanvin.html
Büyüköztürk Ş. & Bökeoğlu, Ö.Ç. (2014), “Discriminant Function Analysis: Concepts and Applications”, Retrieved from http://www.ejer.com.tr/tr/?git=22&kategori=65&makale=600,
Collier, P.M. (2009). “Fundamentals of Risk Management for Accountants and Managers”, Tools and Tecniques, Elsevier Ltd, Burlington, USA.
Çebi, F. (1997). “Effects Related to Competitive Advantage of IT and Research in Turkey Business”, ITU Institute of Science and Technology, PhD Thesis, İstanbul.
Daniels, N. C. (1994). “Information Technology”, Addison Wesley Publishing, Wokingham
Eksisozluk (2014), “World Bank country classification”, Retrieved from https://eksisozluk.com/dunya-bankasi-ulke-siniflandirmalari--1514006
Gov-Tech (2014), Retrieved From http://kaliwise.com/?event=govtech-2014.
Johnson E.D. (1998). “Applied Multivariate Methods for the Data Analysts”, Duxbury Pres.
Laudon K.C. and Laudon J.P., 2010, “Management information systems, Managing the digital firm”, 11th ed. Pearson.
Nomura, T. (2002). “Design of “Ba” for Successful Knowledge Management-How Enterprise Should Design The Places of Interaction to Gain Competitive Advantage”, Journal of Network and Computer Applications, 25, pp.263-278.

Information and Knowledge Management www.iiste.org
ISSN 2224-5758 (Paper) ISSN 2224-896X (Online)
Vol.5, No.1, 2015
132
Özdamar,K.. (1999). “Data Analysis and Statistical Software Packages (Multivariate Analysis)”, Eskisehir: Kaan Bookstore
Porter, M.E., Millar & Victor E. (1985). “How Information Gives You Competitive Advantage”, Harvard
Business Review, July-August 1985, pp.2-13.
Robert Crown Law Library Blog (2014), “2013 Global Information Report (GITR) and Networked Readiness Index (NRI)”, Stanford Law School, Retrieved from http://liblog.law.stanford.edu/category/research-tools/page/2/,08.12.2014
Sussman, L. & Santos, D. (2000). “Improving the Return on IT Investment: The Productivity Paradox”, International Journal of Information Management, 20, pp.429-440.
Senn, J.A. (1995). “Information Technology In Business”, Prentice Hall Int, New Jersey.
Tekin, M., Güleş, H.K. & Burgess T. (2000). “ World Technology Management Information Technology”, Damla Offset, Konya
TUSIAD. (2012). “Turkish Industry and Business Association”, Sabanci University, Competition Forum, Notes, No:2012-3
Ünsal, A.,(2000). “Gazi University, on the Application of Discriminant Analysis and a Sample", Journal of the
Faculty of Economics and Administrative Sciences, 3/2000,19-36
Vartiainen, T. & Pirhonen, M. (2009), “Morally Successful IT Projects”, Information System Devolopment, (Ed) Chris Barry, Kieran Conboy, Michael Lang, Gregory Wojtkowski, Wita Wojtkowski, Volume 2, Springer, Newyork.
Zehra Alakoç BURMA was born in Sivas, Turkey. In economics undergraduate, master's and a PhD in the field of Business Administration on numerical methods. Since 2003 serves as an assistant professor at the University of Mersin. She teach via distance education methods in Mersin vocational high schools. She has got five books, written numerous articles and papers. She married and has a son.
Phone Number : 90 0544 323 85 71

The IISTE is a pioneer in the Open-Access hosting service and academic event management.
The aim of the firm is Accelerating Global Knowledge Sharing.
More information about the firm can be found on the homepage:
http://www.iiste.org
CALL FOR JOURNAL PAPERS
There are more than 30 peer-reviewed academic journals hosted under the hosting platform.
Prospective authors of journals can find the submission instruction on the following
page: http://www.iiste.org/journals/ All the journals articles are available online to the
readers all over the world without financial, legal, or technical barriers other than those
inseparable from gaining access to the internet itself. Paper version of the journals is also
available upon request of readers and authors.
MORE RESOURCES
Book publication information: http://www.iiste.org/book/
Academic conference: http://www.iiste.org/conference/upcoming-conferences-call-for-paper/
IISTE Knowledge Sharing Partners
EBSCO, Index Copernicus, Ulrich's Periodicals Directory, JournalTOCS, PKP Open
Archives Harvester, Bielefeld Academic Search Engine, Elektronische Zeitschriftenbibliothek
EZB, Open J-Gate, OCLC WorldCat, Universe Digtial Library , NewJour, Google Scholar

![A novel strategy for cartilage tissue engineering ...apbs.mersin.edu.tr/files/cyilmaz/Publications_001.pdf · of ACI [1,2]. With MACI technique ... Chemical analysis of pure gelatin](https://img.dokumen.tips/doc/110x75/5ace19297f8b9a56098b59ce/a-novel-strategy-for-cartilage-tissue-engineering-apbs-aci-12-with-maci.jpg)