Embed Size (px)
Citation preview

THE EFFECT OF ABRUPTCHANGESIN PLASMACALCIUMCONCENTRATIONSON RENALFUNCTIONANDELEC-
TROLYTEEXCRETION IN MANAND MONKEY1'2
By MARVIN F. LEVITT, MARKH. HALPERN, DEMETRAP. POLIMEROS,AVRONY. SWEET, AND DONALDGRIBETZ
(From the Departments of Medicine and Pediatrics, The Mount Sinai Hospital,New York, N. Y.)
(Submitted for publication June 25, 1957; accepted September 26, 1957)
It is well known that patients with hypercal-cemia of diverse etiologies may exhibit markedpolyuria (1-5). The increased rate of urine for-mation is often associated with considerable lossesof urinary solute and sometimes results in severedepletion of extracellular salt and water stores(6). This urinary wastage has been attributed toslowly developing pathological changes in the re-nal tubules produced by prolonged hypercalciuriaand nephrocalcinosis. It is possible, however, thatthe renal response may in part be conditioned bya direct and immediate physiological effect of thehypercalcemia and/or hypercalciuria. The stud-ies of Wolf and Ball in which calcium infusions inthe dog provoked a prompt increase in the rate ofsodium excretion (7) suggest that such is the case.To test this hypothesis further, experiments weredevised in man and monkey to evaluate the immedi-ate effects of changing filtered calcium loads upondiscrete renal functions and upon the rate of ex-cretion of electrolytes.
MATERIALS AND METHODS
An increase in the filtered load of calcium was achievedby a sustained calcium infusion or by the single intra-venous injection of calcium in the form of gluconate orlactate. In monkey and man the infusions were admin-istered in the form of calcium gluconate or lactate at therate of 0.07 mg. of calcium per minute per Kg. for aperiod of 60 to 90 minutes. The calcium salts were dis-solved in hypotonic saline solutions (0.45 per cent).The infusion was administered at a constant rate of1 ml. per minute in man and 0.1 ml. per minute in monkey
1 Supported by grants from the United States AirForce [Contract No. AF 41(657)], the National Insti-tute of Arthritis and Metabolic Diseases, National In-stitutes of Health (Grant No. A-277), and the NationalFoundation for Infantile Paralysis.
2 Presented in abstract form at the Forty-Eighth An-nual Meeting of The American Society for Clinical In-vestigation, May, 1956.
and contained proper quantities of inulin and PAH forthe measurement of renal clearances. Comparable solu-tions free of calcium were administered at the same ratebefore and after the calcium infusion. Three to four 20minute control periods were obtained prior to the calciuminfusion, during which inulin and PAH clearances andthe control rates of sodium, chloride, potassium, calcium,phosphorus and ammonium (pH and bicarbonate in someexperiments) excretion were determined. Similar meas-urements were made in four 20 minute periods during thecalcium infusion, and for two to three comparable periodsafter the calcium infusion was discontinued. Standardcatheter and air flush techniques were used for bladderemptying and clearance determinations. During the con-trol period at least two and generally three heparinizedblood samples were obtained for the determination ofplasma calcium, phosphorus, sodium, potassium, chloride,bicarbonate, inulin and PAH concentrations. Similarmeasurements were repeated at 15 minute intervals dur-ing the calcium infusion and after its discontinuation.The calcium infusion studies were performed in five rest-ing normal adults in a fasting state and in three normalfasting cynomolgus monkeys. Similar measurementswere made in man before and after a single intravenousinjection of 10 ml., 20 ml., and 40 ml. of 10 per cent cal-cium gluconate solution, respectively. These single in-jection experiments were performed in seven normal fast-ing male subjects.
After the typical response to a standard rapid injectionof 20 ml. of calcium gluconate was evaluated, similarloads were administered to eight patients in whom theurine had been either alkalinized or acidified with appro-priate prior therapy. In the latter subjects sodium bicar-bonate or ammonium chloride solutions of 150 mEq. perliter were administered at the rate of 2 ml. per minute for90 minutes before and for a similar period after the injec-tion of the calcium load. In these subjects, measurementssimilar to those mentioned above were made during theacidifying or alkalinizing infusion both before and afterthe administration of the calcium load.
The plasma calcium concentration was reduced inthree normal patients by the infusion of a chelating solu-tion. Sodium Versenate®D (sodium salt of ethylenedia-minetetraacetic acid, Riker Laboratories, Inc.) was in-fused at the rate of 15 mg. per minute for 40 minutes.Measurements identical to those listed above were re-peated before, during and for 90 minutes after the chelate
294

EFFECT OF CALCIUM LOADS ON ELECTROLYTEEXCRETION
infusion. In addition, free and total (digested) calciumconcentration in the urine was measured during and afterthe VersenateS infusion.
The chemical methods are, for the most part, identicalto those previously used and reported from this labora-tory (8, 9). In addition, phosphorus was analyzed bythe method of Fiske and Subbarow (10) and calcium bythe technique of Kramer and Tisdall (11).
RESULTS
Calcium infusions in man (Table I)
The plasma calcium concentration rose promptlyduring the calcium infusion, remained elevatedthroughout the infusion and tended to fall towardnormal in the postinfusion period' (Figure 1,Table I). The plasma phosphorus rose consist-ently but much more slowly, reaching its highestlevels after the discontinuation of the infusion infour of the five subjects (Table I). The peak in-creases in plasma calcium and phosphorus concen-tration averaged 6.0 mg. per cent (2.7 to 12.0)and 1.5 mg. per cent (0.9 to 1.9), respectively.No changes were noted in plasma sodium, potas-sium, chloride, bicarbonate concentrations or inthe plasma pH.
The rate of calcium excretion began to increasepromptly after the onset of the calcium infusionand reached a maximum toward the end of theinfusion period (Figure 1, Table I), with the in-crement averaging 56 ,&Eq. per minute (44 to 62).Phosphorus excretion also rose after the onset ofthe calcium infusion. This peak increase averaged21 uM per minute and tended to occur somewhatlater than the maximal increase in the rate ofcalcium excretion.
The calcium infusions induced a prompt in-crease in the rate of salt excretion (Figure 1,Table I). This increase was noted in the firstinfusion period, reached a peak toward the end ofthe calcium infusion, and persisted to a lesser ex-tent during the postinfusion period. The maxi-mumincrease in the rate of sodium excretion av-eraged 700 FEq. per minute (375 to 1,086 ,AEq.per minute) or more than four times the controlvalues. The simultaneous peak increase in therate of chloride excretion averaged 520 /Eq. perminute (190 to 870 /AEq. per minute) or greaterthan two times the control values. Coincidentwith the peak increase in salt excretion, there oc-curred a moderate increase in the rate of urine
PMENTV.E. -34 YRS. sr CALCIUN INFUSION --
1400 15r n/1t. ,
1200RATE OF /*~.URINARY 1000NoeANDCI *
EXCRETION 800- No,.,zEqJmi) 600- _ ______ _ ____400- CI CI200 ''NoZ; -
RATE OF 600URINARY r 2Co ANDOP 40 --~~110
EXCRETION I ' 0
PLASMACC 1 6CONCENTRATN12
6. F.R. o0%DEVIATION I
0 1 2 3 4 5 6 7 8 9PERIODS
FIG. 1. THE EFFECT OF A CALCIUM INFUSION ON RE-NAL FUNCTION, ELECTROLYTEEXCRETION, CALCIUM ANDPHOSPHORUSPLASMA CONCENTRATIONSIN MAN
flow averaging 3 ml. per minute. The increasesin the rate of calcium, salt and water excretiontended to coincide. The rate of potassium excre-tion did not change consistently during the cal-cium infusion (Table I), tending to increase intwo experiments, fall in two and remain un-changed in one. No consistent changes in the rateof urinary excretion of ammonia, bicarbonate, orin urinary pH were noted during or after thecalcium infusions in those experiments in whichthese indices were measured.
Inulin clearance measurements showed no de-tectable changes in three of the human subjectsand a small increase in the two remaining subjects(Table I-S. E. and V. E.). PAH clearancesshowed an increase in four of the five subjects(Table I).
Calcium infusions in monkey (Table II)The data obtained from calcium infusions in
three monkeys were similar to those obtained inman (Figure 2, Table II). The changes inplasma calcium and phosphorus concentrationscorresponded to those seen in man with the risein phosphorus tending to occur more slowly andreaching its peak later. The maximum increasesin calcium and phosphorus concentrations aver-aged 2.6 and 0.9 mg. per cent, respectively. Thepeak increase in the rate of calcium excretion av-
eraged 14 ,uEq. per minute and tended to coincide
295

M. F. LEVITT, M. H. HALPERN, D. P. POLIMEROS, A. Y. SWEET, AND D. GRIBETZ
TABLE I
The effects of calcium infusion on renal function and electrolyte excretion in man
PlasmaClearances Urine electrolyte excretion concentration
Potas- Cal- Phos- Urine Cal- Phos-Subject Periods Inulin PAH Sodium Chloride sium cium phorus volume cium phorus
ml./min. ml./min. gEq./min. jEq./min. pEq./min. ;&Eq./min. $gM/min. m./min. mg. % mg. %
R. R. Control* 103 553 293 300 76 3.3 12.1 3.2 9.4 3.3
Calcium 114 688 434 387 82 8.2 20.1 6.9 12.6 4.1gluconate 109 654 609 449 34 36.7 21.3 3.9infusion 100 650 666 490 34 47.1 23.0 1.2 13.7
Aftercalcium 103 592 582 471 28 44.8 28.9 1.3 13.4 4.8infusion
S. E. Control* 74 412 217 149 53 4.3 2.3 1.4 9.3 2.1
Calcium 81 470 357 316 73 14.8 5.6 4.5 21.4 2.3gluconate 93 546 1,211 848 92 62.3 13.4 5.0 16.4infusion
After 82 437 803 534 102 47.6 10.1 3.3 15.0 3.7calcium 71 428 617 425 74 31.6 7.0 2.9infusion
V. Et Control* 95 321 284 332 78 6.2 11.7 1.8 9.3 3.7
Calciumgluconateinfusion
Aftercalciuminfusion
96 364108 413108 410108 487
109 44897 405
106 433
387675934
1,370
1,291950875
370 62 12.6582 47 31.9822 49 48.4
1,240 64 70.2
1,198 67 67.5923 50 47.5814 68 45.5
15.517.621.827.0
25.620.621.3
1.83.24.68.5
7.14.54.6
12.2 4.3
14.6 4.7
14.0 5.2
R. M. Control* 126 590 130 228 140 10.4 4.9 5.7 9.2 2.6
Calcium 128 624 263 415 130 22.8 4.5 5.4 10.0 2.6gluconate 122 608 536 473 116 40.4 8.4 4.0 12.4infusion 123 640 731 612 121 71.7 13.7 5.0 15.0 3.2
Aftercalcium 127 610 578 477 103 67.5 14.5 2.8 3.5infusion
N. L. Control* 121 632 239 229 98 18.1 0.9 2.7 9.9 2.1
Calcium 127 676 414 388 127 36.8 1.6 9.4 11.2 2.2gluconate 125 608 705 641 97 65.2 5.2 6.9infusion 124 555 761 691 77 74.7 9.0 5.3 12.6 4.0
After 123 531 658 590 62 69.8 11.8 4.1 11.2 2.9calcium 120 670 448 418 50 57.8 11.5 2.3infusion
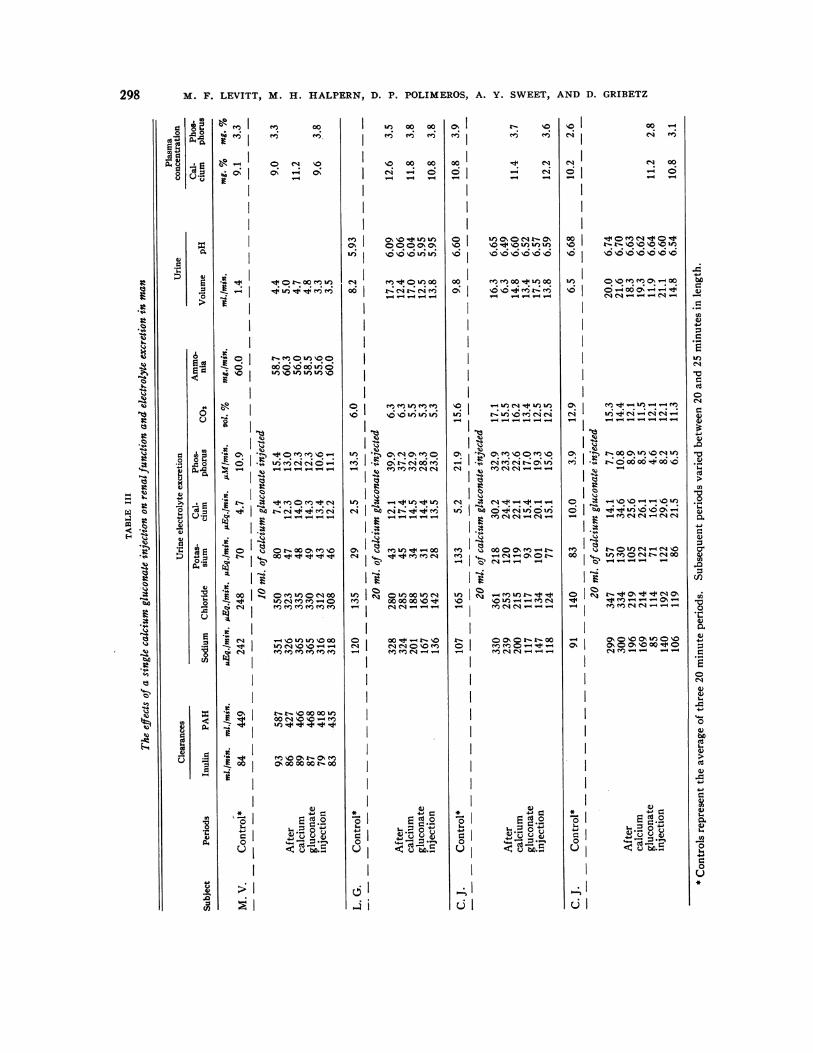
* Controls represent the average of three 20 minute periods. Subsequent periods varied between 20 and 25 minutesin length.
t In this patient 0.15 mg. of calcium per Kg. per minute was administered.
with the increases in the rate of sodium and chlo- a consistent increase in the rate of potassium ex-
ride excretion. The maximal increments in the cretion averaging 7 ,uEq. per minute occurred si-rate of sodium and chloride excretion averaged multaneously with the maximum rate of salt ex-
22 and 14 uEq. per minute or about six times the cretion. No changes in inulin clearance were
control values, respectively. In contrast to man, noted during or after the calcium infusion.
296

EFFECT OF CALCIUM LOADS ON ELECTROLYTEEXCRETION
TABLE II
The effects of calcium infusion on renal function and electrolyte excretion in the monkey
PlasmaClearances Electrolyte excretion concentration
Potas- Cal- Ammo- Cal- Phos-Monkey Periods Inulin PAH Sodium Chloride sium cium nia cium phorus
ml./min. mi/min. pEq./min. AEq./min. AEq./min. ;&Eq./min. mg./min. mg. % mg. %
I Control* 10.6 0.4 2.4 6.3 6.6 12.6 2.4
10.0 0.6 3.4 5.0 7.4Calcium 11.4 2.0 6.5 11.7 13.7 14.0 2.7gluconate 9.1 3.4 10.1 11.8 15.9infusion 9.4 1.2 5.6 6.5 16.6 15.6 2.7
8.6 2.3 8.7 9.4 17.0
After 9.7 1.2 4.5 5.1 10.2calcium 11.4 0.9 2.7 2.2 13.7 11.8 3.5infusion 7.5 0.9 2.4 1.5 5.6
II Control* 14.8 6.1 12.3 6.3 10.2 7.0 11.4 2.5
Calcium 12.7 7.3 13.7 6.5 12.1 6.5 14.2 2.6gluconate 13.7 23.0 37.9 12.2 21.0 9.9infusion 13.0 21.0 36.4 9.4 20.3 8.4 15.6 3.5
12.5 22.6 35.5 8.0 15.5 6.5
After 11.4 10.3 22.1 6.5 17.1 5.9calcium 11.2 8.0 14.3 5.2 12.8 5.0 11.1 3.2infusion 10.6 7.2 14.5 4.8 10.1 4.8
III Control* 14.5 79.7 1.9 3.4 5.7 5.1 6.1 11.6 4.2
Calcium 15.1 86.7 6.0 15.4 6.7 14.7 9.4 12.4 4.6gluconate 15.7 90.7 14.1 37.8 10.2 26.2 14.3infusion 13.9 81.3 13.1 34.0 9.0 24.7 9.8 12.6 5.8
15.0 87.8 22.7 37.0 13.4 29.6 11.2
After 14.3 90.3 5.1 28.8 4.1 20.6 4.2calcium 14.1 89.1 0.9 7.4 1.6 15.7 8.5 9.4 5.4infusion 12.6 83.0 1.1 3.3 3.3 7.8 7.9
* Controls represent the average of three 20 minute periods. Each subsequent period varied between 20 and 25minutes in length.
Single intravenous administration of calcium inman (Tables III and IV)The rapid intravenous administration of 10, 20,
and 40 ml. of 10 per cent calcium gluconate solu-tion in man likewise produced an increase in therate of calcium and salt excretion with the preciseresponse proportionate to the quantity injected(Table III). Following the 20 ml. load, the rateof calcium and phosphorus excretion increased anaverage of 17 uEq. and 13 pxM per minute, re-spectively. Coincidentally, the increment in therate of sodium and chloride excretion averaged183 and 148 ,fEq. per minute, or 200 and 110 percent greater than the control rates, respectively.A small transient increase in potassium excretionwas noted but no changes in urinary pH or bicar-bonate concentration were noted. The changes
following the injection of a 40 ml. calcium loadwere qualitatively similar but greater, whereasthose following the injection of 10 ml. of calciumgluconate solution were considerably smaller(Table III). No changes in glomerular filtrationrate or renal plasma flow were detected in thosesubjects in which it was measured following thesingle intravenous calcium injections (Table III-M. V., S. S., and J. M.)
In the experiments in which 20 ml. of calciumgluconate was administered intravenously to sub-jects being infused with bicarbonate or ammoniumchloride, no definite difference in the response tothe calcium load was noted from that observed inthe unprepared patients (Table IV). The in-crease in the rate of calcium, sodium, and chlorideexcretion approximated that observed in patients
297
M. F. LEVITT, M. H. HALPERN, D. P. POLIMEROS, A. Y. SWEET, AND D. GRIBETZ
m 00'nI e
a- 0I O N V0r. 0- LO
I
- 0- 00 N m')
:~I
00 --t ' Rt 114 -
. K
- 4 WI
r44
.~ I.
0C0t- r-0o00 0 to
00so oNo - m
ON
g
(N b------
0%b 4-- 4- O 000- IP 00 (N V -
- $ )0%--0%-'I001
SoI e orooono4
_ t I %;, oo.. +
oo00 00
- - e-V00 00
0%I00In0%0
dj __
-I~
If) t-4 c4U)- c4Uel
.: - ---
V) ao soU 0 U)(
mI oNoo
C'
-I
I
400
OI sm
In0** Si,mo 00 00 00 \0 U)
I 0 - \
m
cdu)1)2ONOr<°_Irb~seno
Of_- :s*
C) I ¢-! C- W. -
0 I
0% 4. V*
- I I-
001 - (
V- U)W)to )i
o 6 _ N661
00 m('00 -- to00
-
- . . 4. .. 0%If
(N ; 4 C~
eq C'4--t O
.
- 0000ON m- 44-.-I' CNC>r
- - r- --0
C -- --d -
lI o
M CS C' W- '" - -
H~~~.1~~~~~r
. .. .'. . .
e - u los
10Ci
(N~(I
00
CN
000
I
(-I
00 -
e11 00-6o1- -
Co 'IO en en 0% 00
- -4 V-4- -4
- V- t V--q eUn
trU c0%00%-4ci 4- -4 -~e -4 e4 W-
- 00to oo C14 _in
C0..0) 0. . .eMC4_4 C4 1
0. . . . .i .0.. .% .- .N .
V-4- - - --
_- -, ON t C4 a,
ON0 \0 0% tn)0 \00N00%C. \00 0
(N- v-- - -4
C1
°'~~~~~C1-
o~~~~~Io -
298
8 .09
0i
d
6
3
Q
.-0
4)-0.0
U
0
0A .5
3
4)
CZ)
rk)
a)4
a4)
a)bI.4
Xi~0
C4)
4-
0
r.
U)4)
V
Vf)(N
bo
d
Cd
(4
0
(N0
._
4)
4)
04
._
0o4)U),0
U)'00_o.4)4)
0e204)
4)
(44-4)
(44)
U)4)

EFFECT OF CALCIUM
O ~00I0 .00
0 In 00 el
;) Y a aI '0U)N C
4)~o~ . 1a - -
o
l~~~~~~0gsOtto°CN'4E1* CN
0
0
. w; '0%,e I 0%0Co
=0O.
U 1S
4: -o-. __.~ef
X
.S I. C C No o.-q
0r
_ O V
CI
Ad c d
.0 .o
LOADS
t...
CV)
'N 0% '0rq.t (DI \+
n .d
= 00 0 I-t--:44 ~4
4
e))
m \0% el e; el
7--4 --; _; _; _
_;0% 0~1
0 to LO 10C)
uZ '0-a
00Q000Q'o oO0%
CV) -4 CV-
in 0o 00
_ _-4-4 -
: ed 0C: . _
io
ON ELECTROLYTEEXCRETION
lo oo0m Iqeq L t- eq
e 0C C e6 el; C
tI oo00jm O O NOo~I -o oI- -- -
IO I 9.~n r91tX
) 00 - 'IO Uo%O 0 00 %0V 00 10% a%
o U>U~C) 0 oes
o CV00' U)Ln 00''-
C4(Vt -4 M Ln mC
00 C4 -itUo) 0o Ien
1Pm0 e%.OeNO.
t- o 0 Vdc ~ 0t- .1
+~~~~~ 14 Ul r-+ In m
I, Ne S %
o a eX+N mq m_+
C000 0 0J- -t NO Mt
00U) U)+)o n
OI 0000ooo U) I -00Co k
Z- - -
4J )40 Ec0 -0
U U Cut -b.I
c~~~~~~~~~~~iI~~~~~~~~~
299
.:t
0-
¢-

M. F. LEVITT, M. H. HALPERN, D. P. POLIMEROS, A. Y. SWEET, AND D. GRIBETZ
whose urine had not been previously acidified or
alkalinized. At the time that the calcium loadwas administered, the urine pH's averaged 6.01,6.52, and 7.33 in the acidified group, the untreated,and the alkalinized group, respectively. Nochange in the plasma pH was detected during theacid or the alkaline infusions.
Versenate® infusion in man (Table V)
In the chelate experiments, as the plasma cal-cium concentration fell, the rate of sodium andchloride excretion likewise decreased (Figure 3,Table V). Plasma calcium concentration beganto fall toward the end of the chelating infusionand continued to fall thereafter. Total calciumexcretion, free plus chelated (digested), rose
promptly after the onset of the infusion but the
rate of excretion of free calcium fell toward theend of the Versenate® infusion. Coincidentally,there occurred a fall in the rate of sodium andchloride excretion. These falls in electrolyte ex-
cretion averaged 177 and 144 /AEq. per minute or
45 and 47 per cent of the control values for so-
dium and chloride, respectively. Total phospho-rus excretion tended to rise slowly after the onsetof the Versenate® infusion reaching its highestlevels after the cessation of the infusion. Nochanges in glomerular filtration rate or renalplasma flow were noted throughout these chelateexperiments.
DISCUSSION
These data indicate that an increase or decreasein the plasma calcium concentration promptly pro-
duces a similar change in the rate of salt excretion
TABLE IV
The effects on electrolyte excretion of a single calcium injection in patients receiving an acid or alkaline infusion
PlasmaUrine electrolyte excretion concentration
Potas- Cal- Phos- Urine Urine Plasma Cal- Phos-Subject Periods Sodium Chloride sium cium phorus volume pH pH cium phorus
(Infused with NH4C1) 1AEq./min. juEq./min. uEq./min. pEq./min. pM/min. ml./min. mg. % mg. %
P. L. Control* 85 118 61 8.4 8.3 4.5 6.45 10.4 1.9
20 ml. of calcium gluconate injected216 208 60 34.7 16.0 12.6 6.32After 222 239 46 21.6 19.5 12.7 6.18
calcium 110 123 24 12.8 10.8 7.5 6.11gluconate 145 181 33 19.6 14.6 11.5 6.07
A. A. Control* 151 156 36 13.5 10.2 0.8 6.21 7.23 10.1 1.4
20 ml. of calcium gluconate injected
After 231 208 29 14.8 8.0 5.6 6.18 7.32 11.0 1.8calcium 154 149 11 15.1 6.7 1.2 5.51caluciume 205 225 14 20.8 7.5 1.2 5.48 7.34 10.6 2.0gluconate 220 246 14 21.6 6.7 1.2 5.47
R. B. Control* 27 57 20 6.2 4.7 0.5 5.50 7.36 10.0
20 ml. of calcium gluconate injected
After 143 180 38 20.9 6.6 1.3 5.46 7.38 12.7calcium 96 117 25 23.7 5.9 0.7 5.02caluciume 116 168 21 31.1 7.9 0.9 5.09 7.39 11.0gluconate 159 225 23 28.1 6.7 1.5 5.09
D. M. Control* 155 242 123 6.7 4.0 9.7 6.82 7.34 11.1 1.7
20 ml. of calcium gluconate injected287 335 126 19.8 6.6 7.6 6.70 7.36 13.8After 246 304 100 17.6 6.6 3.9 6.60
calcium 213 282 88 15.1 7.9 2.9 6.44 7.36gluconate 228 337 113 15.1 9.9 5.7 6.32
* Controls represent the average of three 20 minute periods. Subsequent periods varied between 20 and 25 minutesin length.
300

EFFECT OF CALCIUM LOADS ON ELECTROLYTEEXCRETION
TABLE IV-Continued
PlasmaUrine electrolyte excretion concentration
Potas- Cal- Phos- Urine Urine Plasma Cal- Phos-Subject Periods Sodium Chloride sium cium phorus volume pH pH cium phorus
(Infused with NaHCOs) pEq.rmin. ,uEq./min. 1AEq./min. Eq./min. M/mmin. mi./min. mg. % mg. %V. V. Control* 404 189 106 2.8 23.8 6.7 7.74 9.5 2.8
20 ml. of calcium gluconate injected491 245 70 4.2 25.7 11.8 7.16 10.6 2.9
After 477 264 38 6.2 21.2 15.5 6.90calcium 447 240 44 7.1 18.9 16.7 6.81 9.9 3.1gluconate 396 204 42 7.8 14.3 18.2 7.07
384 222 31 9.0 8.0 9.0 7.39
G. I. Control* 309 142 176 4.6 23.3 4.9 7.66 10.0 2.4
20 ml. of calcium gluconate injected473 225 157 15.1 21.0 4.5 7.63 10.4 2.5
After 430 188 95 19.2 23.1 10.4 7.29calcium 199 72 63 8.7 18.9 10.8 7.12gluconate 205 60 78 8.0 10.2 13.4 7.12
266 77 87 10.5 10.3 12.3 7.29
S. L. Control* 121 43 181 7.5 36.3 6.7 7.20 10.2 2.2
20 ml. of calcium gluconate injected319 100 272 27.0 39.3 21.8 7.17 10.3 2.2
After 214 46 79 20.3 19.6 10.5 7.15calcium 229 50 94 28.7 28.4 14.2 7.00gluconate 160 24 48 20.9 23.9 10.7 7.03
199 28 58 23.7 22.1 11.8 7.09
P. L. Control* 360 116 198 5.3 8.8 6.6 7.70 9.3 2.1
20 ml. of calcium gluconate injected565 172 145 23.5 31.8 9.3 7.36
After 299 87 53 14.4 26.2 4.3 7.36calcium 188 46 44 9.6 21.3 6.6 7.01gluconate 148 44 69 11.2 25.9 9.7 7.03
236 39 64 9.5 23.7 7.3 7.23
in man and monkey. The mechanism by whichthis change in the rate of electrolyte excretionoccurs is not certain. It is possible that a changein the rate of electrolyte excretion could be ex-plained by a similar change in glomerular filtra-tion rate. Indeed, in two of the five calcium in-fusion studies in man an increase in filtration ratewas observed coincident with the peak increase insalt excretion. However, in the remaining ex-periments in man and monkey, no measurablechanges in filtration rate were apparent. Further-more, in those experiments where a slight increasein filtration rate did occur, the markedly elevatedrate of salt excretion persisted after the filtrationrate had returned to control levels (Figure 1,Table I). The changes in salt excretion are com-pared with the changes in filtration rate in Figure
4, but no consistent relation is apparent. In thechelate infusion experiments the falls in electrolyteexcretion were not associated with a measurablefall in filtration rate. These data, therefore, showno consistent trend to suggest that the changes insalt excretion are mediated through changes inglomerular filtration rate. Instead, they implythat a change in plasma calcium concentration andin the rate of calcium excretion effects an imme-diate and opposite change in the rate of tubularreabsorption of sodium and chloride. Figure 5suggests that this altered tubular function corre-lates best with the change in the rate of calciumexcretion.
The contention that the salt diuresis is causedby the osmotic load imposed by the calcium doesnot appear tenable. The salt diuresis produced
301
M. F. LEVITT, M. H. HALPERN, D. P. POLIMEROS, A. Y. SWEET, AND D. GRIBETZ
MONKEYC-2, 3.2 Kgs.Co INFUSION
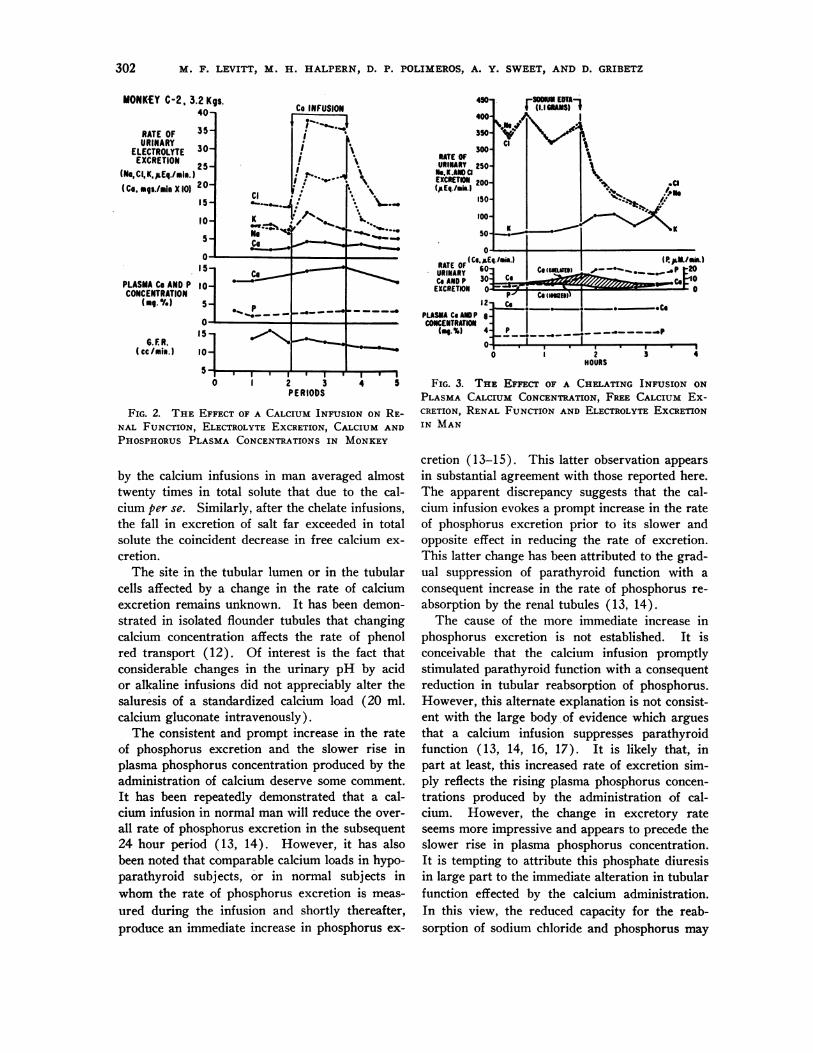
FIG. 2. THE EFFECT OF A CALCIUM INFUSION ON RE-NAL FUNCTION, ELECTROLYTEEXCRETION, CALCIUM AND
PHOSPHORUSPLASMA CONCENTRATIONSIN MONKEY
by the calcium infusions in man averaged almosttwenty times in total solute that due to the cal-cium per se. Similarly, after the chelate infusions,the fall in excretion of salt far exceeded in totalsolute the coincident decrease in free calcium ex-
cretion.The site in the tubular lumen or in the tubular
cells affected by a change in the rate of calciumexcretion remains unknown. It has been demon-strated in isolated flounder tubules that changingcalcium concentration affects the rate of phenolred transport (12). Of interest is the fact thatconsiderable changes in the urinary pH by acidor alkaline infusions did not appreciably alter thesaluresis of a standardized calcium load (20 ml.calcium gluconate intravenously).
The consistent and prompt increase in the rateof phosphorus excretion and the slower rise inplasma phosphorus concentration produced by theadministration of calcium deserve some comment.It has been repeatedly demonstrated that a cal-cium infusion in normal man will reduce the over-
all rate of phosphorus excretion in the subsequent24 hour period (13, 14). However, it has alsobeen noted that comparable calcium loads in hypo-parathyroid subjects, or in normal subjects inwhom the rate of phosphorus excretion is meas-
ured during the infusion and shortly thereafter,produce an immediate increase in phosphorus ex-
450
400
350
300RATE OFURINARY 250Ne.K.AND a
EXCRETION 200
(pEq.Imia.j150
100-
too
0
RATE OF( 6Co. 0E.
URINARYCoANDP 301
EXCRETION 0.
12-PLASHA Co ANDPCONCENTRATION
".-%) 4no
FN EUWA1i (1.1 S s
\aps z,.wLIzcK
KK
I./m.)I.cm
p-1ICo
CO (CURL.
Co (mIte),
____ _ _ _ _ _._ _ _ _PI
0
(P.JImIM.)-. *- _0 p 20~~~~.. Ri
2HOURS
3-
4
FIG. 3. THE EFFECT OF A CHELATING INFUSION ONPLASMA CALCIUM CONCENTRATION, FREE CALCIUM Ex-CRETION, RENAL FUNCTION AND ELECTROLYTEEXCRETIONIN MAN
cretion (13-15). This latter observation appearsin substantial agreement with those reported here.The apparent discrepancy suggests that the cal-cium infusion evokes a prompt increase in the rateof phosphorus excretion prior to its slower andopposite effect in reducing the rate of excretion.This latter change has been attributed to the grad-ual suppression of parathyroid function with aconsequent increase in the rate of phosphorus re-absorption by the renal tubules (13, 14).
The cause of the more immediate increase inphosphorus excretion is not established. It isconceivable that the calcium infusion promptlystimulated parathyroid function with a consequentreduction in tubular reabsorption of phosphorus.However, this alternate explanation is not consist-ent with the large body of evidence which arguesthat a calcium infusion suppresses parathyroidfunction ( 13, 14, 16, 17). It is likely that, inpart at least, this increased rate of excretion sim-ply reflects the rising plasma phosphorus concen-trations produced by the administration of cal-cium. However, the change in excretory rateseems more impressive and appears to precede theslower rise in plasma phosphorus concentration.It is tempting to attribute this phosphate diuresisin large part to the immediate alteration in tubularfunction effected by the calcium administration.In this view, the reduced capacity for the reab-sorption of sodium chloride and phosphorus may
so. COE",aIeus I
302
i
v
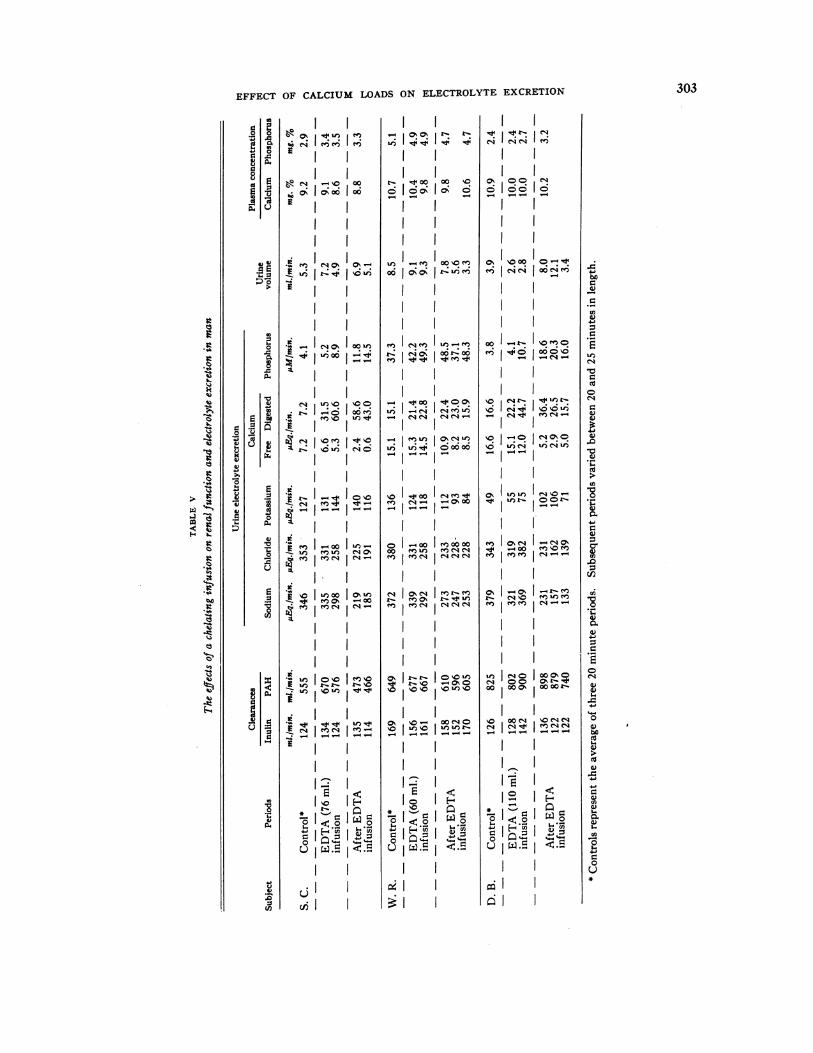
303EFFECT OF CALCIUM LOADS ON ELECTROLYTEEXCRETION
mm
-0~
e -1n00
$ Io d lI
- OI
.t e1No 10oel
vod
A M) 2(tn
C4 m A
S I
I
- --
q N o +
. I~ I~2
~ H
6 JL&n N.I
~,t
z*..~4000. .* -
o jo o o6- o6
I4 _
i l I
(U _e o
4o008 r0u:
-i~00 m~o00%
e :e e
,q 0 s, oo o
- -- -e
mD-A -
0 ' 0 S-
Im t
U)0 t-o oUo
_I __I_l
oo
0% cs- 00( 90
- - ---
t o HmoI -4UI !oU)
.
N nsU
l~ l~
NC>I ---
I
I
o _
00 0
- C
l L
I a
001 r mlom
- I t-
00%
_
--
(U 0%r uv
XoI oo_I _
o -o oo
__I
I'I) o0 oO0%0
oI _ _
e I sI N_
U I ooI ooo
l
0 04i 00:.08 E
P8 5
3EI
40.0
.0
z4
0
10.0U4
06)'i
S..
H
S..
a)
0
.
F-. ..
0
0
a)
0
blo
vC
0
G)
W
0
U)
0.
0
a)
._
wa
cd
4-
r-
W
0n
r.
0
0
._
0)0)
a)COa)
U70)0)S..
._a)o-U)
I-
0U*_
._
n1

M. F. LEVITT, M. H. HALPERN, D. P. POLIMEROS, A. Y. SWEET, AND D. GRIBETZ
-10 -5 0 +S +:! +15PERCENTAGEC ;HANGE !IN C F R
FIG. 4. CHANGESIN SODIUMEXCRETIONPLOTTEDAGAINSTCHANGESIN GLOMERULARFILTRATION RATE
Shaded areas represent changes of 7.5 per cent infiltration rate-changes which are within the experimentalerror.
all represent the direct effect of a sudden increasein filtered calcium load.
The slow rise in plasma phosphorus concentra-tion noted toward the end of the calcium infusionand thereafter agrees with similar observationsreported by others (17, 18). This finding hasbeen attributed to the rapid release of phosphorusfrom some source such as bone or tissue cells.These data are in accord with such a hypothesisbut do not help to delineate the site from whichthe phosphorus stores were transferred nor themechanism by which hypercalcemia induces sucha transfer.
The slight tendency towards an increase inphosphorus excretion toward the end and afterthe chelating infusion may best be explained byan increased secretion of parathyroid hormone.An increased rate of hormone secretion would beexpected tQ result from a falling plasma calciumlevel (19, 20) induced by the increased urinaryloss of calcium in the chelated form.
The difference between the consistent increasein potassium excretion in the monkey and the in-consistent changes in man after a comparable cal-cium load may reflect the basic dietary habits ofboth species. The monkey maintained on a pre-
dominantly fruit diet responds like any subject on
a sodium free regimen. If an anion load is im-posed by a calcium induced chloruresis, potas-sium is excreted because less sodium is available
UJI 300P(U49
a 200-
z100-
0
0
0
0
a 8BasA
I I I
0 10 20INCREASE IN
+ A
A£a
a
a
a
+
PATIENTSO MV.OS. E.A R. R.
R. i.
* V. LA N.M.+ MJ.
40 50 60 70 00
RATE OF CALCIUM EXCRETION(.v Eq./min.)
FIG. 5. CHANGESIN SODIUM EXCRETION IN THE IN-FUSION STUDIES IN MANPLOTTED AGAINST CHANGESIN
THE RATEOF EXCRETIONOF CALCIUM
(21 ). An alternate hypothesis to explain thisdifference would place the calcium effect directlyon sodium reabsorption at a site proximal to thepotassium secreting segment.
Whether the salt diuresis induced by hyper-calcemia might ultimately prove of therapeuticvalue in the edematous subject remains to be seen.
As a separate form of therapy or combined withother known diuretic agents, such calcium loadsmight prove therapeutically feasible.
SUMMARY
1. Calcium infusions in man and monkey at therate of 0.1 mg. calcium per minute per kilogramproduce a prompt increase in the rate of sodium,chloride, and water excretion.
2. Single intravenous administration of 10, 20,and 40 ml. of 10 per cent calcium gluconate solu-tion in man produces a comparable increase in therate of salt and water excretion in proportion tothe dose administered.
3. The calcium infusions or single intravenousinjections evoke a prompt increase in the rate ofphosphorus excretion.
1100-
o 1000-
Ix 900-x4.> eoo-
C700
0 600-4JUl
tt 4 300-Z 400_
10n< 300-crO 200-
1co-
1100-
0 1900-z
0
x 800-
+Mit fl5700-a i. v
LL0 e
A LJ 500-
E 400-+20 2S5 z
304

EFFECT OF CALCIUM LOADS ON ELECTROLYTEEXCRETION
4. The effects of a single intravenous injectionof calcium are not appreciably modified by theprior acidification or alkalinization of the urine.
5. A reduction in the plasma calcium concen-tration by the administration of a chelating agentcauses a fall in the rate of salt excretion.
REFERENCES1. Mandl, F. Klinisches und experimentelles zur frage
der lokalisierten und generalisierten ostitis fibrosa.Arch. klin. Chir. 1926, 143, 245.
2. Gutman, A. B., Swenson, P. C., and Parsons, W. B.The differential diagnosis of hyperparathyroidism.J. Amer. med. Ass. 1934, 103, 87.
3. Lightwood, R. Idiopathic hypercalcaemia in infantswith failure to thrive. Arch. Dis. Childh. 1952,27, 302.
4. Dietrick, J. E., Whedon, G. D., and Shorr, E. Effectof immobilization upon various metabolic andphysiological functions of normal man. Amer. J.Med. 1948, 4, 3.
5. Gribetz, D., Sweet, A. Y., Becker, A. M., Levitt, M.F., and Hodes, H. L. The use of anabolic steroidsto reduce hypercalcemia and hypercalciuria causedby immobilization in paralytic poliomyelitis. Inpress.
6. Schelling, D. H. Parathyroids in Health and Dis-ease. St. Louis, C. V. Mosby, 1935.
7. Wolf, A. V., and Ball, S. M. Effect of intravenouscalcium salts on renal excretion in the dog. Amer.J. Physiol. 1949, 158, 205.
8. Levitt, M. F., Turner, L. B., Sweet, A. Y., and Pan-diri, D. The response of bone, connective tissue,and muscle to acute acidosis. J. clin. Invest. 1956,35, 98.
9. Levitt, M. F., Turner, L. B., and Sweet, A. Y. Theeffect of experimental venous obstruction on saltand water distribution and excretion in man.J. clin. Invest. 1952, 31, 885.
10. Fiske, C. H., and Subbarow, Y. The colorimetricdetermination of phosphorus. J. biol. Chem. 1925,66, 375.
11. Kramer, B., and Tisdall, F. F. The direct quanita-tive determination of sodium, potassium, calciumand magnesium in small amounts of blood. J. biol.Chem. 1921, 48, 223.
12. Puck, T. T., Wasserman, K., and Fishman, A. P.Some effects of inorganic ions on the active trans-port of phenol red by isolated kidney tubules ofthe flounder. J. cell. comp. Physiol. 1952, 40, 73.
13. Howard, J. E., Hopkins, T. R., and Connor, T. B.On certain physiological responses to intravenousinjection of calcium salts into normal, hyperpara-thyroid and hypoparathyroid persons. J. clin.Endocr. 1953, 13, 1.
14. Hiatt, H. H., and Thompson, D. D. Some effects ofintravenously administered calcium on inorganicphosphorus metabolism. J. clin. Invest. 1957, 36,573.
15. Jackson, W. P. U., Hoffenberg, R., Linder, G. C.,and Irwin, L. Syndrome of steatorrhea, pseudo-hypoparathyroidism and amenorrhea. J. clin. En-docr. 1956, 16, 1043.
16. Albright, F., and Reifenstein, E. C., Jr. The Para-thyroid Glands and Metabolic Bone Disease. Balti-more, Williams and Wilkins, 1948.
17. Baylor, C. H., Van Alstine, H. E., Keutmann, E. H.,and Bassett, S. H. The fate of intravenously ad-ministered calcium. Effect on urinary calcium andphosphorus, fecal calcium and calcium-phosphorusbalance. J. clin. Invest. 1950, 29, 1167.
18. Salvesen, H. A., Hastings, A. B., and McIntosh, J.F. The effect of the administration of calciumsalts on the inorganic composition of the blood.J. biol. Chem. 1924, 60, 327.
19. Albright, F. The parathyroids-physiology andtherapeutics. J. Amer. med. Ass. 1941, 117, 527.
20. Patt, H. M., and Luckhardt, A. B. Relation of alow blood calcium to parathyroid secretion. Endo-crinology 1942, 31, 384.
21. Schwartz, W. B., Jenson, R. L., and Relman, A. S.The disposition of acid administered to sodium-depleted subjects: The renal response and the roleof the whole body buffers. J. clin. Invest. 1954, 33,587.
305