Embed Size (px)
Citation preview

“The important role of GMOs in advancing sustainability”
David ZilbermanScott Kaplan
Justus WesselerRavello
April 10 2015
A special thanks to Rob Paarlberg for 2 slides andSteve Sexton, Geoff Barrows, Eunice Kim, Scott Kaplan and Jeanne Reeves

Outline
• THE state of GMO• The constraint regulation• Gains• Golden rice • Other crops

The Glass is Half Full
3
GM crops have been adopted on more than 170 million hectares (Ha) in both developed countries (48%) and developing countries (52%).
59 countries have granted regulatory approval for imports or use of 30 different GM crops. 28 countries (20 developed and 8 developing) planted commercialized GM crops in 2012.
Adopted on 4 major crops (cotton, maize, rapeseed, soybean)
Mostly in the US and Latin America
Cotton in China, India, and Africa
Adoption of GM varieties grew fast 80% of soybean land share About 60% of cotton About 25% of maize About 25% of rapeseed

How Dangerous is GMO?• There are organizations on record saying that:
“[There are] no new risks to human health or the environment from GMOs approved by regulators so far.”
• List of organizations:– Research Directorate General of EU (2001)– French Academy of Sciences (2002)– French Academy of Medicine (2003)– UK Royal Society (2003)– British Medical Association (2004)– German Academies of Science and Humanities (2004)– OECD (2000)– Director-General of World Health Organization (2002)– International Council for Science (ICSU) (2003)– Food and Agriculture Organization of the UN (2004)

What does EO Wilson (who coined the term “biodiversity”) think?
"I'll probably get it in the neck from my conservationist colleagues, but we've got to go all out on genetically modified crops. There doesn't seem to be any other way of creating the next green revolution without GMOs.”

Statement from the EU Commission Directorate-General for Research from their 2010 Report
“The main conclusion to be drawn from the efforts of more than 130 research projects, covering a period of more than 25 years of research, and involving more than 500 independent research groups, is that biotechnology, and in particular GMOs, are not, per se, more risky than conventional plant breeding technologies.”

Three generations of GM traits
• First generation production traits• Insect resistance, disease (virus) resistance, or herbicide tolerance.• Actual output = potential output * (1-damage)
• In developing countries, likely to have a high yield effect• In developed countries, there is a pesticide replacing effect
• Second generation • Enhanced product quality and composition• Tolerance to abiotic stresses• Nutrient-use and photosynthetic efficiency• Nutritional enhancement
• Third generation• Growing pharmaceuticals and industrial products in plants

8
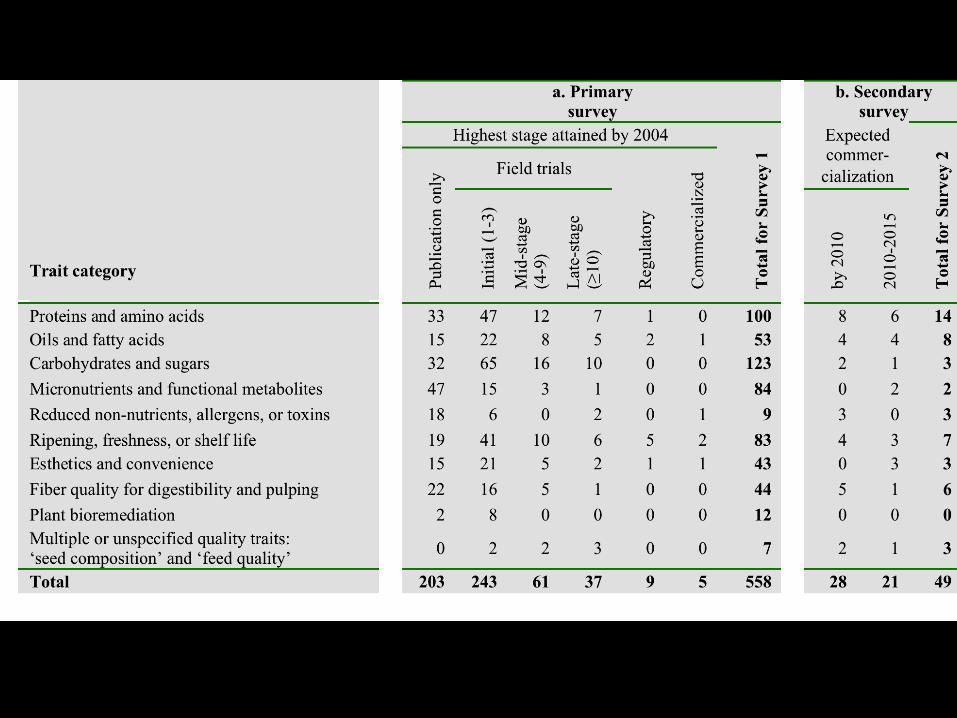
Distribution of 1st and 2nd Generation Traits
50% second genration 25% 1st & 2nd 25%
11% 7%75%
9% 11%80% first generation Commercialized
Premarket (55 traits)
Pre- trials
GMO is a process innovation (like electricity and drip irrigation) that may result in multiple innovations in many crops.
Better understanding of basic biology will lead to the discovery of genetic mechanisms to address multiple problems, including adaptation to climate change and an increasing number of stacked traits).
Many of the discoveries are made by the public sector (60% of field trials). 80% of crops are developed by the private sector. Public sector released only 10% of marketed GM varieties.

Impacts of First Generation GMO
• Actual output = potential output * (1-damage)• Pest damage can be reduced through pesticides,
labor, or GMOs.• GMO has a strong impact on actual yield when
pest damage is high and alternatives are limited.• Empirical studies have shown that it is likely to
have a stronger effect on yields in developing countries.

10
Impact of Heterogeneity & Price
• When pest damage varies by location:– Locations with low damage will not adopt– Locations with high damage will adopt– There will be new entrants
• Adoption will increase in periods of high output prices.
• Adoption will increase when technology becomes cheaper or more efficient.

11

• Increased worker safety• Greater flexibility in farm
management• Lower risk of yield variability, i.e.
de facto insurance
• Reduced effort
• Impacts vary
Other effects of GM

GMO has had Substantial Impacts with Limited Adoption
Effect Corn Cotton Soybean
Supply increase 5-12% 5-20% 2-40%
Price reduction 4-16% 16-28% 2-49% (mostly extensive margin)
**There is also evidence of substantial health effects and environmental quality improvement effects.

Is GM more Difficult for Farmers to use? The Evidence says no.
Country GM crop First year legal to plant
Percent of total crop in 2011
India Cotton 2002 88 percent
Brazil Soybean 2003 83 percent
Burkina Faso Cotton 2008 58 percent
Philippines Yellow maize 2003 64 percent
South Africa White maize 2001 72 percent
China Papaya 2006 99 percent

15
The poor benefited from GMO• The benefits of GM have been shared between
– Farmers – Biotech companies – Consumers
• Over time benefits to consumers increased• With 100% adoption in part of India, smallholders must benefit• Simple to use technology• But they may lack credit or have lower priority• Case studies show increases in income (25%+ in India) and reduced
poverty• Higher yield effect of cotton in India shifted industry to that
country, reducing its size in the US• Less exposure to toxic chemicals• Lower food prices benefit the urban poor


17
The Glass is Half Empty• Most countries do not grow GM Crops:– Africa (except in South Africa, Burkina Faso, and Egypt)– Asia (except in India, China, and Philippines)– Europe (except commercial amounts mostly in Spain)
• Mostly used for fiber and feed, not for food• Has not been applied in rice or wheat– Big loss to humanity
• Many important traits have not been commercialized.– Golden Rice is one example

Should we discriminate between technologies that prevent blindness?
• The testing and development of Golden Rice is disallowed in India and other countries.
• The possibilities of GM• Is the risk prevention worth the eyesight of millions?
I admire Dr. Vince Resh of UC Berkeley for his work on curing River Blindness.
I also admire Ingo Potrykus for his work on Golden Rice, which has the potential to save 500,000 children from blindness each year. year.

Assessing the cost of regulation using option value
• The option value approach suggests that regulation can: – Approve a technology– Disallow a technology– Vote to delay the decision
• Delay is optimal if the cost of extra knowledge is greater than the expected (discounted) gain from earlier adoption.
• In the case of Golden Rice, policymakers in India have elected to delay for 14 years.
• Using conservative cost estimates of disability, the cost of accumulated delays in approval are greater than $2 billion,– More than 1 million people would have kept their eye-sight– 200,000 lives (at least) might have saved
• The costs of delaying or disallowing other options may be as high, but what are the gains?

Costs of Delaying Golden Rice Total Number of
Eyesights Saved (1000’s)
Total Number of Eyesight-Years Saved
(1000’s)
Total Benefit Generated, 10%
Interest Rate (millions of $)
Total Benefit Generated, 4% Interest
Rate (millions of $)
k One Year Delay
30 Year Delay One Year Delay
30 Year Delay One Year Delay
30 Year Delay One Year Delay
30 Year Delay
0.2 86 2,588 1,167 35,016 277 2,733 312 7,800
0.5 214 6,408 2,858 85,738 657 6,576 756 18,900
0.8 340 10,214 4,536 136,081 1036 10,368 1,196 29,900
• k represents the maximum rate of adoption (i.e. the probability of adoption).• One can see that the total benefit lost from delay of Golden Rice each year is between
$277 million and $1.2 billion.• A delay of 30 years results in an aggregate discounted benefit lost of between $2.7 and
$29.9 billion.
Golden Rice is not the only lost opportunity
• New genetically modified (GM) traits can address the maize streak virus, which is endemic to Africa and causes ~30% or more in crop losses.
• There is a corn variety that combines drought-tolerant and insect-resistant varieties for use on smallholder farms in sub-Saharan Africa.
• A transgenic regular and plantain-banana variety that addresses a major disease as well as nematode problems that lead to 20-30% reduction in yield.– Tens of millions of people depend on these bananas, and
these varieties are currently banned.• The poor pay for the anxieties of the middle class.

Bans and Excess Regulation prevent GM from Reaching its Potential
• The impact of GM would have been much larger if:– Europe allowed the growth of GM varieties– Regulation was less restrictive• “Unjustified and impractical legal requirements are
stopping genetically engineered crops from saving millions from starvation and malnutrition,” says Ingo Potrykus.

Excessive regulation has a price: contraction of Ag biotech in 1999
Ingo Potrykus: Regulations and their costs delayed or prevented introduction of health-improving traits.

Cost of Regulations
• It currently takes 10-15 years to bring a GM product to market.– Should take 5-8
• Costs $160 million to introduce a new trait.– Should cost much less
• Uncertainty about approval increases cost of investment and reduces willingness to invest.
• We could, and should, have:– More digestible soybean– Better soybean oil
• Higher yield-producing varieties of wheat, rice, and potatoes• Less land in production, lower food prices, and fewer GHG
emissions.

If available GM has been adopted in food crops
• Prices of wheat rice and corn would have substantially declined (20-40%)
• Land would have been available for other activities – Including environmental amenities
• Use of pesticides would have declined further• Further reduction in GHG• New traits would have been developed and
introduced• We would further on our way towards a renewable
agriculture

Economic losses from delay of decisions
Elasticity of Demand=0.35 Elasticity of Demand=0.80 Price
Quantity (millions of Tonnes)
Change in Welfare (billions of $) Price
Quantity (millions of Tonnes)
Change in Welfare (billions of $)
Original Supply $237.08 821.9 $0 $237.08 821.9 $0
7.5% Increase $213.81 852.2 $10.2 $222.63 864.3 $10.5
10% Increase $206.91 862.0 $13.3 $218.23 878.3 $13.8
15% Increase $194.17 881.4 $19.1 $209.95 905.8 $20.2
Average Annual Price, Quantity, and Welfare Effect of Adoption of GM Corn
• If there was a 15% increase in the global supply of GM corn over the past 10 years:• Average annual price/tonne may have decreased as much as $42.91/tonne
(from $237.08 to $194.17).• Average annual quantity may have increased by as much as 83.9 million tonnes
(821.9 to 905.8).• Average annual social welfare may have increased by up to $20.2 billion.

Economic losses from delay of decisions
Elasticity of Demand=0.35 Elasticity of Demand=0.70 Price Quantity
(millions of Tonnes)
Change in Welfare (billions of $)
Price Quantity (millions of Tonnes)
Change in Welfare (billions of $)
Original Supply $300.48 657.7 $0 $300.48 657.7 $0
10% Increase $262.23 689.8 $13.4 274.40 700.9 $13.8
15% Increase $246.10 705.3 $19.3 263.03 722.0 $20.2
20% Increase $231.58 720.5 $24.7 252.59 742.7 $26.1
Average Annual Price, Quantity, and Welfare Effect of Adoption of GM Wheat
• If there was a 20% increase in the global supply of GM wheat over the past 10 years:• Average annual price/tonne may have decreased as much as $68.90/tonne (from
$300.48 to $231.58).• Average annual quantity may have increased by as much as 85 million tonnes (657.7
to 742.7).• Average annual social welfare may have increased by up to $26.1 billion.

Economic losses from delay of decisions
Elasticity of Demand=0.35 Elasticity of Demand=0.7 Price Quantity
(millions of Tonnes)
Change in Welfare (billions USD)
Price Quantity (millions of Tonnes)
Change in Welfare (billions USD)
Original Supply $566.45 682.8 $0 $566.45 682.8 $0
10% Increase $494.34 716.1 $26.2 $517.30 727.6 $27.1
15% Increase $463.93 732.2 $37.7 $495.85 749.5 $39.4
20% Increase $436.56 748.0 $48.3 $476.16 771.0 $51.1
Average Annual Price, Quantity, and Welfare Effect of Adoption of GM Rice
• If there was a 20% increase in the global supply of GM rice over the past 10 years:• Average annual price/tonne may have decreased as much as $129.89/tonne
(from $566.45 to $436.56).• Average annual quantity may have increased by as much as 88.2 million tonnes
(682.8 to 771).• Average annual social welfare may have increased by up to $51.1 billion.

Economic losses from delay of decisions
• The aggregate benefits of adoption of GM corn, wheat, and rice over the next 30 years range from $300 billion to $1.29 trillion.
• The aggregate benefits of adoption of GM corn, wheat, and rice over an infinite time horizon range from $328 billion to $2.04 trillion.
Table 5: Discounted Net Benefits (in billions of $) of Adoption of GM Corn, Wheat, and Rice
Elasticity η=0.35 η=0.8Interest
Rate 4% 10% 4% 10%Time
Horizon 30 Years Infinite 30 Years Infinite 30 Years Infinite 30 Years InfiniteCorn (7.5%) 136 214 61 67
139 220
63 69
Corn (15%) 254 402 115 126
268 423
121 $133
Wheat (10%)
178 282 81 88
184 290
83 $91
Wheat (20%)
328 518 148 162
347 548
157 $172
Rice (10%) 349 551
158
173
360
568
163
$178
Rice (20%) 641 1,013
290
318
679
1,073
307
$337
Total (low) $663
$1,047
$300
$328
$682
$1,078
$309
$338
Total (high) $1,223
$1,933 $554
$606
$1,294
$2,045
$586
$641

With Limited Capacity to Utilize Biological Knowledge…
• There will be fewer incentives to:– Understand and protect biodiversity– Invest in agricultural and rural based industries– Develop bio-base renewable solutions– Invest in research and development in the life sciences
• The capacity to mitigate and effectively adapt to climate change is reduced.
• As key patents expire, the cost of expanding the range of application of GM is expanding.

Conclusions• Even under constraints, GM has already increased
yields, reduced commodity prices, and improved environmental health and safety.
• But its restrictions have already been very costly in monetary and human terms.
• Its potential has not been fully tapped yet.• Its restriction will limit the capacity to develop the
bioeconomy and renewable sector of the economy.

The Future
• We should be empowered by knowledge, not constrained by fear.
• As we develop climate-smart agriculture, we need every tool available for quick and effective adaptation.
• GM can coexist with organic and other eco-methods to create productive and diversified agricultural systems.

THANK YOU