Embed Size (px)
Citation preview

Erasmus University Rotterdam
MSc in Maritime Economics and Logistics
2016/2017
The Importance of Indonesia People’s Shipping
(Pelayaran Rakyat) in Terms of Value Added,
Employment, and Competitive Position
by
Muhammad Faiq Farras Muhana
Copyright © Muhammad Faiq Farras Muhana

ii

iii
Acknowledgements
“I will complete what I have started”
Thanks for everything
My thesis supervisor, Dr. Simme Veldman,
My family, My grandmother and grandfather
Wegit, Yogya, Anna Kalinichenko, Puti, Dasman and Arief
Special for Ana Adiliya, Bayu Prasetyo Pelindo III, Eko BKI, Wahyudi BKI and Jangka
for the data support
My MEL 2016-2017 colleagues for unforgettable memories,
LPDP Scholarship, and
My beloved country Indonesia
Jalesveva Jayamahe.
Rotterdam, 2 September 2017
Muhammad Faiq Farras Muhana

iv
v
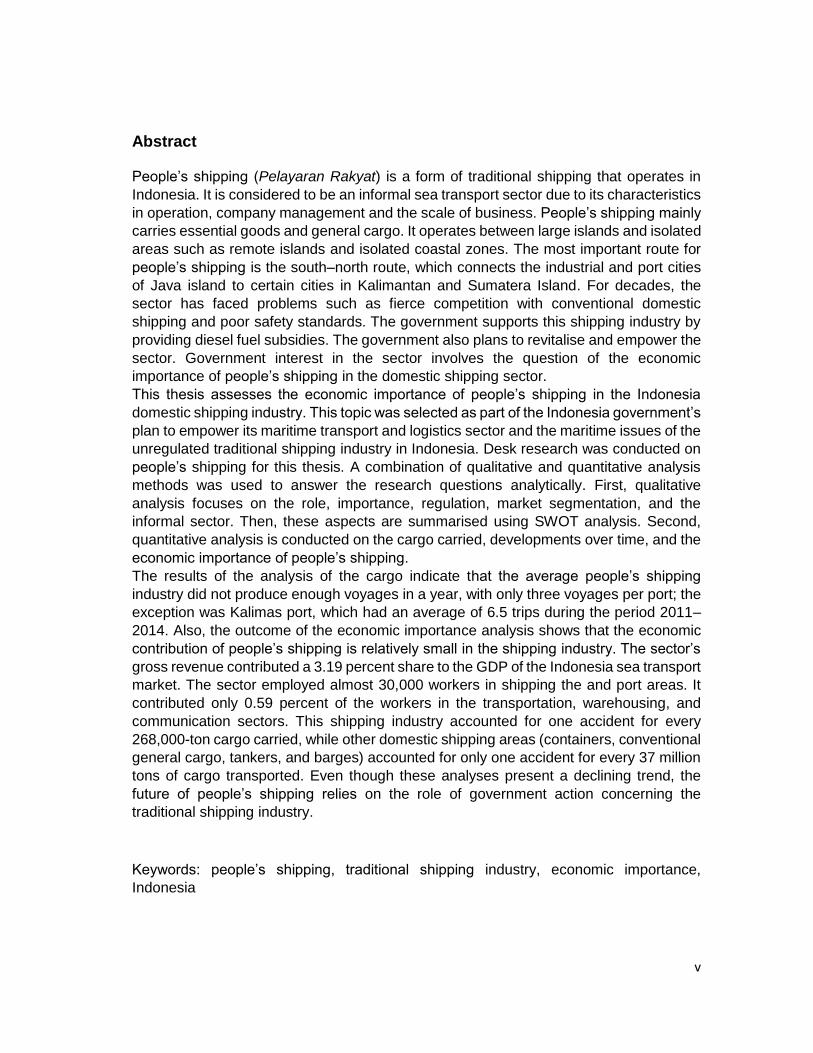
Abstract
People’s shipping (Pelayaran Rakyat) is a form of traditional shipping that operates in
Indonesia. It is considered to be an informal sea transport sector due to its characteristics
in operation, company management and the scale of business. People’s shipping mainly
carries essential goods and general cargo. It operates between large islands and isolated
areas such as remote islands and isolated coastal zones. The most important route for
people’s shipping is the south–north route, which connects the industrial and port cities
of Java island to certain cities in Kalimantan and Sumatera Island. For decades, the
sector has faced problems such as fierce competition with conventional domestic
shipping and poor safety standards. The government supports this shipping industry by
providing diesel fuel subsidies. The government also plans to revitalise and empower the
sector. Government interest in the sector involves the question of the economic
importance of people’s shipping in the domestic shipping sector.
This thesis assesses the economic importance of people’s shipping in the Indonesia
domestic shipping industry. This topic was selected as part of the Indonesia government’s
plan to empower its maritime transport and logistics sector and the maritime issues of the
unregulated traditional shipping industry in Indonesia. Desk research was conducted on
people’s shipping for this thesis. A combination of qualitative and quantitative analysis
methods was used to answer the research questions analytically. First, qualitative
analysis focuses on the role, importance, regulation, market segmentation, and the
informal sector. Then, these aspects are summarised using SWOT analysis. Second,
quantitative analysis is conducted on the cargo carried, developments over time, and the
economic importance of people’s shipping.
The results of the analysis of the cargo indicate that the average people’s shipping
industry did not produce enough voyages in a year, with only three voyages per port; the
exception was Kalimas port, which had an average of 6.5 trips during the period 2011–
2014. Also, the outcome of the economic importance analysis shows that the economic
contribution of people’s shipping is relatively small in the shipping industry. The sector’s
gross revenue contributed a 3.19 percent share to the GDP of the Indonesia sea transport
market. The sector employed almost 30,000 workers in shipping the and port areas. It
contributed only 0.59 percent of the workers in the transportation, warehousing, and
communication sectors. This shipping industry accounted for one accident for every
268,000-ton cargo carried, while other domestic shipping areas (containers, conventional
general cargo, tankers, and barges) accounted for only one accident for every 37 million
tons of cargo transported. Even though these analyses present a declining trend, the
future of people’s shipping relies on the role of government action concerning the
traditional shipping industry.
Keywords: people’s shipping, traditional shipping industry, economic importance,
Indonesia

vi

vii
Table of Contents
Acknowledgements ..................................................................................................... iii
Abstract ....................................................................................................................... v
Table of Contents ....................................................................................................... vii
List of Tables ............................................................................................................... xi
List of Figures ............................................................................................................ xii
List of Equation .......................................................................................................... xii
List of Abbreviation ................................................................................................... xiii
Chapter 1 Introduction ................................................................................................ 1
1.1. Background ..................................................................................................... 1
1.2. Research Question and Research Objectives ................................................. 2
1.3. Problem Identification ...................................................................................... 2
1.4. Research Design ............................................................................................. 3
Chapter 2 The Role of People’s Shipping .................................................................. 5
2.1. People’s shipping ............................................................................................ 5
2.2. Commodity of People’s Shipping ..................................................................... 8
2.3. The Development of People’s shipping ........................................................... 9
2.3.1. People’s shipping in the 1970s ................................................................. 9
2.3.2. People’s shipping in the 1980s ............................................................... 10
2.3.3. People’s shipping in the 1990s (1989-2000)........................................... 11
2.3.4. People’s shipping in 2001-2010 ............................................................. 12
2.3.5. People’s shipping in 2010-2015 ............................................................. 13
2.3.6. People’s shipping in 2016 ...................................................................... 14
Chapter 3 The Importance of People’s Shipping .................................................... 17
3.1. The Concept of Traditional shipping .............................................................. 17
3.2. Market Segmentation .................................................................................... 18
3.3. Value Added Potential ................................................................................... 20
3.4. Regulations ................................................................................................... 20
3.4.1. Introduction to The People’s Shipping Regulation .................................. 20
3.4.2. Regulation Concerning Technical and Safety Standard.......................... 22
3.4.3. Local Regulations................................................................................... 24
3.5. People’s Shipping and The Informal Economy .............................................. 24

viii
Chapter 4 Research Methodology and Data ............................................................ 27
4.1. Strengths- Weakness- Opportunities- Threats (SWOT) Matrix ...................... 27
4.2. The Cargo Carried People’s Shipping Sector ................................................ 28
4.3. The Developments Over Time of People’s Shipping ..................................... 29
4.4. Assessment of Economic Importance ........................................................... 29
4.4.1. Shipping Revenues ................................................................................ 29
4.4.2. Port Revenues ....................................................................................... 30
4.4.3. Employment ........................................................................................... 31
4.4.4. Income of Ship Crews and Stevedore .................................................... 32
4.4.5. Risk Comparison Analysis of People’s Shipping .................................... 33
Chapter 5 Data Analysis and Result ........................................................................ 35
5.1. SWOT Analysis of People’s Shipping ............................................................ 35
5.2. The Cargo Carried Analysis .......................................................................... 37
5.2.1. The Classification of Ports ...................................................................... 37
5.2.2. Production Area of The Main Commodities ............................................ 38
5.2.3. Port Origin and Destination .................................................................... 39
5.2.4. Cargo Calculation for Three Major Ports ................................................ 41
5.2.5. Cargo Calculation at National Level ....................................................... 43
5.3. Developments Over Time in People’s Shipping ............................................. 44
5.4. The Analysis of Economic Importance .......................................................... 47
5.4.1. Shipping Revenues ................................................................................ 47
5.4.2. Employment and Labour Income ............................................................ 52
5.4.3. Risk Comparison Analysis of People’s Shipping .................................... 53
Chapter 6 Conclusions and Recommendations ...................................................... 57
6.1. The Key Findings of People’s Shipping ......................................................... 57
6.2. The Recommendations ................................................................................. 58
6.3. The Limitation of This Study and Areas for Further Research ....................... 59
Bibliography .............................................................................................................. 61
Appendices ................................................................................................................ 67
Appendix 1. The List of The Vessel from People’s Shipping Union Kalimas ............. 67
Appendix 2. The List of Freight Rate from Major Routes and Inflation Rates of
Selected Years (2014,2015, and 2016). ................................................................... 68
Appendix 3. The Percentage of Share of Cost to Specific Freight Rate 2014 ........... 70
ix
Appendix 4. The List of and The Calculation Stevedoring Cost 2014 ....................... 71
Appendix 5. The List of and The Calculation of Ship Crew Salary 2014 ................... 72
Appendix 6. The Calculation of Revenue from Port Dues 2014 ................................ 74
Appendix 7. The Ship Cases from Indonesia Maritime Court 2014 .......................... 75
Appendix 8. The People’s Shipping Case from Indonesia Maritime Court ................ 80
Appendix 9. The Record of Ship Call from People Shipping Union (DPC PELRA)
Kalimas 2014 ........................................................................................................... 81

x

xi
List of Tables
Table 1. People's Shipping Commodity ................................................................................... 8
Table 2. People's Shipping at 1989-2000 .............................................................................. 12
Table 3. People's Shipping at 2001-2010 .............................................................................. 13
Table 4. People's Shipping at 2011-2015 .............................................................................. 14
Table 5. Sunda Kelapa and Kalimas Report 2015-2016 ..................................................... 14
Table 6. SWOT Analysis .......................................................................................................... 35
Table 7. Mapping of Main Economic Activities ..................................................................... 39
Table 8. Sunda Kelapa Cargo Calculation ............................................................................ 41
Table 9. Kalimas Surabaya Cargo Calculation ..................................................................... 42
Table 10. Paotere Makassar Cargo Calculation ................................................................... 42
Table 11. People's Shipping Cargo Calculation ................................................................... 43
Table 12. Development in Time of People's Shipping ......................................................... 44
Table 13. List Freight Rate from Major Routes ..................................................................... 48
Table 14. People’s Shipping Sector Revenue Calculations 2014 ..................................... 51
Table 15. Employment and labour Income 2014 .................................................................. 52
Table 16. Risk Comparison Analysis...................................................................................... 53
Table 17. Risk Rate per Cargo Carried .................................................................................. 55
Table 18. Ship Size Ratio from 50 Ships ............................................................................... 67
Table 19. Freight Rate List from Major Routes ..................................................................... 68
Table 20. Indonesia Inflation and Exchange Rate (USD to Rupiah) ................................. 69
Table 21. Cost Structure Analysis .......................................................................................... 70
Table 22. List Stevedoring Cost from Kalimas Port ............................................................. 71
Table 23. Stevedoring Cost Calculation Per Vessel Size ................................................... 71
Table 24. Crew Salary for 20-100 GT (Per Month) .............................................................. 72
Table 25. Crew Salary for 100-200 GT (Per Month) ............................................................ 72
Table 26. Crew Salary for 200-300 GT (Per Month) ............................................................ 73
Table 27. Port Dues Calculation ............................................................................................. 74
Table 28. Analysis of Conventional Cargo Shipping Accident 2014 ................................. 75
Table 29. Analysis of People's Shipping Accident 2014 ..................................................... 76
Table 30. Analysis of Container Shipping Accident 2014 ................................................... 76
Table 31. Analysis of Tanker Shipping Accident 2014 ........................................................ 77
Table 32. Analysis of Barge Shipping Accident 2014 .......................................................... 78
Table 33. Detail of People's Shipping Cases 2014 .............................................................. 80
Table 34. Record of Ship Call in Kalimas Port 2014 ............................................................ 81
xii
List of Figures
Figure 1. People’s shipping (PELRA) - Port of Sunda Kelapa ............................................. 1
Figure 2. Wooden Boats (Sailing Motor Boat) ........................................................................ 5
Figure 3. Wooden Boat (Motorised Boat) ................................................................................ 6
Figure 4. The Cargo Handling Operation of People's Shipping ........................................... 6
Figure 5. People's Shipping Route ........................................................................................... 7
Figure 6. Phinisi (Sailing Boat) at 1978 .................................................................................. 10
Figure 7. The Yearly Volume of Indonesia Inter-Islands Shipping at 1981 and 1984 .... 11
Figure 8. Five Factors Affecting People's Shipping ............................................................. 17
Figure 9. Three Factors Influence the People's Shipping Demand ................................... 19
Figure 10. Structure of Law in People’s shipping Sector .................................................... 21
Figure 11. People's Shipping Vessel as Non- Conventional Vessel ................................. 23
Figure 12. Example of Local Regulation Concerning People’s shipping .......................... 24
Figure 13. SWOT Analysis Steps ........................................................................................... 27
Figure 14. Share of Gross Regional Domestic Product (GRDP) ....................................... 38
Figure 15. Port of Destination List of Kalimas port for 2009-2013 ..................................... 40
Figure 16. Port of Origin List of Kalimas port for 2009-2013 .............................................. 40
Figure 17. The Percentage of Cost Structure ....................................................................... 47
Figure 18. The Radius Coverage of Selected Freight Rate ................................................ 50
List of Equation
Equation 1. Average GT of Vessel ......................................................................................... 28
Equation 2. Average Cargo Carried per Call ........................................................................ 28
Equation 3. Number of Trip Produced.................................................................................... 29
Equation 4. Total Revenue of The Sector ............................................................................. 30
Equation 5. Anchorage Revenue ............................................................................................ 30
Equation 6. Berth Revenue ...................................................................................................... 31
Equation 7. Wharfage Revenue .............................................................................................. 31
Equation 8. Employment of Ship Side.................................................................................... 31
Equation 9. Employment of Port Side .................................................................................... 32
Equation 10. Ship Crew Income.............................................................................................. 32
Equation 11. Stevedoring Income ........................................................................................... 32

xiii
List of Abbreviation
BKI Indonesia Classification Society/Register
BPS Indonesia Statistics Bureau
DPC People’s Shipping Union Branch
GRT Gross Register Tonnage
GT Gross Tonnage
GRDP Gross Regional Domestic Product
KLM Sailing Motor Vessel
KM Ministerial Decree
KNKT National Transportation Safety Commission
NCVS Non- Conventional Vessel Standard
PM Ministerial Decree
PP Government Regulation
Perpres Presidential Decree
PELRA People’s Shipping (Pelayaran Rakyat)
Perda Local Regulation
UU Law

xiv
1
Chapter 1 Introduction
1.1. Background
Indonesia is strongly dependent on its domestic seaborne trade due to its status as an archipelago country. Two-thirds of the population is concentrated on Java island, and the rest of the population spread out on the other large islands (Population Review, 2016). The problem that affects Indonesia is its weak domestic logistics systems due to the lack of port infrastructures. The majority of goods flow from Java island, especially industrial and essential commodities (barang pokok). The inter-islands trade activity involves several shipping services, one of which is people’s shipping.
According to Dick (1986), he identifies people’s shipping as shipping companies, mostly small family-owned companies, that operate wooden-hulled boats with a maximum capacity of 175 GRT. The types of the vessel are mostly Phinisi, which is famous as a traditional vessel. The focus of people’s shipping is to link the ports on the main island to the remote ports on other islands in Indonesia, such as Sumatera, Kalimantan, Maluku, and Papua(Dick, 1986).
He also introduces the concept that sailing prahu (people’s shipping) is more than basic traditional shipping. It has to capability to find and serve a market niche, especially within the geographic conditions of Indonesia, a country with many inhabited islands. It provides complimentary transportation to modern shipping. The idea of people’s shipping as a sign of backwardness does not fit its characteristics. He indicates that its flexibility to adapt represents a great example of small businesses in sea transportation (Dick, 1975).
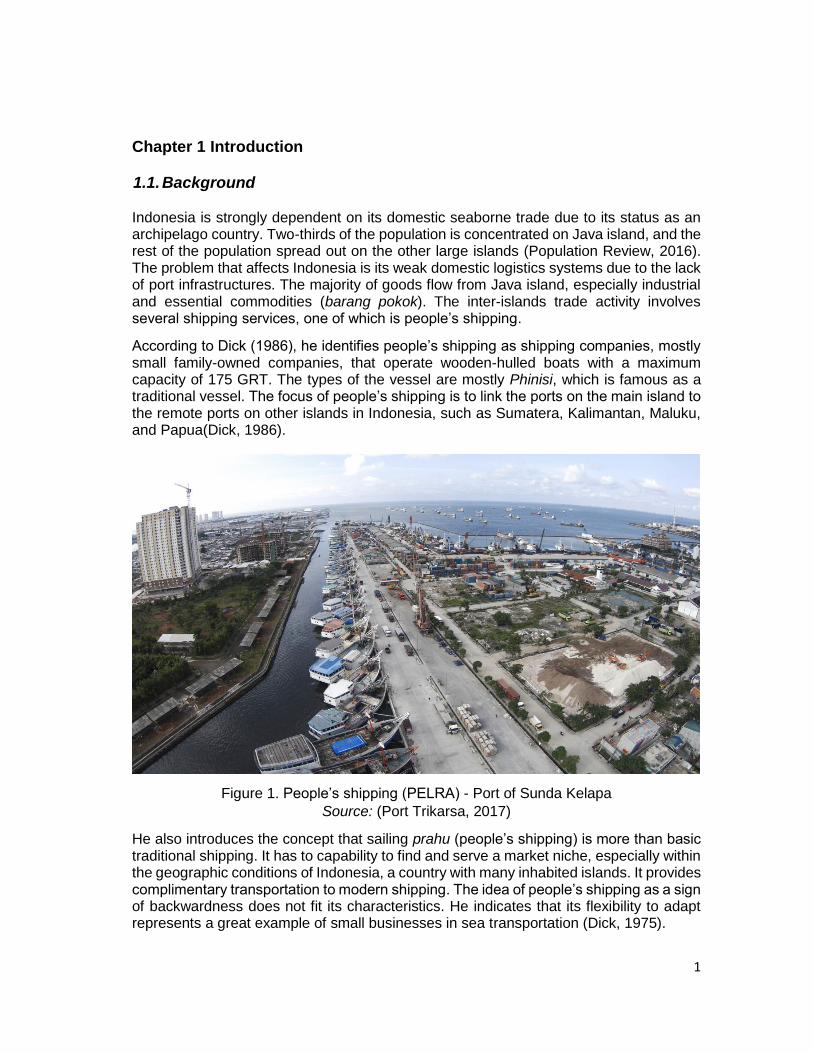
Figure 1. People’s shipping (PELRA) - Port of Sunda Kelapa
Source: (Port Trikarsa, 2017)

2
Moreover, people’s shipping can operate its fleets to the remote ports since it is independent of the port infrastructure, especially in terms of the draft limitations and low requirements for cargo handling facilities. However, it has some drawbacks, such as poor human resources and limited freight capacity. Stevedore workers are used for cargo handling activity at each port. This employs a lot of workers around the port and enhances the economic activity in small ports. The three principal ports are Sunda Kelapa in Jakarta, Paotere in Makassar, and Kalimas in Surabaya.
The study conducted by Karana (2003) explains the primary commodities of people’s shipping. The major products from Kalimantan, Sumatera, Sulawesi, and other small islands to Java are raw materials such as timber, agricultural products, and minerals. Then, the important cargoes from Java are cement, fertiliser, rice, and general cargo, most of which is produced in Java (Karana, 2003).
The people’s shipping industry is recognised as part of the national sea transportation system, which is protected by national shipping law (Shipping Law (UU) No.17, Indonesia, 2008). This maritime industry employs many workers in both voyage and cargo handling operations. There are many small inhabited islands in Indonesia that generate demand for transported goods, and, in some cases, only the people’s shipping fleet can satisfy this demand due to the small market size and geographic limitations. This contributes to the national economy in terms of employment and transportation services.
1.2. Research Question and Research Objectives
Based on the background, the research question is: ‘What is the economic importance of people’s shipping (PELRA) in Indonesia?’
The sub-research questions are intended to provide detail for the main research question:
1. What is people’s shipping (Pelayaran Rakyat)? 2. What is the role of people’s shipping in Indonesia’s inter-island trade? 3. What is the current state of people’s shipping in terms of operation, cargo
carried, regulation, and competitiveness? 4. What is the impact of people’s shipping on the revenue and employment of the
Indonesia’s domestic shipping industry?
The sub-objectives to be achieved in this thesis are:
1. To find the role of people’s shipping in Indonesia’s inter-island trade 2. To find the present position of people’s shipping in the domestic shipping sector 3. To find the economic importance of people’s shipping in the domestic shipping
industry
1.3. Problem Identification
People’s shipping has existed in Indonesia for a long time. In the beginning, people’s shipping accounted for a large proportion of the inter-island trade in Indonesia. There were an estimated 2,793 units of vessels in the people’s shipping industry in 1997

3
(Karana, 2003). Later, the role of conventional shipping increased following advances in the development of the regional maritime trade. It was expected that the appearance of the conventional cargo vessel will diminish the role of the people’s shipping sector in inter-island trade. After eight years, the number of vessels dropped to 1,371 in Indonesia in 2015 (Transportation, 2015). Surprisingly, people’s shipping survived the fierce competition even though the industry size reduced by half.
The logistic performance index (LPI) of Indonesia dropped from 53rd in 2014 to 63rd of 160 countries in 2016, which indicates the throw-back in national logistics system connectivity (World Bank, 2016). The need for proper and highly reliable transportation modes is a must for national economic development. The capability of people’s shipping to find a market niche, and its flexibility to serve many routes and isolated areas could be one of the solutions to empower inter-islands connectivity.
On the other hand, people’s shipping has shown an indigenous capability to adapt through the decades. The reason for this might be the nature of Indonesia’s geographic landscape as an archipelago, and also management concepts. There are many remote area/islands that rely on the logistical supply from the people’s shipping fleet. This means that people’s shipping is the economic engine in these regions. Nonetheless, there are many vessels that operate between the large islands and major cities, which obviously are not considered isolated areas. This raises the question about the market segmentation of people’s shipping.
Furthermore, the role of the government appears in the people’s shipping industry in two forms: the government subsidy programme and the establishment of regulation. The government continuously subsidises the sector through a diesel fuel subsidy programme. It will reduce the operation costs in the shipping operator. Regarding regulation, the Indonesian government has already established rules that control the quality of the service of people’s shipping such as safety and route plans. Effective regulation is needed to enhance the development of people’s shipping. This will encourage people’s shipping to be more competitive because of its capability to enter the small islands across the Indonesian archipelago, while, at the same time, questions on the importance of people’s shipping will arise.
Two methods of analysis will be used to explore the research question. First, qualitative analysis will focus on the aspects of the role, importance, regulation, market segmentation, and informal economy of people’s shipping. These aspects will be summarised using SWOT analysis. Second, quantitative analysis will be conducted on the cargo, developments over time, and the economic importance of people’s shipping.
1.4. Research Design
A combination of both qualitative and quantitative analysis methods will be used to answer the sub-research questions. Chapter 2 will focus on the literature analysis (qualitative analysis) of the people’s shipping industry. The role of people’s shipping in inter-island trade needs to be explained explicitly by the researcher. This will be described comprehensively through the development of the people’s shipping sector from its beginnings in the 1970s to its current form in 2016.

4
In Chapter 3, the factors affecting people’s shipping will be addressed to show its significance in inter-islands trade. It combined with the analysis of transport demand source to determine market segmentation. Moreover, the researcher needs to understand the policies in the people’s shipping industry, such as government policy for operations, routes, and the safety standards of the vessels.
Furthermore, in Chapter 4, there will be an explanation of the methodology. The thesis will use both qualitative and quantitative methods to answer the sub-research questions. This research design section will be structured as follows to answer the research questions: The first method is the SWOT analysis, which focuses on four factors (strengths, weaknesses, opportunities, and threats) of the industry. Then, the cargo traffic and economic importance will be analysed; these consist of shipping revenues, employment, income of ship crews and stevedores, and safety. Safety will be assessed through the risk rate per cargo carried.
Next, at the beginning of Chapter 5, the SWOT analysis will be used to determine the position of people’s shipping in the maritime transport sector. Since traditional shipping is already facing the modern era with its advanced technology and information, it is encountering fierce competition from other domestic shipping sectors, especially conventional cargo shipping. Moreover, the calculation of the cargo carried by people’s shipping will result in a figure for the yearly cargo carried and the trips produced. This will consist of cargo carried analysis at the selected ports and the national level. The analysis of developments over time will be conducted to assess how people’s shipping has adapted over time. Finally, shipping revenues, employment, income of ship crews and stevedores, and safety will be calculated to determine the economic importance of the sector in the shipping industry.
The last chapter will describe the significant key findings of both analysis methods regarding the importance and value of the economy of people’s shipping in the Indonesian maritime industry. Then, essential recommendations for the government regarding the future of the people’s shipping industry will be given.

5
Chapter 2 The Role of People’s Shipping
2.1. People’s shipping
PELRA (Pelayaran Rakyat) or people’s shipping1 is one of the forms of traditional
shipping that exists in Indonesia. People’s shipping has been used as a primary
transportation method for inter-island trade for a long time. It operates to connect many
large islands as well as isolated areas such as small islands and isolated coastal areas
in Indonesia. People’s shipping is used to transport agriculture, food, and livestock. It is
also used to transport passengers from small islands with limited capacity (Karana,
2003).
Source: Author adopted from Triantoro (2015)
The type of vessel is easily noticed in people's shipping. Most of the ships in this sector
are wooden-hulled vessels ranging in size from 20 GT to 500 GT. According to UU No.
17 of 2008, there are three types of vessel: the sailing boat (Prahu), the sailing motor
boat (KLM), and the motor boat (KM). The sailing boat is the basic traditional boat that is
dependent on the wind current; the sailing motor boat uses a marine diesel engine as its
secondary propulsion. Practically, the ship operator prefer to use the diesel engine during
the operation instead of utilize the wind current. So, the sail and mast in sailing motor
1 The term ‘people’s shipping’ originated from the article written by Dick (1975), ‘Prahu Shipping in Eastern
Indonesia’. Part 1, Bulletin of Indonesian Economic Studies, 11(2), 69–107. doi:
10.1080/00074917512331332712.
Figure 2. Wooden Boats (Sailing Motor Boat)
6
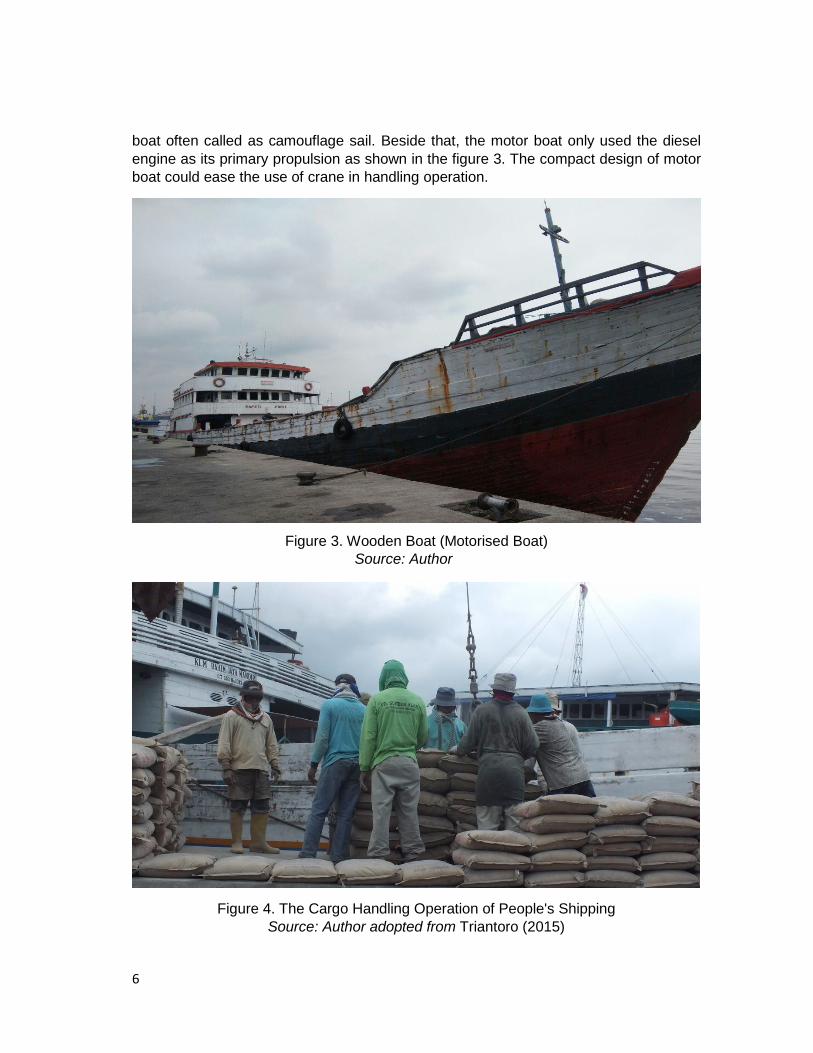
boat often called as camouflage sail. Beside that, the motor boat only used the diesel
engine as its primary propulsion as shown in the figure 3. The compact design of motor
boat could ease the use of crane in handling operation.
Source: Author
Figure 3. Wooden Boat (Motorised Boat)
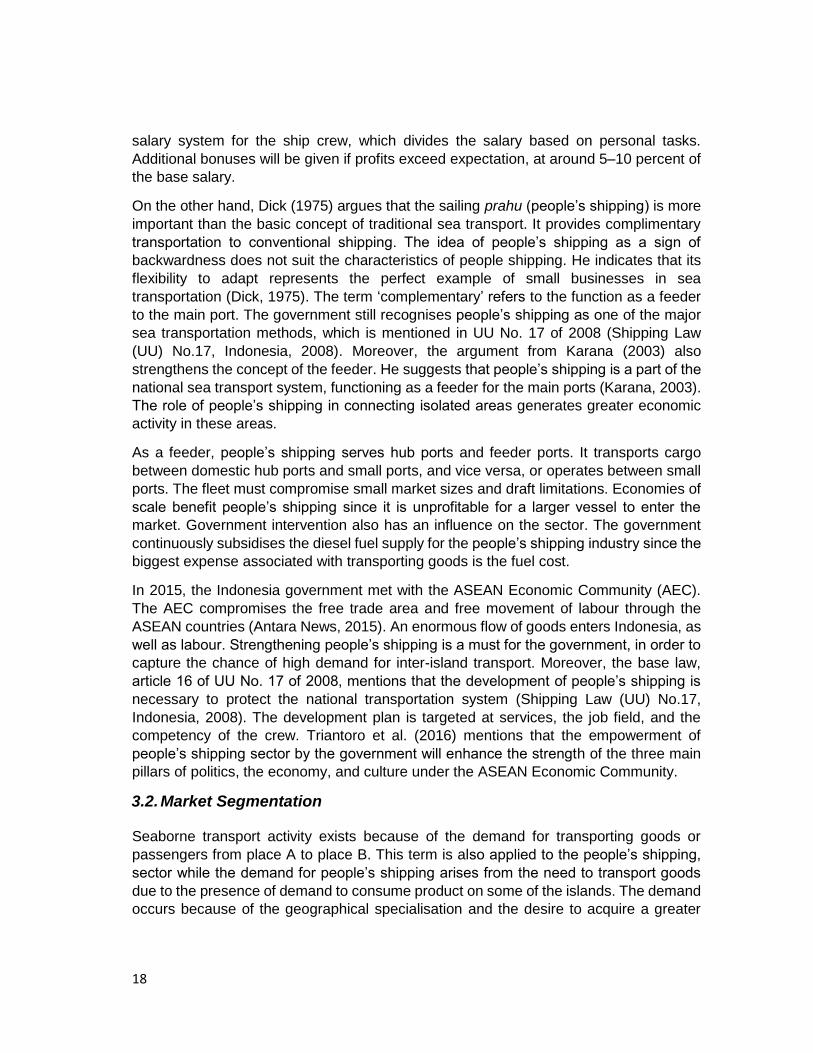
Figure 4. The Cargo Handling Operation of People's Shipping
Source: Author adopted from Triantoro (2015)

7
The industry uses the stevedore, or kuli panggul, for unloading and loading the cargo.
The requirement of the stevedore varies depending to the vessel size and the cargo
volume. Figure 4 shows that the traditional handling is often combined with the crane for
certain heavy commodities, such as packs of timber and bags of cement.
Historically, people’s shipping has operated across the Indonesian archipelago. It
connects the major islands and the small islands in between. The traffic of goods is
dominated by specialised ports for people’s shipping on Java island. The flow of cargo
entering Java is mainly raw materials and agricultural products, while the cargo from Java
is cement, fertiliser, and intermediate or final products that are recognised as general
cargo (Karana, 2003). Figure 5 illustrates the map of the people’s shipping routes. Based
on this map, there is 33 ports, spanning from the western region into the eastern region
of Indonesia. In the case of Kalimas and Sunda Kelapa, these ports are organised as
dedicated terminals under the main ports, which are Tanjung Perak and Tanjung Priok.
However, since the operation of people’s shipping is flexible, it also serves some non-
commercial ports.
According to the map, it is likely that the most important route is the south–north route,
rather than the west–east route. The south–north route is essential because it connects
the industrial cities on Java island to certain cities in Kalimantan island. Some of the
towns in Kalimantan are located by the river or the river delta, such as Pangkalan Bun,
Sampit, and Banjarmasin. Vessels from Kalimas port carry essential goods (barang
pokok) to these cities, and vice versa. The people’s shipping fleet from Sunda Kelapa
port, Jakarta, serves some cities in Sumatera island also located close to the river, such
as Palembang and some of the islands in the Riau archipelago. The geographical
conditions are a benefit for people’s shipping due to its capability to sail in limited draft
and serve small market demand. Nevertheless, the number of vessel in the people’s
Figure 5. People's Shipping Route
Source: Author adopted from KNKT (2009)

8
shipping fleet is tending to decrease. This is resulting is an absence of the fleet in some
dedicated ports.
In the modern era, people’s shipping is identified as short-sea transport, and is often
managed by a family or a company as the owner that focuses on logistic and sea
transportation. It has limited coverage of services since wooden-type motor boats are
used that are not suitable as ocean going vessels. They mostly serve non-fixed routes or
act as tramper shipping even though some of the bigger people’s shipping companies
often provide fixed routes, though the number is still limited (Triantoro, 2015). Tramper
shipping often results in long stays in port, depending on the demand fluctuation. This
can lead to adverse effects as the number of voyages per year will be small, and the
schedule will be unpredictable for the customercustomer.
2.2. Commodity of People’s Shipping
The products in the people’s shipping sector are identified as general cargo goods. Cargo
is carried in several packages depending on the nature of the product. The kinds of
commodity in people’s shipping tend to change over time. Mostly, alterations in the cargo
type are a result of competition from other domestic shipping companies. During the
1990s, the primary commodity of people’s shipping was timber, which was produced in
Borneo and Sumatera island. At the beginning of the 2000s, people’s shipping faced stiff
competition from the barge fleet since this was capable of sailing to the timber production
sites upriver and carrying larger volumes of cargo (Karana, 2003). According to reports
from the three main ports, particular kinds of goods dominate the cargo transport volume
of people’s shipping. The commodities transported by people’s shipping are mainly
essential goods (barang pokok), as shown in Table 1. The dominant cargos are fertiliser,
cement, sugar, flour, rice, and livestock fodder. Most of the consignment is packaged in
bags and cardboard boxes, while some of the raw commodities, such as timber, wooden
processed products, and steel, are carried without packaging (Prasetyo, 2017).
Table 1. People's Shipping Commodity
Type of Commodities Package Type of Commodities Package
Fertilizer Bag Wood Product* No package
Cement Bag Timber* No package
Sugar Bag Vegetable Bag
Flour Bag Orange Bag
Rice Bag Dangerous goods -
Livestock fodder Bag Non-Fuel Drum
Chocolate Bag Construction Sand No package
Bean Bag Red onion Bag
Steel product No package Sea Salt Bag
Electronics Carton Box Other General Cargo -
Shrimp and Fish Paste Carton Box

9
Source: Author elaboration adopted from Sunda Kelapa (2016), Kalimas (2015), and
Prattyni (2016)
Most of the primary commodities are produced in the industrial sector in Java, while there
are specific cargoes such as logs from Kalimantan and cement produced in South
Sulawesi. Reports from two major ports, Sunda Kelapa (2016) and Kalimas (2015),
indicate that the cargo traffic is dominated by the cargo outflow from Java, and is three
times larger than goods entering Java island. These conditions also apply to the cargo
movement in Paotere port, Makassar, where the cargo throughput is not balanced
(Prattyni, 2016).
2.3. The Development of People’s shipping
Analysis of the development of the people’s shipping sector through the decades shows
that it started in the 1970s, until 2016. It has been influenced by several factors, such as
regulation, politics, economic events, and competition.
2.3.1. People’s shipping in the 1970s
According to Government Regulation No. 2 of 1969, inter-island shipping in the 1970s was divided into five sectors distinguished by type of operation, nature of employment, and type of vessel. These areas are: liner shipping (regular liner service), local shipping, prahu shipping (people’s shipping), specialised shipping (bulk), and tug (barge) (Dick, 1986). Based on these criteria, the people’s shipping sector has been distinguished from other sectors by the type of vessel, operation, and nature of employment. This industry can be easily noticed by the wooden-hulled sailing vessels, easily distinguishable from conventional vessels.
Starting in 1972, people’s shipping faced the era of motorisation. The traditional sailing vessel was traded for the sailing motor boat, or kapal layar motor (KLM) (Sunaryo, 2010). Before the motorisation era began, prahu shipping was seen as traditional shipping with sailing wooden-hulled boats, or Phinisi, and others such as the Lete-Lete, the Lambo and the Nade. Figure 6 shows a Phinisi ship loaded with timber at 1978; an important inter-island commodity. After 1979, the motorization changed the shape of the Phinisi (sailing boat) fleet rapidly. Almost all the Phinisi fleet in Sunda Kelapa port used the motor engine as its propulsion (Veldman, 1990). The result was the role of people’s shipping intersecting with the wooden boats from local shipping that served regular routes as a feeder. Moreover, the change of the propulsion type reduced dependency on the wind current. The main propulsion is a diesel engine, and the sailing screen functioned as camouflage as shown in the figure 2.
People’s shipping mainly served as dry bulk carriers, with timber as a primary commodity.
This type of commodity became prevalent in the sector because the large islands, such
as Kalimantan and Sulawesi, are major suppliers of raw materials such as timber. The
major industrial sectors are located in Java, particularly the paper pulp industry, which
needs huge supplies of logs and timber. According to data from the study by Dick (1975),
the total volume of wood accounted for in Java’s major prahu shipping ports was 524,200

10
tons in 1972. However, in this era, people’s shipping also encountered stiff competition
from specialised dry bulk shipping such as barges (Dick, 1975).
Dick (1986) argues that the role of people’s shipping was estimated to be stronger
because of the flexibility of services. This sector was conducted as a tramper or liner
service due to its unspecified function as stated in government regulations. It seems that
the government tried to keep the sector as the traditional sector. However, the lack of
policy had an adverse effect on the industry. Regulation is a base for further development
and recognition from the government perspective.
2.3.2. People’s shipping in the 1980s
The role of people’s shipping expanded in the 1980s since the fleet could serve longer
distances than local shipping because of fleet motorisation. There was no limited area
Figure 6. Phinisi (Sailing Boat) at 1978
Source: Author adopted from Veldman (1990)

11
coverage for people’s shipping operations. The maximum limit of service area for local
shipping is 200 miles (Dick, 1986). This benefited prahu shipping, as companies could
seek new market niches.
Figure 7. The Yearly Volume of Indonesia Inter-Islands Shipping at 1981 and 1984
Source: Author elaboration adopted from Dick (1986) and Veldman (1990).
In 1981, this sector accounted for 14.3 percent or 2,17 million tons of inter-island dry
cargo flows as part of the major shipping sector in national seaborne trade. Routes were
concentrated around Java, Southern Sumatera, Kalimantan, and Sulawesi. In 1984,
surprisingly, the yearly cargo volume of people’s shipping increased even while facing
fierce competition from tugs/barges at the same time. The share of people’s shipping in
the national seaborne trade sector was 23.6 percent or 2,87 million tons. This percentage
increased due to the boom in the mining sector. The people’s shipping fleet had a total
of 3,777 ships consisting of sailing boat, motorised sailing boat, and small motor boats.
This booming event also increased the cargo transported by barge sector, as barges also
offered flexibility in carrying dry bulk commodities. The barge sector accounted for a total
share of 25.5 percent of national seaborne trade in the same year (Veldman, 1990). This
percentage resulted from various commodities from as forestry (timber) and mining
industries.
2.3.3. People’s shipping in the 1990s (1989-2000)
During this period, the total cargo capacity carried by people’s shipping increased
enormously. According to Jinca (2001), the people’s shipping sector saw peak popularity
with a total share of national inter-island trade of 16–24 percent. This vast improvement
was caused by the large fleet in people’s shipping compared to other types of shipping.
However, there was a small growth in the fleet, with a total of 2,789 vessels in 1989 and
3,705
2,386
2,178
3,936
3,054
3,198
1,763
2,876
4,276
3,115
0 500 1,000 1,500 2,000 2,500 3,000 3,500 4,000 4,500
Liner
Local Shipping
People Shipping
Bulk Shipping
Tug/barge
Cargo Traffic ( 1000 Ton)
Inter-island Shipping at 1984 Inter-island Shipping at 1981

12
2,793 vessels in 1996. The slow growth of the fleet size indicates that expansion trends
were slowing down.
Table 2. People's Shipping at 1989-2000
Year Fleet (unit) Volume (1000 ton) Company
1989 2,789 - -
1996 2,793 8,327 652
1997 2,793 8,582 678
1998 - 5,181 -
1999 - 6,740 -
2000 - 7,261 -
Source: Author elaboration adopted from Karana (2003)
There was a significant event in the political sector during 1996–1999. The economic
crisis of 1998 affected industry stability. Beginning in 1999, with a new leader, the
government started to restructure the commercial sector in order to stabilise the country.
In 2001, the government created Ministerial Decree (KM) No. 33 of 2001 to regulate
shipping operations.
On the other hand, Karana (2003) argues that the reason behind the growth was the
tendency of cargo owners to choose shipping that could offer on time and fast delivery.
The cargo owner also pays attention to the safety of the cargo during the trip and at sea,
which cannot be fulfilled by people’s shipping due to the poor quality of the vessel. Even
though shipping often provides insurance for the cargo, the liability coverage is low,
otherwise the insurance would be costly. Also, the significant number of foreign vessels
coming into Indonesia had a total share of 18.4 percent in 1990, with this sector still
growing (JICA, 2003). This contributed to the high level of competition and the decline in
demand for people’s shipping.
2.3.4. People’s shipping in 2001-2010
From 2000, people’s shipping experienced significant changes, specifically in the
operation side. According to Karana (2003), the government allowed the shipping
company to act as the forwarder or agent. This decision led to the number of shipping
companies increasing to 760 one year later, compared to 678 at the end of the 1990s
(JICA, 2003). The people’s shipping industry accounted for a total 7.261 million tons of
cargo traffic in 2000. This volume had been fluctuating since the 1990s; the unstable
political conditions could be a reason for the improvement in this sector. However, a
report from (JICA, 2003) mentioned that, even though the domestic cargo volume was
large for the PELRA sector, this sector only accounted for a share of 4–5 percent of total
inter-island domestic trade. The small percentage of freight traffic showed a setback for
PELRA development. Unfortunately, detailed data on the cargo carried by people’s
shipping during this period is not available. The Central Bureau of Statistics of Indonesia
(BPS) only provides data on the vessel quantity and the companycompany.

13
Table 3. People's Shipping at 2001-2010
Year Fleet (unit) Company
2001 - 760
2002 3,000 -
2003 - -
2004 1,229 441
2005 1,376 485
2006 1,232 507
2007 1,279 560
2008 1,287 583
2009 1,293 595
2010 1,293 632
Source: Author elaboration adopted from Karana (2003), Transportation (2008) and
Transportation (2010).
During 2000–2005, there were significant changes in fleet and company quantity. The
number of vessels fell significantly in 2004, as well as the number of companies. The
government established Ministerial Decree (KM) No. 33 of 2001, which regulates the
operation of the shipping industry, including people’s shipping. The regulation came was
enforced for around three years. Article 33 (1) states that the operator of domestic sea
transport, including people’s shipping, shall give the voyage plan and schedule at each
port. Another clause, article 36 (3), indicates that the operator of national shipping must
report the route plan to the Dirjen Hubla or General Director of Sea Transportation
(Operation of Sea Transport Regulations, Ministerial Decree (KM) No.33, Indonesia,
2001). Moreover, the regulation also states that any shipping operator that fails to comply
with the rules will have their permit revoked by the government. The enforcement of this
new law had an impact on the operators of people’s shipping, as well as the whole of the
shipping industry, which explains the fleet reductions. However, due to the different data
sources, there is a possibility of unmatched data.
Beginning in 2006, the people’s shipping sector faced a stable growth period. The
average growth rate for vessel quantity was 0.8 percent, while the yearly growth rate for
company numbers was 3.8 percent as shown in the table 3. This stagnancy could be a
result of the industry adapting to the enforcement of regulation. In addition, the
establishment of UU No. 17 of 2008 regarding shipping industry played a significant role.
The existence of a stricter law proves that the government was paying more attention to
the maritime transport sector.
2.3.5. People’s shipping in 2010-2015
The stagnancy of the fleet and companies continued during 2010–2015. The people’s
shipping industry faced difficulty in expanding its business. Statistics shows that the
number of boats in the fleet accounted for an average of 1,300 over five years of
operation. The problem arose in the shipbuilding and ship maintenance industry. The

14
illegal logging issue resulted in a lack of raw materials for local shipyards. According to
Triantoro (2015), the slow growth rate in the people’s shipping industry was a result of
the rare and expensive prices of Ulin wood as a popular type of ship-building material.
The government implemented strict controls for the forestry industry to reduce the illegal
logging rate.
Table 4. People's Shipping at 2011-2015
Year Fleet (unit) Company
2011 1,314 651
2012 1,329 664
2013 1,340 647
2014 1,357 653
2015 1,371 657
Source: Author elaboration adopted from Transportation (2015)
On the other hand, Sunaryo (2010) argues that new building, as well as the existing fleet,
could not be regulated under the classification rules. This was because of the absence
of design and construction standards for wooden-hulled vessels. As a result, insurers
could not provide cargo insurance for people’s shipping activity (Sunaryo, 2010). Also,
non-standard vessels and strict wood regulations had a significant impact on the weak
industry. Even though the people’s shipping sector had the benefit of flexibility in terms
of operation (tramper or liner), the lack of knowledge about the new regulation disrupted
shipping operations. A lot of people’s shipping vessels faced a problem by the port state
control (flag state), especially concerning the docking schedule regulation for the non-
class vessel (Jinca, et al., 2013).
2.3.6. People’s shipping in 2016
There is a small amount of shipping data to explain the people’s shipping sector in 2016.
Unfortunately, the data from Paotere Makassar port ends at 2014, and there is no data
available for 2015 and 2016. According to the data from Kalimas port, the number of
people’s shipping vessels calling at the port increased from the previous year. In contrast
with the number of calls, the cargo throughput volume declined from the previous year,
as shown in Table 5.
Table 5. Sunda Kelapa and Kalimas Report 2015-2016
Sunda Kelapa Kalimas
Year 2015 2016 2015 2016 Unit
Call 1,109 459 363 448 Ship
GT 244,908 105,030 47,394 59,083 GT
Total Cargo Throughput 608,566 264,057 836,415 787,028 Ton
Source: Author elaboration adopted from Sunda Kelapa Kalibaru (2017) and Port of
Tanjung Perak (2017)

15
On the other hand, the report from Sunda Kelapa port shows an enormous change in
both calling and cargo volume. The number of calls dropped to half in 2016 from 2015,
followed by the fell of cargo throughput. However, there was no accurate explanation for
the downward trend at Sunda Kelapa port in 2015–2016. The decline in transport demand
and fierce competition might also be possible causes of the declining trend.

16

17
Chapter 3 The Importance of People’s Shipping
3.1. The Concept of Traditional shipping
The people’s shipping industry has seen a stable trend regarding the number of vessels
and companies. The only significant changes occurred in 2002–2004 when the number
of vessels dropped significantly. This condition raises questions about the existence and
the importance of the people’s shipping industry, especially from the government side.
Culture is naturally attached to people’s shipping. Malisan et al. (2012) explain that
traditional sea transport (people’s shipping) is part of a maritime culture that plays a major
role in transporting goods through the Indonesian archipelago. It comprises national
cultural values, as indicated by the management concept and vessel type (Malisan, et
al., 2012). The typical vessel design for people’s shipping is the Phinisi. It originated from
the Bugis tribe on Sulawesi island. The Phinisi is a famous type of traditional vessel that
is capable of sailing on the ocean (Dick, 1975).
The concept of the traditional shipping is also shown in the management and operational
side. People’s shipping enterprises are commonly owned by small, family-run companies.
Triantoro (2015) explains that the management team consists of the simple commercial
department and the owner. The tariff for transporting cargo varies from other shipping
companies, which often leads to price competition. This contrasts to conventional
shipping liners, which create cartel to control freight rates. However, on the operational
side, the relationship between master and crew is close. The master divides the profits
from the vessel using a one-third theorem. The owner will gain one-third of the profits,
another one-third is allocated to voyage costs and the rest is divided among the crew
(Triantoro, 2015). However, some shipping companies have already implemented a
Figure 8. Five Factors Affecting People's Shipping
Source: Author’s elaboration
18
salary system for the ship crew, which divides the salary based on personal tasks.
Additional bonuses will be given if profits exceed expectation, at around 5–10 percent of
the base salary.
On the other hand, Dick (1975) argues that the sailing prahu (people’s shipping) is more
important than the basic concept of traditional sea transport. It provides complimentary
transportation to conventional shipping. The idea of people’s shipping as a sign of
backwardness does not suit the characteristics of people shipping. He indicates that its
flexibility to adapt represents the perfect example of small businesses in sea
transportation (Dick, 1975). The term ‘complementary’ refers to the function as a feeder
to the main port. The government still recognises people’s shipping as one of the major
sea transportation methods, which is mentioned in UU No. 17 of 2008 (Shipping Law
(UU) No.17, Indonesia, 2008). Moreover, the argument from Karana (2003) also
strengthens the concept of the feeder. He suggests that people’s shipping is a part of the
national sea transport system, functioning as a feeder for the main ports (Karana, 2003).
The role of people’s shipping in connecting isolated areas generates greater economic
activity in these areas.
As a feeder, people’s shipping serves hub ports and feeder ports. It transports cargo
between domestic hub ports and small ports, and vice versa, or operates between small
ports. The fleet must compromise small market sizes and draft limitations. Economies of
scale benefit people’s shipping since it is unprofitable for a larger vessel to enter the
market. Government intervention also has an influence on the sector. The government
continuously subsidises the diesel fuel supply for the people’s shipping industry since the
biggest expense associated with transporting goods is the fuel cost.
In 2015, the Indonesia government met with the ASEAN Economic Community (AEC).
The AEC compromises the free trade area and free movement of labour through the
ASEAN countries (Antara News, 2015). An enormous flow of goods enters Indonesia, as
well as labour. Strengthening people’s shipping is a must for the government, in order to
capture the chance of high demand for inter-island transport. Moreover, the base law,
article 16 of UU No. 17 of 2008, mentions that the development of people’s shipping is
necessary to protect the national transportation system (Shipping Law (UU) No.17,
Indonesia, 2008). The development plan is targeted at services, the job field, and the
competency of the crew. Triantoro et al. (2016) mentions that the empowerment of
people’s shipping sector by the government will enhance the strength of the three main
pillars of politics, the economy, and culture under the ASEAN Economic Community.
3.2. Market Segmentation
Seaborne transport activity exists because of the demand for transporting goods or
passengers from place A to place B. This term is also applied to the people’s shipping,
sector while the demand for people’s shipping arises from the need to transport goods
due to the presence of demand to consume product on some of the islands. The demand
occurs because of the geographical specialisation and the desire to acquire a greater

19
choice of goods. So, the demand for people’s shipping is determined as derived demand
(Coyle, et al., 2011).
Source: Author’s Elaboration
The concept of derived demand in shipping links to the source of the transport demand
analysis. In people’s shipping industry, there are certain factors that influence the
transport demand, as shown in Figure 5. These consist of three possible demand sources
for this sector. The low price and quality of services associated with the demand from
lower-class society. The income parameters and budget constraints are the determinant
factors for choosing this transport mode. Large hub ports, such as Sunda Kelapa and
Kalimas, are located near suburban areas, areas accessible to local immigrants and
small industrial areas. The freight cost is considered a low price that is affordable for the
low-income people. Further detail on freight rate is analysed in section 5.3.1, shipping
revenues.
One of the characteristics of people’s shipping is that it is also complementary to the
larger shipping sector. The unmatched demand for transporting goods and the supply of
bigger shipping results in excess capacity. The excess capacity originates from the
demand that cannot be satisfied by larger vessels due to the unprofitable market size and
draft limitations. Since the people’s shipping fleet has vessel sizes up to 500 GT, the
demand can be satisfied economically.
The geographical specialisation creates demand for seaborne transport, demand
between large islands, to remote places such as the small islands and isolated coastal
areas of Sumatera and Kalimantan2. For example, the demand for timber as a valuable
raw material for the paper industry and civil construction in Java. The forestry sector is
2 Due to extensive road construction and port developments, this role in isolated areas is decreasing.
Figure 9. Three Factors Influence the People's Shipping Demand

20
commonly located in Kalimantan, Sulawesi, and Sumatera island (Karana, 2003).
Another example is the demand for rice and flour from the Kangean islands, a group of
small islands in the Java Sea. For a small island, the demand for flour and rice comes
from the people who live there. Most of the island’s residents work as a fisherman, so
rice and wheat plantations are rare.
According to the annual report for 2015 from Sunda Kelapa port, one of the leading
specialised ports for people’s shipping, the inflow of goods in the people’s shipping sector
is dominated by logs, cement, sand, oil products, and quartz sand, with a total volume of
597,479 tons. The outflow is fertiliser, cement, rice, flours, coarse foods, steel, and
electronics, with total volume 1,585,717 tons (Sunda Kelapa , 2016). Furthermore,
another significant specialised port, Kalimas, saw a similar trend in people’s shipping
cargo traffic. The total discharge volume was 168,427 tons, while the cargo outflow was
619,842 tons in 2015 (Kalimas, 2015). These data show the unbalanced amounts of
discharge and load of cargo at both ports. The huge gap is determined as the cargo traffic
unbalance between Java and other islands. One of the reasons for this is that the
government has implemented strict regulations on logging, which is a primary commodity
for the people’s shipping industry. The law aims to prevent deforestation in Kalimantan
and Sumatera island (Sunaryo, 2010).
3.3. Value Added Potential
The people’s shipping industry generates value added to maritime transport. It provides
a transport service for general cargo. The main commodities are cement, food, and
essential goods for living, as explained in section 2.2. Essential goods dominate the cargo
carried by people’s shipping. The traditional shipping service mainly targets niche
markets that cannot be served by conventional shipping. The major reasons for this are
geographical location and market size. The sector has significant value in logistics in
terms of connecting isolated areas.
The dedicated port for people’s shipping is identified as the general cargo port. According
to the port reform toolkit from the World Bank, containerised and general cargoes tend to
have the highest value-added services potential (World Bank, 2007). People’s shipping
handling operations consist of warehousing, loading, and unloading by crane and
stevedoring. Cargo handling activity involves a significant amount of handling companies
in the port. Due to the characteristics of the vessels and the goods packages, manual
handling by workers is still necessary. The workers work as a group based on the ship
size and cargo characteristics. A small group consists of eight employees; a medium
group has 12 persons; a large group has 15 people.
3.4. Regulations
3.4.1. Introduction to The People’s Shipping Regulation
The laws and regulations concerning people’s shipping in Indonesia are created as
Laws/Acts. The latest Law/Act for the maritime transport sector is UU No.17 of 2008

21
regarding shipping. According to this law, the people’s shipping sector is separated from
domestic sea transportation. Article 15 (1) of UU No.17 of 2008 states that ‘People’s
shipping is a traditional shipping enterprise and a part of water transport activity that has
an important role and specific characteristics’. The second clause of article 15 explains
the provisions of people’s shipping such as the nationality, flag state, and seaworthiness.
It indicates that people’s shipping is recognised by law as a traditional type of shipping
and must operate under the Indonesia flag (Shipping Law (UU) No.17, Indonesia, 2008).
Moreover, in article 16, the government includes people’s shipping as part of the national
transportation system and addresses that its operation will be further regulated by
government regulation (PP).
Regulation concerning the people’s shipping sector in Indonesia is structured from the
top down. The regulation framework is presented below:
:
Figure 10. Structure of Law in People’s shipping Sector
Source: Author’s elaborations of various sources
According to article 28, only two people can issue a business permit for people’s shipping.
First, a city or district mayor for shipping who operates across the district ports. Then, a
governor for shipping, who runs on domestic ports and international ports. Further
provision of the business license is regulated under local regulation.
Furthermore, as stated in article 17 of UU No.17 of 2008, another law, a government
regulation (PP), will regulate specific provisions concerning the people’s shipping sector.
Government regulation (PP) No. 20 of 2010 explains the characteristics of the vessel,
operation, cargo, and the structure of the enterprise. However, there is old law,
Law : UU No. 17 about Shipping of 2008
Government Regulation : PP No.20 of 2010
Presidential Decree : Perpres No.5 of 2005
Ministerial Decree : KM No. 65 of 2009
PM No. 93 of 2013
PM No. 69 of 2015
PM No. 20 of 2015
Regulation Concerning Technical and Safety Standard : Non Convention Vessel Standard
Indonesian Flagged (NCVS)
Indonesia Coast Guard Safety Regulation : Specific Regulation for Shipping Safety and
Security of 2009 (Bakorkamla)Local Regulation

22
Presidential Decree No 5 of 2005, which instructs all the stakeholders in the shipping
industry to implement the cabotage rule. Cabotage addresses the obligation to use local
components for the shipyard, domestic crew for national shipping, and government
incentives in the maritime transport sector (Empowerment of the national shipping
industry, Presidential Decree (Perpres) No.5, Indonesia, 2005). In 2009, this regulation
triggered an additional law from the government concerning people’s shipping, KM No.65
of 2009.
There are three types of vessel in the people’s shipping sector: traditional sailing boats,
sailing motor boats (KLM), and specific motor boats (KM), as stated in article 45 (2)
(Water Transport, Government Regulation (PP) No. 20, Indonesia, 2010). The traditional
sailing boat is rarely used since the establishment of the motorised boat and tough
competition in inter-island trade. For the KLM, the sail is often used as secondary
propulsion to reduce fuel costs, or only as camouflage. The maximum size of the sailing
motor boat is 500GT, as stated in Article 54 of ministerial decree 93 of 2013 (Water
Transport Enterprise, Ministerial Decree (PM) No. 93, Indonesia, 2013). Nonetheless, in
practice, there are some vessels that exceeds the maximum size such as the wooden
ships from Local shipping. It sometimes noticed as the part of people’s shipping fleet due
to the similarities in vessel type and operation area.
On the other hand, the Ministerial Decree (PM) No.69 of 2015 regulate tariff and tax for
shipping under the port authority. The article of 52 indicates that the port dues for
domestic shipping are applied based to the GT of the vessel (Tariff and Tax of Water
Transport, Ministerial Decree (PM) No. 69, Indonesia, 2015). As the people’s shipping
operates in domestic route, the port authority recognises it as part of domestic shipping.
3.4.2. Regulation Concerning Technical and Safety Standard
The law regarding technical standard is a major issue in Indonesia maritime industry,
especially in traditional shipping like people’s shipping. For many years, this sector was
almost untouchable by the proper standard of seaworthiness. Most of the vessel has
been built traditionally by a small dedicated shipyard. When the era of modern shipping
(the conventional vessel recognised by international convention) started, the people’s
shipping faces difficulties to compete with them. Even though the market segmentation
is different, but the consumer tends to demand a fast and safe transport. In addition, the
problem also comes from insurer since they require a good ship standard as a guarantee
of the insurance.
The wooden-hulled vessels used for people’s shipping are included in the non-
conventional vessel class because they operate as Indonesian flagged vessels. This
means that the people’s shipping is regulated under flag state. According to the base law,
UU No. 17 of 2008 article 129, vessels that operate in Indonesian waters must apply the
rules of classification (Shipping Law (UU) No.17, Indonesia, 2008). The exception is
fishing boats and wooden vessels, as stated in article 10 (1) of PM No. 7 of 2013 (The
Classification Obligatory for Indonesian Flagged Vessel, Ministerial Decree (PM) No. 7,

23
2013). Therefore, non-conventional vessel standard Indonesian flagged (NCVS) are
further regulated by KM No. 65 of 2009, which came into force in 2013.
The vessel types of people’s shipping (wooden-hulled ship) are included in the non-
conventional vessel standard (non-class), as stated in Ministerial Decree No.65 of 2009.
This regulates the structure and ship stability, machinery, load lines, safety, and crewing
(Non- Conventional Vessel Standard, Ministerial Decree (KM) No. 65, Indonesia, 2009).
This rule is not organised by the Indonesia Classification Society (BKI) because the
classification only manages the rules for conventional vessels or steel-hulled ships.
Figure 11. People's Shipping Vessel as Non- Conventional Vessel
Source: Author elaborations from various sources
Furthermore, the Director General of Sea Transportation (Dirjen Perhubungan Laut) on
behalf of the Ministry of Transportation publishes the docking regulations for Indonesian
vessels. This states that, for any ship that lies in non-class, the docking schedule for
renewal survey/inspection is once every year (Sea Transportation (Dirjen Hubla), 2014).
However, there is an overlapping regulation in terms of safety issues. The Indonesia
Coast Guard (Bakorkamla) identifies the size of the sailing motor boat (KLM) in a
mandatory certificate requirement as a vessel under 35GT and 35–150GT (Nikson,
2009). This means that the rule does not recognise people’s shipping vessels larger than
150GT. This confuses the primary task of Bakorkamla to secure all seaborne activities in
Indonesian territory.
UU No. 17 of 2008 about Shipping
KM No. 65 of 2009 about Non-Conventional Vessel
Standard
Non-Conventional Vessel Standard Indonesian Flagged 2009 (NCVS)
Regulation of General Director Sea Transportation
2014
PM No. 7 of 2013 about Classification Obligatory of Indonesian Flagged Vessel

24
3.4.3. Local Regulations
Local laws for people’s shipping are regulations created by local government, such as
cities, districts, or provinces. Article 28 of the government regulation (Water Transport,
Government Regulation (PP) No. 20, Indonesia, 2010) mentions that only a mayor and a
governor are able to issue business permits for people’s shipping companies. However,
not all provinces in Indonesia issue rules about people shipping since this industry is only
concentrated in certain regions. Figure 4 below shows certain local laws (Perda)
concerning people’s shipping.
Figure 12. Example of Local Regulation Concerning People’s shipping
Source: Elaborated by author from various sources
Based on the example, local law regarding PELRA is concerned with business permit
regulation and retribution for water transport activity. Provisions for the amount of
retributions are often different depending on the province policy. Also, the clause for a
business permit is similar to that of local government as government regulation (PP) No.
20 of 2010 gives the template of the People’s Shipping Business License (SIUPER)
(Water Transport, Government Regulation (PP) No. 20, Indonesia, 2010)
3.5. People’s Shipping and The Informal Economy
People’s shipping is considered to be part of informal economic activity. According to a
study by Thomas (1992), informal economic activity are the activities in the economy that
are not listed in the national income of accounts due to their characteristics. The informal
economy consists of the household, informal, irregular, and criminal sectors. Since
people’s shipping is a sea transport sector, it comes under the definition of an informal
sector. Informal sectors are mainly found in developing countries. A sector is categorised
as informal if it has the following characteristics: ease of entry, reliance on domestic
resources, family-owned company, small coverage of operation, labour-intensive sector
and low-tech, workers’ skills are acquired through informal education, unregulated
industry, and a competitive market (Thomas, 1992). These characteristics fit the typical
features of the people’s shipping industry, except for the regulation aspect. People’s
shipping is a legal business under Indonesia shipping law (Shipping Law (UU) No.17,
District or City
Local regulation of Tanjungpinang City (Perda) : People’s shipping Business Permit
Local regulation of District Nunukan (Perda) No. 3 of 2005 : Water Transport Business Permit
Province
Local regulation of Province Central Kalimantan No. 12 of 2008 (Perda) : Water Transport Retribution
Local regulation of Special Region of Capital City Jakarta (Perda) No. 3 of 2012 : Local Retribution
Local regulation of Province West Nusa Tenggara (Perda) No. 6 of 2013 : Transportation Business

25
Indonesia, 2008) and other related laws. However, still, regulations seem to overlap each
other and are not well managed by the government.
Compared to the study on informal land transport by Cervero (2000), under the United
Nations Centre for Human Settlements, informal transport is considered a gap filler. This
kind of transportation exists to fill the spaces not filled by public transportation. Informal
transport is related to small, frequently idling, and slow-moving vehicles. It is often blamed
for traffic jam problems in cities. Consequently, the government tends to reduce the role
of informal sector by enforcing strict regulation. On the other hand, informal transport
provides benefits such as providing essential mobility for poorer classes in society,
employment for less-educated workers, and complimenting the transport system as
feeder services (Cervero, 2000). Unlike informal land transport, which commonly occurs
in the large cities of developing countries, traditional shipping not only gives logistic
transport services for low-class people but also delivers significant value for supplying
logistics to isolated areas.
Other informal sectors in the shipping industry are also seen throughout the world, such
as the dhows in the Arabian Sea and the schooners in the Caribbean Sea. The dhows
are wooden sailing motor ships with an average size of about 31.2GT, operating around
the Gulf of Arabia, East Africa, and West India. The crew requirement is around 14
seafarers with limited training experience (Boerne, 1999). Similar to other traditional
shipping, the dhows have low safety and navigation standards. The dhows play a role as
a feeder service for formal shipping. According to a preliminary study of dhows in the
East African region by Boerne (1999), they contributed 14,000 employees in East Africa.
Thus, combining employment size and the role as feeder services, it is likely that dhows
make a significant contribution to the East African maritime industry.
Moreover, informal sea transport is also founded in Central America. Traditional cargo
vessels, called schooners, operate between small islands in the Caribbean Sea. The
schooners are small motorised wooden vessels less than 150GT. They mainly carry
general cargo and essential goods such as vegetables, fruit, and flour. This traditional
shipping type commonly operates under family-based companies, with the owner also
working on-board the ship (Boerne, 1999). Boerne (1999) argues that the level of these
vessels’ safety quality reflects the development of the region and the market expectation.
Regarding the safety aspects, the safety quality of the schooners is better than that of
the dhows in the East Africa region. He also emphasises that the absence of the
schooners on one small island could lead to the occurrence of formal shipping, which will
result in higher transport costs. The increase in the price of essential goods will harm the
islander’s purchasing power parity since job options and salary are limited on the small
island.
Based on these facts, it can be concluded that the operation of people’s shipping between
large islands is similar to the role of dhows as feeders in the Arabian Sea and East Africa
region, while voyages to small islands and isolated areas are closer to the character of
the schooners in the Caribbean Sea. The difference is that both dhows and schooners
operate across different countries. Due to the small scale and limited accessibility to

26
finance sources, the traditional shipping industry needs support from external parties to
be able to survive and remain competitive in the domestic shipping sector. The party most
suited to empowering informal sea transport is the government.

27
Chapter 4 Research Methodology and Data
The aims of chapter four are to introduce the qualitative method, quantitative method and
provide an explanation about how to assess the economic impact of the people’s
shipping. First, the SWOT will assess the competitiveness of the industry. Next, the
analysis of the national cargo traffic will be used to obtain the figure of the total cargo
transported from people’s shipping sector in particular year. Then, the development over
time analysis will focus on the people’s shipping improvement through the decades.
The economic importance of people’s shipping is measured in terms of its revenues,
employment and safety. The safety is assessed using the risk comparison analysis. It will
compare the risk rate of people’s shipping sector to other domestic shipping industry.
4.1. Strengths- Weakness- Opportunities- Threats (SWOT) Matrix
The SWOT analysis is related to the strategy formulation. A strategy is determined as a
match of a company or organisation uses regarding its internal resources, skills,
opportunities and external risk. To understand how the people’s shipping industry could
survive and the strategy needed for the future development, the SWOT analysis is
conducted. The SWOT matrix is a matching tool that could be used to develop four main
factors that explain the strength, the weakness, the opportunity and the threat of a
sector/company.
Source: Author adopted from David (2011)
List the key external opportunities
List the key of external threats
List the key of internal strength
List the key of internal weaknesses
Final matrix
Figure 13. SWOT Analysis Steps

28
These four aspects lead to the formulation of external and internal strategy of the people’s
shipping However, the matching process between the internal factors and external factors
are the most important part of the formulation matrix. It needs a right judgment to create
best matches of each strategy (David, 2011).
4.2. The Cargo Carried People’s Shipping Sector
The total cargo carried by people’s shipping sector is calculated using the throughput
data from certain ports in Indonesia. However, it is a possible that the data concerning
people’s shipping is insufficient for the whole sector calculation. It needs a justification to
choose a specific port that have significant throughput and classified as an important port
for the people’s shipping industry. The justification will build under the analysis of the
cargo flow pattern from the primary commodities and the port call recorded from several
years. The selected ports are Sunda Kelapa port, Kalimas port and Paotere Makassar
port which will represent the whole sector.
Furthermore, the cargo calculation is divided into two parts, a cargo calculation of the
selected ports and a cargo analysis of the whole sector. First, the cargo calculation in
selected ports will focus on the average GT of the vessel, average cargo carried per call
yearly, and a number of trips produced by the ship that entering the port. It will show the
cargo flow patterns of people’s shipping in each port. The formula as follows:
Equation 1. Average GT of Vessel
Average GT t = 𝑛𝑢𝑚𝑏𝑒𝑟 𝑜𝑓 𝑐𝑎𝑙𝑙𝑡
𝑡𝑜𝑡𝑎𝑙 𝑣𝑒𝑠𝑠𝑒𝑙 𝐺𝑇 𝑡
Where:
The average cargo carried per call is calculated using the total cargo volume either load
or unload. This calculation will show the volume of cargo carried by a vessel in each port
call. It will determine the economical ship size for the sector at specific year because the
average cargo transported in each port call also reflect the transport demand from the
region that served by people’s shipping.
Equation 2. Average Cargo Carried per Call
Average Cargo Carried t= 𝑡𝑜𝑡𝑎𝑙 𝑙𝑜𝑎𝑑𝑡
𝑛𝑢𝑚𝑏𝑒𝑟 𝑜𝑓 𝑐𝑎𝑙𝑙𝑡
Where:
The number of trip is calculated using the load factor of the vessel. The load factor
percentage is determined by the cargo filling level for the heaviest link. The fleet operation
▪ Number of call t : Total call produced by the sector on the port in year t
▪ Total vessel GT t : Total gross tonnage of the vessel accounted in year t
▪ Total load t : Total volume of cargo outbound (load) from the port in year t
▪

29
from the selected ports are considered as the heaviest link due to its characteristic as the
important ports in people’s shipping sector.
Equation 3. Number of Trip Produced
Number of Trip t = 𝑎𝑣𝑒𝑟𝑎𝑔𝑒 𝑐𝑎𝑟𝑔𝑜 𝑐𝑎𝑟𝑟𝑖𝑒𝑑𝑡
𝑎𝑣𝑒𝑟𝑎𝑔𝑒 𝐺𝑇𝑡 𝑥 𝑙𝑜𝑎𝑑 𝑓𝑎𝑐𝑡𝑜𝑟
Where:
Second, the total cargo carried by the whole people’s shipping sector is a sum of either
load or unload volume of the selected ports. Then, the calculation of average GT, average
cargo carried per call and number of trip produced are conducted using similar formulas
as mentioned in cargo calculation of selected ports.
4.3. The Developments Over Time of People’s Shipping
This sub chapter will analyse the development of people’s shipping overtime. The data
gathered from several kinds of the literature of people’s shipping started from the study
of people’s shipping by Dick (1986) and Veldman (1990) to the study by Jinca (2001),
Karana (2003), Report of Tanjung Perak 2011-2016 (2017), Report of Sunda Kelapa
Kalibaru port 2008-2016 (2017) and the study of Paotere Makassar port by Prattyni
(2016).
The analysis consists of average cargo carried yearly by a vessel3, a number of trips
produced by the sector and the total employment from the shipping and port side. The
formulas used in this part are similar to the equations from the cargo traffic analysis. It
will result in the historical development trend of the people’s shipping sector which
explained by the economic, political and significant changes to the people’s shipping
industry in particular year. The explanation will give an insight of the future of people’s
shipping.
4.4. Assessment of Economic Importance
4.4.1. Shipping Revenues
From the economic point of view of the government, the financial support to the people’s
shipping sector must be beneficial. The benefit of the investment will come from the total
revenues of the people’s shipping sector, total employment of the people’s shipping, the
income of ship crews and stevedoring and the risk rate compare to other domestic
3 The approach to acquire the average cargo carried by vessel yearly is different to the cargo carried
calculation analysis in section 4.2 which use the port call data. This section used the total cargo transported and the fleet quantity to make the development over time analysis comparable per selected year.
▪ Load factor : The load factor of the vessel based on the heaviest link
▪ Average Cargo Carried y : Average cargo carried by the sector in year t
▪

30
shipping. In addition, there are two steps for revenue calculation. First, the analysis of the
cost structure in people’s shipping. A freight rate bears the cost of ship operation and
operation of non-ship plus the profit margin. Second, the total revenue of the sector will
be calculated based on the total cargo carried by people’s shipping in a particular year.
The output will be a total revenue generated by people’s shipping using average freight
rate. The formula is as follow:
Equation 4. Total Revenue of The Sector
Total Revenue = 𝑡𝑜𝑡𝑎𝑙 𝑐𝑎𝑟𝑔𝑜 𝑐𝑎𝑟𝑟𝑖𝑒𝑑 𝑏𝑦 𝑠𝑒𝑐𝑡𝑜𝑟𝑡𝑥 𝑎𝑣𝑒𝑟𝑎𝑔𝑒 𝑓𝑟𝑒𝑖𝑔ℎ𝑡 𝑟𝑎𝑡𝑒𝑥
Where:
The average freight rate will be acquired from the sample of freight rates from several
major routes which collected from secondary and primary sources. The most important
route is from south to north of Indonesia which connects the Java and Sulawesi to
Sumatera and Kalimantan. One freight rate will be chosen as a representation of average
freight rate under some assumptions. The freight rates from various sources need to be
corrected to 2014 as base year of calculation. The price after inflation correction is
calculated using the inflation rate as shown at Appendix 2.
4.4.2. Port Revenues
The revenue of port concerns income from anchorage dues, berth dues and wharfage
dues. The people’s shipping does not need an assistance either from the pilotage and
tugs service due to the small ship size. The first formula is the anchorage revenue as
shown below:
Equation 5. Anchorage Revenue
Anchorage revenue t = 𝐴𝑛𝑐ℎ𝑜𝑟𝑎𝑔𝑒 𝑑𝑢𝑒𝑠 𝑥 𝑡𝑜𝑡𝑎𝑙 𝐺𝑇 𝑡 𝑥 𝑎𝑣𝑒𝑟𝑎𝑔𝑒 𝑎𝑛𝑐ℎ𝑜𝑟𝑎𝑔𝑒 𝑑𝑢𝑟𝑎𝑡𝑖𝑜𝑛 𝑡
Where:
This formula using the average anchoring duration of a vessel while waiting for berth
space to unload/load its cargo. However, since the ship berthing in sideway position, it
only needs a small space for berthing operation. The berthing area can handle many
ships at the same time. It leads to the assumption that most of the fleet does not need a
long anchorage time. Therefore, one day is taken as average anchorage time. Next, the
berthing time is obtained from the average port time in sample port which is 19 days as
▪ Total cargo carried by sector t : Cargo carried by people’s shipping in year t
▪ Freight rate x : Average freight rate from selected route
▪ Total GT t : Total GT of vessel call in year t
▪ Average anchorage duration t : Average vessel spends in anchorage (one day)

31
shown in the Appendix 9 and subtracted by the average anchorage time (one day). So,
the berthing time is 18 days. The formula for berth revenue is as follow:
Equation 6. Berth Revenue
Berth revenue t = 𝐵𝑒𝑟𝑡ℎ 𝑑𝑢𝑒𝑠 𝑥 𝑡𝑜𝑡𝑎𝑙 𝐺𝑇 𝑡 𝑥 𝑎𝑣𝑒𝑟𝑎𝑔𝑒 𝑏𝑒𝑟𝑡ℎ 𝑑𝑢𝑟𝑎𝑡𝑖𝑜𝑛 𝑡
Where:
Moreover, the wharfage dues paid by a vessel once for each call. The vessel pays the
wharfage dues for a space that they used in cargo handling operation. The cargo could
unload/load directly from the warehouse near the wharfage area or truck using the crane
and stevedoring assistance.
Equation 7. Wharfage Revenue
Wharfage revenue t = 𝑊ℎ𝑎𝑟𝑓𝑎𝑔𝑒 𝑑𝑢𝑒𝑠 𝑥 𝑡𝑜𝑡𝑎𝑙 𝐺𝑇 𝑡
Where:
4.4.3. Employment
The employment analysis divided into two types, the employment in the shipping side
and the port side (cargo handling activity). The employment in the shipping side will be
calculated based on the vessel quantity times the crew requirement of each vessel size.
The crew requirement is determined using the study of people’s shipping by (Romadhoni,
2013) and (Prasetyo, 2017) and the detail cases of people’ shipping (PELRA) in 2014 as
shown in Appendix 8. The number of vessel size in each size category calculated using
the ratio of vessel size from 50 samples of ship under the People’s Shipping Union Branch
(DPC PELRA) Kalimas as shown in the Appendix 1. The formula is as follow:
Equation 8. Employment of Ship Side
Employment at ship = (𝑡𝑜𝑡𝑎𝑙 𝑛𝑢𝑚𝑏𝑒𝑟 𝑜𝑓 𝑣𝑒𝑠𝑠𝑒𝑙𝑆𝑀𝐿 𝑥 𝑛𝑢𝑚𝑏𝑒𝑟 𝑜𝑓 𝑐𝑟𝑒𝑤𝑆𝑀𝐿 )
Where:
Moreover, the port area employment measured by the total fleet times the handling
worker requirements for each ship size. The handling operation determined that each
▪ Total number of vessel SML : Total number of small, medium and large vessel
▪ Number of ship crews SML : Number of crews for small, medium and large vessel
▪ Total GT y : Total GT of vessel call in year t
▪ Total GT y : Total GT of vessel call in year t
▪ Average berth duration y : Average vessel spends in berth area (18 days)
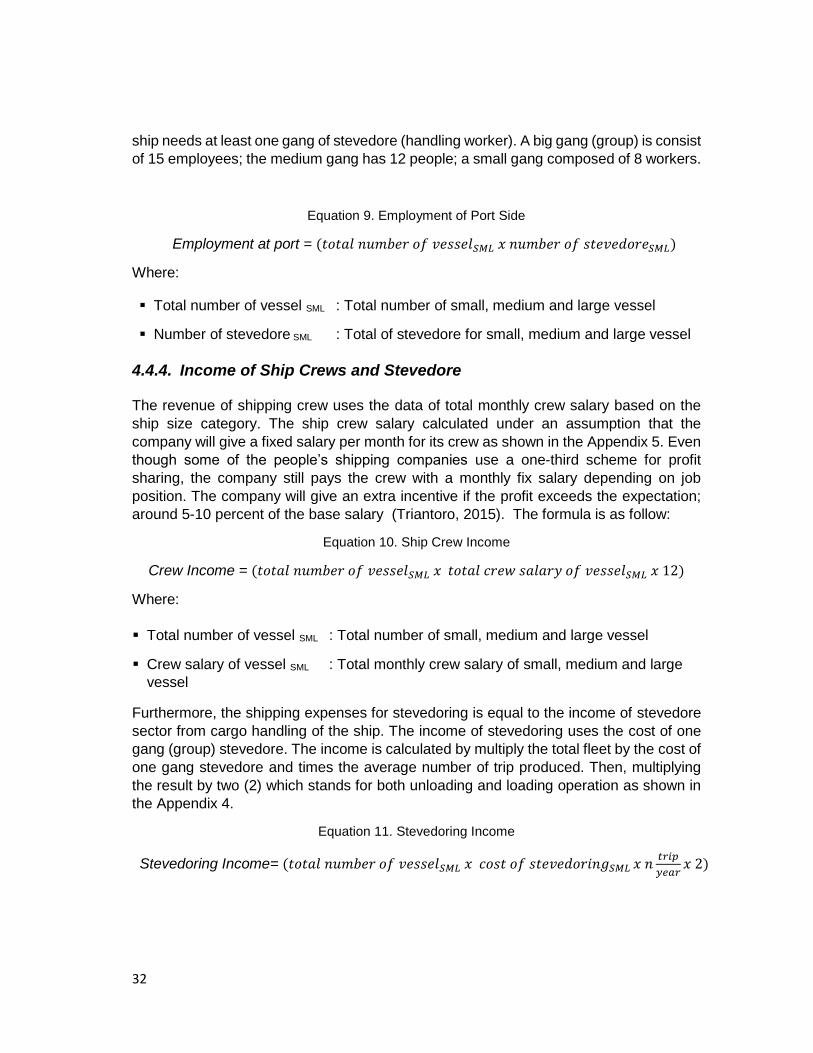
32
ship needs at least one gang of stevedore (handling worker). A big gang (group) is consist
of 15 employees; the medium gang has 12 people; a small gang composed of 8 workers.
Equation 9. Employment of Port Side
Employment at port = (𝑡𝑜𝑡𝑎𝑙 𝑛𝑢𝑚𝑏𝑒𝑟 𝑜𝑓 𝑣𝑒𝑠𝑠𝑒𝑙𝑆𝑀𝐿 𝑥 𝑛𝑢𝑚𝑏𝑒𝑟 𝑜𝑓 𝑠𝑡𝑒𝑣𝑒𝑑𝑜𝑟𝑒𝑆𝑀𝐿)
Where:
4.4.4. Income of Ship Crews and Stevedore
The revenue of shipping crew uses the data of total monthly crew salary based on the
ship size category. The ship crew salary calculated under an assumption that the
company will give a fixed salary per month for its crew as shown in the Appendix 5. Even
though some of the people’s shipping companies use a one-third scheme for profit
sharing, the company still pays the crew with a monthly fix salary depending on job
position. The company will give an extra incentive if the profit exceeds the expectation;
around 5-10 percent of the base salary (Triantoro, 2015). The formula is as follow:
Equation 10. Ship Crew Income
Crew Income = (𝑡𝑜𝑡𝑎𝑙 𝑛𝑢𝑚𝑏𝑒𝑟 𝑜𝑓 𝑣𝑒𝑠𝑠𝑒𝑙𝑆𝑀𝐿 𝑥 𝑡𝑜𝑡𝑎𝑙 𝑐𝑟𝑒𝑤 𝑠𝑎𝑙𝑎𝑟𝑦 𝑜𝑓 𝑣𝑒𝑠𝑠𝑒𝑙𝑆𝑀𝐿 𝑥 12)
Where:
Furthermore, the shipping expenses for stevedoring is equal to the income of stevedore
sector from cargo handling of the ship. The income of stevedoring uses the cost of one
gang (group) stevedore. The income is calculated by multiply the total fleet by the cost of
one gang stevedore and times the average number of trip produced. Then, multiplying
the result by two (2) which stands for both unloading and loading operation as shown in
the Appendix 4.
Equation 11. Stevedoring Income
Stevedoring Income= (𝑡𝑜𝑡𝑎𝑙 𝑛𝑢𝑚𝑏𝑒𝑟 𝑜𝑓 𝑣𝑒𝑠𝑠𝑒𝑙𝑆𝑀𝐿 𝑥 𝑐𝑜𝑠𝑡 𝑜𝑓 𝑠𝑡𝑒𝑣𝑒𝑑𝑜𝑟𝑖𝑛𝑔𝑆𝑀𝐿 𝑥 𝑛𝑡𝑟𝑖𝑝
𝑦𝑒𝑎𝑟𝑥 2)
▪ Total number of vessel SML : Total number of small, medium and large vessel
▪ Number of stevedore SML : Total of stevedore for small, medium and large vessel
▪ Total number of vessel SML : Total number of small, medium and large vessel
▪ Crew salary of vessel SML : Total monthly crew salary of small, medium and large
vessel

33
Where:
4.4.5. Risk Comparison Analysis of People’s Shipping
The people’s shipping risk analysis will focus on the number of accident concerning
people’s shipping fleet. The study of mitigation risk analysis by Prasetyo (2017) states
that the people’s shipping has higher insurance value per GT compared to other domestic
shipping (Prasetyo, 2017). Nonetheless, this risk analysis will focus on the loss
percentage analysis of each domestic maritime transport sector such as people’s
shipping, conventional domestic cargo shipping and domestic container shipping. The
result is the comparison of the number of vessels damaged and the human casualties to
the total fleet of each sector. Also, the relation of cargo carried volume per year to the
number of the accident will be assessed. It will give the figure of vessel loss rate to cargo
volume carried per sector.
▪ Total number of vessel SML : Total number of small, medium and large vessel
▪ Cost of stevedoring SML : Cost of stevedoring for small, medium and large Vessel
▪ 𝑛 trip per year : Average number of trip per year

34

35
Chapter 5 Data Analysis and Result
This chapter presents the result of SWOT analysis, cargo carried analysis, the development overtime analysis, and the economic importance assessment of people’s shipping industry. It will answer the main research question of this thesis about “What is the economic importance of the people’s shipping (PELRA) in Indonesia?”.
5.1. SWOT Analysis of People’s Shipping
The first step of the SWOT analysis in people’s shipping is to determine and list the
internal and external factors. The list will show all the factors that influence the
development of the people’s shipping sector. The internal factors consist of the strengths
and weakness of people’s shipping. Then, external factors include the opportunities and
threats to the sector from external sources.
After analysing the role, operation, and regulation of people’s shipping, the significant
findings in terms of internal strengths are economical operation and operational flexibility.
The low cost, market size, and flexibility are the advantages of the people’s shipping
players, while the low price per ton is a benefit for the customer. Moreover, the most
important point in the list of weakness are the safety standard issues, less well-trained
crews, and workers’ requirements in both shipping and handling operations.
Unfortunately, from the customer perspective, the fleet spends a great deal of time in
port, which results in uncertain schedules.
On the other hand, the key opportunities for people’s shipping are the new technical
standards. There is also a problem with the enforcement of the regulation of the flag state,
such as docking schedules for non-conventional vessels (Sea Transportation (Dirjen
Hubla), 2014). The results are presented in a matrix below:
Table 6. SWOT Analysis
INTERNAL STRENGTHS
• Low transport price per ton
• Capable of operating in low draft
areas
• No restrictions on operation area
• Simple cargo handling operation
• Small cargo capacity that fits the
demand and market size
INTERNAL WEAKNESSES
• Lack of safety standards
• Fleet spend a lot of time in port
• Less well-trained crews
• Involves many workers in both
shipping and handling operation
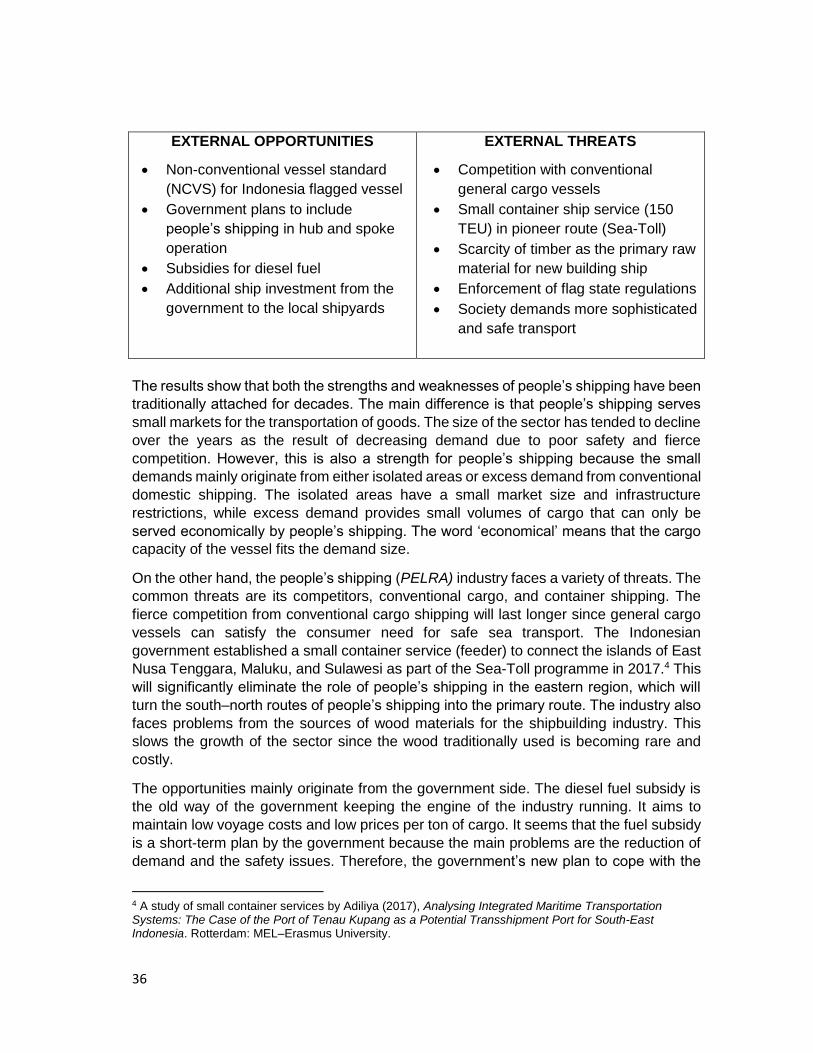
36
EXTERNAL OPPORTUNITIES
• Non-conventional vessel standard
(NCVS) for Indonesia flagged vessel
• Government plans to include
people’s shipping in hub and spoke
operation
• Subsidies for diesel fuel
• Additional ship investment from the
government to the local shipyards
EXTERNAL THREATS
• Competition with conventional
general cargo vessels
• Small container ship service (150
TEU) in pioneer route (Sea-Toll)
• Scarcity of timber as the primary raw
material for new building ship
• Enforcement of flag state regulations
• Society demands more sophisticated
and safe transport
The results show that both the strengths and weaknesses of people’s shipping have been
traditionally attached for decades. The main difference is that people’s shipping serves
small markets for the transportation of goods. The size of the sector has tended to decline
over the years as the result of decreasing demand due to poor safety and fierce
competition. However, this is also a strength for people’s shipping because the small
demands mainly originate from either isolated areas or excess demand from conventional
domestic shipping. The isolated areas have a small market size and infrastructure
restrictions, while excess demand provides small volumes of cargo that can only be
served economically by people’s shipping. The word ‘economical’ means that the cargo
capacity of the vessel fits the demand size.
On the other hand, the people’s shipping (PELRA) industry faces a variety of threats. The
common threats are its competitors, conventional cargo, and container shipping. The
fierce competition from conventional cargo shipping will last longer since general cargo
vessels can satisfy the consumer need for safe sea transport. The Indonesian
government established a small container service (feeder) to connect the islands of East
Nusa Tenggara, Maluku, and Sulawesi as part of the Sea-Toll programme in 2017.4 This
will significantly eliminate the role of people’s shipping in the eastern region, which will
turn the south–north routes of people’s shipping into the primary route. The industry also
faces problems from the sources of wood materials for the shipbuilding industry. This
slows the growth of the sector since the wood traditionally used is becoming rare and
costly.
The opportunities mainly originate from the government side. The diesel fuel subsidy is
the old way of the government keeping the engine of the industry running. It aims to
maintain low voyage costs and low prices per ton of cargo. It seems that the fuel subsidy
is a short-term plan by the government because the main problems are the reduction of
demand and the safety issues. Therefore, the government’s new plan to cope with the
4 A study of small container services by Adiliya (2017), Analysing Integrated Maritime Transportation Systems: The Case of the Port of Tenau Kupang as a Potential Transshipment Port for South-East Indonesia. Rotterdam: MEL–Erasmus University.

37
safety issues is to establish technical regulation for non-conventional vessel (NCVS) for
new shipbuilding and wooden vessel dedicated shipyards. This plan is combined with the
Indonesian Ministry of Transportation’s plan to invest 100 people’s shipping vessels in
2017 (Transportation Indonesia, 2017). This will benefit both dedicated shipyards and the
PELRA industry. Nonetheless, there may be industry confusion regarding who will
operate these vessels. The NCVS will have an adverse economic effect on the people’s
shipping sector in the long term since the well-standardised vessel is costly, resulting in
a high transport price per ton of cargo, even though the safety standards will be improved
significantly at the same time. It seems that the government is trying to pull the people’s
shipping sector into the formal sector. The best chance for people’s shipping is to operate
as a hub and spoke service. The main hubs are the ports that are located in the regions
where the primary commodities (mainly essential goods) of people’s shipping are
produced. These ports also operate as the main hub of international and domestic
shipping. This will provide a market for the people’s shipping sector since the possibility
of excess demand is larger in these ports.
5.2. The Cargo Carried Analysis
The total cargo carried by the people’s shipping sector is calculated using the throughput
data from certain ports in Indonesia. Unfortunately, the lack of data regarding the cargo
movement of the people’s shipping sector is an obstacle. Therefore, the total cargo
volume will be assessed based on the assumptions that the data available from the cargo
throughput reports of Sunda Kelapa, Kalimas, and Paotere Makassar port can be used
to represent the cargo volume movement of the whole of the people’s shipping sector.
The assumptions are the port classification, the production area of the main commodities,
and port origin and destination.
5.2.1. The Classification of Ports
The people’s shipping industry does not recognise the classification of ports. People’s
shipping serves a small volume from the excess demand of conventional shipping. It also
operates as a feeder for the smaller ports. The demand for transporting goods relates to
the production level of an area. The GDP represents the goods and services produced
within a country in each period. It measures the production level of the country in
monetary value.
While the original term GDP uses the scope of the country as a whole, gross regional
domestic product (GRDP) presents the production of goods and services at the
region/province level. Indonesia has 33 provinces. Therefore, we measure the
significance of the ports of Sunda Kelapa in DKI Jakarta, Kalimas Surabaya in East Java,
and Paotere Makassar in South Sulawesi using the GRDP. However, the port of Sunda
Kelapa serves not only the DKI Jakarta region but also the West Java region.

38
Figure 14. Share of Gross Regional Domestic Product (GRDP)
Source: author adapted from BPS (2015)
According to the GRDP statistics from the BPS (2015), the four provinces accounted for
a total share of 46.72 percent, which is nearly half of the total GRDP from all provinces
in Indonesia. The DKI Jakarta region has the biggest share, with 15.96 percent, followed
by other areas of Java island. South Sulawesi’s share of GRDP is 2.72 percent, but it is
still positioned as having the biggest share in the eastern region of Indonesia because of
the major industrial area located in South Sulawesi and products transported via
Makassar port, especially in the cement industry. The cement industry in South Sulawesi
serves the demand from Indonesia’s eastern region market.
On the other hand, the amount of goods outflow from those three ports is significantly
larger than the cargo inflow. According to the report from Sunda Kelapa port for 2014,
the cargo unloads volume accounted for 83,985 tons, while the load volume was 562,564
tons (Sunda Kelapa , 2016). The reports from other ports such as Kalimas and Paotere
Makassar port also show similar trends; the cargo load volume is three times larger than
the cargo unload volume (Kalimas, 2015) (Prattyni, 2016).
The percentage of the GRDP share and the trend of the throughput volume shows the
importance of port location since these three dedicated ports are positioned in major
production areas. Thus, these ports are classified as major ports for the people’s shipping
sector.
5.2.2. Production Area of The Main Commodities
According to the reports from the ports of Sunda Kelapa, Kalimas, and Paotere Makassar,
the primary products of the people’s shipping sector are kaolin, quartz sand, fertiliser,
cement, sugar, flour, rice, and livestock feed. There is a study about the main economic
activities or production based on the economic corridors by the Ministry of Coordinating
Economic Affairs under the Masterplan of Acceleration and Expansion of Indonesia
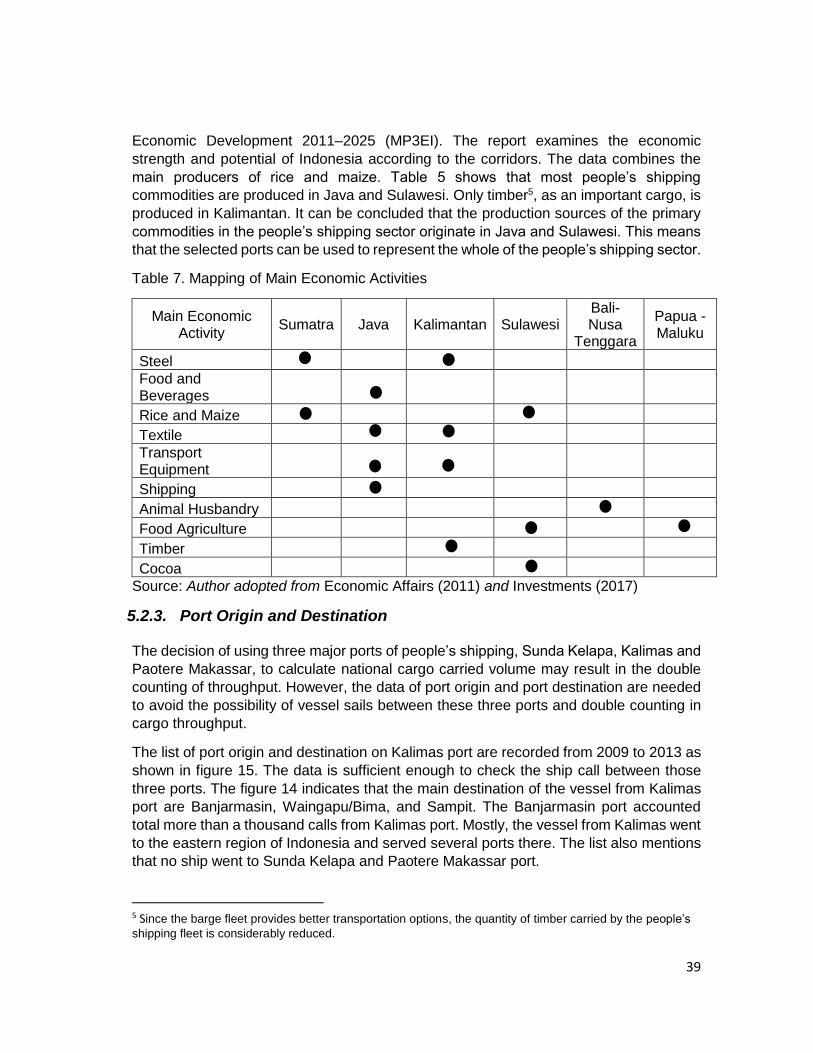
39
Economic Development 2011–2025 (MP3EI). The report examines the economic
strength and potential of Indonesia according to the corridors. The data combines the
main producers of rice and maize. Table 5 shows that most people’s shipping
commodities are produced in Java and Sulawesi. Only timber5, as an important cargo, is
produced in Kalimantan. It can be concluded that the production sources of the primary
commodities in the people’s shipping sector originate in Java and Sulawesi. This means
that the selected ports can be used to represent the whole of the people’s shipping sector.
Table 7. Mapping of Main Economic Activities
Main Economic Activity
Sumatra Java Kalimantan Sulawesi Bali- Nusa
Tenggara
Papua - Maluku
Steel
Food and Beverages
Rice and Maize
Textile
Transport Equipment
Shipping
Animal Husbandry
Food Agriculture
Timber
Cocoa
Source: Author adopted from Economic Affairs (2011) and Investments (2017)
5.2.3. Port Origin and Destination
The decision of using three major ports of people’s shipping, Sunda Kelapa, Kalimas and
Paotere Makassar, to calculate national cargo carried volume may result in the double
counting of throughput. However, the data of port origin and port destination are needed
to avoid the possibility of vessel sails between these three ports and double counting in
cargo throughput.
The list of port origin and destination on Kalimas port are recorded from 2009 to 2013 as
shown in figure 15. The data is sufficient enough to check the ship call between those
three ports. The figure 14 indicates that the main destination of the vessel from Kalimas
port are Banjarmasin, Waingapu/Bima, and Sampit. The Banjarmasin port accounted
total more than a thousand calls from Kalimas port. Mostly, the vessel from Kalimas went
to the eastern region of Indonesia and served several ports there. The list also mentions
that no ship went to Sunda Kelapa and Paotere Makassar port.
5 Since the barge fleet provides better transportation options, the quantity of timber carried by the people’s
shipping fleet is considerably reduced.

40
Furthermore, the port of origin also shows the similar trend with the port of destination
data. The vessel from Banjarmasin, Waingapu/Bima, and Sampit dominated the number
of call in Kalimas port. The list also presents that there was no ship came from both Sunda
Kelapa and Paotere Makassar port. Nonetheless, since the data only gives top ten list,
there is a possibility that some ships made a voyage between those three ports. However,
the number will be small.
Figure 16. Port of Origin List of Kalimas port for 2009-2013
Source: author adopted from Perak (2014)
Figure 15. Port of Destination List of Kalimas port for 2009-2013
Source: author adopted from Perak 2014
0
200
400
600
800
1000
1200
Nu
mb
er o
f C
all
Port of Origin
2009-2013
0
200
400
600
800
1000
1200
Nu
mb
er o
f C
all
Port of Destination
2009-2013
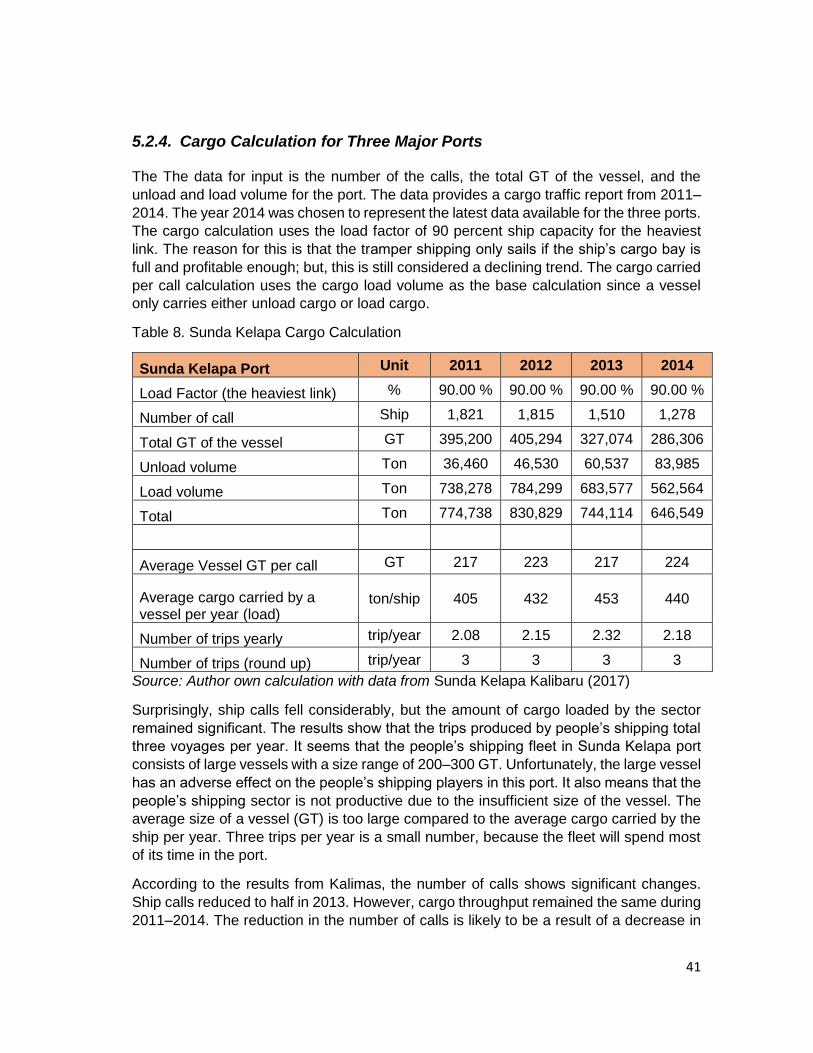
41
5.2.4. Cargo Calculation for Three Major Ports
The The data for input is the number of the calls, the total GT of the vessel, and the
unload and load volume for the port. The data provides a cargo traffic report from 2011–
2014. The year 2014 was chosen to represent the latest data available for the three ports.
The cargo calculation uses the load factor of 90 percent ship capacity for the heaviest
link. The reason for this is that the tramper shipping only sails if the ship’s cargo bay is
full and profitable enough; but, this is still considered a declining trend. The cargo carried
per call calculation uses the cargo load volume as the base calculation since a vessel
only carries either unload cargo or load cargo.
Table 8. Sunda Kelapa Cargo Calculation
Sunda Kelapa Port Unit 2011 2012 2013 2014
Load Factor (the heaviest link) % 90.00 % 90.00 % 90.00 % 90.00 %
Number of call Ship 1,821 1,815 1,510 1,278
Total GT of the vessel GT 395,200 405,294 327,074 286,306
Unload volume Ton 36,460 46,530 60,537 83,985
Load volume Ton 738,278 784,299 683,577 562,564
Total Ton 774,738 830,829 744,114 646,549
Average Vessel GT per call GT 217 223 217 224
Average cargo carried by a vessel per year (load)
ton/ship 405 432 453 440
Number of trips yearly trip/year 2.08 2.15 2.32 2.18
Number of trips (round up) trip/year 3 3 3 3
Source: Author own calculation with data from Sunda Kelapa Kalibaru (2017)
Surprisingly, ship calls fell considerably, but the amount of cargo loaded by the sector
remained significant. The results show that the trips produced by people’s shipping total
three voyages per year. It seems that the people’s shipping fleet in Sunda Kelapa port
consists of large vessels with a size range of 200–300 GT. Unfortunately, the large vessel
has an adverse effect on the people’s shipping players in this port. It also means that the
people’s shipping sector is not productive due to the insufficient size of the vessel. The
average size of a vessel (GT) is too large compared to the average cargo carried by the
ship per year. Three trips per year is a small number, because the fleet will spend most
of its time in the port.
According to the results from Kalimas, the number of calls shows significant changes.
Ship calls reduced to half in 2013. However, cargo throughput remained the same during
2011–2014. The reduction in the number of calls is likely to be a result of a decrease in
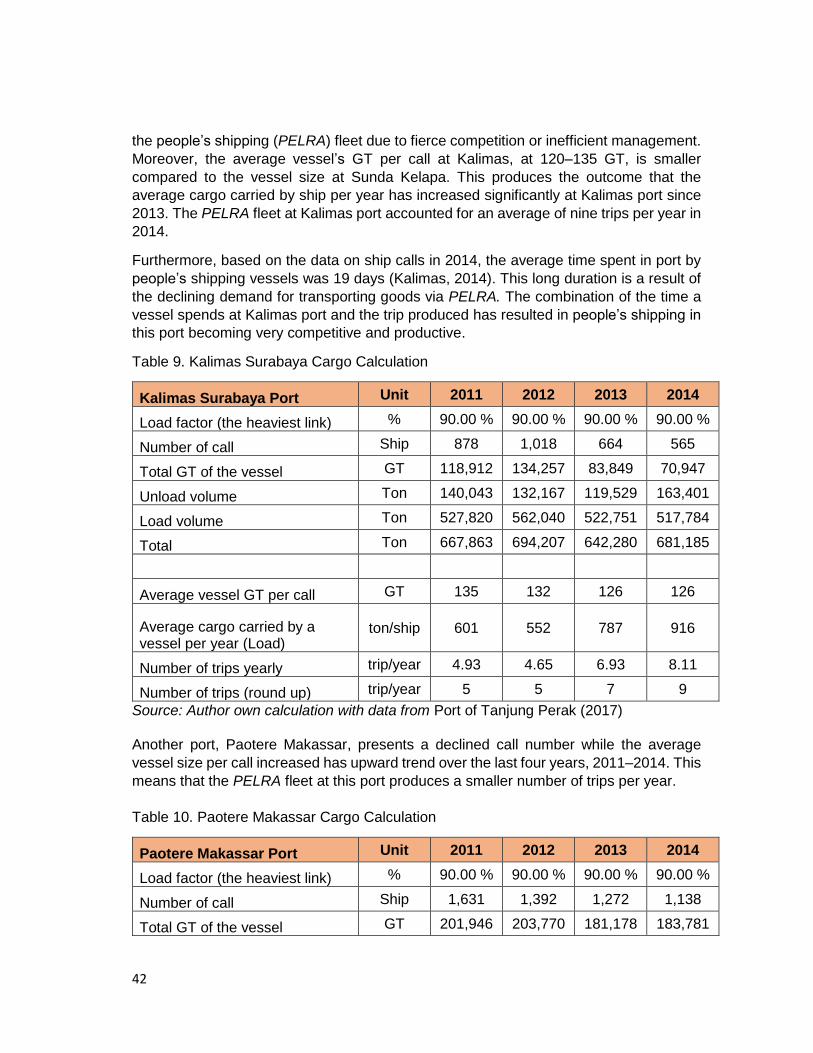
42
the people’s shipping (PELRA) fleet due to fierce competition or inefficient management.
Moreover, the average vessel’s GT per call at Kalimas, at 120–135 GT, is smaller
compared to the vessel size at Sunda Kelapa. This produces the outcome that the
average cargo carried by ship per year has increased significantly at Kalimas port since
2013. The PELRA fleet at Kalimas port accounted for an average of nine trips per year in
2014.
Furthermore, based on the data on ship calls in 2014, the average time spent in port by
people’s shipping vessels was 19 days (Kalimas, 2014). This long duration is a result of
the declining demand for transporting goods via PELRA. The combination of the time a
vessel spends at Kalimas port and the trip produced has resulted in people’s shipping in
this port becoming very competitive and productive.
Table 9. Kalimas Surabaya Cargo Calculation
Kalimas Surabaya Port Unit 2011 2012 2013 2014
Load factor (the heaviest link) % 90.00 % 90.00 % 90.00 % 90.00 %
Number of call Ship 878 1,018 664 565
Total GT of the vessel GT 118,912 134,257 83,849 70,947
Unload volume Ton 140,043 132,167 119,529 163,401
Load volume Ton 527,820 562,040 522,751 517,784
Total Ton 667,863 694,207 642,280 681,185
Average vessel GT per call GT 135 132 126 126
Average cargo carried by a vessel per year (Load)
ton/ship 601 552 787 916
Number of trips yearly trip/year 4.93 4.65 6.93 8.11
Number of trips (round up) trip/year 5 5 7 9
Source: Author own calculation with data from Port of Tanjung Perak (2017)
Another port, Paotere Makassar, presents a declined call number while the average
vessel size per call increased has upward trend over the last four years, 2011–2014. This
means that the PELRA fleet at this port produces a smaller number of trips per year.
Table 10. Paotere Makassar Cargo Calculation
Paotere Makassar Port Unit 2011 2012 2013 2014
Load factor (the heaviest link) % 90.00 % 90.00 % 90.00 % 90.00 %
Number of call Ship 1,631 1,392 1,272 1,138
Total GT of the vessel GT 201,946 203,770 181,178 183,781
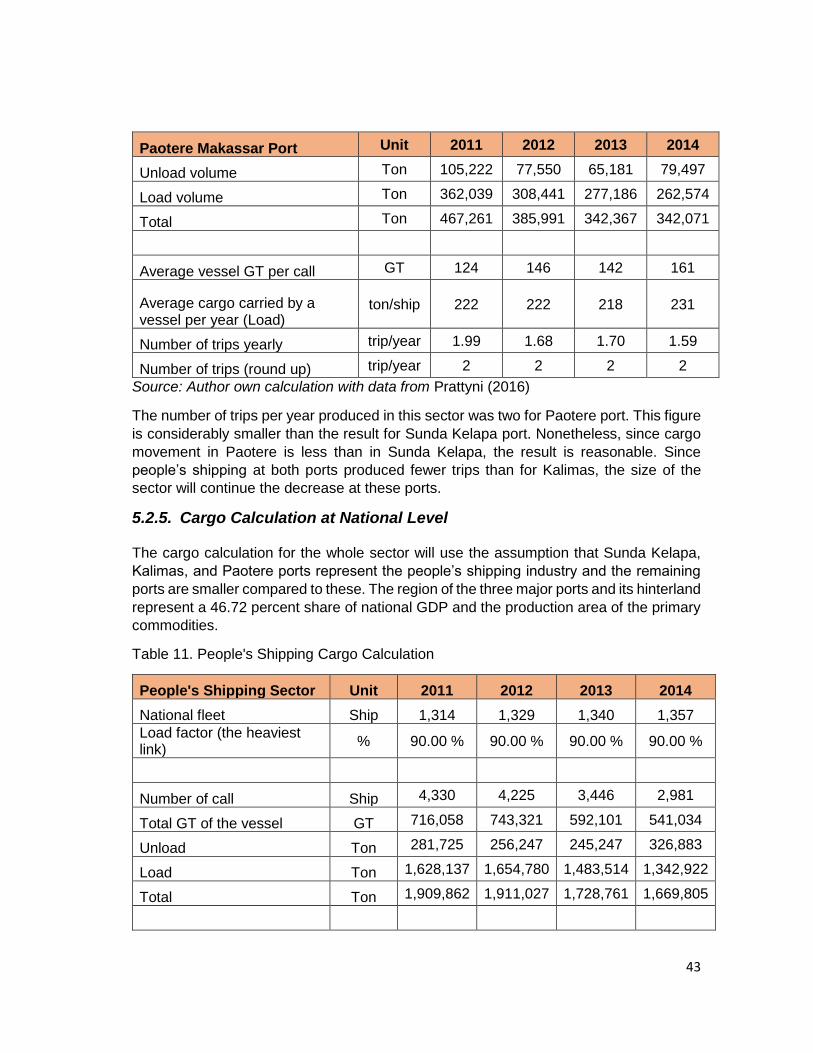
43
Paotere Makassar Port Unit 2011 2012 2013 2014
Unload volume Ton 105,222 77,550 65,181 79,497
Load volume Ton 362,039 308,441 277,186 262,574
Total Ton 467,261 385,991 342,367 342,071
Average vessel GT per call GT 124 146 142 161
Average cargo carried by a vessel per year (Load)
ton/ship 222 222 218 231
Number of trips yearly trip/year 1.99 1.68 1.70 1.59
Number of trips (round up) trip/year 2 2 2 2
Source: Author own calculation with data from Prattyni (2016)
The number of trips per year produced in this sector was two for Paotere port. This figure
is considerably smaller than the result for Sunda Kelapa port. Nonetheless, since cargo
movement in Paotere is less than in Sunda Kelapa, the result is reasonable. Since
people’s shipping at both ports produced fewer trips than for Kalimas, the size of the
sector will continue the decrease at these ports.
5.2.5. Cargo Calculation at National Level
The cargo calculation for the whole sector will use the assumption that Sunda Kelapa,
Kalimas, and Paotere ports represent the people’s shipping industry and the remaining
ports are smaller compared to these. The region of the three major ports and its hinterland
represent a 46.72 percent share of national GDP and the production area of the primary
commodities.
Table 11. People's Shipping Cargo Calculation
People's Shipping Sector Unit 2011 2012 2013 2014
National fleet Ship 1,314 1,329 1,340 1,357
Load factor (the heaviest link)
% 90.00 % 90.00 % 90.00 % 90.00 %
Number of call Ship 4,330 4,225 3,446 2,981
Total GT of the vessel GT 716,058 743,321 592,101 541,034
Unload Ton 281,725 256,247 245,247 326,883
Load Ton 1,628,137 1,654,780 1,483,514 1,342,922
Total Ton 1,909,862 1,911,027 1,728,761 1,669,805

44
People's Shipping Sector Unit 2011 2012 2013 2014
Average vessel GT per call GT 165 176 172 181
Average cargo carried by a vessel per year (load) ton/ship
376 392 431 450
Number of trips yearly trip/year 2.53 2.47 2.78 2.76
Number of trips (round up) trip/year 3 3 3 3
Source: Author own calculation
The data shows that the total number of ships in the fleet has remained unchanged for
the past four years. The cargo calculation at the national level shows an impressive result,
with the average vessel GT per call at 181 GT and the average cargo carried by ship per
year at 450 tons in 2014. This indicates that the majority of the people’s shipping fleet
does not produce enough trips per year. This leads to the conclusion that the people’s
shipping sector did not become productive enough in the period 2011–2014. Also, the
average vessel GT per call proves that the size of ship mainly ranges between 100–
300GT. Operating a larger vessel will be costly if the transport demand is not profitable
for the company. The best size of ship is around 100–150 GT, which will produce an
average of four trips per year if the volume of cargo traffic remains the same in the future.
5.3. Developments Over Time in People’s Shipping
Table 12 shows how the people’s shipping industry has developed over the decades. The
data on the sector was collected from several types of literature. The average vessel
size* (GT) is included under the characteristic of the fleet size as explained by the
literature from a particular year. In addition, employment is calculated using the ship crew
and stevedoring requirement for each vessel size. The calculation of the average cargo
carried by ship per year is the result of the total cargo load divided by the number of ships
in the fleet.
Table 12. Development in Time of People's Shipping
Veldman (1990)
and Dick (1986)
Karana (2003)
and Jinca (2001)
Karana (2003)
and Jinca (2001)
Author Elaboration
1984 1996 2000 2014
Data Unit
Total fleet Ship 4,759 2,793 3,000 1,354
Total GT of the vessel GT - - - 541,034
Total cargo carried load (per 1000 ton)
Ton 4,639 8,327 7,106 1,343
Total number of call Ship - - 4,330 2,981
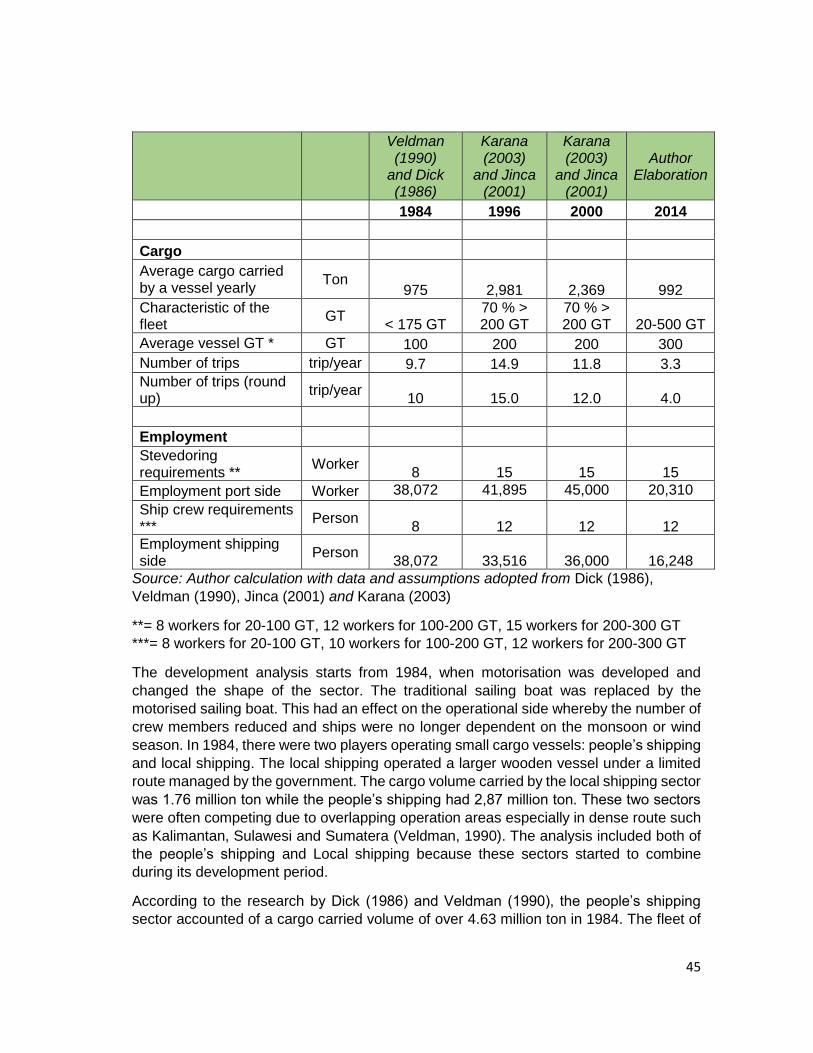
45
Veldman (1990)
and Dick (1986)
Karana (2003)
and Jinca (2001)
Karana (2003)
and Jinca (2001)
Author Elaboration
1984 1996 2000 2014
Cargo
Average cargo carried by a vessel yearly
Ton 975 2,981 2,369 992
Characteristic of the fleet
GT < 175 GT
70 % > 200 GT
70 % > 200 GT 20-500 GT
Average vessel GT * GT 100 200 200 300
Number of trips trip/year 9.7 14.9 11.8 3.3
Number of trips (round up)
trip/year 10 15.0 12.0 4.0
Employment
Stevedoring requirements **
Worker 8 15 15 15
Employment port side Worker 38,072 41,895 45,000 20,310
Ship crew requirements ***
Person 8 12 12 12
Employment shipping side
Person 38,072 33,516 36,000 16,248
Source: Author calculation with data and assumptions adopted from Dick (1986),
Veldman (1990), Jinca (2001) and Karana (2003)
**= 8 workers for 20-100 GT, 12 workers for 100-200 GT, 15 workers for 200-300 GT
***= 8 workers for 20-100 GT, 10 workers for 100-200 GT, 12 workers for 200-300 GT
The development analysis starts from 1984, when motorisation was developed and
changed the shape of the sector. The traditional sailing boat was replaced by the
motorised sailing boat. This had an effect on the operational side whereby the number of
crew members reduced and ships were no longer dependent on the monsoon or wind
season. In 1984, there were two players operating small cargo vessels: people’s shipping
and local shipping. The local shipping operated a larger wooden vessel under a limited
route managed by the government. The cargo volume carried by the local shipping sector
was 1.76 million ton while the people’s shipping had 2,87 million ton. These two sectors
were often competing due to overlapping operation areas especially in dense route such
as Kalimantan, Sulawesi and Sumatera (Veldman, 1990). The analysis included both of
the people’s shipping and Local shipping because these sectors started to combine
during its development period.
According to the research by Dick (1986) and Veldman (1990), the people’s shipping
sector accounted of a cargo carried volume of over 4.63 million ton in 1984. The fleet of
46
people’s shipping consisted of a motor boat, sailing motor boat, and a small boat with
size less than 175 GT (Veldman, 1990) and (Dick, 1986). The average vessel GT in 1984
justified by 100GT6 due to the variety size of the ship in this period. The average cargo
carried per ship yearly combined with the average vessel GT shows that PELRA was a
productive sector. The results were eight voyages per ship per year, producing
employment for 76,144 people on both the shipping and port sides of the business. The
number of people employed was related to the vessel size and the number ships in the
fleet. The employment rate on the port side will be higher if the number of vessels
increases.
The data for 1996 shows that the sector saw peak performance with the total cargo
carried reaching more than eight million tons, and the quantity of ships reduced to 2,793,
with an average vessel size of more than 200GT. A study on people’s shipping by Karana
(2003) indicates that the peak condition was a result of the high demand for the
transportation of raw materials such as timber. Also, the people’s shipping fleet was larger
compared to other domestic shipping fleets (Karana, 2003). The flexibility and low cost
made people’s shipping a very popular sector. Another study by Jinca (2001) emphasises
that the sector saw peak popularity in 2001 with a total share of national inter-island trade
of 16–24 percent, while 70 percent of vessels were larger than 200GT. The peak trend
led to 15 voyages per vessel per year, and the number of people employed was 75,411.
The employment rate eventually reduced because the fleet size had decreased by 1996
declined compared to 1884.
The PELRA sector in 2000 saw a declining trend. The number of vessels increased to
3,000, but the amount of cargo transported decreased significantly. There are some
possible reasons for this. First, the replacement of the president in Indonesia in 1998 led
to a massive economic crisis and mass protests across the country. This impacted on the
sea transportation industry, either directly or indirectly. Second, the revitalisation of the
shipping industry after the crisis also had an effect. The shipping industry became more
competitive since a lot of investment was aimed at the conventional shipping market, and
the PELRA sector faced fierce competition from conventional vessels. The industry
produced fewer trips per year than in 1996 but created more employment due to the
increasing in the number of ships. However, the benefits of increased employment did
not last long because the cargo capacity in GT was higher than the volume cargo carried
per year. This resulted in a decrease in the size of the people’s shipping industry.
In 2014, the size of the people’s shipping fleet was halved, while the total volume carried
was only one-fifth of the volume cargo in 2000. The result was people’s shipping
produced fewer trips per year, which was not profitable for the companies. The average
vessel size varied from 20GT to 500GT because some of the large wooden ships from
the local shipping sector blended into the people’s shipping sector. In the past, these
sectors had been separated due to their different roles in transporting goods; then, they
combined. The fierce competition that resulted in reduction in the size of the industry
6 the characteristic of the fleet size (<175GT) as explained by Dick (1986) and Veldman (1990)
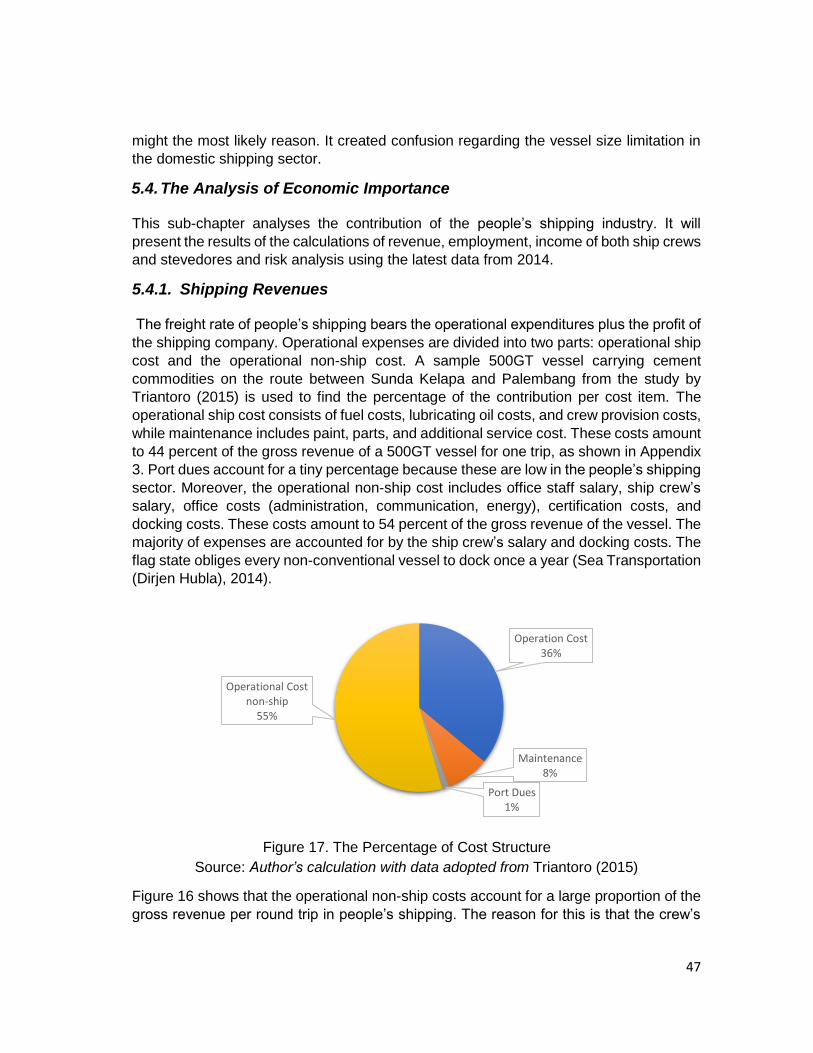
47
might the most likely reason. It created confusion regarding the vessel size limitation in
the domestic shipping sector.
5.4. The Analysis of Economic Importance
This sub-chapter analyses the contribution of the people’s shipping industry. It will
present the results of the calculations of revenue, employment, income of both ship crews
and stevedores and risk analysis using the latest data from 2014.
5.4.1. Shipping Revenues
The freight rate of people’s shipping bears the operational expenditures plus the profit of
the shipping company. Operational expenses are divided into two parts: operational ship
cost and the operational non-ship cost. A sample 500GT vessel carrying cement
commodities on the route between Sunda Kelapa and Palembang from the study by
Triantoro (2015) is used to find the percentage of the contribution per cost item. The
operational ship cost consists of fuel costs, lubricating oil costs, and crew provision costs,
while maintenance includes paint, parts, and additional service cost. These costs amount
to 44 percent of the gross revenue of a 500GT vessel for one trip, as shown in Appendix
3. Port dues account for a tiny percentage because these are low in the people’s shipping
sector. Moreover, the operational non-ship cost includes office staff salary, ship crew’s
salary, office costs (administration, communication, energy), certification costs, and
docking costs. These costs amount to 54 percent of the gross revenue of the vessel. The
majority of expenses are accounted for by the ship crew’s salary and docking costs. The
flag state obliges every non-conventional vessel to dock once a year (Sea Transportation
(Dirjen Hubla), 2014).
Source: Author’s calculation with data adopted from Triantoro (2015)
Figure 16 shows that the operational non-ship costs account for a large proportion of the
gross revenue per round trip in people’s shipping. The reason for this is that the crew’s
Figure 17. The Percentage of Cost Structure
Operation Cost36%
Maintenance8%
Port Dues1%
Operational Cost non-ship
55%

48
salary and docking costs account for significant expenses. Docking costs are separate
from maintenance costs because these unconventional vessels must dock once a year,
while maintenance costs occur during voyages. However, it is doubtful that maintenance
costs account for a significant amount. Practically, companies tend to reduce
maintenance costs as the control from the flag state is still weak. It is likely that the
company determines the freight rate based mainly on the voyage cost, and they can
manage non-ship operation expenses to obtain more profit.
Table 13 shows samples of freight rates from major routes in the people’s shipping
industry. The most important routes are the south–north routes* that connect Java to
Kalimantan and Sumatera, as shown in Figure 14. The importance of the east–west route
that is dominated by the ports in East and West Nusa Tenggara is reduced because the
east–west route faces new competition from the small container vessel service (Sea-Toll
programme). It serves the same ports in the southern area of eastern Indonesia. Further
detail of the freight rate samples is given in Appendix.2.
Table 13. List Freight Rate from Major Routes
Route Freight Rate
(USD per Ton) (2014) Distance (nm)
Sunda Kelapa - Makassar
$94.7
785 nm $94.7
$138.1
Sunda Kelapa - Kalimas
$73.0
388 nm $78.9
$134.1
Sunda Kelapa - Palembang* $13.0 340 nm
Kalimas - Sorong $157.8
1816 nm $159.8
Kalimas - Balikpapan* $81.3
Kalimas - Sampit* $44.7 360 nm
$61.0 360 nm
Kalimas - Tanjung Selor $243.9
Kalimas - Banjarmasin* $36.6 273 nm
Makassar - Kalimas
$71.0
443 nm $78.9
$157.8
Makassar - Sunda Kelapa
$110.5
785 nm $129.4
$130.2
Sorong - Kalimas $143.6
1816 nm $149.9

49
Route Freight Rate
(USD per Ton) (2014) Distance (nm)
$165.7
Belawan - Kalimas
$86.8
1104 nm $142.0
$157.8
Source: Author elaboration adopted from Triantoro (2015), Prasetyo (2017) and author
field survey
The routes from Kalimas to Sampit and Banjarmasin are the busiest in the people’s
shipping sector, with almost 1,500 calls made during 2009–2013. The distance from
Kalimas to Banjarmasin is 273 nautical miles, and from Kalimas to Sampit is 360 nautical
miles. Therefore, the freight rate for Kalimas–Sampit is chosen to represent the average
freight rate in the people’s shipping sector. First, Kalimas–Sampit is one of the most
important routes for people’s shipping. The freight rate for a distance of 360 nautical miles
covers the routes to the ports that are traditionally served by people’s shipping fleet from
the main hub ports such as Sunda Kelapa, Kalimas, and Paotere Makassar port. Figure
14 shows that a radius of 360 nautical miles from Kalimas port covers Pangkalan Bun,
Banjarmasin, Sampit, and Waingapu. It covers Panjang, Palembang, Tanjung Pandan,
and Belinju from Sunda Kelapa port. It also covers most of the ports in Sulawesi, East
Kalimantan, and East Nusa Tenggara from Makassar port.

50
Fig
ure
18. T
he R
adiu
s C
ove
rag
e o
f S
ele
cte
d F
reig
ht
Ra
te
So
urc
e:
Au
tho
r E
lab
ora
tio
n v
ia (
Ma
ps,
201
7)
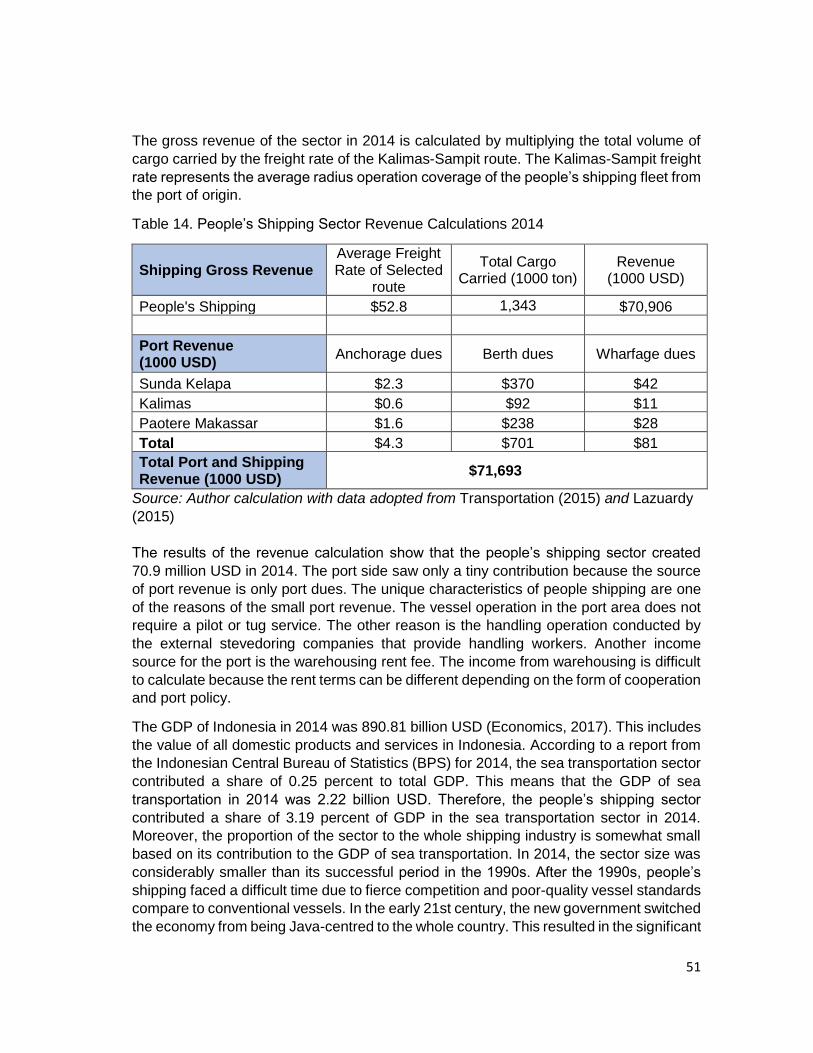
51
The gross revenue of the sector in 2014 is calculated by multiplying the total volume of
cargo carried by the freight rate of the Kalimas-Sampit route. The Kalimas-Sampit freight
rate represents the average radius operation coverage of the people’s shipping fleet from
the port of origin.
Table 14. People’s Shipping Sector Revenue Calculations 2014
Shipping Gross Revenue Average Freight Rate of Selected
route
Total Cargo Carried (1000 ton)
Revenue (1000 USD)
People's Shipping $52.8 1,343 $70,906
Port Revenue (1000 USD)
Anchorage dues Berth dues Wharfage dues
Sunda Kelapa $2.3 $370 $42
Kalimas $0.6 $92 $11
Paotere Makassar $1.6 $238 $28
Total $4.3 $701 $81
Total Port and Shipping Revenue (1000 USD)
$71,693
Source: Author calculation with data adopted from Transportation (2015) and Lazuardy
(2015)
The results of the revenue calculation show that the people’s shipping sector created
70.9 million USD in 2014. The port side saw only a tiny contribution because the source
of port revenue is only port dues. The unique characteristics of people shipping are one
of the reasons of the small port revenue. The vessel operation in the port area does not
require a pilot or tug service. The other reason is the handling operation conducted by
the external stevedoring companies that provide handling workers. Another income
source for the port is the warehousing rent fee. The income from warehousing is difficult
to calculate because the rent terms can be different depending on the form of cooperation
and port policy.
The GDP of Indonesia in 2014 was 890.81 billion USD (Economics, 2017). This includes
the value of all domestic products and services in Indonesia. According to a report from
the Indonesian Central Bureau of Statistics (BPS) for 2014, the sea transportation sector
contributed a share of 0.25 percent to total GDP. This means that the GDP of sea
transportation in 2014 was 2.22 billion USD. Therefore, the people’s shipping sector
contributed a share of 3.19 percent of GDP in the sea transportation sector in 2014.
Moreover, the proportion of the sector to the whole shipping industry is somewhat small
based on its contribution to the GDP of sea transportation. In 2014, the sector size was
considerably smaller than its successful period in the 1990s. After the 1990s, people’s
shipping faced a difficult time due to fierce competition and poor-quality vessel standards
compare to conventional vessels. In the early 21st century, the new government switched
the economy from being Java-centred to the whole country. This resulted in the significant
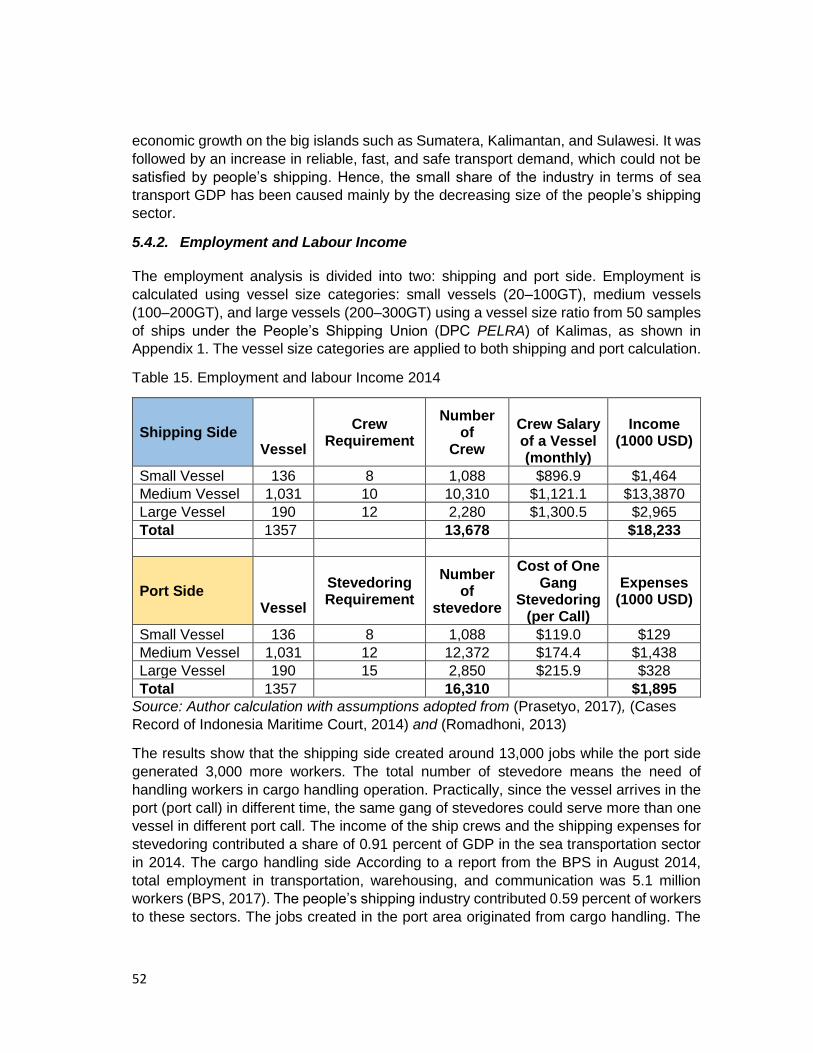
52
economic growth on the big islands such as Sumatera, Kalimantan, and Sulawesi. It was
followed by an increase in reliable, fast, and safe transport demand, which could not be
satisfied by people’s shipping. Hence, the small share of the industry in terms of sea
transport GDP has been caused mainly by the decreasing size of the people’s shipping
sector.
5.4.2. Employment and Labour Income
The employment analysis is divided into two: shipping and port side. Employment is
calculated using vessel size categories: small vessels (20–100GT), medium vessels
(100–200GT), and large vessels (200–300GT) using a vessel size ratio from 50 samples
of ships under the People’s Shipping Union (DPC PELRA) of Kalimas, as shown in
Appendix 1. The vessel size categories are applied to both shipping and port calculation.
Table 15. Employment and labour Income 2014
Shipping Side
Vessel
Crew Requirement
Number of
Crew
Crew Salary of a Vessel (monthly)
Income (1000 USD)
Small Vessel 136 8 1,088 $896.9 $1,464
Medium Vessel 1,031 10 10,310 $1,121.1 $13,3870
Large Vessel 190 12 2,280 $1,300.5 $2,965
Total 1357 13,678 $18,233
Port Side
Vessel
Stevedoring Requirement
Number of
stevedore
Cost of One Gang
Stevedoring (per Call)
Expenses (1000 USD)
Small Vessel 136 8 1,088 $119.0 $129
Medium Vessel 1,031 12 12,372 $174.4 $1,438
Large Vessel 190 15 2,850 $215.9 $328
Total 1357 16,310 $1,895
Source: Author calculation with assumptions adopted from (Prasetyo, 2017), (Cases
Record of Indonesia Maritime Court, 2014) and (Romadhoni, 2013)
The results show that the shipping side created around 13,000 jobs while the port side
generated 3,000 more workers. The total number of stevedore means the need of
handling workers in cargo handling operation. Practically, since the vessel arrives in the
port (port call) in different time, the same gang of stevedores could serve more than one
vessel in different port call. The income of the ship crews and the shipping expenses for
stevedoring contributed a share of 0.91 percent of GDP in the sea transportation sector
in 2014. The cargo handling side According to a report from the BPS in August 2014,
total employment in transportation, warehousing, and communication was 5.1 million
workers (BPS, 2017). The people’s shipping industry contributed 0.59 percent of workers
to these sectors. The jobs created in the port area originated from cargo handling. The
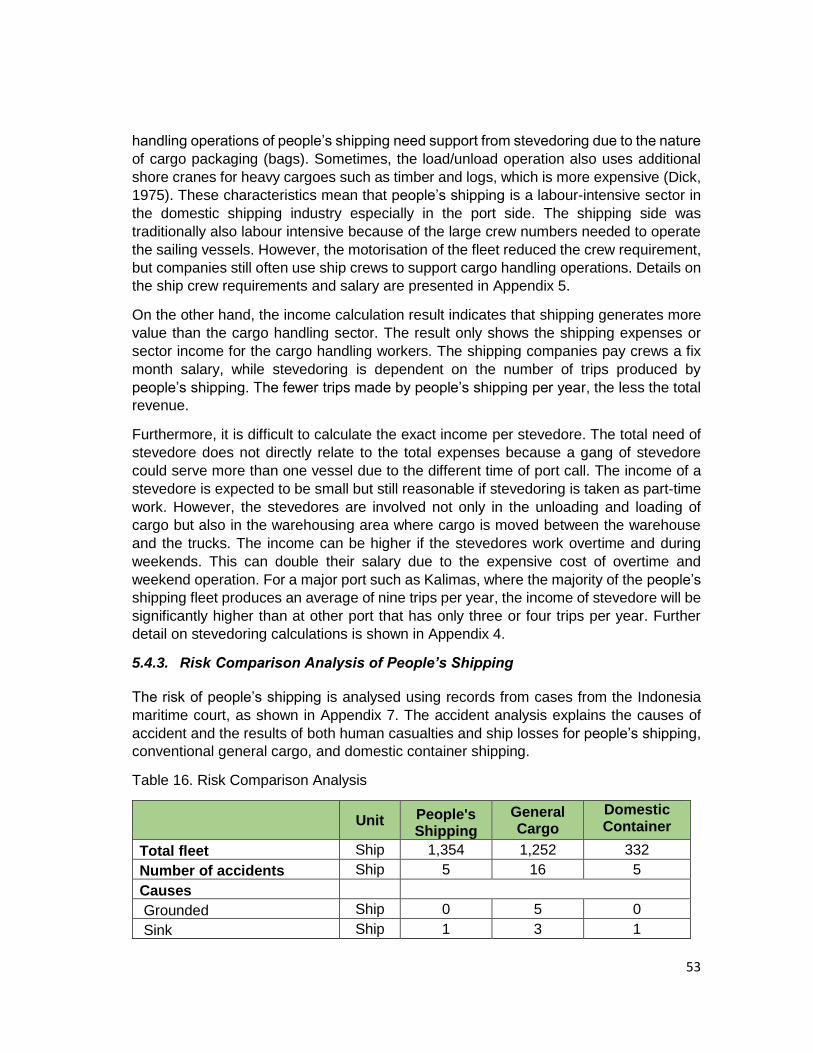
53
handling operations of people’s shipping need support from stevedoring due to the nature
of cargo packaging (bags). Sometimes, the load/unload operation also uses additional
shore cranes for heavy cargoes such as timber and logs, which is more expensive (Dick,
1975). These characteristics mean that people’s shipping is a labour-intensive sector in
the domestic shipping industry especially in the port side. The shipping side was
traditionally also labour intensive because of the large crew numbers needed to operate
the sailing vessels. However, the motorisation of the fleet reduced the crew requirement,
but companies still often use ship crews to support cargo handling operations. Details on
the ship crew requirements and salary are presented in Appendix 5.
On the other hand, the income calculation result indicates that shipping generates more
value than the cargo handling sector. The result only shows the shipping expenses or
sector income for the cargo handling workers. The shipping companies pay crews a fix
month salary, while stevedoring is dependent on the number of trips produced by
people’s shipping. The fewer trips made by people’s shipping per year, the less the total
revenue.
Furthermore, it is difficult to calculate the exact income per stevedore. The total need of
stevedore does not directly relate to the total expenses because a gang of stevedore
could serve more than one vessel due to the different time of port call. The income of a
stevedore is expected to be small but still reasonable if stevedoring is taken as part-time
work. However, the stevedores are involved not only in the unloading and loading of
cargo but also in the warehousing area where cargo is moved between the warehouse
and the trucks. The income can be higher if the stevedores work overtime and during
weekends. This can double their salary due to the expensive cost of overtime and
weekend operation. For a major port such as Kalimas, where the majority of the people’s
shipping fleet produces an average of nine trips per year, the income of stevedore will be
significantly higher than at other port that has only three or four trips per year. Further
detail on stevedoring calculations is shown in Appendix 4.
5.4.3. Risk Comparison Analysis of People’s Shipping
The risk of people’s shipping is analysed using records from cases from the Indonesia
maritime court, as shown in Appendix 7. The accident analysis explains the causes of
accident and the results of both human casualties and ship losses for people’s shipping,
conventional general cargo, and domestic container shipping.
Table 16. Risk Comparison Analysis
Unit People's
Shipping
General Cargo
Domestic Container
Total fleet Ship 1,354 1,252 332
Number of accidents Ship 5 16 5
Causes
Grounded Ship 0 5 0
Sink Ship 1 3 1

54
Unit People's
Shipping
General Cargo
Domestic Container
Collision Ship 6 3
Fire Ship
Collision and sink Ship 3 1 1
Fire and sink Ship 1 1 0
Result:
Human
Human injury Person 2 0 0
Human loss Person 9 12 1
Ship
Ship partial loss Ship 0 7 3
Ship total loss Ship 5 5 2
No damage Ship 0 3 0
Percentage:
Percentage of accident to total fleet
per cent
0.37% 1.28% 1.51%
Percentage of ship partial loss to number of accident
per cent
0.00% 43.75% 60.00%
Percentage of ship total loss to number of accident
per cent
100.00% 31.25% 40.00%
Percentage of no damage taken to number of accident
per cent
0.00% 18.75% 0.00 %
Source: Author calculation with data adopted from Cases Record of Indonesia Maritime
Court (2014), Prasetyo (2017), Indonesia (BKI) (2014) and Transportation (2015)
Collisions with other vessels is one of the leading causes of accidents in people’s
shipping, resulting in the ship sinking or total losses in five cases. Accidents in 2014 saw
nine human losses and two injuries. The poor quality of the ships and the lack of safety
equipment could be the biggest factor. Accidents in general cargo shipping amount to
31.25 percent of total loses from 16 cases, which is a lower risk. Most accidents are
caused by collisions and grounding. Grounding cases rarely causes significant damage
to the vessel. Domestic container shipping also accounted for a slightly higher risk than
general cargo due to the smaller size of the fleet compared to other shipping sectors.
Nevertheless, the percentage of accidents in the total fleet shows a contrary result.
People’s shipping carries less risk of accidents than other domestic shipping sectors.
Conventional cargo shipping also accounts for a higher number of human casualties than
people’s shipping. The general cargo shipping sector consists of larger vessels that
requires larger crew numbers, which might be the most likely reason.
.
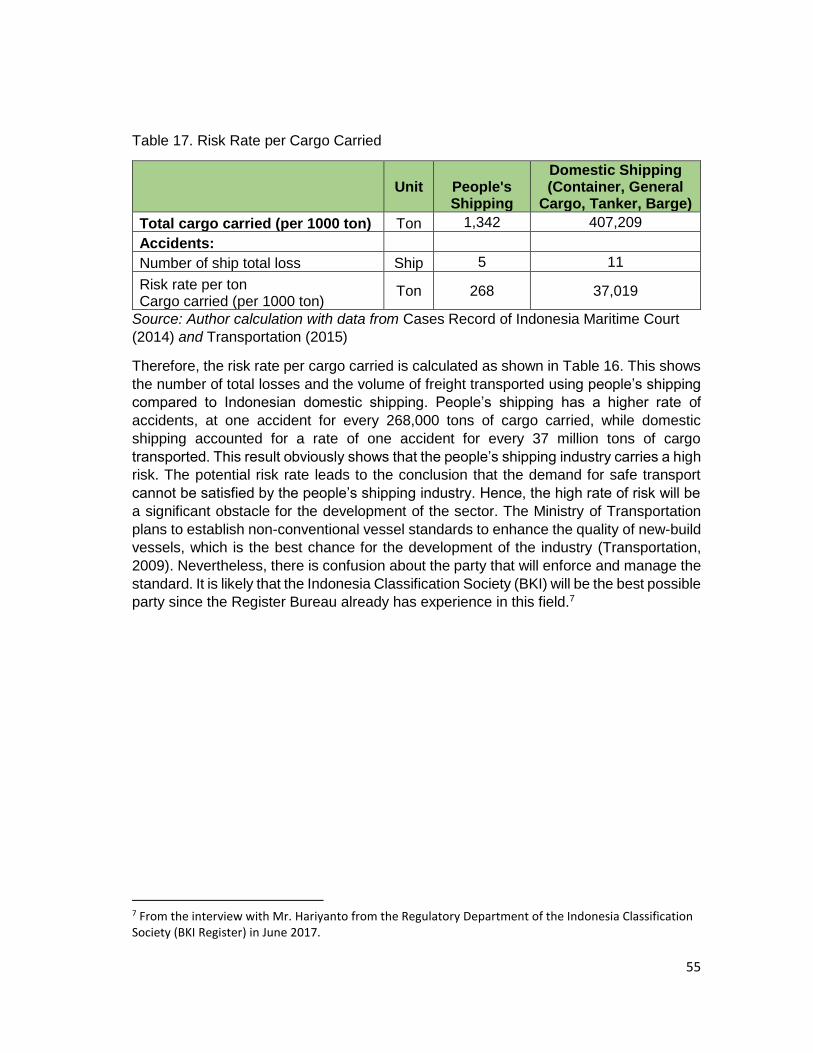
55
Table 17. Risk Rate per Cargo Carried
Unit People's
Shipping
Domestic Shipping (Container, General
Cargo, Tanker, Barge)
Total cargo carried (per 1000 ton) Ton 1,342 407,209
Accidents:
Number of ship total loss Ship 5 11
Risk rate per ton Cargo carried (per 1000 ton)
Ton 268 37,019
Source: Author calculation with data from Cases Record of Indonesia Maritime Court
(2014) and Transportation (2015)
Therefore, the risk rate per cargo carried is calculated as shown in Table 16. This shows
the number of total losses and the volume of freight transported using people’s shipping
compared to Indonesian domestic shipping. People’s shipping has a higher rate of
accidents, at one accident for every 268,000 tons of cargo carried, while domestic
shipping accounted for a rate of one accident for every 37 million tons of cargo
transported. This result obviously shows that the people’s shipping industry carries a high
risk. The potential risk rate leads to the conclusion that the demand for safe transport
cannot be satisfied by the people’s shipping industry. Hence, the high rate of risk will be
a significant obstacle for the development of the sector. The Ministry of Transportation
plans to establish non-conventional vessel standards to enhance the quality of new-build
vessels, which is the best chance for the development of the industry (Transportation,
2009). Nevertheless, there is confusion about the party that will enforce and manage the
standard. It is likely that the Indonesia Classification Society (BKI) will be the best possible
party since the Register Bureau already has experience in this field.7
7 From the interview with Mr. Hariyanto from the Regulatory Department of the Indonesia Classification Society (BKI Register) in June 2017.

56
57
Chapter 6 Conclusions and Recommendations
The people’s shipping industry already survived through the decades of Indonesia
domestic shipping industry. This shipping industry transformed from the pure traditional
shipping to the semi-traditional shipping as the result of the establishment of motorisation,
the adaptation from the regulation and fierce competition.
6.1. The Key Findings of People’s Shipping
The people’s shipping (PELRA) is considered as an informal sea transport sector. It plays
an important role in some routes and markets. The size of the sector has decreased over
time due to the declining demand for transport via the people’s shipping. The main source
of the transport demand is the excess demand for conventional cargo shipping and
container shipping. The remote areas with limited accessibility also provide a market for
PELRA as the ships can operate in a limited draft. The most important route is the south-
north route which connects Sumatera, Java, Kalimantan, and Sulawesi. It links the major
port cities in Java with the cities in Kalimantan and Sumatera, which use the river for
transporting goods. The pattern of cargo movement shows that the origins of the primary
commodities are Java and Sulawesi.
Furthermore, in 2014, the whole sector recorded an average of only three trips per year.
Surprisingly, the vessels in the port of Kalimas undertook many voyages per year with
nine trips. This means that the people’s shipping in Kalimas was more productive than
the national average. Moreover, the PELRA sector’s gross revenue contributed a 3.19
per cent share to Indonesia’s GDP of sea transport in 2014. The sector employed almost
30,000 workers in both shipping and port side. It accounted for only 0.59 per cent of the
workers in the total employment in the transport, warehousing and communication
sectors. The income of ship crews and expenses of stevedoring contributed a share of
0.91 per cent to the GDP of sea transport in 2014. Based on these results, it can be
concluded that the people’s shipping is a small shipping industry. The sector is
considerably smaller than it was during its most successful period in the 1990s. One of
the reasons for this is the significant economic growth in the big islands such as
Sumatera, Kalimantan, and Sulawesi, which boosted the trade volume between the
islands during the period 2000-2014. This was followed by the increase in the demand
for reliable, fast, and safe transport, which is obviously not satisfied by the people’s
shipping due to the poor quality of the vessels. Therefore, the small contribution of the
industry to the GDP of sea transport is mainly caused by the decreasing size of the
PELRA sector over time.
Furthermore, the sector has a higher risk rate per cargo carried than other domestic
shipping, and society tends to demand fast, reliable, and safe sea transport. The safety
problem must be tackled to attract the consumers and generate a higher demand for
transport. The government intends to bring the industry into the formal sector with the
changes in the technical standard in the new building regarding ship drawing standards
and safety. The government will invest in many ships via local dedicated wooden
58
shipyards to supply additional vessels to the shipping industry. Therefore, the cost of
people’s shipping will increase as a result of the improvement in ship quality and
operation.
Moreover, the role of the informal transport sector will decrease or increase depends to
the rate of development in the region it serves. Since the Indonesia has thousands of
islands and the economic development would spread to across the archipelago, in which
takes a long time, the market niche will always available for the people’s shipping. It
means that the role of people’s shipping as feeder to serve the isolated areas would not
disappear in the short time. However, consider that the people’s shipping operates in the
hub and spoke instead of a liner, the market from the small island would not be as bigger
as market size of big islands such as Java, Sumatera, Kalimantan and Sulawesi8. These
characteristics of operation and market trends would potentially reduce the fleet and
vessel dimension in the future.
6.2. The Recommendations
The people’s shipping is a small sea transport sector which still plays a significant role in
the inter-island trade especially for the customer from low financial class and isolated
areas. The route from west area to eastern Indonesia has a new competitor from the
container liner service under the Sea-Toll program. The government should include
people’s shipping as a hub and spoke operation which focuses on the south-north route
which connects port cities in Java, and towns in Kalimantan, Sulawesi and Sumatera.
The people’s shipping can operate as complimentary transport for other domestic
shipping (conventional shipping) under the Sea-Toll program. It can fill the market niche
which cannot be served by the conventional shipping services. Regarding regulation, the
regulation of docking schedule for the non-conventional vessel forced the people’s
shipping fleet to dock in the shipyard once in a year. Since docking is costly, it is possible
that the ship operator will ignore the docking schedule. It creates a problem with the port
state control which controls the vessel traffic and ensures the safety operation of the ship
in the port (the flag state). This negative effect can be reduced by non-conventional
vessel standard (NCVS).
The enforcement of NCVS as new technical and safety standard can be managed by the
Indonesia Classification Society (BKI) which already had experience with the ship
register. It needs a proper coordination with people’s shipping union (DPC) as the
representative of the people’s shipping industry. At the same time, the government must
ensure the availability of the raw material for ship building. Both shipyard and shipping
need a finance support from the government such as ease of tax. The well-standardised
vessel can give longer dock schedule, from once in a year to once in few years, in which
lead to less docking cost. However, the improvement of the vessel quality and
management will increase the cost and transport price per ton of cargo. The government
could continuously subsidise the fuel to control the transport price while the government
8 The major routes of people’s shipping industry
59
can also promote the culture value of the Phinisi and other types of vessel to attract the
market.
Furthermore, further recommendation is a concern to the less trained crew in people’s
shipping. Unskilled ship crew would result in inefficient and unsafe shipping operation.
Currently, only the captain and the chief engineer have the seafarer certificate while the
rest of the crew are less educated seafarers. The crew of the people’s shipping commonly
originated from the fisheries industry, the fishermen who enter the people’s shipping
industry. The ministry of transportation, sea transport department, could tackle this
problem by holding a training workshop using the state seafarer academy. The ministry
must coordinate with the people’s shipping branch union (DPC PELRA) to support these
training and convince the ship operators about the importance of the training program.
6.3. The Limitation of This Study and Areas for Further Research
The research presents the timeline of the people’s shipping development started from the
1970s to the latest year, 2016. The economic importance, development overtime, and
cargo carried are assessed to answers all the sub- research questions. We have used
the all necessary limitations to generate a reliable result. This part will describe all the
limitation used and lead to the suggestion for further research. We had a challenge in
collecting the data about cargo throughput in people’s shipping industry. The first
limitation is the use of cargo throughput data of Sunda Kelapa, Kalimas, and Paotere port
to represent the whole people’s shipping sector. These ports are selected under the
analysis of the cargo flow pattern from the primary commodities and the port calls
recorded for several years. The data is collected from the port authority’s database and
the primary data of the previous studies. Nonetheless, there are some holes in the data
which lead to the decision of using 2014 data as base calculations. We expect that in the
future, there would be more data available in people’s shipping sector. So, the sector
could comprehensively assess for further development especially in the operation and
economic scope.
Furthermore, we also had the challenge to determine all the variables in the economic
importance assessment. All approach that used for the number of crew, stevedore and
size of the vessel are collected from the previous research concerning people’s shipping.
There are no exact rules that manage the crew requirements for each vessel. Similar
conditions also applied on the cargo handling side. Also, there is confusion about
distinguishing the local shipping and the people’s shipping. These sectors blended due
to the adaptation from fierce competition with conventional domestic shipping. Our
research shows that the vessel size concentrated between 100-300 GT with an average
size around 181 GT.
Finally, the focus of the research is the economic importance of people’s shipping that
focuses on the analysis of the selected ports Sunda Kelapa, Kalimas, and Paotere
Makassar with respect to the fact that the region behind these ports produces most of the
commodities. Then, this research is not cover the operation of people’s shipping between
the small ports. The further research can go through the complete cargo carried

60
assessment which includes the important areas such as Banjarmasin, Palembang, and
small islands in Riau Archipelago, Maluku and East Nusa Tenggara. It would give a full
picture of the people’s shipping industry.

61
Bibliography
A., Jinca, M. & Alam, S., 2013. Business Management of Traditional Shipping.
Makassar: Hassanudin University Makassar.
Antara News, T., 2015. Indonesia ready to face ASEAN economic community. [Online]
Available at: http://www.antaranews.com/en/news/99910/indonesia-ready-to-face-
asean-economic-community
[Accessed 6 July 2017].
Bank of Indonesia, T., 2017. Inflation Report (Consumer Price Index) based on the
yearly inflation calculation. [Online]
Available at: http://www.bi.go.id/id/moneter/inflasi/data/Default.aspx
[Accessed 19 08 2017].
Boerne, G., 1999. Filling the Gap: Small Inter-Island Caribbean Trading Ships and Their
Crews. 1 ed. Cardiff: Seafarers International Research Centre - Cardiff University.
Boerne, G., 1999. Preliminary Study of The East African Informal Maritime Transport
Sector - Seafarers International Research Centre. [Online]
Available at: www.sirc.cf.ac.uk/uploads/publications/Filling%20the%20gap.pdf
[Accessed 28 08 2017].
BPS, 2015. Quarterly GDP Distribution of The Sector at Actual Market Price (Percent).
[Online]
Available at: http://data.go.id/dataset/distribusi-pdb-triwulanan-atas-dasar-harga-
berlaku-menurut-lapangan-usaha
[Accessed 31 07 2017].
BPS, 2017. Citizen age more than 15 years old that work based on the major workfields
1986 - 2017. [Online]
Available at: https://www.bps.go.id/linkTabelStatis/view/id/970
[Accessed 10 08 2017].
Cases Record of Indonesia Maritime Court (2014) Indonesia Maritime Court - Ministry
of Transportation.
Cervero, R., 2000. Informal Transport in The Developing World, Nairobi: United Nations
Centre for Human Settlements.
Coyle, J. J., Novack, R. A., Gibson, B. J. & Bardi, E. J., 2011. Transportation: A Supply
Chain Perspective. 7 ed. s.l.:South-Western.
David, F. R., 2011. Strategic Management: Concept and Cases. 13rd ed. New Jersey:
Prentice Hall.
Dick, H., 1975. Prahu Shipping in Eastern Indonesia Part 1. Bulletin of Indonesian
Economic Studies, Volume 11, pp. 69-107.

62
Dick, H. W., 1986. The Indonesian Interisland Shipping Industry: An Analysis of
Competition and Regulation. Singapore: Institute of Southeast Asian Studies.
Economic Affairs, C. M. F., 2011. Masterplan for Acceleration and Expansion of
Indonesia Economic Development 2011-2025. Jakarta: Coordinating Ministry For
Economic Affairs of Indonesia.
Economics, T., 2017. Trading Economics - Indonesia GDP. [Online]
Available at: https://tradingeconomics.com/indonesia/gdp
[Accessed 11 08 2017].
Empowerment of the national shipping industry, Presidential Decree (Perpres) No.5,
Indonesia (2005).
Indonesia (BKI), B. K., 2014. Record of Vessel Inspected by Production Department -
BKI Register, s.l.: Biro Klasifikasi Indonesia.
Investments, I., 2017. Rice. [Online]
Available at: https://www.indonesia-
investments.com/business/commodities/rice/item183?
[Accessed 01 8 2017].
JICA, 2003. Study on the Development of Domestic Sea Transportation and Maritime
Industry in the Republic of Indonesia, s.l.: Japan International Corporation Agency.
Jinca, Y., 2001. The Existence of People's Shipping as Sea Transportation (Eksistensi
Transportasi Laut Pelayaran Rakyat). Denpasar, Udayana Bali.
Kalimas (DPC), D. P., 2016. Data Pelra, Surabaya: DPC Pelra Kalimas.
Kalimas, I. P. C., 2015. Throughput Tanjung Perak 2012-2015, s.l.: IPC 3.
Karana, S., 2003. People's Shipping Fleet as Inter-Islands Transportation (Armada
Pelayaran Rakyat Sebagai Sarana Transportasi Antar Pulau). Alami, Volume 8.
KNKT, N. T. S. C., 2009. The Report of Ship Accident Analysis (Laporan Analisis Trend
Kecelakaan Kapal Laut). [Online]
Available at: http://knkt.dephub.go.id/knkt/ntsc_home/ntsc.htm
[Accessed 17 7 2017].
Lazuardy, A., 2015. Comparative Study of Sea Transportation Services: Case Study of
People's Shipping and National Shipping (Studi Perbandingan Layanan Transportasi
Laut: Studi Kasus Pelayaran Rakyat dan Pelayaran Nasional). Surabaya: ITS
Surabaya.
Malisan, J., Jinca, M. & Saleng, A., 2012. Role of Human Resource in Improving
Indonesian Transport Safety Case Study; Traditional Sea Transport. International
Journal of Engineering & Technology IJET-IJENS, Volume 12, p. 122. [Online]

63
Available at: http://citeseerx.ist.psu.edu/viewdoc/summary?doi=10.1.1.419.5835
[Accessed 6 June 2017]
Maps, G., 2017. obeattie.github.io/gmaps. [Online]
Available at: : http://obeattie.github.io/gmaps-
radius/?radiusInput=360&unitSelector=na&lat=-
5.436466&lng=113.856614&z=6&u=na&r=360
[Accessed 02 08 2017].
Nikson, S., 2009. The Sea Transportation's Safety and Security Policy (Kebijakan
Keselamatan dan Keamanan Transportasi Laut). Jakarta: Bakorkamla.
Non- Conventional Vessel Standard, Ministerial Decree (KM) No. 65, Indonesia (2009).
Operation of Sea Transport Regulations, Ministerial Decree (KM) No.33, Indonesia
(2001).
Perak, P. o. T., 2014. Concept of Design and Development of Kalimas Terminal,
Surabaya: IPC 3.
Population Review, W., 2016. Indonesia Population. [Online]
Available at: http://worldpopulationreview.com/countries/indonesia-population/
[Accessed 24 April 2017].
Port of Tanjung Perak, I. 3., 2017. Report Port of Tanjung Perak 2011-2016, Surabaya:
IPC 3.
Prasetyo, L., 2017. Risk Mitigation Analysis of Traditional Vessel Operation: Case
Study of People's Shipping (Analisis Mitigasi Resiko Pengoperasian Kapal Tradisional:
Studi Kasus Pelayaran Rakyat). Surabaya: ITS Surabaya.
Prattyni, V. P., 2016. Feasibility Study of People's Shipping Facility in Paotere Port,
Makassar (Evaluasi Kelayakan Fasilitas Pelayaran Rakyat di Pelabuhan Paotere
Makassar). Yogyakarta: Universitas Gadjah Mada.
P. T., 2017. Port Trikarsa. [Online]
Available at: http://port.trikarsa.com/pelabuhan-sunda-kelapa/
[Accessed 6 June 2017].
Romadhoni, K. R., 2013. Evaluation Model of Public Policy for People's Shipping
Revitalization (Model Evaluasi Kebijakan Publik untuk Revitalisasi Pelayaran Rakyat).
[Online]
Available at: http://digilib.its.ac.id/public/ITS-paper-28417-4108100009-Paper.pdf
[Accessed 03 08 2017].
Sea Transportation (Dirjen Hubla), G. D., 2014. Regulation of Director General Sea
Transportation about Docking Schedule. [Online]
Available at: http://dephub.go.id/post/read/aturan-baru-tentang-pengedokan-kapal-

64
berbendera-indonesia-ditetapkan-60567
[Accessed 18 7 2017].
Shipping Law (UU) No.17, Indonesia (2008).
Sunaryo, 2010. Modernization and Empowerment of People's Shipping for Culture
Preservation, People's Economy and National Territory (Modernisasi dan
Pemberdayaan Armada Pelayaran Rakyat untuk Pelestarian Budaya Peningkatan
Perekonomian Rakyat dan Kesatuan wilayah NKRI). J. Pen. Transla, Volume 12, pp.
75-140.
Sunda Kelapa Kalibaru, P. o., 2017. Report 2008-2016, Jakarta: Sunda Kelapa Kalibaru
Port Authority.
Sunda Kelapa , P. o., 2016. The Report of Cargo Throughput Per Commodities:
People's Shipping in Sunda Kelapa Port (Laporan Arus Barang Berdasarkan Komoditi:
Pelayaran Rakyat di pelabuhan Sunda Kelapa), Jakarta: s.n.
Tariff and Tax of Water Transport, Ministerial Decree (PM) No. 69, Indonesia (2015).
The Classification Obligatory for Indonesian Flagged Vessel, Ministerial Decree (PM)
No. 7 (2013).
Thomas, J., 1992. Informal Economic Activity - London School of Economics
Handbook. 1 ed. Hertfordshire: Harvester Wheatsheaf.
Transportation Indonesia, M. o., 2017. The Government Commitment to Enhance The
People's Shipping Safety (Pemerintah Berkomitmen Meningkatkan Keselamatan
Pelayaran Rakyat). [Online]
Available at: http://dephub.go.id/post/read/pemerintah-berkomitmen-meningkatkan-
keselamatan-pelayaran-rakyat
[Accessed 31 08 2017].
Transportation, I. M. o., 2008. Transportation Statistics. 1 ed. Jakarta: Ministry of
Transportation.
Transportation, I. M. o., 2009. Non-Conventional Vessel Standard-Indonesian Flagged.
1 ed. Jakarta: Indonesia Ministry of Transportation.
Transportation, I. M. o., 2010. Transportation Statistics. 1 ed. Jakarta: Ministry of
Transportation.
Transportation, I. M. o., 2015. Transportation Statistics. 1 ed. Jakarta: Ministry of
Transportation.
Triantoro, W., 2015. Feasibilty Analysis of People's Shipping for The Empowerment of
Maritime Logistics Sector (Analisis Kelayakan Finansial Usaha Pelayaran Rakyat
Sebagai Upaya Penguatan Sektor Logistik Kemaritiman). s.l.:Universitas Indonesia.

65
Triantoro, W., Nurcahyo, R. & Anzil, R., 2016. Feasibility Analysis of Indonesian
Traditional Shipping. Kuala Lumpur, International Conference on Industrial Engineering
and Operations Management.
Veldman, S., 1990. Route Planning In A Central Assisted Liner system. Delft: Eburon.
Water Transport Enterprise, Ministerial Decree (PM) No. 93, Indonesia (2013).
Water Transport, Government Regulation (PP) No. 20, Indonesia (2010).
World Bank, T., 2007. Port Reform Toolkit. second ed. Washington DC: the World
Bank.
World Bank, T., 2016. Official exchange rate (LCU per US$, period average) - World
Bank. [Online]
Available at:
http://data.worldbank.org/indicator/PA.NUS.FCRF?end=2016&locations=ID&start=2008
&view=chart
[Accessed 20 08 2017].
World Bank, T., 2016. The Global Rankings 2016. [Online]
Available at: http://lpi.worldbank.org/international/global
[Accessed 27 April 2017].

66

67
Appendices
Appendix 1. The List of The Vessel from People’s Shipping Union Kalimas
Table 18. Ship Size Ratio from 50 Ships
No 7 - 100 GT GT No 100 - 200 GT GT
1 Berkat Mulia II 95 13 Mayangsari 148
2 Mitra Bahari 98 14 Usaha Bersama 140
3 Budi Makmur 35 15 Mina Abadi 147
4 Usaha Bersama 28 16 Nusa Berlian 147
5 Merdeka I 48 17 Berkat Saudara 116
No 200 - 300 GT GT 18 Dharma Kencana 117
1 Sejarah Setia 227 19 Lafina 166
2 Permadani Setia 276 20 Berkat Rahmat 132
3 Karya Saudaraku 235 21 Adila 149
4 Armada Buana 289 22 Ramadhani 149
5 Sri Muna 277 23 Ichsan 109
6 Fitrah Keluarga 202 24 Nur Aminah 117
7 Duta Kencana 244 25 Kencana Bahari 160
No 100 - 200 GT GT 26 Kartika Buana 170
1 Cakra Indah III 148 27 Fitrah Sejati 148
2 Yala Kencana 134 28 Mutiara Inti Permana 169
3 Putra Mas 149 29 Alam Makmur 109
4 Trisienda Pratiwi 173 30 Cahaya Abadi 145
5 Bintang Samudera 172 31 Hasil Karya Bersama 105
6 Trisienda Pratama 173 32 Karya Makmur 119
7 Prima Setia 170 33 Makmur Bersama 150
8 Mega Setia 101 34 Citra Buana 158
9 Araya Jaya 147 35 Citra Wiguna 148
10 Berkat Mulia 163 36 KLM Setia Tunggal 110
11 Surya Indah 142 37 Arrohmah Jaya 119
12 Griya Idola 101 38 Rajawali 146
Size Range (GT)
Ratio ship size
Vessel (2014)
Vessel per size (unit)
Vessel per size (unit) (2014)
Small 20-100 0.1 1357
135.7 136
Medium 100-200 0.76 1031.32 1031
Large 200-300 0.14 189.98 190
Total 1357
Source: Author Elaboration adopted from (Prasetyo, 2017)

68
Appendix 2. The List of Freight Rate from Major Routes and Inflation Rates
of Selected Years (2014,2015, and 2016).
Table 19. Freight Rate List from Major Routes
Route Type Year Freight
Rate (RP)
FR after Inflation
(RP) (2014)
FR after inflation
(USD) (2014) Distance
S. Kelapa - Makassar
A 2015 1,200,000 1,123,480 $94.7
785 nm B 2015 1,200,000 1,123,480 $94.7
C 2015 1,750,000 1,638,408 $138.1
S. Kelapa - Kalimas
A 2015 925,000 866,016 $73.0
388 nm B 2015 1,000,000 936,233 $78.9
C 2015 1,700,000 1,591,597 $134.1
S. Kelapa - Palembang* A 2015 165,000 154,479 $13.0 340 nm
Kalimas - Sorong A 2015 2,000,000 1,872,467 $157.8
1816 nm B 2015 2,025,000 1,895,873 $159.8
Kalimas - Balikpapan* A 2017 1,000,000 964,692 $81.3
Kalimas - Sampit* A 2017 550,000 530,580 $44.7 360 nm
B 2017 750,000 723,519 $61.0 360 nm
Kalimas - Tj Selor A 2017 3,000,000 2,894,075 $243.9
Kalimas - Banjarmasin* A 2017 450,000 434,111 $36.6 273 nm
Makassar - Kalimas
A 2015 900,000 842,610 $71.0
443 nm B 2015 1,000,000 936,233 $78.9
C 2015 2,000,000 1,872,467 $157.8
Makassar - S. Kelapa
A 2015 1,400,000 1,310,727 $110.5
785 nm B 2015 1,640,000 1,535,423 $129.4
C 2015 1,650,000 1,544,785 $130.2
Sorong - Kalimas
A 2015 1,820,000 1,703,945 $143.6
1816 nm B 2015 1,900,000 1,778,843 $149.9
C 2015 2,100,000 1,966,090 $165.7
Belawan - Kalimas
A 2015 1,100,000 1,029,857 $86.8
1104 nm B 2015 1,800,000 1,685,220 $142.0
C 2015 2,000,000 1,872,467 $157.8
Source: Author elaboration adopted from (Triantoro, 2015), (Prasetyo, 2017) and author
field survey

69
Source: Author elaboration adopted from (World Bank, 2016) and (Bank of Indonesia,
2017)
Table 20. Indonesia Inflation and Exchange Rate (USD to Rupiah)
Type Indonesia Inflation Rate
2014 2015 2016
December 8.36% 3.35% 3.02%
November 6.23% 4.89% 3.58%
October 4.83% 6.25% 3.31%
September 4.53% 6.83% 3.07%
August 3.99% 7.18% 2.79%
July 4.53% 7.26% 3.21%
June 6.70% 7.26% 3.45%
May 7.32% 7.15% 3.33%
April 7.25% 6.79% 3.60%
March 7.32% 6.38% 4.45%
February 7.75% 6.29% 4.42%
January 8.22% 6.89% 4.14%
Average
Inflation Rate 6.42% 6.38% 3.53%
Exchange rate USD to Rupiah (2014)
1 USD = 11,865 Rupiah

70
Appendix 3. The Percentage of Share of Cost to Specific Freight Rate 2014
Freight rate at 2015 165000 Rupiah/ton
GT 500 GT
Gross Revenue 181,500,000
Type of Cost Unit Total After Inflation
(Rupiah) (2014)
Share to Gross
Revenue
Operation Cost Rp65,400,000 Rp64,749,580 36.03%
Fuel cost (2014) Rp5,500 Rp55,200,000 Rp55,200,000
Lubricant Rp26,000 Rp5,200,000 Rp4,868,413
Provision Rp5,000,000 Rp5,000,000 Rp4,681,167
Maintenance Rp15,000,000 Rp14,043,500 8.26%
Paint Rp2,000,000 Rp2,000,000 Rp1,872,467
Parts and service Rp13,000,000 Rp13,000,000 Rp12,171,033
Port Dues Rp2,330,000 Rp2,181,424 1.28%
Anchorage cost Rp100 Rp100,000 Rp93,623
Berth cost Rp48 Rp480,000 Rp449,392
Wharfage cost Rp2,500 Rp1,250,000 Rp1,170,292
PELRA Union cost Rp1,000 Rp500,000 Rp468,117
Operational Cost non-ship Rp98,770,000 Rp100,525,496 54.42%
Source: Author calculation with data adopted from (Triantoro, 2015)
Table 21. Cost Structure Analysis

71
Appendix 4. The List of and The Calculation Stevedoring Cost 2014
Table 22. List Stevedoring Cost from Kalimas Port
Table 23. Stevedoring Cost Calculation Per Vessel Size
Week Day
Person Ship Person Land Area
Cost (Rupiah) (2017) Cost (Rupiah) (2017)
8 1,567,780 6 1,148,490
9 1,750,080 7 1,330,790
10 1,932,380 8 1,513,090
11 2,114,680 9 1,695,390
12 2,296,980 10 1,877,690
13 2,479,280 11 2,059,990
14 2,661,580 12 2,242,290
15 2,843,880 13 2,424,590
16 3,026,180 14 2,606,890
17 3,208,480 15 2,789,190
18 3,390,780 16 2,971,490
19 3,573,080 17 3,153,790
20 3,755,380 18 3,336,090
21 3,937,680 19 3,518,390
22 4,119,980 20 3,700,690
23 4,302,280 21 3,882,990
24 4,484,580 22 4,065,290
25 4,666,880 23 4,247,590
Week Day
Ship Size (GT)
Worker Cost (2017) (RP) Cost after inflation (2014)
(RP) Cost (USD) (2014)
20-100 8 1,567,780 1,412,452 $119.0
100-200 12 2,296,980 2,069,407 $174.4
200-300 15 2,843,880 2,562,123 $215.9
Source: Data support from Adiliya (2017) Port of Tanjung Perak
Source: Author calculation with data support from Adiliya (2017) from Port of Tanjung
Perak

72
Appendix 5. The List of and The Calculation of Ship Crew Salary 2014
Table 24. Crew Salary for 20-100 GT (Per Month)
Table 25. Crew Salary for 100-200 GT (Per Month)
Vessel 20-100 GT
No Position Salary (Rupiah) (2015)
Salary after inflation
(Rupiah) (2014)
Salary (USD) (2014)
1 Captain 2,000,000 2,128,383 $179.4
2 Deck officer 1,500,000 1,596,288 $134.5
3 Engine Foreman 1 1,500,000 1,596,288 $134.5
4 Quarter Master 1 1,000,000 1,064,192 $89.7
5 Oiler 1 1,000,000 1,064,192 $89.7
6 Oiler 2 1,000,000 1,064,192 $89.7
7 Deck Crew 1 1,000,000 1,064,192 $89.7
8 Deck Crew 2 1,000,000 1,064,192 $89.7
Total 10,641,917 $896.9
Vessel 100-200 GT
No Position Salary (Rupiah) (2015)
Salary after inflation
(Rupiah) (2014)
Salary (USD) (2014)
1 Captain 2,000,000 2,128,383 $179.4
2 Deck officer 1,500,000 1,596,288 $134.5
3 Engine Foreman 1 1,500,000 1,596,288 $134.5
4 Engine Foreman 2 1,500,000 1,596,288 $134.5
5 Quarter Master 1 1,000,000 1,064,192 $89.7
6 Oiler 1 1,000,000 1,064,192 $89.7
7 Oiler 2 1,000,000 1,064,192 $89.7
8 Deck Crew 1 1,000,000 1,064,192 $89.7
9 Deck Crew 2 1,000,000 1,064,192 $89.7
10 Deck Crew 3 1,000,000 1,064,192 $89.7
Total 13,302,396 $1,121.1
Source: Author calculation with data adopted from (Romadhoni, 2013) and (Prasetyo,
2017)
Source: Author calculation with data adopted from (Romadhoni, 2013) and (Prasetyo,
2017)

73
Table 26. Crew Salary for 200-300 GT (Per Month)
Vessel 200-300 GT
No Position Salary (Rupiah) (2015)
Salary after inflation
(Rupiah) (2014)
Salary (USD) (2014)
1 Captain 2,000,000 2,128,383 $179.4
2 Deck officer 1,500,000 1,596,288 $134.5
3 Engine Foreman 1 1,500,000 1,596,288 $134.5
4 Engine Foreman 2 1,500,000 1,596,288 $134.5
5 Quarter Master 1 1,000,000 1,064,192 $89.7
6 Quarter Master 2 1,000,000 1,064,192 $89.7
7 Oiler 1 1,000,000 1,064,192 $89.7
8 Oiler 2 1,000,000 1,064,192 $89.7
9 Deck Crew 1 1,000,000 1,064,192 $89.7
10 Deck Crew 2 1,000,000 1,064,192 $89.7
11 Deck Crew 3 1,000,000 1,064,192 $89.7
12 Deck Crew 4 1,000,000 1,064,192 $89.7
Total 15,430,779 $1,300.5
Source: Author calculation with data adopted from (Romadhoni, 2013) and (Prasetyo,
2017)

74
Appendix 6. The Calculation of Revenue from Port Dues 2014
Table 27. Port Dues Calculation
Port Dues Port (Rupiah) (2015)
Unit Kalimas Sunda Kelapa Makassar
Anchorage dues 104 102 104 GT/Days
Berth dues 916 911 916 GT/24hr
Wharfage dues 1956 1850 1956 GT
Port Dues Port (Rupiah) (2014)
Unit Kalimas Sunda Kelapa Makassar
Anchorage dues 97.3 95.5 97.3 GT/Days
Berth dues 857.2 852.5 857.2 GT/24hr
Wharfage dues 1830.4 1731.2 1830.4 GT
Port Dues Port (USD) (2014)
Unit Kalimas Sunda Kelapa Makassar
Anchorage dues $0.0082 $0.0080 $0.0082 GT/Days
Berth dues $0.0722 $0.0719 $0.0722 GT/24hr
Wharfage dues $0.1543 $0.1459 $0.1543 GT
Source: Author calculation with data adopted from (Lazuardy, 2015)
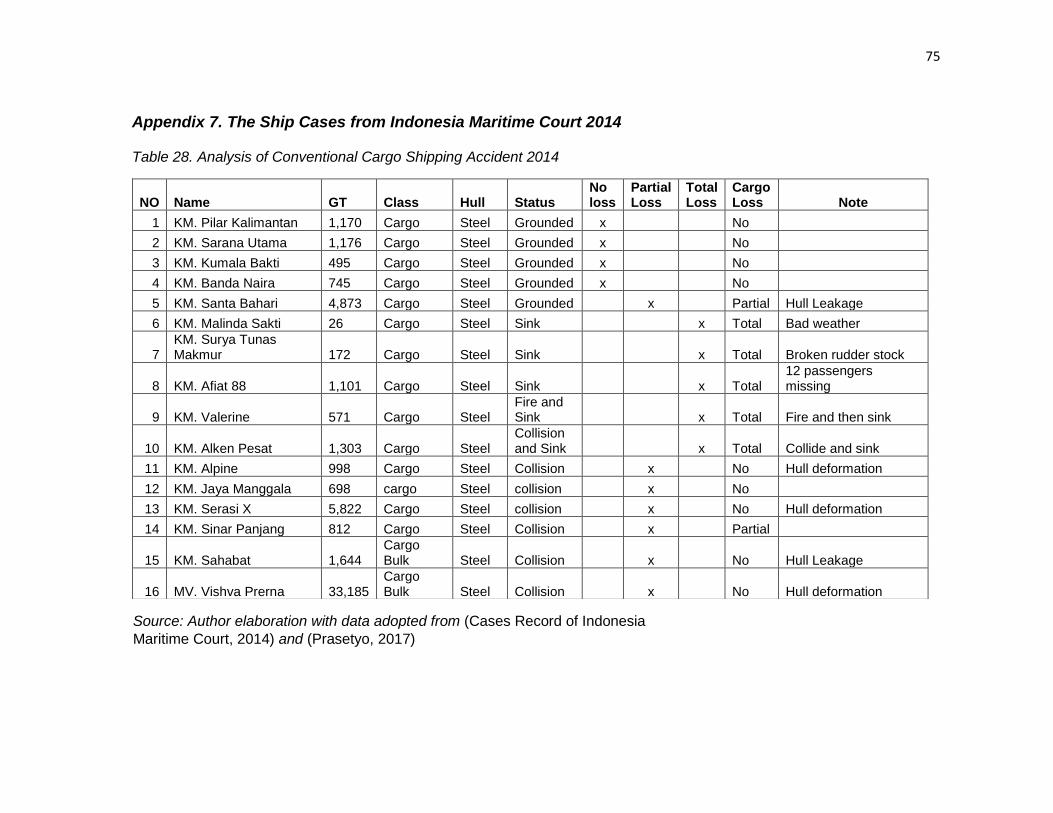
75
Appendix 7. The Ship Cases from Indonesia Maritime Court 2014
Table 28. Analysis of Conventional Cargo Shipping Accident 2014
NO Name GT Class Hull Status No loss
Partial Loss
Total Loss
Cargo Loss Note
1 KM. Pilar Kalimantan 1,170 Cargo Steel Grounded x No
2 KM. Sarana Utama 1,176 Cargo Steel Grounded x No
3 KM. Kumala Bakti 495 Cargo Steel Grounded x No
4 KM. Banda Naira 745 Cargo Steel Grounded x No
5 KM. Santa Bahari 4,873 Cargo Steel Grounded x Partial Hull Leakage
6 KM. Malinda Sakti 26 Cargo Steel Sink x Total Bad weather
7 KM. Surya Tunas Makmur 172 Cargo Steel Sink x Total Broken rudder stock
8 KM. Afiat 88 1,101 Cargo Steel Sink x Total 12 passengers missing
9 KM. Valerine 571 Cargo Steel Fire and Sink x Total Fire and then sink
10 KM. Alken Pesat 1,303 Cargo Steel Collision and Sink x Total Collide and sink
11 KM. Alpine 998 Cargo Steel Collision x No Hull deformation
12 KM. Jaya Manggala 698 cargo Steel collision x No
13 KM. Serasi X 5,822 Cargo Steel collision x No Hull deformation
14 KM. Sinar Panjang 812 Cargo Steel Collision x Partial
15 KM. Sahabat 1,644 Cargo Bulk Steel Collision x No Hull Leakage
16 MV. Vishva Prerna 33,185 Cargo Bulk Steel Collision x No Hull deformation
Source: Author elaboration with data adopted from (Cases Record of Indonesia
Maritime Court, 2014) and (Prasetyo, 2017)

76
Table 29. Analysis of People's Shipping Accident 2014
Table 30. Analysis of Container Shipping Accident 2014
NO Name GT Class Hull Status No loss
Partial Loss
Total Loss
Cargo Loss Note
1 KLM. Sumber Bahari 292 Cargo PELRA Wood Sink x Total
2 KLM. Rema Perkasa 179 Cargo PELRA Wood
Collision and Sink x Total Collide and sink
3 KM. Samudra Lestari 198
Cargo PELRA Wood
Fire and Sink x Total 2 crew injured
4 KLM. Koto Jaya 73 Cargo PELRA Wood
Collision and Sink x Total Collide and sink
5 KM. Tambah Dunung 30
Cargo PELRA wood
Collision and Sink x Total 9 casualties
NO Name GT Class Hull Status No loss
Partial Loss
Total Loss
Cargo Loss Note
1 KM. JM Dragon 3,508 Container Steel Sink x Total Bad weather
2 KM. Lintas Bahari Utama 1,654 Container Steel
Collision and Sink x Total 1 crew casualty
3 KM. Lintas Bengkulu 2,670 Container Steel Collision x No Hull deformation
4 KM Bintang Jasa 29 4,152 Container Steel Collision x No
5 KM. Mentari Persada 7,312 Container Steel Collision x No Hull deformation
Source: Author elaboration with data adopted from (Cases Record of Indonesia Maritime Court, 2014) and (Prasetyo,
2017)
Source: Author elaboration with data adopted from (Cases Record of Indonesia Maritime Court, 2014) and (Prasetyo,
2017)
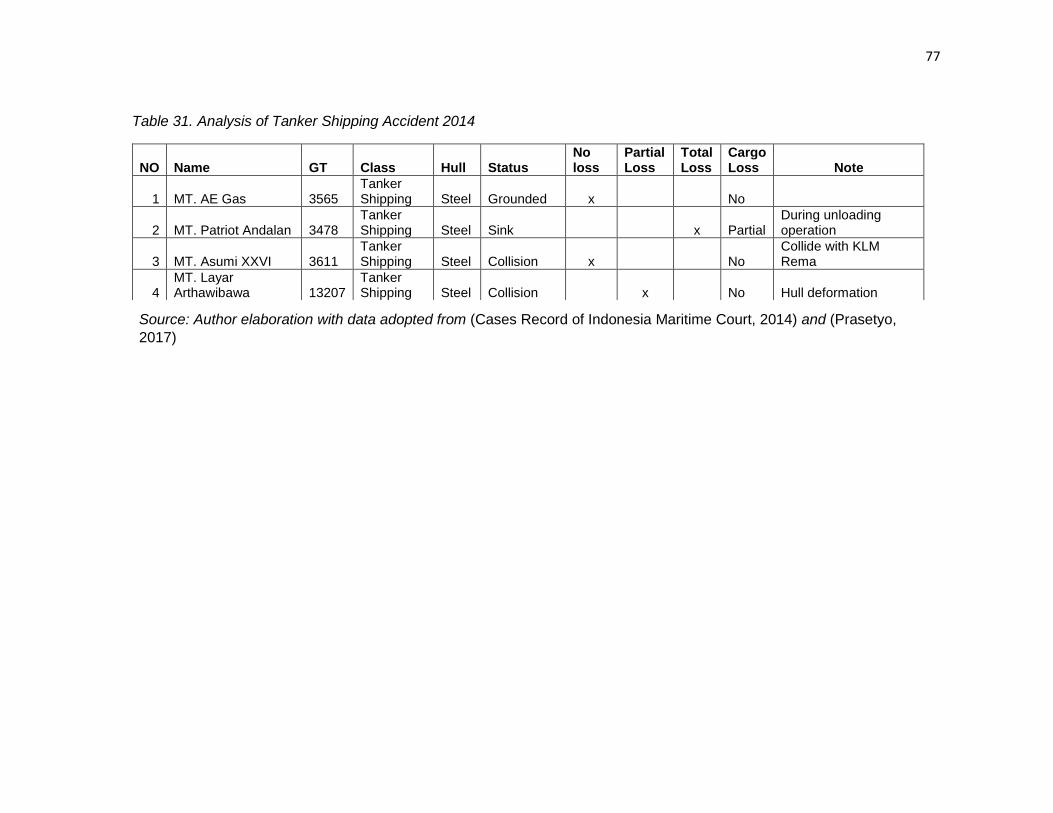
77
Table 31. Analysis of Tanker Shipping Accident 2014
NO Name GT Class Hull Status No loss
Partial Loss
Total Loss
Cargo Loss Note
1 MT. AE Gas 3565 Tanker Shipping Steel Grounded x No
2 MT. Patriot Andalan 3478 Tanker Shipping Steel Sink x Partial
During unloading operation
3 MT. Asumi XXVI 3611 Tanker Shipping Steel Collision x No
Collide with KLM Rema
4 MT. Layar Arthawibawa 13207
Tanker Shipping Steel Collision x No Hull deformation
Source: Author elaboration with data adopted from (Cases Record of Indonesia Maritime Court, 2014) and (Prasetyo,
2017)

78
Table 32. Analysis of Barge Shipping Accident 2014
NO Name GT Class Hull Status No loss
Partial Loss
Total Loss
Cargo Loss Note
1 KT. Bina Marine 99 and 92(TK) 3256 (TK)
Tug and Barge Steel Grounded x No 1 person
2 KT. ISE 5 and TK. ISE 6 794 (TK) Tug and Barge Steel Grounded x No
Propeller Broken
3 KT. Toma 01 and TK. Hasa 01 3107 (TK)
Tug and Barge Steel Grounded x Partial Hull Leakage
4 KT. Samudra Perkasa V and TK. Arung Perkasa I 3152
Tug and Barge Steel Grounded x Partial Hull Crack
5 KT. Srikandi Baruna 2402 and TK. Baruna P 3002
3039 (KT)
Tug and Barge Steel Grounded x Partial Hull Leakage
6 KT. Mega Lestari and TK. Lana Buana 183
Tug and Barge Steel Sink x Total Bad weather
7 TK. Megah Prima III and KT. Mas Papua
2257 (KT)
Tug and Barge Steel Sink x Total Bad weather
8 KT. Mitra Jaya XI and TK. Makmur Abadi III
1386 (KT)
Tug and Barge Steel Sink x Total
9 KT. Nelly 58 and TK. Nelly 58 142 Tug and Barge Steel Collision x No
Frame in Cargo Bay crack
10 KT. Entebe Megastar 83 and TK. Financia 108
5338 (KT)
Tug and Barge Steel collision x No
Hull deformation
11 TK. Kim Heng 189 and KT. Citra 3 627 (TK)
Tug and Barge Steel Collision x No Hull Leakage

79
NO Name GT Class Hull Status No loss
Partial Loss
Total Loss
Cargo Loss Note
12 KT. Charly III and TK. Sumber Anugrah III
223 (TK)
Tug and Barge Steel Collision x No
13 KT. Gressin Jaya and TK. Rahmat Jaya III
2605 (TK)
Tug and Barge Steel Collision x No
14 KT. AB 4 and TK. BB 11 1826 (TK)
Tug and Barge Steel Collision x No
15 TK. RL 3306 and KT. Ansanus XII 4255 (TK)
Tug and Barge Steel Collision x No
16 TK. Anggada II and KT. Mitra Jaya I
973 (TK)
Tug and Barge Steel Collision x No Hull Leakage
17 TK. Manna Line 808 and KT. TOB 07
3233 (TK)
Tug and Barge Steel Collision x No
Hull deformation
18 TK. Armada Kaltim 2301 and KT. Abunawas V
1421 (TK)
Tug and Barge Steel Collision x No
Hull deformation
19 KT. Mega Prima,TK. Sahabat Kapuas Mandiri XXXII
2283 (TK)
Tug and Barge Steel Collision x Partial Hull Leakage
Source: Author elaboration with data adopted from (Cases Record of Indonesia Maritime Court, 2014) and (Prasetyo,
2017)
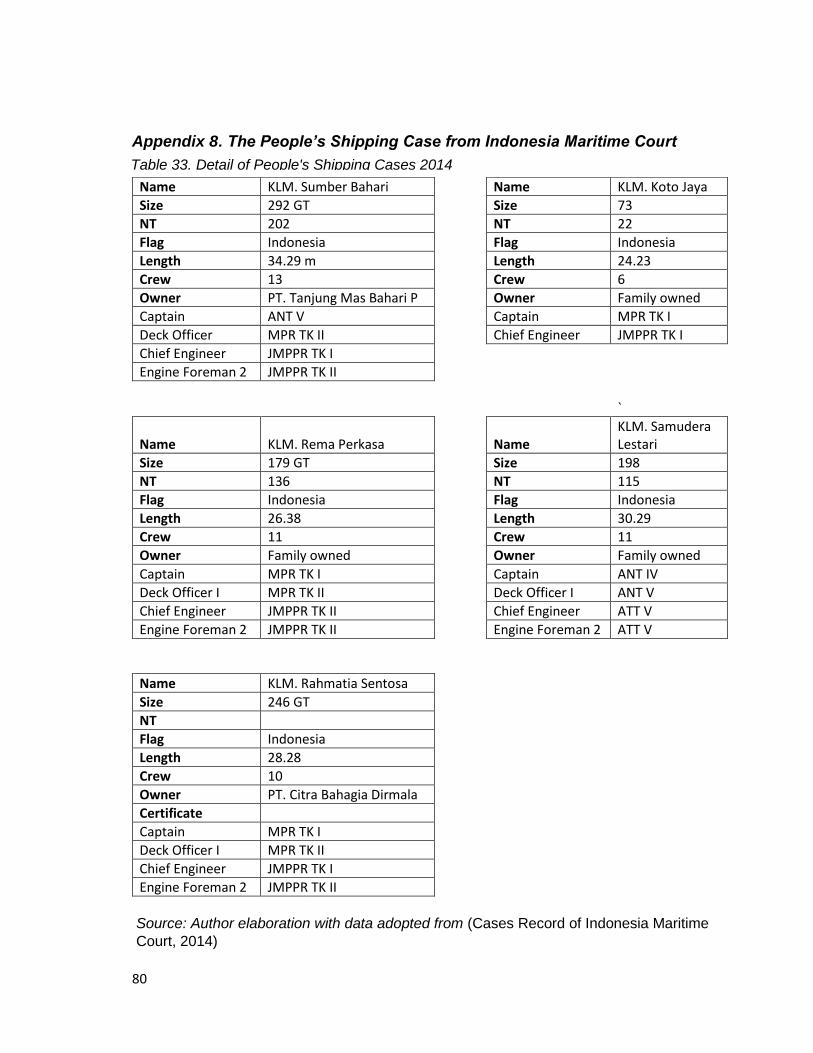
80
Appendix 8. The People’s Shipping Case from Indonesia Maritime Court
Name KLM. Sumber Bahari Name KLM. Koto Jaya
Size 292 GT Size 73
NT 202 NT 22
Flag Indonesia Flag Indonesia
Length 34.29 m Length 24.23
Crew 13 Crew 6
Owner PT. Tanjung Mas Bahari P Owner Family owned
Captain ANT V Captain MPR TK I
Deck Officer MPR TK II Chief Engineer JMPPR TK I
Chief Engineer JMPPR TK I Engine Foreman 2 JMPPR TK II
`
Name KLM. Rema Perkasa Name KLM. Samudera Lestari
Size 179 GT Size 198
NT 136 NT 115
Flag Indonesia Flag Indonesia
Length 26.38 Length 30.29
Crew 11 Crew 11
Owner Family owned Owner Family owned
Captain MPR TK I Captain ANT IV
Deck Officer I MPR TK II Deck Officer I ANT V
Chief Engineer JMPPR TK II Chief Engineer ATT V
Engine Foreman 2 JMPPR TK II Engine Foreman 2 ATT V
Name KLM. Rahmatia Sentosa Size 246 GT NT Flag Indonesia Length 28.28 Crew 10 Owner PT. Citra Bahagia Dirmala Certificate Captain MPR TK I Deck Officer I MPR TK II Chief Engineer JMPPR TK I Engine Foreman 2 JMPPR TK II Source: Author elaboration with data adopted from (Cases Record of Indonesia Maritime
Court, 2014)
Table 33. Detail of People's Shipping Cases 2014
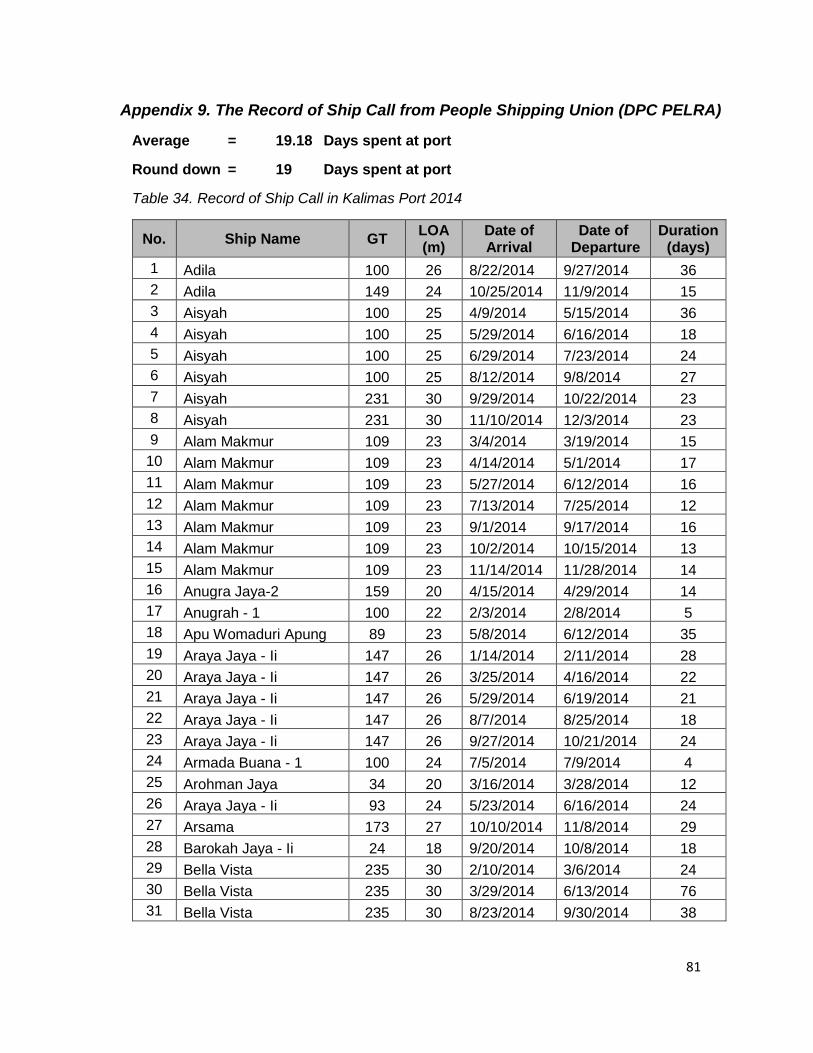
81
Appendix 9. The Record of Ship Call from People Shipping Union (DPC PELRA)
Kalimas 2014 Average = 19.18 Days spent at port
Round down = 19 Days spent at port
Table 34. Record of Ship Call in Kalimas Port 2014
No. Ship Name GT LOA (m)
Date of Arrival
Date of Departure
Duration (days)
1 Adila 100 26 8/22/2014 9/27/2014 36
2 Adila 149 24 10/25/2014 11/9/2014 15
3 Aisyah 100 25 4/9/2014 5/15/2014 36
4 Aisyah 100 25 5/29/2014 6/16/2014 18
5 Aisyah 100 25 6/29/2014 7/23/2014 24
6 Aisyah 100 25 8/12/2014 9/8/2014 27
7 Aisyah 231 30 9/29/2014 10/22/2014 23
8 Aisyah 231 30 11/10/2014 12/3/2014 23
9 Alam Makmur 109 23 3/4/2014 3/19/2014 15
10 Alam Makmur 109 23 4/14/2014 5/1/2014 17
11 Alam Makmur 109 23 5/27/2014 6/12/2014 16
12 Alam Makmur 109 23 7/13/2014 7/25/2014 12
13 Alam Makmur 109 23 9/1/2014 9/17/2014 16
14 Alam Makmur 109 23 10/2/2014 10/15/2014 13
15 Alam Makmur 109 23 11/14/2014 11/28/2014 14
16 Anugra Jaya-2 159 20 4/15/2014 4/29/2014 14
17 Anugrah - 1 100 22 2/3/2014 2/8/2014 5
18 Apu Womaduri Apung 89 23 5/8/2014 6/12/2014 35
19 Araya Jaya - Ii 147 26 1/14/2014 2/11/2014 28
20 Araya Jaya - Ii 147 26 3/25/2014 4/16/2014 22
21 Araya Jaya - Ii 147 26 5/29/2014 6/19/2014 21
22 Araya Jaya - Ii 147 26 8/7/2014 8/25/2014 18
23 Araya Jaya - Ii 147 26 9/27/2014 10/21/2014 24
24 Armada Buana - 1 100 24 7/5/2014 7/9/2014 4
25 Arohman Jaya 34 20 3/16/2014 3/28/2014 12
26 Araya Jaya - Ii 93 24 5/23/2014 6/16/2014 24
27 Arsama 173 27 10/10/2014 11/8/2014 29
28 Barokah Jaya - Ii 24 18 9/20/2014 10/8/2014 18
29 Bella Vista 235 30 2/10/2014 3/6/2014 24
30 Bella Vista 235 30 3/29/2014 6/13/2014 76
31 Bella Vista 235 30 8/23/2014 9/30/2014 38
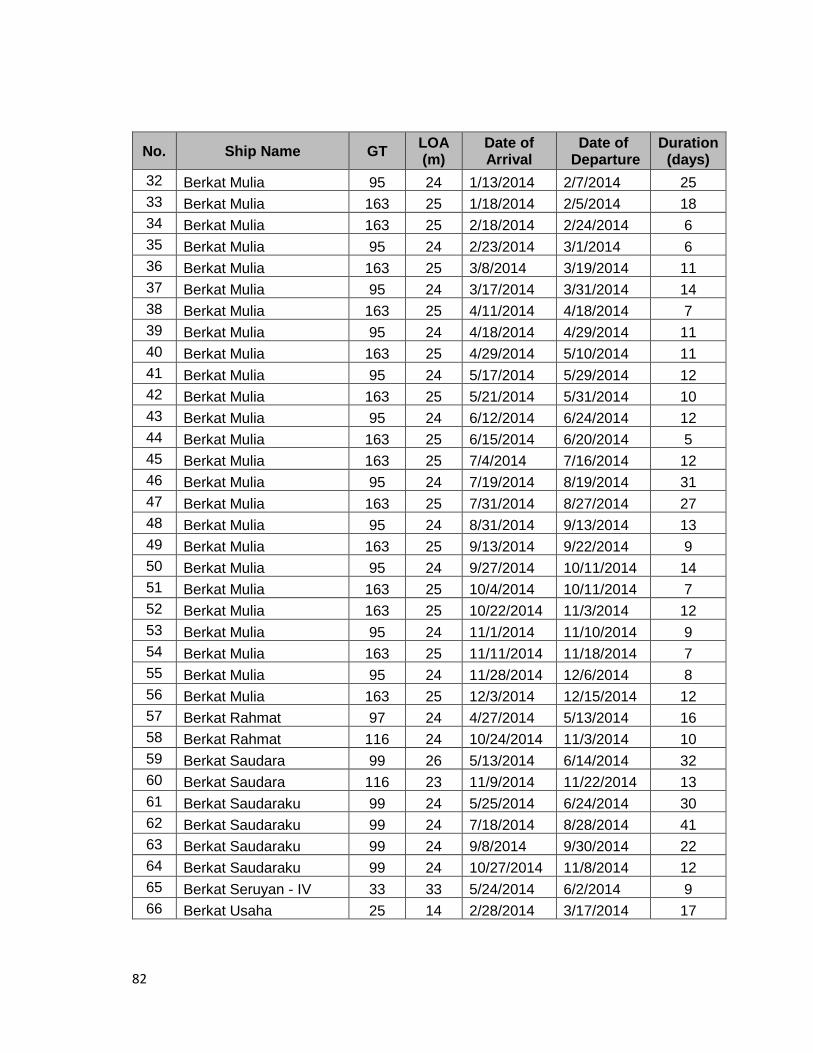
82
No. Ship Name GT LOA (m)
Date of Arrival
Date of Departure
Duration (days)
32 Berkat Mulia 95 24 1/13/2014 2/7/2014 25
33 Berkat Mulia 163 25 1/18/2014 2/5/2014 18
34 Berkat Mulia 163 25 2/18/2014 2/24/2014 6
35 Berkat Mulia 95 24 2/23/2014 3/1/2014 6
36 Berkat Mulia 163 25 3/8/2014 3/19/2014 11
37 Berkat Mulia 95 24 3/17/2014 3/31/2014 14
38 Berkat Mulia 163 25 4/11/2014 4/18/2014 7
39 Berkat Mulia 95 24 4/18/2014 4/29/2014 11
40 Berkat Mulia 163 25 4/29/2014 5/10/2014 11
41 Berkat Mulia 95 24 5/17/2014 5/29/2014 12
42 Berkat Mulia 163 25 5/21/2014 5/31/2014 10
43 Berkat Mulia 95 24 6/12/2014 6/24/2014 12
44 Berkat Mulia 163 25 6/15/2014 6/20/2014 5
45 Berkat Mulia 163 25 7/4/2014 7/16/2014 12
46 Berkat Mulia 95 24 7/19/2014 8/19/2014 31
47 Berkat Mulia 163 25 7/31/2014 8/27/2014 27
48 Berkat Mulia 95 24 8/31/2014 9/13/2014 13
49 Berkat Mulia 163 25 9/13/2014 9/22/2014 9
50 Berkat Mulia 95 24 9/27/2014 10/11/2014 14
51 Berkat Mulia 163 25 10/4/2014 10/11/2014 7
52 Berkat Mulia 163 25 10/22/2014 11/3/2014 12
53 Berkat Mulia 95 24 11/1/2014 11/10/2014 9
54 Berkat Mulia 163 25 11/11/2014 11/18/2014 7
55 Berkat Mulia 95 24 11/28/2014 12/6/2014 8
56 Berkat Mulia 163 25 12/3/2014 12/15/2014 12
57 Berkat Rahmat 97 24 4/27/2014 5/13/2014 16
58 Berkat Rahmat 116 24 10/24/2014 11/3/2014 10
59 Berkat Saudara 99 26 5/13/2014 6/14/2014 32
60 Berkat Saudara 116 23 11/9/2014 11/22/2014 13
61 Berkat Saudaraku 99 24 5/25/2014 6/24/2014 30
62 Berkat Saudaraku 99 24 7/18/2014 8/28/2014 41
63 Berkat Saudaraku 99 24 9/8/2014 9/30/2014 22
64 Berkat Saudaraku 99 24 10/27/2014 11/8/2014 12
65 Berkat Seruyan - IV 33 33 5/24/2014 6/2/2014 9
66 Berkat Usaha 25 14 2/28/2014 3/17/2014 17

83
No. Ship Name GT LOA (m)
Date of Arrival
Date of Departure
Duration (days)
67 Berkat Usaha 25 14 4/13/2014 4/18/2014 5
68 Berkat Usaha 25 14 5/11/2014 6/1/2014 21
69 Berkat Usaha 25 14 6/26/2014 7/17/2014 21
70 Berkat Usaha 25 14 8/12/2014 8/31/2014 19
71 Berkat Usaha 25 14 9/20/2014 10/20/2014 30
72 Berkat Usaha 25 14 11/16/2014 12/3/2014 17
73 Berkat Zakyah-1 99 23 2/7/2014 2/14/2014 7
74 Bintang Anggrainy.II 97 23 6/11/2014 6/27/2014 16
75 Bintang Anggrainy.II 130 23 10/9/2014 10/27/2014 18
76 Bintang Bahagia 230 36 4/29/2014 5/24/2014 25
77 Bintang Bahagia 230 36 9/2/2014 11/7/2014 66
78 Bintang Mars 100 24 3/10/2014 3/16/2014 6
79 Bintang Mars 102 24 11/13/2014 11/29/2014 16
80 Bintang Samudra 172 32 2/14/2014 3/14/2014 28
81 Bintang Samudra 172 32 4/15/2014 5/7/2014 22
82 Bintang Samudra 172 32 6/6/2014 7/9/2014 33
83 Bintang Samudra 172 32 7/29/2014 8/29/2014 31
84 Bintang Samudra 172 32 11/11/2014 12/3/2014 22
85 Bintang Subur-1 99 20 2/21/2014 3/2/2014 9
86 Bintang Subur-1 99 20 3/23/2014 3/29/2014 6
87 Budi Makmur 35 22 2/10/2014 2/27/2014 17
88 Budi Makmur 35 22 3/16/2014 3/28/2014 12
89 Budi Makmur 35 22 5/2/2014 5/12/2014 10
90 Budi Makmur 35 22 6/7/2014 6/30/2014 23
91 Budi Makmur 35 22 7/14/2014 7/22/2014 8
92 Budi Makmur 35 22 8/23/2014 9/27/2014 35
93 Budi Makmur 35 22 10/24/2014 11/15/2014 22
94 Budi Makmur 35 22 12/12/2014 12/30/2014 18
95 Bunga Buana Indah 100 24 2/5/2014 2/15/2014 10
96 Bunga Buana Indah 100 24 6/12/2014 7/10/2014 28
97 Bunga Buana Indah 100 24 8/12/2014 9/8/2014 27
98 Bunga Buana Indah 146 24 9/29/2014 10/14/2014 15
99 Bunga Buana Indah 146 27 11/6/2014 11/22/2014 16
100 Bunga Padi. 100 24 5/20/2014 6/13/2014 24
101 Bunga Padi. 100 24 9/11/2014 10/11/2014 30
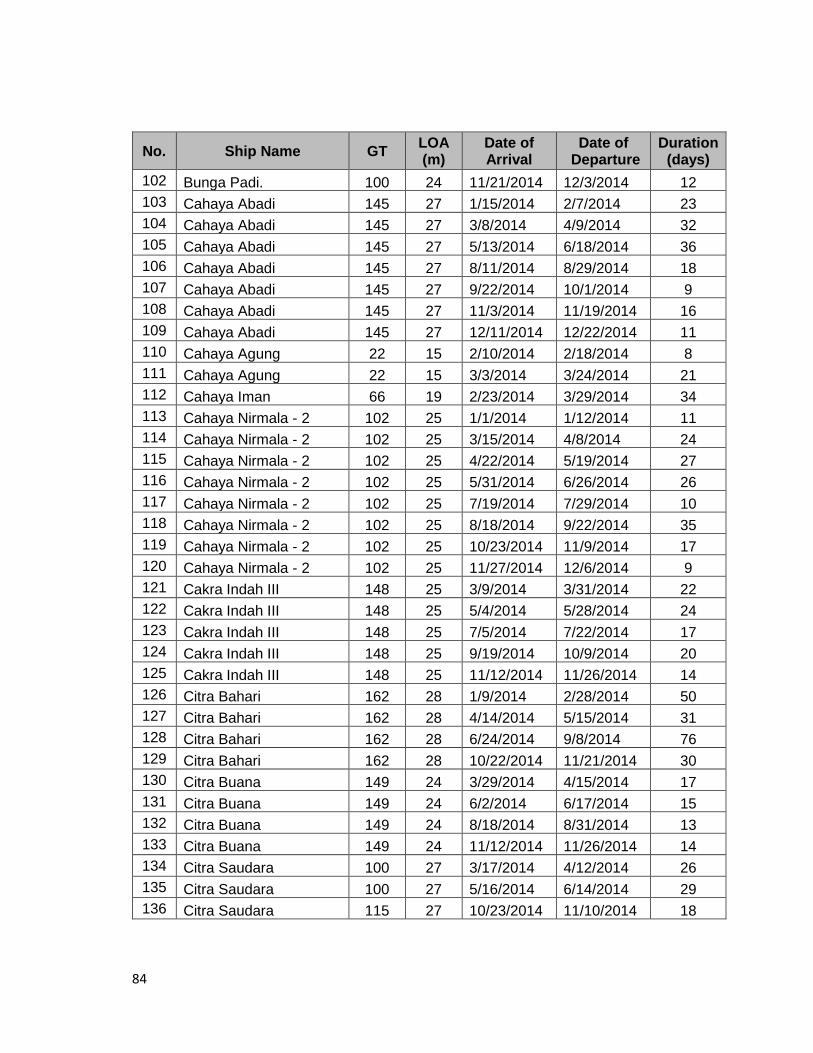
84
No. Ship Name GT LOA (m)
Date of Arrival
Date of Departure
Duration (days)
102 Bunga Padi. 100 24 11/21/2014 12/3/2014 12
103 Cahaya Abadi 145 27 1/15/2014 2/7/2014 23
104 Cahaya Abadi 145 27 3/8/2014 4/9/2014 32
105 Cahaya Abadi 145 27 5/13/2014 6/18/2014 36
106 Cahaya Abadi 145 27 8/11/2014 8/29/2014 18
107 Cahaya Abadi 145 27 9/22/2014 10/1/2014 9
108 Cahaya Abadi 145 27 11/3/2014 11/19/2014 16
109 Cahaya Abadi 145 27 12/11/2014 12/22/2014 11
110 Cahaya Agung 22 15 2/10/2014 2/18/2014 8
111 Cahaya Agung 22 15 3/3/2014 3/24/2014 21
112 Cahaya Iman 66 19 2/23/2014 3/29/2014 34
113 Cahaya Nirmala - 2 102 25 1/1/2014 1/12/2014 11
114 Cahaya Nirmala - 2 102 25 3/15/2014 4/8/2014 24
115 Cahaya Nirmala - 2 102 25 4/22/2014 5/19/2014 27
116 Cahaya Nirmala - 2 102 25 5/31/2014 6/26/2014 26
117 Cahaya Nirmala - 2 102 25 7/19/2014 7/29/2014 10
118 Cahaya Nirmala - 2 102 25 8/18/2014 9/22/2014 35
119 Cahaya Nirmala - 2 102 25 10/23/2014 11/9/2014 17
120 Cahaya Nirmala - 2 102 25 11/27/2014 12/6/2014 9
121 Cakra Indah III 148 25 3/9/2014 3/31/2014 22
122 Cakra Indah III 148 25 5/4/2014 5/28/2014 24
123 Cakra Indah III 148 25 7/5/2014 7/22/2014 17
124 Cakra Indah III 148 25 9/19/2014 10/9/2014 20
125 Cakra Indah III 148 25 11/12/2014 11/26/2014 14
126 Citra Bahari 162 28 1/9/2014 2/28/2014 50
127 Citra Bahari 162 28 4/14/2014 5/15/2014 31
128 Citra Bahari 162 28 6/24/2014 9/8/2014 76
129 Citra Bahari 162 28 10/22/2014 11/21/2014 30
130 Citra Buana 149 24 3/29/2014 4/15/2014 17
131 Citra Buana 149 24 6/2/2014 6/17/2014 15
132 Citra Buana 149 24 8/18/2014 8/31/2014 13
133 Citra Buana 149 24 11/12/2014 11/26/2014 14
134 Citra Saudara 100 27 3/17/2014 4/12/2014 26
135 Citra Saudara 100 27 5/16/2014 6/14/2014 29
136 Citra Saudara 115 27 10/23/2014 11/10/2014 18

85
No. Ship Name GT LOA (m)
Date of Arrival
Date of Departure
Duration (days)
137 Citra Ubm-I 97 24 8/27/2014 9/22/2014 26
138 Citra Wiguna 149 30 1/19/2014 2/7/2014 19
139 Citra Wiguna 149 30 3/12/2014 3/22/2014 10
140 Citra Wiguna 149 30 5/10/2014 5/24/2014 14
141 Citra Wiguna 149 30 7/13/2014 7/20/2014 7
142 Citra Wiguna 149 30 10/12/2014 10/27/2014 15
143 Duta Agung 148 30 1/8/2014 2/5/2014 28
144 Duta Agung 148 30 2/19/2014 2/27/2014 8
145 Duta Agung 148 30 3/22/2014 4/12/2014 21
146 Duta Agung 148 30 4/26/2014 5/18/2014 22
147 Duta Agung 148 30 6/17/2014 6/28/2014 11
148 Duta Agung 148 30 7/15/2014 7/24/2014 9
149 Duta Agung 148 30 9/1/2014 9/22/2014 21
150 Duta Agung 148 30 11/27/2014 12/12/2014 15
151 Duta Baruna 161 27 1/5/2014 2/5/2014 31
152 Duta Baruna 161 27 2/24/2014 3/7/2014 11
153 Duta Baruna 161 27 3/29/2014 4/14/2014 16
154 Duta Baruna 161 27 5/4/2014 5/27/2014 23
155 Duta Baruna 161 27 6/14/2014 6/24/2014 10
156 Duta Baruna 161 27 7/14/2014 7/22/2014 8
157 Duta Baruna 161 27 8/14/2014 8/30/2014 16
158 Duta Baruna 161 27 9/11/2014 9/27/2014 16
159 Duta Baruna 161 27 10/20/2014 11/8/2014 19
160 Duta Baruna 161 27 11/26/2014 12/3/2014 7
161 Duta Kencana 244 27 1/30/2014 2/13/2014 14
162 Duta Kencana 244 27 2/25/2014 3/15/2014 18
163 Duta Kencana 244 27 4/4/2014 4/21/2014 17
164 Duta Kencana 244 27 5/8/2014 5/31/2014 23
165 Duta Kencana 244 27 6/30/2014 7/9/2014 9
166 Duta Kencana 244 27 8/3/2014 8/25/2014 22
167 Duta Kencana 244 27 10/5/2014 10/18/2014 13
168 Duta Kencana 244 27 11/4/2014 11/19/2014 15
169 Duta Mulia 297 34 1/11/2014 2/5/2014 25
170 Duta Mulia 297 34 3/2/2014 3/23/2014 21
171 Duta Mulia 297 34 4/6/2014 4/29/2014 23
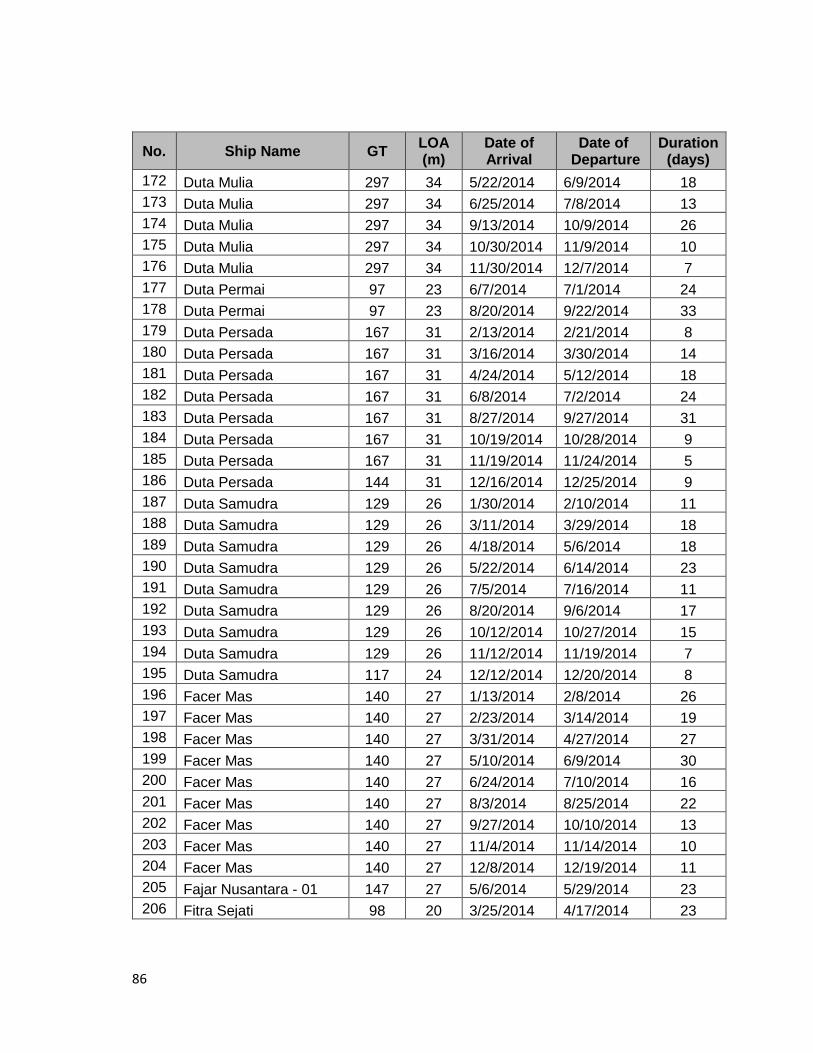
86
No. Ship Name GT LOA (m)
Date of Arrival
Date of Departure
Duration (days)
172 Duta Mulia 297 34 5/22/2014 6/9/2014 18
173 Duta Mulia 297 34 6/25/2014 7/8/2014 13
174 Duta Mulia 297 34 9/13/2014 10/9/2014 26
175 Duta Mulia 297 34 10/30/2014 11/9/2014 10
176 Duta Mulia 297 34 11/30/2014 12/7/2014 7
177 Duta Permai 97 23 6/7/2014 7/1/2014 24
178 Duta Permai 97 23 8/20/2014 9/22/2014 33
179 Duta Persada 167 31 2/13/2014 2/21/2014 8
180 Duta Persada 167 31 3/16/2014 3/30/2014 14
181 Duta Persada 167 31 4/24/2014 5/12/2014 18
182 Duta Persada 167 31 6/8/2014 7/2/2014 24
183 Duta Persada 167 31 8/27/2014 9/27/2014 31
184 Duta Persada 167 31 10/19/2014 10/28/2014 9
185 Duta Persada 167 31 11/19/2014 11/24/2014 5
186 Duta Persada 144 31 12/16/2014 12/25/2014 9
187 Duta Samudra 129 26 1/30/2014 2/10/2014 11
188 Duta Samudra 129 26 3/11/2014 3/29/2014 18
189 Duta Samudra 129 26 4/18/2014 5/6/2014 18
190 Duta Samudra 129 26 5/22/2014 6/14/2014 23
191 Duta Samudra 129 26 7/5/2014 7/16/2014 11
192 Duta Samudra 129 26 8/20/2014 9/6/2014 17
193 Duta Samudra 129 26 10/12/2014 10/27/2014 15
194 Duta Samudra 129 26 11/12/2014 11/19/2014 7
195 Duta Samudra 117 24 12/12/2014 12/20/2014 8
196 Facer Mas 140 27 1/13/2014 2/8/2014 26
197 Facer Mas 140 27 2/23/2014 3/14/2014 19
198 Facer Mas 140 27 3/31/2014 4/27/2014 27
199 Facer Mas 140 27 5/10/2014 6/9/2014 30
200 Facer Mas 140 27 6/24/2014 7/10/2014 16
201 Facer Mas 140 27 8/3/2014 8/25/2014 22
202 Facer Mas 140 27 9/27/2014 10/10/2014 13
203 Facer Mas 140 27 11/4/2014 11/14/2014 10
204 Facer Mas 140 27 12/8/2014 12/19/2014 11
205 Fajar Nusantara - 01 147 27 5/6/2014 5/29/2014 23
206 Fitra Sejati 98 20 3/25/2014 4/17/2014 23
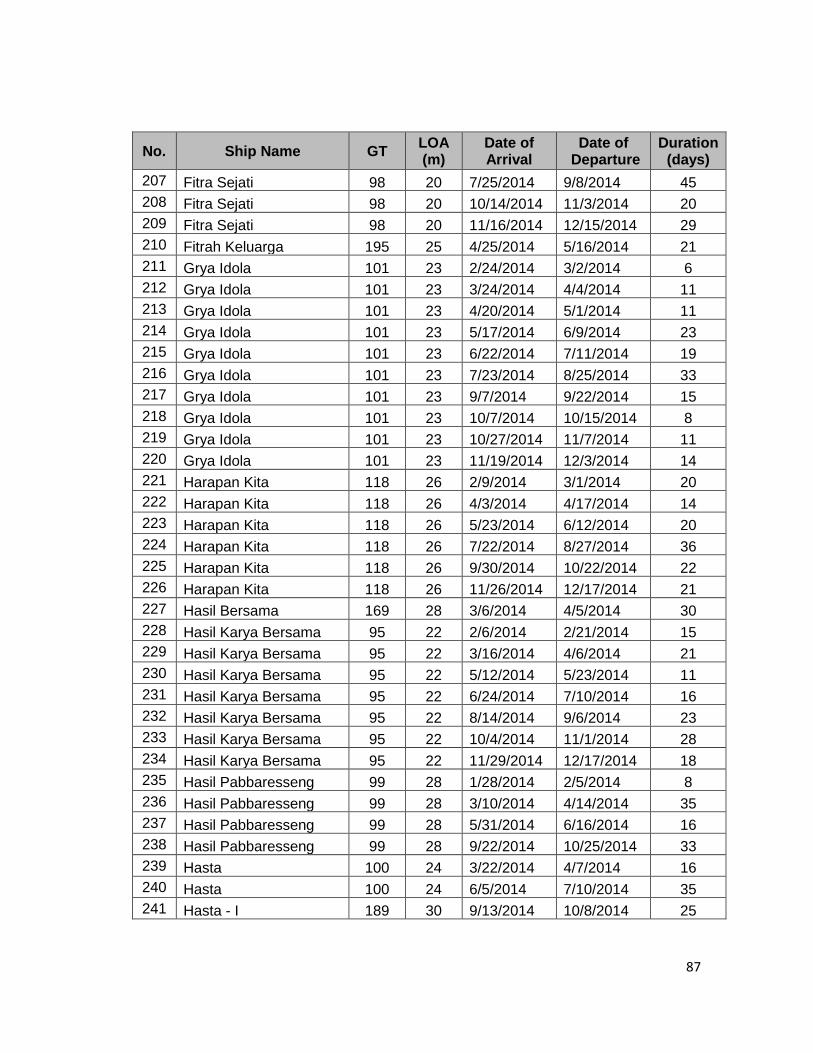
87
No. Ship Name GT LOA (m)
Date of Arrival
Date of Departure
Duration (days)
207 Fitra Sejati 98 20 7/25/2014 9/8/2014 45
208 Fitra Sejati 98 20 10/14/2014 11/3/2014 20
209 Fitra Sejati 98 20 11/16/2014 12/15/2014 29
210 Fitrah Keluarga 195 25 4/25/2014 5/16/2014 21
211 Grya Idola 101 23 2/24/2014 3/2/2014 6
212 Grya Idola 101 23 3/24/2014 4/4/2014 11
213 Grya Idola 101 23 4/20/2014 5/1/2014 11
214 Grya Idola 101 23 5/17/2014 6/9/2014 23
215 Grya Idola 101 23 6/22/2014 7/11/2014 19
216 Grya Idola 101 23 7/23/2014 8/25/2014 33
217 Grya Idola 101 23 9/7/2014 9/22/2014 15
218 Grya Idola 101 23 10/7/2014 10/15/2014 8
219 Grya Idola 101 23 10/27/2014 11/7/2014 11
220 Grya Idola 101 23 11/19/2014 12/3/2014 14
221 Harapan Kita 118 26 2/9/2014 3/1/2014 20
222 Harapan Kita 118 26 4/3/2014 4/17/2014 14
223 Harapan Kita 118 26 5/23/2014 6/12/2014 20
224 Harapan Kita 118 26 7/22/2014 8/27/2014 36
225 Harapan Kita 118 26 9/30/2014 10/22/2014 22
226 Harapan Kita 118 26 11/26/2014 12/17/2014 21
227 Hasil Bersama 169 28 3/6/2014 4/5/2014 30
228 Hasil Karya Bersama 95 22 2/6/2014 2/21/2014 15
229 Hasil Karya Bersama 95 22 3/16/2014 4/6/2014 21
230 Hasil Karya Bersama 95 22 5/12/2014 5/23/2014 11
231 Hasil Karya Bersama 95 22 6/24/2014 7/10/2014 16
232 Hasil Karya Bersama 95 22 8/14/2014 9/6/2014 23
233 Hasil Karya Bersama 95 22 10/4/2014 11/1/2014 28
234 Hasil Karya Bersama 95 22 11/29/2014 12/17/2014 18
235 Hasil Pabbaresseng 99 28 1/28/2014 2/5/2014 8
236 Hasil Pabbaresseng 99 28 3/10/2014 4/14/2014 35
237 Hasil Pabbaresseng 99 28 5/31/2014 6/16/2014 16
238 Hasil Pabbaresseng 99 28 9/22/2014 10/25/2014 33
239 Hasta 100 24 3/22/2014 4/7/2014 16
240 Hasta 100 24 6/5/2014 7/10/2014 35
241 Hasta - I 189 30 9/13/2014 10/8/2014 25
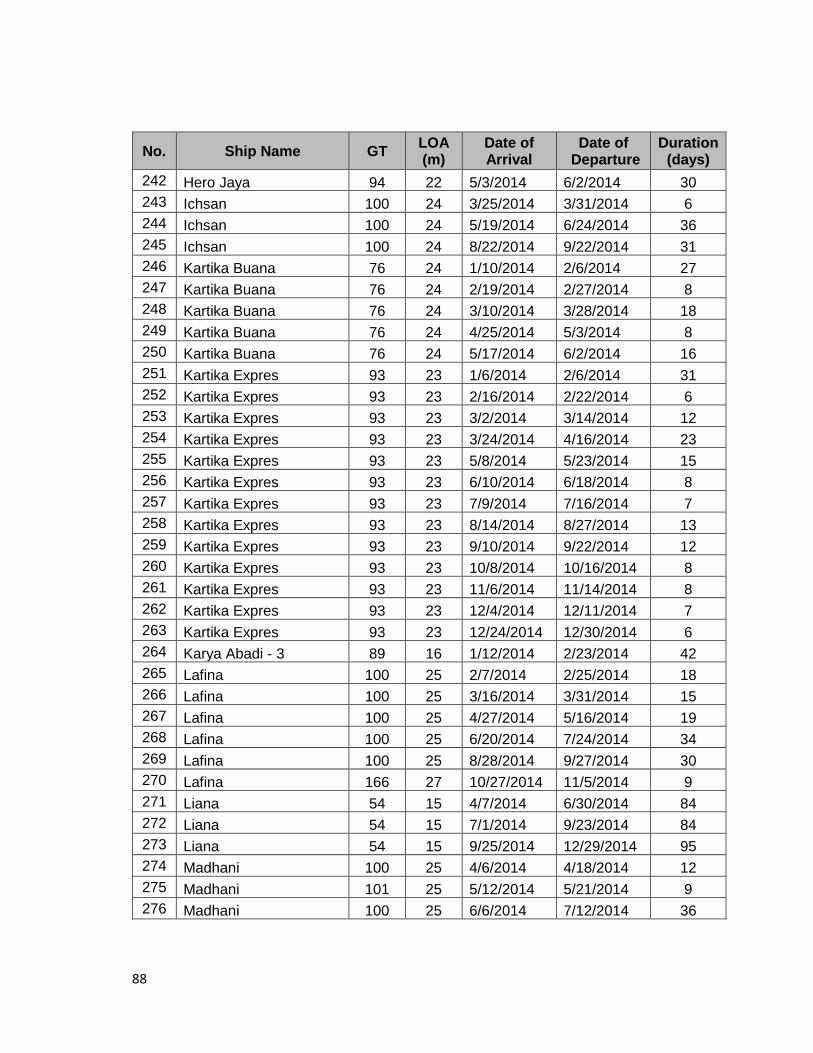
88
No. Ship Name GT LOA (m)
Date of Arrival
Date of Departure
Duration (days)
242 Hero Jaya 94 22 5/3/2014 6/2/2014 30
243 Ichsan 100 24 3/25/2014 3/31/2014 6
244 Ichsan 100 24 5/19/2014 6/24/2014 36
245 Ichsan 100 24 8/22/2014 9/22/2014 31
246 Kartika Buana 76 24 1/10/2014 2/6/2014 27
247 Kartika Buana 76 24 2/19/2014 2/27/2014 8
248 Kartika Buana 76 24 3/10/2014 3/28/2014 18
249 Kartika Buana 76 24 4/25/2014 5/3/2014 8
250 Kartika Buana 76 24 5/17/2014 6/2/2014 16
251 Kartika Expres 93 23 1/6/2014 2/6/2014 31
252 Kartika Expres 93 23 2/16/2014 2/22/2014 6
253 Kartika Expres 93 23 3/2/2014 3/14/2014 12
254 Kartika Expres 93 23 3/24/2014 4/16/2014 23
255 Kartika Expres 93 23 5/8/2014 5/23/2014 15
256 Kartika Expres 93 23 6/10/2014 6/18/2014 8
257 Kartika Expres 93 23 7/9/2014 7/16/2014 7
258 Kartika Expres 93 23 8/14/2014 8/27/2014 13
259 Kartika Expres 93 23 9/10/2014 9/22/2014 12
260 Kartika Expres 93 23 10/8/2014 10/16/2014 8
261 Kartika Expres 93 23 11/6/2014 11/14/2014 8
262 Kartika Expres 93 23 12/4/2014 12/11/2014 7
263 Kartika Expres 93 23 12/24/2014 12/30/2014 6
264 Karya Abadi - 3 89 16 1/12/2014 2/23/2014 42
265 Lafina 100 25 2/7/2014 2/25/2014 18
266 Lafina 100 25 3/16/2014 3/31/2014 15
267 Lafina 100 25 4/27/2014 5/16/2014 19
268 Lafina 100 25 6/20/2014 7/24/2014 34
269 Lafina 100 25 8/28/2014 9/27/2014 30
270 Lafina 166 27 10/27/2014 11/5/2014 9
271 Liana 54 15 4/7/2014 6/30/2014 84
272 Liana 54 15 7/1/2014 9/23/2014 84
273 Liana 54 15 9/25/2014 12/29/2014 95
274 Madhani 100 25 4/6/2014 4/18/2014 12
275 Madhani 101 25 5/12/2014 5/21/2014 9
276 Madhani 100 25 6/6/2014 7/12/2014 36

89
No. Ship Name GT LOA (m)
Date of Arrival
Date of Departure
Duration (days)
277 Madhani 100 25 8/11/2014 9/8/2014 28
278 Madhani 249 31 10/30/2014 11/19/2014 20
279 Madhani 249 31 12/7/2014 12/20/2014 13
280 Mahogani-1 100 24 3/8/2014 4/19/2014 42
281 Makmur Bersama 100 24 2/6/2014 3/19/2014 41
282 Makmur Bersama 100 24 4/22/2014 6/18/2014 57
283 Makmur Bersama 100 24 9/1/2014 9/27/2014 26
284 Makmur Bersama 100 24 11/3/2014 11/22/2014 19
285 Mayang Sari 147 26 1/24/2014 2/15/2014 22
286 Mayang Sari 147 26 2/26/2014 3/8/2014 10
287 Mayang Sari 147 26 3/23/2014 4/13/2014 21
288 Mayang Sari 147 26 4/27/2014 5/15/2014 18
289 Mayang Sari 147 26 5/27/2014 6/13/2014 17
290 Mayang Sari 147 26 6/29/2014 7/12/2014 13
291 Mayang Sari 147 26 7/31/2014 8/28/2014 28
292 Mayang Sari 147 26 9/16/2014 9/27/2014 11
293 Mayang Sari 147 26 10/16/2014 10/23/2014 7
294 Mayang Sari 147 26 11/5/2014 11/18/2014 13
295 Mayang Sari 147 26 12/2/2014 12/16/2014 14
296 Merdeka 99 22 3/19/2014 3/30/2014 11
297 Merdeka - I 48 22 11/18/2014 12/1/2014 13
298 Mina Abadi 147 20 1/9/2014 2/5/2014 27
299 Mina Abadi 147 20 2/19/2014 2/27/2014 8
300 Mina Abadi 147 20 3/11/2014 3/23/2014 12
301 Mina Abadi 147 20 4/5/2014 4/27/2014 22
302 Mina Abadi 147 20 5/10/2014 5/26/2014 16
303 Mina Abadi 147 20 6/10/2014 6/25/2014 15
304 Mina Abadi 147 20 7/9/2014 7/22/2014 13
305 Mina Abadi 147 20 8/20/2014 9/5/2014 16
306 Mina Abadi 147 20 9/22/2014 10/9/2014 17
307 Mina Abadi 147 20 10/21/2014 11/2/2014 12
308 Mina Abadi 147 20 11/17/2014 11/25/2014 8
309 Mina Abadi 147 20 12/8/2014 12/22/2014 14
310 Mitra Abadi 238 30 1/14/2014 5/26/2014 132
311 Mitra Bahari 98 26 4/13/2014 5/3/2014 20
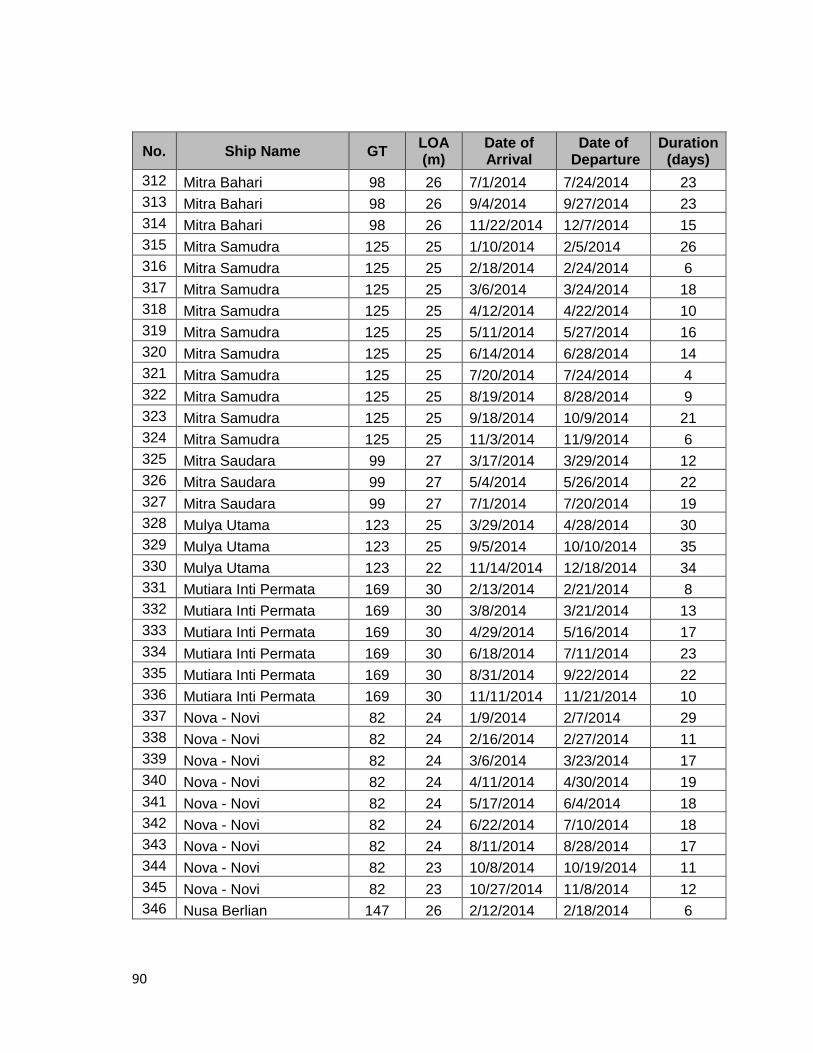
90
No. Ship Name GT LOA (m)
Date of Arrival
Date of Departure
Duration (days)
312 Mitra Bahari 98 26 7/1/2014 7/24/2014 23
313 Mitra Bahari 98 26 9/4/2014 9/27/2014 23
314 Mitra Bahari 98 26 11/22/2014 12/7/2014 15
315 Mitra Samudra 125 25 1/10/2014 2/5/2014 26
316 Mitra Samudra 125 25 2/18/2014 2/24/2014 6
317 Mitra Samudra 125 25 3/6/2014 3/24/2014 18
318 Mitra Samudra 125 25 4/12/2014 4/22/2014 10
319 Mitra Samudra 125 25 5/11/2014 5/27/2014 16
320 Mitra Samudra 125 25 6/14/2014 6/28/2014 14
321 Mitra Samudra 125 25 7/20/2014 7/24/2014 4
322 Mitra Samudra 125 25 8/19/2014 8/28/2014 9
323 Mitra Samudra 125 25 9/18/2014 10/9/2014 21
324 Mitra Samudra 125 25 11/3/2014 11/9/2014 6
325 Mitra Saudara 99 27 3/17/2014 3/29/2014 12
326 Mitra Saudara 99 27 5/4/2014 5/26/2014 22
327 Mitra Saudara 99 27 7/1/2014 7/20/2014 19
328 Mulya Utama 123 25 3/29/2014 4/28/2014 30
329 Mulya Utama 123 25 9/5/2014 10/10/2014 35
330 Mulya Utama 123 22 11/14/2014 12/18/2014 34
331 Mutiara Inti Permata 169 30 2/13/2014 2/21/2014 8
332 Mutiara Inti Permata 169 30 3/8/2014 3/21/2014 13
333 Mutiara Inti Permata 169 30 4/29/2014 5/16/2014 17
334 Mutiara Inti Permata 169 30 6/18/2014 7/11/2014 23
335 Mutiara Inti Permata 169 30 8/31/2014 9/22/2014 22
336 Mutiara Inti Permata 169 30 11/11/2014 11/21/2014 10
337 Nova - Novi 82 24 1/9/2014 2/7/2014 29
338 Nova - Novi 82 24 2/16/2014 2/27/2014 11
339 Nova - Novi 82 24 3/6/2014 3/23/2014 17
340 Nova - Novi 82 24 4/11/2014 4/30/2014 19
341 Nova - Novi 82 24 5/17/2014 6/4/2014 18
342 Nova - Novi 82 24 6/22/2014 7/10/2014 18
343 Nova - Novi 82 24 8/11/2014 8/28/2014 17
344 Nova - Novi 82 23 10/8/2014 10/19/2014 11
345 Nova - Novi 82 23 10/27/2014 11/8/2014 12
346 Nusa Berlian 147 26 2/12/2014 2/18/2014 6
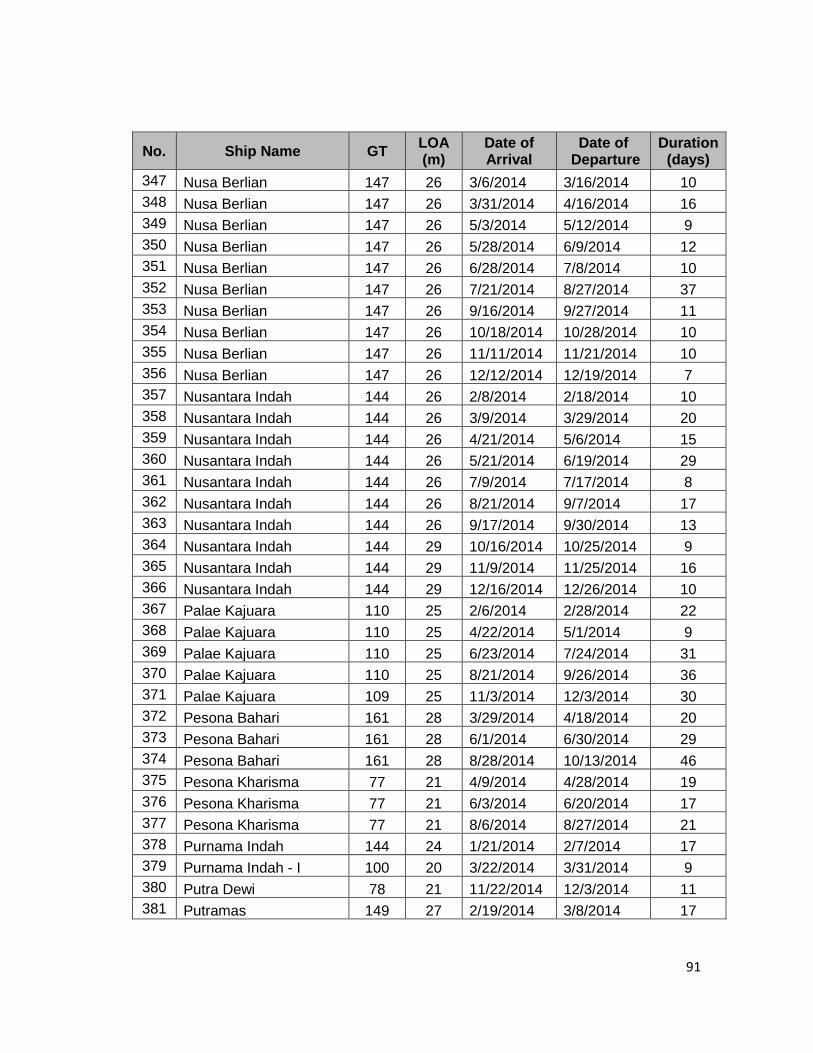
91
No. Ship Name GT LOA (m)
Date of Arrival
Date of Departure
Duration (days)
347 Nusa Berlian 147 26 3/6/2014 3/16/2014 10
348 Nusa Berlian 147 26 3/31/2014 4/16/2014 16
349 Nusa Berlian 147 26 5/3/2014 5/12/2014 9
350 Nusa Berlian 147 26 5/28/2014 6/9/2014 12
351 Nusa Berlian 147 26 6/28/2014 7/8/2014 10
352 Nusa Berlian 147 26 7/21/2014 8/27/2014 37
353 Nusa Berlian 147 26 9/16/2014 9/27/2014 11
354 Nusa Berlian 147 26 10/18/2014 10/28/2014 10
355 Nusa Berlian 147 26 11/11/2014 11/21/2014 10
356 Nusa Berlian 147 26 12/12/2014 12/19/2014 7
357 Nusantara Indah 144 26 2/8/2014 2/18/2014 10
358 Nusantara Indah 144 26 3/9/2014 3/29/2014 20
359 Nusantara Indah 144 26 4/21/2014 5/6/2014 15
360 Nusantara Indah 144 26 5/21/2014 6/19/2014 29
361 Nusantara Indah 144 26 7/9/2014 7/17/2014 8
362 Nusantara Indah 144 26 8/21/2014 9/7/2014 17
363 Nusantara Indah 144 26 9/17/2014 9/30/2014 13
364 Nusantara Indah 144 29 10/16/2014 10/25/2014 9
365 Nusantara Indah 144 29 11/9/2014 11/25/2014 16
366 Nusantara Indah 144 29 12/16/2014 12/26/2014 10
367 Palae Kajuara 110 25 2/6/2014 2/28/2014 22
368 Palae Kajuara 110 25 4/22/2014 5/1/2014 9
369 Palae Kajuara 110 25 6/23/2014 7/24/2014 31
370 Palae Kajuara 110 25 8/21/2014 9/26/2014 36
371 Palae Kajuara 109 25 11/3/2014 12/3/2014 30
372 Pesona Bahari 161 28 3/29/2014 4/18/2014 20
373 Pesona Bahari 161 28 6/1/2014 6/30/2014 29
374 Pesona Bahari 161 28 8/28/2014 10/13/2014 46
375 Pesona Kharisma 77 21 4/9/2014 4/28/2014 19
376 Pesona Kharisma 77 21 6/3/2014 6/20/2014 17
377 Pesona Kharisma 77 21 8/6/2014 8/27/2014 21
378 Purnama Indah 144 24 1/21/2014 2/7/2014 17
379 Purnama Indah - I 100 20 3/22/2014 3/31/2014 9
380 Putra Dewi 78 21 11/22/2014 12/3/2014 11
381 Putramas 149 27 2/19/2014 3/8/2014 17

92
No. Ship Name GT LOA (m)
Date of Arrival
Date of Departure
Duration (days)
382 Putramas 149 27 4/15/2014 5/12/2014 27
383 Putramas 149 27 6/23/2014 7/10/2014 17
384 Putramas 149 27 8/31/2014 9/27/2014 27
385 Putramas 149 27 11/1/2014 11/12/2014 11
386 Putri Ayu – II 85 22 4/10/2014 5/5/2014 25
387 Putri Ayu - II 85 22 6/10/2014 7/2/2014 22
388 Putri Ayu - II 85 22 8/25/2014 9/27/2014 33
389 Putri Ayu - II 85 22 11/18/2014 12/3/2014 15
390 Rahma Setia - O1 171 24 11/29/2014 12/19/2014 20
391 Rajawali 99 20 4/23/2014 4/28/2014 5
392 Rajawali 99 20 6/20/2014 7/10/2014 20
393 Rajawali 99 20 11/9/2014 11/19/2014 10
394 Rajawali - 1 100 20 2/11/2014 2/19/2014 8
395 Rajawali - 1 100 20 2/23/2014 3/2/2014 7
396 Rajawali - 1 100 20 4/13/2014 4/19/2014 6
397 Rajawali - 1 100 20 5/20/2014 6/13/2014 24
398 Rajawali - 1 100 20 9/11/2014 10/8/2014 27
399 Rajawali - 1 100 23 12/19/2014 12/25/2014 6
400 Rama Jaya 01 135 20 11/22/2014 12/3/2014 11
401 Ramadhani 98 30 2/5/2014 2/15/2014 10
402 Ramadhani 98 30 3/5/2014 3/20/2014 15
403 Ramadhani 98 30 4/22/2014 5/3/2014 11
404 Ramadhani 98 30 6/9/2014 7/16/2014 37
405 Ramadhani 98 30 8/12/2014 9/22/2014 41
406 Ramadhani 149 22 10/12/2014 10/23/2014 11
407 Ramadhani 149 22 11/13/2014 12/7/2014 24
408 Rukun Abadi 167 30 2/10/2014 3/18/2014 36
409 Rukun Abadi 167 30 6/7/2014 7/21/2014 44
410 Rukun Abadi 167 30 10/10/2014 11/4/2014 25
411 Sadar Wisata 123 23 9/19/2014 10/10/2014 21
412 Sari Setia-2 117 23 4/18/2014 4/28/2014 10
413 Sari Setia-2 117 23 6/28/2014 7/8/2014 10
414 Sari Setia-2 117 23 8/6/2014 8/25/2014 19
415 Sari Setia-2 117 23 9/30/2014 10/13/2014 13
416 Satria Palae 10 117 15 2/7/2014 3/5/2014 26

93
No. Ship Name GT LOA (m)
Date of Arrival
Date of Departure
Duration (days)
417 Satria Palae 10 117 15 3/19/2014 4/3/2014 15
418 Satria Palae 10 117 15 5/2/2014 5/31/2014 29
419 Satria Palae 10 117 15 6/12/2014 7/10/2014 28
420 Satria Palae 10 117 15 7/22/2014 8/27/2014 36
421 Satria Palae 10 117 21 9/9/2014 9/27/2014 18
422 Satria Palae 10 118 21 10/24/2014 11/4/2014 11
423 Satria Palae 10 118 21 11/17/2014 12/7/2014 20
424 Setia Tunggal 100 24 7/31/2014 8/28/2014 28
425 Sinar Purnama Jaya 141 22 2/24/2014 3/5/2014 9
426 Sinar Purnama Jaya 141 22 4/14/2014 4/27/2014 13
427 Sinar Purnama Jaya 141 22 6/14/2014 7/2/2014 18
428 Sri Muna 18 14 2/7/2014 2/18/2014 11
429 Sri Muna 18 14 3/6/2014 3/18/2014 12
430 Sri Muna 18 14 4/22/2014 5/4/2014 12
431 Sri Muna 18 14 6/10/2014 6/25/2014 15
432 Sri Muna 18 14 8/20/2014 8/29/2014 9
433 Sri Muna 18 14 9/21/2014 10/8/2014 17
434 Sri Muna 18 14 10/20/2014 10/28/2014 8
435 Sri Muna 18 14 11/11/2014 11/21/2014 10
436 Sri Muna 18 14 12/8/2014 12/31/2014 23
437 Subhanur Rohman I 80 22 5/7/2014 5/10/2014 3
438 Subhanur Rohman I 80 22 6/11/2014 7/10/2014 29
439 Subhanur Rohman I 80 22 11/8/2014 12/2/2014 24
440 Sumber Murni II 24 15 1/25/2014 2/6/2014 12
441 Sumber Murni II 24 15 2/19/2014 2/28/2014 9
442 Sumber Murni II 24 15 3/18/2014 4/4/2014 17
443 Sumber Murni II 24 15 4/19/2014 4/29/2014 10
444 Sumber Murni II 24 15 5/12/2014 5/26/2014 14
445 Sumber Murni II 24 15 6/10/2014 6/21/2014 11
446 Sumber Murni II 24 15 8/18/2014 8/28/2014 10
447 Sumber Murni II 24 15 9/12/2014 9/30/2014 18
448 Surya Indah I 147 26 1/26/2014 2/15/2014 20
449 Surya Indah I 147 26 3/1/2014 3/8/2014 7
450 Surya Indah I 147 26 3/24/2014 4/12/2014 19
451 Surya Indah I 147 26 4/24/2014 5/4/2014 10

94
No. Ship Name GT LOA (m)
Date of Arrival
Date of Departure
Duration (days)
452 Surya Indah I 147 26 5/22/2014 6/5/2014 14
453 Surya Indah I 147 26 6/18/2014 6/28/2014 10
454 Surya Indah I 147 26 7/19/2014 8/13/2014 25
455 Surya Indah I 147 26 8/28/2014 9/23/2014 26
456 Surya Indah I 147 26 10/12/2014 10/19/2014 7
457 Surya Indah I 147 26 11/3/2014 11/17/2014 14
458 Surya Indah I 147 26 12/5/2014 12/17/2014 12
459 Terka Abadi 149 27 1/8/2014 2/6/2014 29
460 Terka Abadi 149 27 2/19/2014 3/5/2014 14
461 Terka Abadi 149 27 3/23/2014 4/13/2014 21
462 Terka Abadi 149 27 4/27/2014 5/15/2014 18
463 Terka Abadi 149 27 6/1/2014 6/13/2014 12
464 Terka Abadi 149 27 6/30/2014 7/10/2014 10
465 Terka Abadi 149 27 8/13/2014 8/27/2014 14
466 Terka Abadi 149 27 9/25/2014 10/9/2014 14
467 Terka Abadi 149 27 10/25/2014 11/5/2014 11
468 Terka Abadi 149 27 11/21/2014 12/3/2014 12
469 Terka Abadi 149 27 12/17/2014 12/29/2014 12
470 Trisiendra Pratama 173 32 3/7/2014 4/3/2014 27
471 Trisiendra Pratama 173 32 5/1/2014 6/13/2014 43
472 Trisiendra Pratama 173 32 7/1/2014 7/24/2014 23
473 Trisiendra Pratama 173 32 8/23/2014 9/15/2014 23
474 Trisiendra Pratiwi 173 33 3/8/2014 4/3/2014 26
475 Trisiendra Pratiwi 173 33 5/3/2014 6/23/2014 51
476 Trisiendra Pratiwi 173 33 7/24/2014 8/29/2014 36
477 Trisiendra Pratiwi 173 33 9/16/2014 10/9/2014 23
478 Trisiendra Pratiwi 173 33 10/25/2014 11/14/2014 20
479 Trisiendra Pratiwi 173 33 11/29/2014 12/21/2014 22
480 Usaha Bersama 28 19 1/23/2014 2/9/2014 17
481 Usaha Bersama 140 26 2/13/2014 2/20/2014 7
482 Usaha Bersama 28 19 3/5/2014 3/17/2014 12
483 Usaha Bersama 140 26 3/6/2014 3/14/2014 8
484 Usaha Bersama 140 26 4/3/2014 4/11/2014 8
485 Usaha Bersama 28 19 4/12/2014 5/1/2014 19
486 Usaha Bersama 140 26 4/30/2014 5/17/2014 17
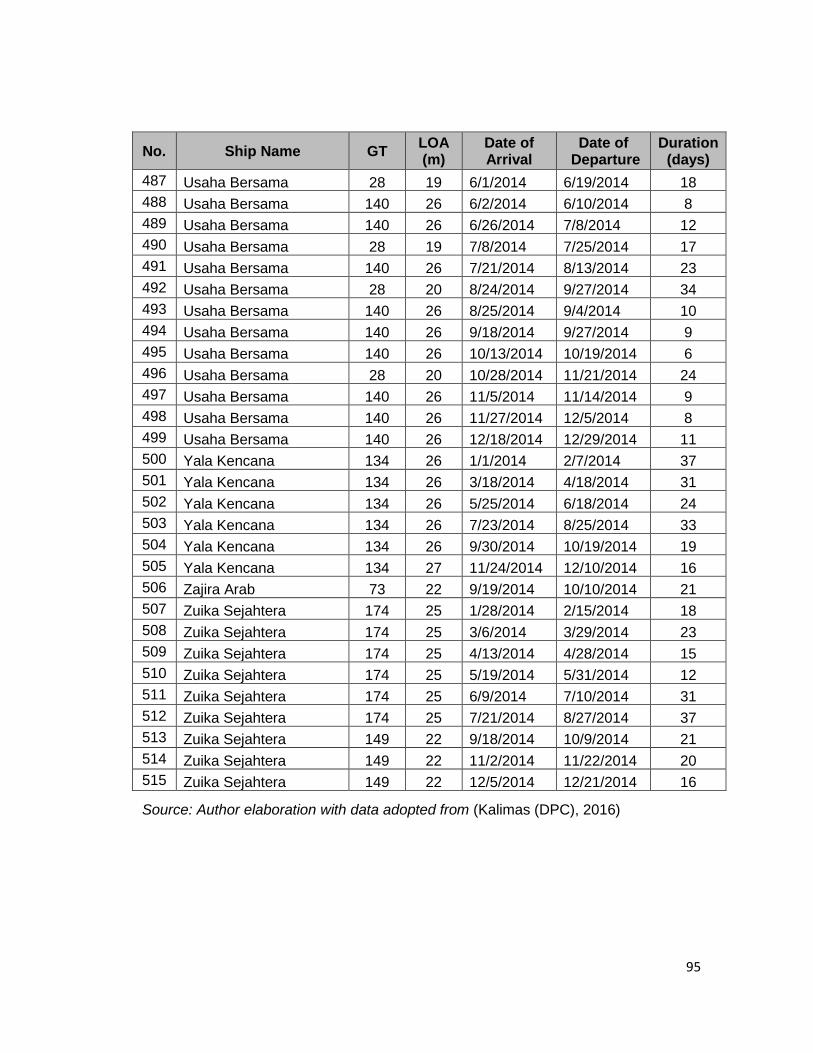
95
No. Ship Name GT LOA (m)
Date of Arrival
Date of Departure
Duration (days)
487 Usaha Bersama 28 19 6/1/2014 6/19/2014 18
488 Usaha Bersama 140 26 6/2/2014 6/10/2014 8
489 Usaha Bersama 140 26 6/26/2014 7/8/2014 12
490 Usaha Bersama 28 19 7/8/2014 7/25/2014 17
491 Usaha Bersama 140 26 7/21/2014 8/13/2014 23
492 Usaha Bersama 28 20 8/24/2014 9/27/2014 34
493 Usaha Bersama 140 26 8/25/2014 9/4/2014 10
494 Usaha Bersama 140 26 9/18/2014 9/27/2014 9
495 Usaha Bersama 140 26 10/13/2014 10/19/2014 6
496 Usaha Bersama 28 20 10/28/2014 11/21/2014 24
497 Usaha Bersama 140 26 11/5/2014 11/14/2014 9
498 Usaha Bersama 140 26 11/27/2014 12/5/2014 8
499 Usaha Bersama 140 26 12/18/2014 12/29/2014 11
500 Yala Kencana 134 26 1/1/2014 2/7/2014 37
501 Yala Kencana 134 26 3/18/2014 4/18/2014 31
502 Yala Kencana 134 26 5/25/2014 6/18/2014 24
503 Yala Kencana 134 26 7/23/2014 8/25/2014 33
504 Yala Kencana 134 26 9/30/2014 10/19/2014 19
505 Yala Kencana 134 27 11/24/2014 12/10/2014 16
506 Zajira Arab 73 22 9/19/2014 10/10/2014 21
507 Zuika Sejahtera 174 25 1/28/2014 2/15/2014 18
508 Zuika Sejahtera 174 25 3/6/2014 3/29/2014 23
509 Zuika Sejahtera 174 25 4/13/2014 4/28/2014 15
510 Zuika Sejahtera 174 25 5/19/2014 5/31/2014 12
511 Zuika Sejahtera 174 25 6/9/2014 7/10/2014 31
512 Zuika Sejahtera 174 25 7/21/2014 8/27/2014 37
513 Zuika Sejahtera 149 22 9/18/2014 10/9/2014 21
514 Zuika Sejahtera 149 22 11/2/2014 11/22/2014 20
515 Zuika Sejahtera 149 22 12/5/2014 12/21/2014 16
Source: Author elaboration with data adopted from (Kalimas (DPC), 2016)


![People’s Perceptions about the Importance of Forests on Borneod284f45nftegze.cloudfront.net/borneofutures/Meijaard... · 2015-06-29 · described by Meijaard et al. [30]. The survey](https://img.dokumen.tips/doc/110x75/5f2fe5f8a783d929c036a6b5/peopleas-perceptions-about-the-importance-of-forests-on-2015-06-29-described.jpg)