Embed Size (px)
Citation preview

The ImporTance of
household BusInesses and The Informal secTor for InclusIve GrowTh In vIeTnamLaure Pasquier-Doumer | Xavier Oudin | Nguyen Thang

The ImporTance of household BusInesses and The Informal secTor for InclusIve GrowTh In vIeTnaméditors laure pasquier-doumer | Xavier oudin | nguyen Thang
a co-publication of the vietnam academy of social sciences and the french national research Institute for sustainable development
©2017 vietnam academy of social sciences and the french national research Institute for sustainable development

| The household Businesses and the Informal sector in vietnam2

contents | The household Businesses and the Informal sector in vietnam | 3
conTenTs
Foreword and Acknowledgements ...................................................................................................... p 5
Editors and Contributors ............................................................................................................................. p 7
Executive Summary ........................................................................................................................................ p 9
01.measurement of household Businesses and the Informal sector: concepts and survey methodology ............................................................................... p 251. Measurement of the informal sector: Definitions and the 1-2-3 approach ............................. p. 282. Methodology of the 2014/15 HB&IS survey ................................................................................................ p. 303. Field implementation .................................................................................................................................................p. 384. HB&IS survey in the national statistical system ......................................................................................... p. 39
02. evolution of the Informal and household Business sectors in vietnam in a Time of Growth and Trade liberalization ....................................... p 431. Towards a formalization of the Vietnamese economy? ........................................................................ p. 442. Towards an improvement of working conditions in the informal sector? ............................... p. 52
03. characteristics of household Businesses and the Informal sector .............. p 631. The prevalence of small-size household businesses .............................................................................. p. 642. Precarious business operating conditions ................................................................................................... p. 693. The informal sector and administrative registration .............................................................................. p. 764. Factors of formalisation ............................................................................................................................................ p. 83
04. workers in the Informal sector: who are They and what are Their working conditions? ............................................................................. p 931. Who are the workers in the household business and informal sectors? ................................. p. 942. What are the working conditions of the workers in the informal sector? ............................. p. 100
05. contribution of hBs and the Informal sector to the economy .................... p 1211. Household businesses and the informal sector in the national economy ........................... p. 1222. Labour productivity ................................................................................................................................................. p. 1363. Seasonality .................................................................................................................................................................... p. 1424. Linkages with other sectors ................................................................................................................................ p. 146

06. performance of hBs and the Informal sector ..................................................... p 1591. Accounting results for household businesses and the informal sector .................................. p. 1602. Household businesses are highly heterogeneous in terms of performance ....................... p. 1683. Capital and investment .......................................................................................................................................... p. 1734. Growth of household businesses ..................................................................................................................... p. 182
07. are household Businesses constrained in their access to credit? ............ p 1871. Characterising the credit supply to HBs in Vietnam ............................................................................ p. 1882. HBs’ demand for credit ........................................................................................................................................... p. 1953. Are HBs credit constrained? ................................................................................................................................ p. 2024. What do HBs need credit for? ............................................................................................................................ p. 208
08. Innovation in the household Business and Informal sectors ...................... p 2131. The application of innovation among HBs ............................................................................................... p. 2152. Innovation through using the internet and innovation
as a means to expand future activity ............................................................................................................ p. 2223. Innovation and the characteristics of HBs ................................................................................................. p. 224
09. understanding household Business vulnerability and the challenge of social protection ....................................................................... p 2291. Understanding the vulnerability of household businesses ............................................................ p. 2302. Social protection and the informal sector ................................................................................................. p. 235
10. The use of social networks in the functioning of household Businesses p 2491. To what extent access to credit is shaped by a social network .................................................... p. 2502. Social network and access to physical capital ........................................................................................ p. 2583. Social network and access to labour ............................................................................................................ p. 2614. Social network and access to information ................................................................................................ p. 2655. Social network and vulnerability ..................................................................................................................... p. 269
11. motivation, problems and assistance needed .................................................. p 2791. Working at a household business and in the informal sector
is generally not a second choice ..................................................................................................................... p. 2802. Competition remains the main problem,
but access to credit is an issue as well .......................................................................................................... p. 2913. A huge demand for support among HBs, notably for credit .......................................................... p. 2974. How household businesses allocate their extra earnings ................................................................ p. 299
References ....................................................................................................................................................... p 305
List of Tables .................................................................................................................................................... p 315
List of Figures ................................................................................................................................................. p 320
Abbreviations ................................................................................................................................................ p 325
| The household Businesses and the Informal sector in vietnam | contents4

acknowledgements | The household Businesses and the Informal sector in vietnam | 5
foreword and acknowledGemenTs
This book was prepared by a team of researchers led by Laure Pasquier-Doumer and Xavier Oudin at the French National Research Institute for Sustainable Development (IRD, DIAL) and Nguyen Thang at the Centre for Analysis and Forecasting (CAF) at the Vietnam Academy of Social Sciences (VASS).
The book presents the findings of the survey of household businesses and the informal sector conducted in late 2014 and early 2015 (2014/15 HB&IS). This survey is the first ever national survey of this sector in Vietnam to provide full coverage of its different components. Its design is largely inspired by the 2007 and 2009 HB&IS surveys conducted in Hanoi and Ho Chi Minh City. The authors are grateful to Jean-Pierre Cling, Mireille Razafindrakoto and François Roubaud for building the foundations of this project and for sharing their expertise on the informal sector in Vietnam. We also thank Emmanuelle Lavallée, Nguyen Huu Chi, Nguyen Tuan Minh, Christophe Jalil Nordman, Jean-Michel Wachsberger and Hoang Thuy Quynh for their contributions to the design of the questionnaire and Constance Torelli for sharing her expertise on HB&IS surveys. Useful comments were provided by participants in the consultation workshops organized by CAF/VASS in 2014 and January 2017.
Special thanks to Nguyen Thu Nga at the Mekong Development Research Institute (MDRI) for coordinating the fieldwork, to Nguyen Mai Trang, Nguyen Quynh Chi, Le Hai Chau, Nghiem Hoang Son and Pham Hoang Anh (MDRI) for their supervison ef-forts, and to Pham Minh Thai, Nguyen Minh Ngoc, Nguyen Thu Hien, Vu Van Ngoc, Nguyen Thi Quyen, Le Anh Hoa, Le Manh Hung and Nguyen Khac Tuan (CAF, VASS). Tablet computer software development was implemented by Ho Van Bao (MDRI). Overall coordination of the implementation of the survey was led by Phung Duc Tung (MDRI) and Nguyen Thi Thu Phuong (CAF). Technical support for sampling was provided by statistics experts from the General Statistics Office, including Nguyen

| The household Businesses and the Informal sector in vietnam | acknowledgements6
Thi Xuan Mai, Nguyen Thuy Oanh, Nguyen Van Hung, Vu Quoc Dung, Nguyen Thu Dung, Le Van Duy and Vu Hoang Dat (CAF). We also thank Yoann Lamballe for his rigorous work on weight calculations, Nguyen Minh Ngoc, Nguyen Thi Quyen, Nguyen Thu Hien and Vu Van Ngoc (CAF) for their invaluable support throughout the various steps of the implementation of the survey, and Sabine Lescher for her support during the fieldwork and the training. Excellent editorial work by Chris Lorenzen and Diane Bertrand is duly acknowledged. Publication of the book was possible due to great efforts made by Tran Lan Anh (CAF). Marianne Smolska designed the graphics for the book, and we thank her and acknowledge her great talent.
We would also like to thank the statistics officers in the six northern provinces (Hanoi, Hai Duong, Cao Bang, Bac Kan, Quang Ninh and Hue) and the six southern provinces (Ho Chi Minh, An Giang, Binh Phuoc, Kon Tum, Phu Yen and Soc Trang) which provi-ded the research team with effective institutional arrangements and guidance with the interviewees during the fieldwork. We thank the 61 enumerators for their strong involvement in the fieldwork and for the quality of their work. Finally, we thank the interviewees for the time they dedicated to the survey and for sharing with us their experience.
This work is part of the NOPOOR research project Enhancing Knowledge for Renewed Policies against Poverty, which is within the European Union’s 7th Framework Programme (FP7), SSH.2011.4.1-1 Tackling poverty in a development context (2012 to 2017).

contributors | The household Businesses and the Informal sector in vietnam | 7
EDITORS
Laure Pasquier-Doumer at the French National Research Institute for Sustainable Development (IRD, DIAL),
Xavier Oudin at the French National Research Institute for Sustainable Development (IRD, DIAL),
and
Nguyen Thang at the Centre for Analysis and Forecasting, Vietnam Academy of Social Sciences (CAF, VASS).
CONTRIBUTORS
French National Research Institute for Sustainable Development, Dial
Laure Pasquier-DoumerXavier OudinCamille Saint-MacaryYoann Lamballe
Paris-Dauphine University, Dial
Axel DemenetLe Thuy Linh
Centre for Analysis and Forecasting, Vietnam Academy of Social Sciences
Nguyen Thi Thu PhuongVu Hoang DatPham Minh ThaiNguyen Thi Kim ThaiVu Van NgocNguyen Thi Thu HienLa Hai AnhTran Ngo Minh Tam

| The household Businesses and the Informal sector in vietnam8

executive summary | The household Businesses and the Informal sector in vietnam | 9
eXecuTIve summary
There is a broad consensus that Vietnam has made some impressive achievements in recent decades, both in human development and economic performance. Yet, as highlighted in the Human Development Report 2015, progress has slowed sharply in the last decade, especially compared to countries with similar levels of development. In particular, Vietnam has recently become less effective at translating economic gains into human development. vietnam therefore faces new social and economic policy challenges to achieve more inclusive growth. Inclusive growth refers to rapid economic growth and a fair distribution of its benefits to provide opportunities for all and leave no one behind. Inclusive growth is part of the Sustainable Development Goals (SDGs), to which Vietnam has been committed since 2015, particularly Goal 8 to, “Promote inclusive and sustainable economic growth, employment and decent work for all.” Many experts point up this objective as being particularly relevant to Vietnam, because only then can it move beyond a middle-income stage of development (UNDP and VASS, 2016).
Achieving more productive employment and tackling worker vulnerability are impor-tant pathways to a new growth model for Vietnam. Household businesses and the informal sector form a cornerstone of this for the following reasons. First, household businesses are the main job providers after the agriculture sector. They concen-trate almost one-third of all employed workers and more than half of all non-farm employment. One of Vietnam’s key challenges is therefore to improve productivity and working conditions in this sector. Productivity growth needs to be achieved within the sector as structural change via the reallocation of employment to higher productivity sectors appears to be weak, and trends show that this is likely to remain the case for the foreseeable future.
Second, household businesses and the informal sector form a constituent element of the vietnamese economy’s resilience. They act as a buffer, absorbing workers out of agriculture when the enterprise sector is shrinking. The household business sector’s relative economic isolation and flexibility buffer its resilience in the event of economic shocks.

| The household Businesses and the Informal sector in vietnam | executive summary10
Thirdly, workers in household businesses and the informal sector in particular are highly vulnerable to sudden shocks and setbacks. They constitute the ‘new middle’, as defined in the Vietnam Human Development Report 2015, who may have attained only a tenuous level of income security, are often not eligible for social assistance and cannot access social insurance. For these reasons, boosting the productivity of house-hold businesses and the informal sector, and tackling the vulnerability of their workers is critical for broad-based growth, stability, and human development.
This book draws on an original and innovative data collection to provide new evi-dence on household businesses and the informal sector. Taking the Household Business and Informal Sector Survey (HB&IS), it applies the methodology of the 1-2-3 surveys, augmented mixed business/household surveys developed by DIAL researchers (Razafindrakoto and Roubaud, 2003), and conducted in numerous deve-loping countries, including two previous rounds in Hanoi and Ho Chi Minh City in Vietnam (Cling et al., 2014). This survey conducted in late 2014 and early 2015 is the first national survey ever on this sector in vietnam with full coverage of its different components (Chapter 1). It is representative of the entire country, including urban and rural areas. It is based on a sub-sample of the Labour Force Survey (LFS) produced by the General Statistics Office (GSO). It contains different modules that provide specific information on the sector’s characteristics and the people working in it, its integration into the national economy and how it operates. It builds on the previous IRD-DIAL/GSO-ISS informal sector project (2006-2011), which carried out the first representative survey on the informal sector in Vietnam, restricted to Hanoi and Ho Chi Minh City (Cling et al., 2010). This survey was conducted by the Centre for Analysis and Forecasting (CAF) reporting to the Vietnam Academy of Social Sciences (VASS) and by research unit DIAL attached to the French National Research Institute for Sustainable Development (IRD) and Paris-Dauphine University. Technical sup-port was provided by the GSO and the Mekong Development Research Institute (MDRI). The project was funded by the European Union’s 7th Research Framework Pro-gramme in connection with the NOPOOR research project (“Enhancing Knowledge for Renewed Policies against Poverty”).1 The purpose of this book is threefold. First, it aims at filling the knowledge gap as to the role of household businesses and the informal sector in the vietnamese economy. Second, it provides new insights for policymakers to unlock household business potential by identifying the factors blocking their performance and productivity. Thirdly, it identifies the sources of worker vulnerability in household businesses and the informal sector to inform
1. http://www.nopoor.eu

executive summary | The household Businesses and the Informal sector in vietnam | 11
the design of a suitable policy to tackle this vulnerability. This executive summary sums up the book’s main findings and presents their policy implications.
1.HOUSEHOlD BUSINESSES aND THE INfORmal SECTOR aRE majOR playERS IN THE VIETNamESE ECONOmy
Household businesses are unincorporated businesses owned by individuals or families, which produce or distribute goods and services for the market. The non-farm house-hold business sector features a large proportion of informal household businesses, with no business registration, and a small share of formal household businesses. In Vietnam, these informal household businesses make up the informal sector.
The informal sector has a peculiar history in Vietnam, quite different to what has been seen in Africa or Latin America. The Doi Moi policy proclaimed in 1986 dismantled the cooperatives and restructured the state enterprises that had employed most workers up to that point. Many of these workers consequently set up on their own, either as self-employed workers or family-run businesses. Although a significant proportion of the labour force was already working outside the centrally planned economy, Doi Moi resulted in a boom in employment in the household business sector.
1.1. An important role in labour absorption, wealth creation and economic resilience
The launch of the Doi Moi policy brought considerable growth in employment and production in non-farm household businesses. The sector’s share of employment rose from nine percent of total employment in 1989 (Population Census) to 31 percent in 2014 (LFS). This made the household business sector the main employer after agriculture, with nearly one-third of total employment and 57 percent of non-farm employment in 2014. The informal sector makes up more than two-thirds of the household business sector. The household business sector has been the number one job provider for the last two decades, providing more jobs than agriculture and the public and private sectors (Oudin et al., 2013).
In addition to providing jobs and income for one-third of the working population, the household business sector is generally considered as the best option among the opportunities available. As shown in Chapter 11, over half of household business owners clearly prefer running the household business rather than any other occupa-

| The household Businesses and the Informal sector in vietnam | executive summary12
tional status and are satisfied with their job. Less than one-third of household business owners would prefer to work as an employee in a private company for a monthly income of five million VND. On the other hand, three in four do not want their children to take over the business. So although setting up a household business is not a second-best choice for most proprietors, their choice is made in the light of their limited opportunities in the labour market. They generally work in the household business sector not because they cannot find a job elsewhere, but because the house-hold business sector is the best option compared to the other options open to them in view of their attributes and past experience. Farmers do not earn enough. Private sector work is no magic bullet because it generally undermines the work-life balance. Public sector work might be preferable to running a household business, but it may be out of reach. All of this means that those who work in the household business sector have very little chance of mobility out of the sector.
Furthermore, the household business sector is a major contributor to vietnamese gross domestic product (Gdp), generating almost one-third of non-farm Gdp and 23 percent of total GDP. The informal sector alone accounts for 15 percent of non-farm GDP. In trade, the household business sector’s contribution is very high: 63 percent of value-added generated by the trade sector comes from household businesses, half of it from the informal sector. However, its share is significant in all economic sectors. The new, robust calculation of the household business sector’s contribution to GDP estimated from the 2014/15 HB&IS survey and presented in detail in Chapter 5 makes for a re-evaluation of 16 percent of the value-added generated by the household business sector. This should be considered as a minimum estimate.
The household business sector contributes to state revenue, albeit slightly. Almost all formal household businesses pay at least one type of tax. Even in the informal sector, which is by definition distanced from the tax system, a not-inconsiderable share of businesses (15 percent) pay tax. Although the proportion of taxes in the house-hold business sector’s value-added is very low (1.2 percent), household businesses pay value-added tax (VAT) on the products they buy, so their real contribution to the state budget is higher than the amount of taxes declared by proprietors (Chapter 5). Moreover, the household business sector’s contribution to state revenue could be raised by enforcing formal household business regulations and providing incentives for informal household businesses in rural areas to register their business (Chapter 3). One-third of formal household businesses do not currently comply with tax registra-tion, although they are legally bound to do so. Rural household businesses are less likely to be formal irrespective of their size and other characteristics and are thus less

executive summary | The household Businesses and the Informal sector in vietnam | 13
likely to pay tax. Only 20 percent of household businesses in rural areas are formal compared to one-third in urban areas, although rural informal household businesses are larger on average and work more in manufacturing and construction. This suggests a lack of regulatory enforcement and business registration incentives in rural areas.
The household business sector’s weak linkages with other sectors contribute to its economic resilience. Although household businesses and the informal sector can be seen everywhere and are part of everyday life, they are not well embedded in the economy from the point of view of dealings and flows with the formal enterprise sector. Household businesses mainly trade with each other and with final customers as shown in Chapter 5. Very few of them engage in subcontracting arrangements with formal enterprises. Subcontracting occurs more between household businesses, but it is not a major form of production as it is in some countries like Thailand. The relative isolation of household businesses and the informal sector in particular explains why the household business sector is resilient in the event of economic shocks. Fluctua-tions in the formal enterprise sector have little impact on the informal sector. Yet it is highly dependent on final demand, as it mostly produces and sells to final consumers. The steady growth in individual incomes could be a powerful driver for the sector.
1.2. The importance of household businesses and the informal sector should be upheld in the future
As developed in Chapter 2 and contrary to expectations, employment in the house-hold business sector has not fallen significantly as foreign and domestic enterprise has grown. From 2007 to 2014, a period of extensive growth and trade liberalization, the size of the household business sector remained unchanged at 9 million produc-tion units. Similarly, the household business sector’s contribution to employment remained virtually stable. Formalization of the Vietnamese economy has been at work with the reduction of the relative weight of the informal sector in employment, but this process has been tenuous, and it is mostly due to a shift from informal household businesses to formal household businesses.
On the one hand, two structural changes that contribute to the formalization of the economy are at play. First, youth employment channels less often through the informal sector than before, as shown by the aging of workers in the informal sector. Second, self-employed workers, especially in insecure trading activities, are ten-ding to be replaced by household businesses with employees, which are usually family members (Chapter 3).

| The household Businesses and the Informal sector in vietnam | executive summary14
On the other hand, the shift from the agricultural sector to the informal sector and the strong complementarity between these two sectors swell the ranks of workers in the informal sector. Working in the informal sector is an agricultural business diversi-fication strategy for a not-inconsiderable proportion of households and this strategy is becoming increasingly widespread. Therefore, the decrease in the informal sector should be slowed in the coming years by this diversification strategy by households involved in farm activities. Agricultural households’ demand for jobs in the informal sector would remain high due to the low entry barriers in the sector (Chapter 2).
unfamiliarity with regulations and weak perceived advantages are two other brakes to formalization. Most informal household businesses do not register because they think they do not have to do so (Chapter 3). Even household businesses with several workers or with high value-added and profit are of this opinion. This clearly shows that there is a lack of knowledge of the regulations. In addition, a large share of informal household businesses see no advantage to becoming formal. Fast tracking the shift from informal to formal household businesses therefore calls for information on regulations to be circulated more widely and possibly standardized across districts for greater transparency. Incentives to become formal also need to be developed. As already pointed out in a study based on the 2007 and 2009 HBIS surveys (Deme-net et al., 2016), not all production units in the informal sector are concerned by the possibility of registration. Yet for businesses that are, encouraging it is relevant since it is likely to improve their operating conditions, and decisions could be taken to enhance the impact of formalisation on performance.

executive summary | The household Businesses and the Informal sector in vietnam | 15
2.THIS SECTOR HaS THE pOTENTIal TO CONTRIBUTE TO INClUSIVE gROwTH
The contribution of the household business sector to employment and the creation of wealth makes it an important player in growth. This sector is key to inclusive growth as it provides jobs and incomes to poor and vulnerable people. It delivers goods and services in economic activities not occupied by formal enterprises such as street res-taurants, local retailers, tailor-made clothing and certain handicrafts. It has strong growth potential because it still, on average, has a low level of technology, equipment and skills, and includes a dynamic, innovative segment. Creating a more favourable environment and enhancing skills could boost the sector’s productivity and hence increase the national economy’s average productivity. The sector’s heterogeneity calls for differentiated policies.
2.1. The sector’s low productivity leaves a great deal of room for improvement
The scale of operations in the household business sector is particularly low, especially in the informal sector, leaving room for policy actions. One in two informal businesses employs just one person and more than 40 percent the proprietor with their spouse and/or family members, making for an average size of 1.8 workers. Formal household businesses are larger, but the scale of operations is still very low with 2.3 workers on average and around one-third self-employed workers (Chapter 3). The median value-added generated per month by formal household businesses is around 5.5 million VND and 2.6 million VND in the informal sector (Chapter 6). Consequently, around half of informal household business owners make a profit below the minimum wage.
productivity per worker is also low in the informal sector. It is just above the level of productivity per worker in the agricultural sector. The upper segment of the household business sector is more efficient, suggesting that there is strong potential for improving productivity in this sector and increasing its contribution to economic growth. Productivity in formal household businesses is nearly twice as high as in in-formal businesses. It is not far behind the productivity of formal domestic businesses. The lack of productivity in the informal sector could be explained by a surplus of labour, especially family labour, and by fierce competition in trade and services, which reduces margins and value-added.

| The household Businesses and the Informal sector in vietnam | executive summary16
The low level of investment by household businesses is another reason for the lack of productivity. It seems that investment is made mainly on business start-up. Once the business is in operation, most owners invest mainly to maintain their capital. Only a small share is put into expanding their business by reinvesting profits in new equip-ment. As a result, the value of the equipment is generally negligible with two-thirds of household businesses having a capital of less than ten million VND, with a median value of three million VND not counting land and premises. At the national level, the contribution of household businesses to gross fixed capital formation (9.4 percent) is well below their share of GDP. In other words, although household businesses make a large contribution to GDP, their contribution to investment in and the technological progress of the national economy is small (Chapter 5).
However, this does not mean that the household business sector lacks drive. The ave-rage picture paints over the sector’s wide range of income, profitability, scale and mode of operation. These differences are depicted in Chapter 6. By way of an illustra-tion, the average profit of the upper decile of household businesses is 145 times the average profit of the lower decile; 23 percent of household businesses report their profit at less than 3 million VND of capital while 19 percent report more than 50 million; 3 per-cent of household businesses invest more than half of total investment in the sector.
Thus, a large segment of around one-third of household businesses is dynamic. These mostly formal household businesses are innovators and in step with the country’s modernization. They invest in equipment, operate on a larger scale, are willing to develop their business, and they innovate their product or their production process, or prospect for new customers or change suppliers to reduce their costs (Chapter 8).
It seems that the sector’s buoyancy relies on a process of bankruptcy/start-up, in which less successful household businesses close while new household businesses set up start immediately at a higher technological or skills level. This process cannot be measured by a survey, since there is no information on household businesses that have closed. Note, however, that formal household businesses recently started up have more assets, higher initial capital, are better educated and are more innovative on average. The potential of the household business sector for growth should also be boosted by the demographic transition, which will help reduce the surplus of labour in the sector.

executive summary | The household Businesses and the Informal sector in vietnam | 17
2.2. Yet this potential needs to be supported by policy actions
most of the household business owners complain of problems running their bu-siness and their demand for support is huge. Eight in ten household businesses have problems running their business. The most widespread problem is a lack of market outlets, especially in the trade sector (Chapter 11), reflecting the strong competition between household businesses and a lack of information available to them on market opportunities. This calls for a policy designed to improve the information available to household businesses on market opportunities in order to develop niches for the sector, especially in trade. The information gathered when setting up a business comes mostly from family members based on the experience of past generations (Chapter 10). The fact that there is almost no other source of information, such as for-mal associations, highlights the urgent need to develop other information channels, particularly those able to convey innovative information. Skills are also an important factor to be developed in order to facilitate market research prior to business start-ups and the creation of innovative products.
While the main problem identified by household businesses is market outlets, their demand for support is mainly for better access to bank loans. almost half of house-hold businesses complain about their financial constraints and ask for help to secure loans (Chapter 11). Proprietor perceptions aside, the credit constraint turns out also to be not-inconsiderable when it is measured objectively. Household businesses are constrained when their bank loan applications are rejected or when they need credit, but do not apply for a bank loan because they know that they do not fulfil the requirements (self-rejection). Some 16 percent of household businesses are constrai-ned on the basis of this definition. Yet when the definition is extended to those who need credit, but have to turn to the informal credit market to meet their demand, one-quarter of household businesses are credit-constrained. Informal lenders in actual fact provide one-third of the amount lent to household businesses (Chapter 7).
Credit constraint places a strong restriction on the development of household busi-nesses’ activities and their capacity to invest and innovate. formal credit is not suited to household business demand, giving rise to crowding-out effects from informal credit and credit constraint. On the supply side, the lack of very short-term credit gives household businesses considerable cash flow problems, which make them even more vulnerable. In particular, microfinance institutions should do more to target the most credit-constrained informal household businesses. Conversely, the absence of long-term credit for household businesses may be one of the causes

| The household Businesses and the Informal sector in vietnam | executive summary18
of the very low rate of investment, which in turn limits productivity at a low scale. More generally, the credit constraint is also due to the lack of government institution recognition of household businesses and calls for household business mainstreaming in the government’s enterprise policy. On the demand side, support is needed to im-prove the creditworthiness information provided by household businesses in order to make formal credit institutions less reluctant to provide them with loans. Training in management and accounting techniques might be effective in this respect, as more than half of all formal household businesses do not keep books and only 5 percent have a formal accounts system.
3.THE NEED TO aDDRESS wORkER VUlNERaBIlITy IN HOUSEHOlD BUSINESSES aND THE INfORmal SECTOR
Household business owners and their employees are extremely vulnerable. House-hold business owners’ low incomes rule out their capacity to deal with business shocks and illness by adopting coping strategies free of negative repercussions in the long run. Poor working conditions make employees particularly vulnerable and these conditions have improved very little. Surprisingly, wage workers and formal business employees are no less vulnerable. Social security is key to policy to tackle this vulne-rability, especially in a context where social security for all is a stated policy target for 2025. Health insurance has posted impressive progress in terms of coverage in the household business sector, but obstacles to universal coverage still prevail. Other social security elements, particularly pension schemes, are almost non-existent in the household business sector. The findings of the 2014/15 HB&IS survey suggest some ways to improve worker protection in household businesses taking into account their heterogeneity.
3.1. Household businesses concentrate a vulnerable population
Almost one-third of household business heads had suffered at least one shock calling for significant expenditure in the previous 24-month period. These shocks were mostly severe disease, loss of stock and occupational injury. Illness is also especially frequent and has long-term impacts on the activity of household businesses (Chapter 9). Around 40 percent of household business heads had experienced illness that affected their work in the previous 12 months. The cost of sickness is particularly high: health expenditures by informal household business owners amount to 41 percent of the pro-fit generated by their business (14 percent of formal household businesses), and they

executive summary | The household Businesses and the Informal sector in vietnam | 19
often crowd out expenditure on the household business. Proprietors usually have to stop working for some time, which can place them in a very difficult situation, especially the half of informal household businesses whose profit is below the minimum wage. strategies to cope with shock and illness have often long-lasting repercussions, such as the strategy used by a not-inconsiderable proportion of informal household busi-nesses to sell productive assets.
contrary to popular belief, a large share of household business owners cannot count on assistance from friends or family in the event of difficulties, making them even more vulnerable. A full 36 percent of household business owners are highly vulnerable, as their social network does not secure them any risk-sharing or infor-mal insurance mechanisms to cope with shocks: they cannot borrow money for short periods of time, family and friends are unable to provide financial support for their business, and they do not belong to an informal rotating credit and savings associa-tion (Chapter 10). This belies the commonly held view that solidarity in Vietnam offsets the lack of formal insurance.
On the household business employee side, a widespread lack of formal arrange-ments and social protection, frequent non-standard forms of employment, and low earnings place household business employees in a precarious and vulnerable situation. Half of household business employees do not have any form of contract and only two percent have a written contract. The proportion of employees with health in-surance is slim at 24 percent (Chapter 4) and this insurance comes mostly from other family members, as only three percent of household businesses are registered with social security. Part-time work is frequent and accounts for about two-thirds of family workers and nearly one-third of wage workers. In addition, a not-inconsiderable share of employees are temporary workers. Wage workers’ earnings have improved since 2007, but the earnings gap has widened between wage workers in the household business sector and the formal enterprise sector. Household business wage workers’ earnings are still far behind the formal enterprise sector. They are growing, but at a slower pace than the formal enterprise sector.
Interestingly, the 2014/15 HB&IS shows up some unexpected vulnerability findings. wage workers are not actually less vulnerable: they are covered by health insu-rance only about half as much as family workers, almost none of them have a written contract and paid leave is rare. Their longevity in the business is half that of family workers and, although they earn higher wages than other employees, one-quarter of them still earn less than the minimum wage. In fact, the lack of a formal guarantee

| The household Businesses and the Informal sector in vietnam | executive summary20
is partially offset by strong ties between household business owner and employee (Chapter 4). As a result, family workers are more likely to benefit from decent work elements such as health insurance and greater stability. This is at odds with the idea developed by the ILO that family workers and own-account workers are in vulnerable employment, while wage workers and employers are more likely to have decent work conditions. This may hold true in private business, but not in the household business sector in Vietnam.
Similarly, formalization does not provide greater insurance or stability. Employees in formal household businesses do not have better access to health insurance or, more generally, to social security than employees in the informal sector. Formal house-hold businesses do not have greater longevity than informal household businesses, and neither do their employees within these businesses. However, earnings are on average higher in formal household businesses, with the added benefit of bonuses and paid leave, than in the informal sector (Chapters 3 and 4). Finally, vulnerability appears to be more severe in urban areas than rural areas, as shown by the erosion of social networks in urban areas (Chapter 10). More household businesses are ex-cluded from supportive networks and risk-sharing mechanisms in urban areas than in rural areas, where the social fabric is still dense.
3.2. An urgent need to improve social security coverage and quality
The vulnerability of household business workers to shocks, in particular to illness, and the inefficiency of informal risk-sharing mechanisms call for improvements to the coverage and quality of the social security in the household business sector.
Impressive progress has been made with the extension of health insurance cove-rage in the household business sector, mostly by developing the voluntary scheme. In 2014, 54 percent of household business owners had a health insurance card, half of them through the voluntary scheme. Most household business owners are well aware of the existence of this voluntary scheme, which was not the case in 2007. Progress is much more mixed as far as employees are concerned. Less than one- quarter are covered by health insurance and this figure drops to just 14 percent when family workers are not considered. Incentives should be created for employers to provide their employees with health insurance.
Chapter 9 highlights two main obstacles to universal coverage. First, the cost of health insurance is beyond the means of the poorest household business owners, especial-

executive summary | The household Businesses and the Informal sector in vietnam | 21
ly in the informal sector. health insurance coverage could be improved for these household businesses by expanding – or improving the allocation of – social assis-tance. More than two-thirds of the poorest quartile of household businesses do not benefit from social assistance, while a not-inconsiderable share of the highest-earning household businesses do. Second, the observed phenomenon of adverse selection places a question mark over the long-term sustainability of the voluntary scheme. The voluntary scheme is subscribed to mostly by less healthy household business owners. Raising the awareness of currently healthy household businesses as to the importance of being covered against health risks and hence encouraging them to contribute to the voluntary scheme would increase the sustainability of the scheme and make funds available for better reimbursement of health expenditures and wider social assistance coverage.
Another particularity of the household business sector is the absence of other aspects of social security. As already said, almost no household business is registered with so-cial security. only a tiny minority of household business owners plan to count on a social security pension when they grow old. The overwhelming majority of workers will continue working, use their savings where they have some or ask for support from family members. a lack of information on the existence of the pension scheme explains part of the shortfall in contribution to this scheme, especially in the infor-mal sector where it remains largely unknown to date. formal household business distrust in the system and its cost for informal household businesses are the other reasons for non-contribution to the pension scheme (Chapter 9). Progress to expand pension scheme coverage would benefit from making household businesses aware of its existence. Yet the lack of information is not the only brake on the spread of this scheme. The cost-benefit ratio will need to be redefined and a strong trustworthiness signal sent to attract formal household businesses. Informal household businesses cannot afford to subscribe to the scheme as it is at this stage.

| The household Businesses and the Informal sector in vietnam | executive summary22
4.CONClUSION
This book demonstrates that the household business sector plays a key role in the Vietnamese economy and will continue to do so in the medium run. It is a major player in promoting inclusive economic growth by means of jobs for a large segment of the population, the sector’s flexibility, the vitality of one of its segments, and the large room for improvement in its productivity. The household business sector, in-cluding the informal sector, is not an urban phenomenon: it plays a crucial role in rural areas as well. It should not be seen as a backward sector as it is able to adapt and use new technologies. Yet it has to date been largely left out of public policies. Greater sector inclusion in public policy and the development of supportive actions for the sector are necessary conditions to achieve a new growth model for Vietnam with benefits for more of the population.
The sector cannot be included in the growth model merely by fostering the formali-zation of the informal sector. Rolling back the informal sector is usually perceived as a desirable goal, since people working in this sector are vulnerable and productivity is low. Yet registering informal household businesses can only be part of the solu-tion, as formal household businesses do not usually display the expected attributes of formality such as less vulnerability and high productivity. Formalization needs to be addressed more broadly than just through a business registration lens. It should entail improved performance in the production process, progress with labour conditions and higher levels of subscription to social security for workers.
These objectives could be achieved by active policies. The policymaker’s first concern when addressing worker vulnerability in the household business sector should be to create social security incentives to promote worker protection. Social assistance targeting would have to be readjusted to reach the most vulnerable people in the household business sector. Policy should also be developed to raise household business proprietor awareness of the health risk and its long-run, negative repercus-sions to ensure that it is no longer only those in poor health who contribute to the voluntary health insurance scheme. Information should be circulated and trust built to improve subscription to the pension scheme. Lastly, the social security cost-benefit ratio needs rethinking taking into consideration the sector’s heterogeneity and contri-bution capacity differences between its players.

executive summary | The household Businesses and the Informal sector in vietnam | 23
Household business sector productivity could be also improved by policies designed to improve the information available to household businesses on market opportuni-ties and innovation. An effort needs to be made to develop a credit market adapted to household business particularities and heterogeneity, with microcredit better tar-geted at the informal sector and long-term credit to promote investment by high-potential household businesses. Policymakers should not overlook upskilling policies, especially for a better match with market opportunities and to improve management skills in order to increase the creditworthiness of household businesses, in particular for the upper tier of the sector.
Regular sector monitoring is required to design sound policies to meet these objectives. A decisive step forward could be taken with the quality of information on household businesses and more specifically the informal sector by close aligning the national sta-tistical system’s survey samples and methods. The scope of the some of the surveys could be extended with specific modules on sub-samples in order to capture the main challenges raised by the household business sector.

| The household Businesses and the Informal sector in vietnam24

chapter 01 | The household Businesses and the Informal sector in vietnam | 25
measuremenT of household BusInesses and The Informal secTor: concepTs and survey meThodoloGy
nguyen Thi Thu phuongvu hoang dat
In the current state of the statistical system, measurement of the economic weight of household businesses and the informal sector is not satisfactory. Due to the spe-cificity of the informal sector, in which activities are mostly performed at home or without a premises, data based on enterprise censuses like the Non-Farm Individual Business Establishment (NFIDBE) survey are not representative of this sector. They underestimate the size of the informal sector in the economy by excluding small and micro activities that do not have a professional premises. At the same time, they overestimate the economic performance of HBs in the informal sector by overrepre-senting large HBs in the sample (Cling et al., 2010).
The Labour Force Surveys (LFSs) and the Vietnamese Household Living Standards Surveys (VHLSSs) allow measuring the size of the informal sector as a whole, but they have limitations and drawbacks. The LFSs do not allow measuring the income of household businesses or self-employed workers. They do not provide information about the characteristics of household businesses such as their size, composition of employment or any accounting figures. Even information about individuals involved in household business activity is scarce. Consequently, the mechanisms of adjustment in the labour market are still misunderstood, as one of the main mechanisms, adjusting the price of labour, has not yet been observed for the majority of the labour force. As far as the VHLSSs are concerned, they do not provide detailed information about the owners of household businesses or the other workers in the business sector, which makes it impossible to link the characteristics of workers, in particular their skills and their employment status, with the characteristics of a business. Moreover, there are not many questions concerning the economic activity of businesses in either of the
01

surveys. They are unable to inform on specific questions related to the productivity of informal HBs, their links with other sectors, the strategies informal entrepreneurs employ to face shocks, or the vulnerability of their workers (Cling et al., 2010).
Therefore, the 2014/15 Household Business & Informal Sector (HB&IS) survey aimed to collect and analyse new data on the informal sector that is representative at the national level in order to design policies that promote inclusive growth. It builds on the previous IRD-DIAL/GSO-ISS project on the informal sector (2006-2011). Two HB&IS surveys were conducted (one in 2007 and one in 2009) in Hanoi and Ho Chi Minh City, and the design of these surveys, which relies on the 1-2-3 survey methodology, was conceived by IRD-DIAL (Roubaud, 1994) and is the result of extensive international experience.
As in the previous rounds, the 2014/15 HB&IS survey was designed to offer reliable estimates of the HBs’ weight in terms of production, labour or capital, and their per-formance (e.g. turnover, value added and profit) by reconstructing the HBs’ missing financial records and by taking into account seasonality, which is strongly associated with the informal sector. It provides information about sources of input and product destinations in order to understand the linkage between HBs and the other sectors of the Vietnamese economy. By listing all the workers at HBs and their socio-demogra-phic characteristics (e.g. sex, age, education, training and experience) and conditions of employment (e.g. contract, social protection, working hours and remuneration), we are able to assess the degree of vulnerability of the workers in that sector and to analyse how it is linked to the characteristics of the HB.
Two main innovations characterize the 2014/15 HB&IS survey. The first is the coverage of the survey, which is the first survey to be representative of the informal sector and HBs at the national level, and the second is the introduction of specific modules which allow addressing issues that are crucial to better understanding this sector.
As mentioned during the National Assembly meeting in December 2012, policy ma-kers need to understand the dynamic of the labour market at a disaggregated level and take into account the particularities of the different industries and also some local specificity. As we know from the experience of other countries, the informal sector is multi-segmented and highly heterogeneous (Hart, 1972; Mead and Morrisson, 1996). Although the survival self-employed account for the bulk of this sector, there is an upper tier comprised of performant and innovative entrepreneurs. More recently, the informal sector has been viewed as a continuum where myriad variation in types of
| The household Businesses and the Informal sector in vietnam | chapter 0126

businesses can be identified (Maloney, 2004, Grimm et al., 2012). Having a representa-tive perception of the informal sector allows policy makers to then target policies to different tiers of this sector. Furthermore, the 2014/15 HB&IS survey covers rural areas, where the informal sector is largely unknown, and therefore allows for a comparison with the informal sector in urban areas.
In addition, the survey provides focus on four topics that are essential to the design of supportive policies towards the informal sector in Vietnam but remain poorly un-derstood. First, an extended module on social protection was developed in order to understand the vulnerability of household businesses and to document the challenges of social protection. Social protection against risks has been on the policy agenda in recent years, especially the objective of achieving universal coverage of health insu-rance. Of the major challenges raised, the inclusion of the informal sector is not the least, and new knowledge is needed to address this challenge.
Second, lack of access to credit has been identified as one the main constraints of HB&IS development (Cling et al., 2010). A specific module was designed to better understand the need for formal and informal credit among HBs, their use of this credit, and whether informal credit is a substitute for formal credit.
Third, as highlighted by De Beer et al. (2016), “while evidence shows that informal en-trepreneurs can drive innovation, research on innovation in developing countries has been devoted mostly to formal sectors, organizations and institutions.” Vietnam is not an exception. Assessing the role of innovation emanating from HBs and the informal sector and identifying the innovators and the types of innovations that are generated is therefore essential to promoting inclusive growth.
Finally, an innovative module on social networks was introduced. Various studies suggest that interpersonal connections are a key determinant of the performance of an enterprise, determining access to credit, a premises, labour and information about market opportunities. Social networks may play a major role in risk-sharing mecha-nisms. Understanding the use and the features of the social networks of HB owners is then necessary in order to document the determinants of HB performance and vulnerability.
The design of the survey serves three main objectives: (1) assessing the weight of the HBs and the informal sector in the Vietnamese economy; (2) unlocking the potential of household businesses by identifying the blocking factors that affect their perfor-
chapter 01 | The household Businesses and the Informal sector in vietnam | 27

mance and then documenting which interventions are best suited to improve their productivity; (3) identifying the source of vulnerability among workers at HBs and in the informal sector in order to ensure better protection of the labour force.
This chapter is organized as follows. The first section presents the concepts of house-hold businesses and the informal sector and how to measure them. The second section details the methodology of the 2014/15 HB&IS survey, in particular the scope of the survey, the questionnaire, the sampling design and the weighting. The third section reports on the field implementation of the 2014/15 HB&IS survey. Finally, the last section puts the 2014/15 HB&IS survey in the context of the national statistical system.
1.mEaSUREmENT Of THE INfORmal SECTOR: DEfINITIONS aND THE 1-2-3 appROaCH
1.1. Definition of household businesses and the informal sector
According to the law and the statistical system, there are five categories of businesses in Vietnam: state-owned enterprises (SOEs), private domestic enterprises, foreign- invested enterprises, cooperatives, and non-farm household businesses. The 2014/15 HB&IS survey covers this last category. While some of the HBs are formal, all of the informal HBs constitute the informal sector, as illustrated by the following definition.
Household businessThe concept of household business is quite specific to the national statistical system of Vietnam. It refers to any business owned by either one individual or household that is not registered under the Enterprise Law and whose main activity is non-agricultural. It may employ only up to ten employees as any household business which regularly employs more than ten employees has to register the business as an enterprise. A HB is a usually a small business, it is often informal, and it sometimes has only one worker: the owner.
Informal sectorDefined by the international statistical community in 1993,1 the informal sector covers household businesses that produce or distribute goods and services for the market (at least partly) but are not registered as required by national legislation. Although this
1. 15th International Conference of Labour Statisticians (ICLS-ILO).
| The household Businesses and the Informal sector in vietnam | chapter 0128

definition offers a consistent foundation to measure and analyse the informal sector in terms of labour statistics and national accounts, this definition has to be operatio-nalised at the national level (see Cling et al., 2010 for more details).
In Vietnam, the GSO defines the informal sector as all “private unincorporated enter-prises that produce at least some of their goods and services for sale or barter, that are not registered (i.e. do not have a business license) and that are engaged in non-agricultural activities.” In other words, the informal sector is constituted of all the HBs which do not have a business license.
By law (Decree No. 78/2015/ND-CP on business registration), household business owners have to register their business with the People’s Committee at the district level, and they have to register tax codes. However, street vendors and other low-income businesses are exempt from business registration. The threshold that defines low income is set at the provincial level by the People’s Committee.
1.2. The 1-2-3 survey approach
The HB&IS survey is based on the 1-2-3 survey scheme (Razafindrakoto and Roubaud, 2003). This methodology has already been implemented in more than 40 countries throughout the world. In Vietnam, it was utilised for the 2007 and 2009 HB&IS surveys in Hanoi and Ho Chi Minh City (Cling et al., 2014). The 1-2-3 survey scheme is interna-tionally recognized as the most cost-effective approach for measuring the macroeco-nomic and socioeconomic dimensions of an informal economy (Asian Development Bank, 2011; ILO, 2012).
The general principle of the 1-2-3 survey is to use information drawn from a survey of households that is concerned with the activity of individuals (phase 1 of the Labour Force Survey) in order to select a sample of informal production HBs to which a spe-cific questionnaire concerning their activity is applied (phase 2 of the HB&IS survey in Vietnam). In phase 2, a sample of the individuals identified in phase 1 as owners of household businesses, and whose work status is either employer or self-account worker, is asked to complete the questionnaire about his/her HB (see Figure 1.1). This methodology allows the capturing of all kinds of informal activities, including hidden or home-based activities as well as itinerant activities that are not properly covered by establishment surveys.
chapter 01 | The household Businesses and the Informal sector in vietnam | 29

| The household Businesses and the Informal sector in vietnam | chapter 0130
Phase 1Labour force survey
(representative sample of household)socio-demographic characteristics
employment
Phase 2Informal sector and HBs
(representative sample of formal and informal HBs)
Phase 3Consumption and living
conditions
> General: extended labour market indicators> Speci�c: measure informal sector & informal employment> Speci�c: �lter information to identify HB owners
> General: informal sector and HB economic aggregates (production, value added, investment, etc.)> Speci�c: origin of input and use of output, characteristics of the workers, problem and demand for assistance, etc.
> General: income/expenditure & poverty indicators> Speci�c: informal sector share of household consumption
FIgURe 1.1.BASIC SCHeme OF THe 1-2-3 SURVeY
Source: Cling et al. (2010)
2.mETHODOlOgy Of THE 2014/15 HB&IS SURVEy
2.1. Scope of the survey
The unit of the survey is not an individual or a household but a non-farm household business. Considered as a HB is any business which is not a corporate enterprise and whose main activity is non-agricultural. The interviewee is the head of the HB, that is to say the individual who states during the LFS interview that s/he is the head or owner of an unincorporated non-agricultural business as his/her main activity or as a secondary activity.
As in 2007 and 2009, the scope of the 2014/15 HB&IS survey covers all HB types in order to compare informal and formal HBs. This comparison allows for a better observation of the particularities of informal HBs and consequently may be used for questioning the relevance of the adopted definition of the informal sector. In addition, for the first time the survey was expanded to cover rural and urban areas and desig-ned to be representative of HBs at the national level.
The final sample of the survey includes 3,411 HBs, including 2,382 informal HBs which are representative of the informal sector in Vietnam and 1,029 formal HBs (see Table 1.1). More than half of the HBs are in urban areas (57 per cent) and 1,468 of the HBs are in rural areas. Though the most represented provinces are Hanoi and Ho Chi Minh

City, with 853 and 722 HBs respectively, all six of the Vietnamese administrative re-gions are represented in the survey. HBs from 12 provinces are in the survey: Hanoi, Ho Chi Minh City, Cao Bang, Bac Kan, Quang Ninh, Hai Duong, TT Hue, Phu Yen, Kon Tum, Binh Phuoc, An Giang and Soc Trang. A geographic repartition of the interviewed HBs is shown in Figure 1.2.
chapter 01 | The household Businesses and the Informal sector in vietnam | 31
TABLe 1.1.NUmBeR OF HBS SURVeYeD PeR PROVINCe BY RegISTRATION AND geOgRAPHICAL AReA
Rural Urban Total
Provinces Informal Formal Total Informal Formal Total
Hanoi 360 68 428 313 112 425 853Cao Bang 41 28 69 36 53 89 158Bac Kan 46 32 78 47 68 115 193Quang Ninh 29 7 36 32 21 53 89Hai Duong 27 12 39 74 62 136 175TT. Hue 74 62 136 117 53 170 306Phu Yen 63 7 70 67 39 106 176Kom Tum 38 20 58 72 62 134 192Binh Phuoc 46 21 67 74 47 121 188HCMC 270 95 365 257 100 357 722An Giang 73 16 89 61 29 90 179Soc Trang 38 7 45 98 49 147 192Total 1,134 334 1,468 1,248 695 1,943 3,411
Source: 2014/15 HB&IS survey, VASS-CAF & IRD-DIAL; authors’ calculations

| The household Businesses and the Informal sector in vietnam | chapter 0132
Cao vBằng
Bắc vKạn
Hà vNội Quảng v Ninh
Thừa vThiên - Huế
Kon vTum
Phú vYên
Bình vPhước
An vGiang
Sóc vTrăng
tp vHô vChiv Minh
Quần- đảo- Hoàng-Sa
Quần-đảo -Trường -Sa
FIgURe 1.2.mAP OF HOUSeHOLD BUSINeSSeS INTeRVIeweD
Source: MDRI

2.2. The questionnaire
The questionnaire is based on the standard questionnaire for phase 2 of the 1-2-3 sur-vey methodology, and it was tailored to the situation in Vietnam. It was designed to ensure comparability with previous surveys of the informal sector: the HB&IS surveys in 2007 and 2009. The questionnaire is a bit different than these two surveys in that two modules related to access to credit and social capital were added, and a module on social security was further developed. It is comprised of the following 11 modules:
– Module A: Characteristics of the HB
– Module B: Manpower2
– Module C: Production and sales
– Module D: Expenditures and charges
– Module E: Customers, suppliers and competitors
– Module F: Equipment and investment
– Module G: Access to credit
– Module H: Perceptions, economic environment and prospects
– Module I: Health insurance, old age pension and vulnerability
– Module R: Role of the state and relationship with the administration
– Module S: Social capital
The time duration for completing one interview with a self-employed respondent was between 90 and 120 minutes, while that for an employer respondent was around 180 minutes.
Prior to these subject-specific modules, the first page of the questionnaire begins with a “filter module.” This module was designed to check that the information on the HBs collected in the LFS is accurate. Modules B, C, D, and F are used to reconstruct the accounts of the businesses, with the calculation of the main aggregates such as pro-duction, sales, the purchase of raw materials and merchandise, charges, taxes and payroll. When aggregated, these accounts can supply statistics which can be used at the macroeconomic level. In particular, national accounts aggregates of this sector can be calculated.
2. This module collects information on the characteristics of each member of the labour force in the HB surveyed (e.g. qualifications, gender, relationship with the owner of the HB, migration status and ethnic group).
chapter 01 | The household Businesses and the Informal sector in vietnam | 33

The main challenge for the calculation of these aggregates is to ensure compatibility with the daily empirical categories managed by informal sector entrepreneurs, the vast majority of whom do not comply with formal accounting rules (or even keep any kind of accounts). For this purpose, detailed income and expenditure tables (product by pro-duct) are drawn up, leaving it up to the entrepreneurs to choose the reference period that suits them the best for each good and service they produce (from day to year, and all of the combinations in between). In the absence of written accounts, only this fasti-dious procedure can ensure the reliability of the data produced (Vescovo, 2007). In addi-tion, input source and product destination are collected for each item listed in the data tables in order to understand the informal sector’s place and links with other sectors.
The calculation of aggregates takes into account the seasonality of economic activity of HBs over the year. Once the previous month’s accounts have been carefully set up, a recall table establishes the level of turnover month by month (see Cling et al., 2010, p. 56 for more details).
The content of the other modules is presented in each corresponding chapter.
2.3. Sampling design
The sampling of the 2014/15 HB&IS survey was taken from the three first quarters of the 2014 LFS. Among the 380,487 respondents present in the database, 40,367 individuals stated that they were the head of one HB (as a first or secondary job). 645 individuals stated that they were the head of two HBs, which makes the sample frame 41,012 non-farm HBs in total.
The sampling of the 2014/15 HB&IS survey is multistage and stratified. The two first stages follow the probability proportional to size method (PPS). This sampling strategy identifies clusters, which in this case are provinces and enumeration areas. Those clus-ters have a higher probability of being sampled according to their HB population size. The first stage is to select 10 provinces among the 61 provinces other than Hanoi and Ho Chi Minh City, which are automatically sampled. The selection of the provinces is called the primary sampling unit (PSU). Provinces are selected in each of the six Viet-namese regions: Two provinces are selected in the Northern Mountains, two provinces other than Hanoi are selected in the Red River Delta, two provinces are selected on the Central Coast, one province in the Central Highlands, one province other than Ho Chi Minh City in the Southeast and two provinces in the Mekong Delta. Provinces that have a large HB population are more likely to be selected.
| The household Businesses and the Informal sector in vietnam | chapter 0134

The second stage of the sampling consists of sampling the enumeration areas in the 12 provinces selected during the first stage. Enumeration areas (EAs) with at least one manufacturing HB were automatically sampled in order to have enough observations to conduct a specific analysis of the manufacturing HBs. Non-manufacturing enume-ration areas were drawn using a PPS sampling with the criteria to select 20 per cent of the non-manufacturing urban EAs and 20 per cent of the non-manufacturing rural EAs from the selected provinces. The selection of the EAs is called the secondary sam-pling unit (SSU).
The third sampling stage is the selection of HBs in the selected enumeration areas according to the following four criteria (stratification criteria): (1) manufacturing or non-manufacturing HBs; (2) urban or rural HBs; (3) self-employed or own-account workers; and (4) registered or non-registered. Based on these criteria, seven strata were defined (see Figure 1.3). Stratification allows the overrepresentation of some units, of which there are only a few in the LFS sample, like HBs that have registered and HBs in the manufacturing sector. The overrepresentation of these units allows us to perform a detailed analysis and to produce significant results for these units despite their relatively low number. The use of weights, however, corrects the figures for these units according to their importance in the total population of HBs. We selected all the manufacturing HBs and imposed a limit of 150 HBs per province. For non-manufactu-ring HBs, we selected 135 HBs per strata in Hanoi and HCMC and 28 HBs per strata in the 10 other provinces.
With this sampling design, the 2014/15 HB&IS survey is representative at the national and at the regional level. However, analyses at the provincial level are not robust.
chapter 01 | The household Businesses and the Informal sector in vietnam | 35

2.4. weighting and representativeness
The weights used in the 2014/15 HB&IS survey were calculated according to the sampling strategy and the post-weighting correction to fit the socio-demographic characteristics of the 2014 LFS. The sampling process in the 2014/15 HB&IS survey was conducted in three stages. Let us recall that the first sampling stage consisted of drawing 10 provinces other than Hanoi and Ho Chi Minh City, which were automati-cally sampled. The second sampling stage was the selection of the enumeration areas in each province, and the last sampling stage was the selection of HBs according to sector of activity, registration status and the geographical area.
Sampling weightsIn order to correct bias generated by the sampling design, e.g. the overrepresentation of manufacturing HBs, units were multiplied by sampling weights which took into account each stage of the drawing. The sampling weight of each HB was equal to the
| The household Businesses and the Informal sector in vietnam | chapter 0136
Provinces(SR = 19%)
STAGE 1 STAGE 2 STAGE 2
Manufacturing EAs(SR = 100%)
Urban non-manufacturing EAs(SR = 20%)
Rural non-manufacturing EAs(SR = 20%)
Non-manufacturing HBs
Stratum 1Manufacturing HBs(SR = 100%)
Stratum 2Urban + employer HBs(SR = 100%)
Stratum 3Urban + self-employed+ registred HBs
Stratum 4Urban + self-employed+ non-registred HBs(SR = 22%)
Stratum 6Rural + self-employed+ registred HBs(SR = 100%)
Stratum 7 Rural + self-employed+ non-registred HBs(SR = 28%)
Stratum 5Rural + employer HBs(SR = 100%)
FIgURe 1.3.THe THRee-STAge SAmPLINg PROCeSS OF THe 2014/15 HB&IS
Note: SR stands for selection rate

inverse of the HB’s inclusion probability (IP), i.e. the probability that the production unit would be drawn. As the sampling was done in three different stages, the sam-pling weight was calculated as followed:
– 1- Inclusion probability of the province (Number of selected provinces per region) * (HB population in the province/HB population in the region)
– 2- Inclusion probability of the enumeration area(Number of selected enumeration areas per province) * (HB population in the enumeration area/HB population in the province)
– 3- Inclusion probability of the HB (Sampled HB population per stratum and province/HB population per stratum from all the enumeration areas sampled in the selected province)
– 4- Total inclusion probability of the HB(IP of the province) * (IP of enumeration areas) * (IP of HB)
– 5- Sampling weight of the HB1/(total inclusion probability)
Post-weight adjustmentSampling weights only corrected the bias generated by the sampling design. They do not guarantee the representativeness of the sample with regards to the socio- demographic characteristics of the HB owners. Furthermore, the sampling weight was calculated using an unweighted reference sample of 41,012 HBs from the three first quarters of the 2014 LFS, which does not make it representative of the national popu-lation. Finally, some HBs refused to participate,3 and that may have biased the sample.
Therefore, post-weight adjustments allowed for further correction of the sampling bias. The method used was calibration. It allowed us to adjust the mother sample (here the LFS) according to the socio-demographic characteristics of the HBs. The cri-teria chosen to calibrate the 2014/15 HB&IS survey to the weighted population of the LFS were: the region (Ha Noi and Ho Chi Minh City counted as particular regions), the geographical area of the HB (urban or rural), and the gender and age (by category) of the owner. The combination of these criteria constitutes strata. The post-weight adjustments allowed us to obtain the same population size of HBs as the full database of the 2014 LFS for each of these strata. More precisely, post-weights were calculated in the following way:
3. The rate of refusal was 5 per cent.
chapter 01 | The household Businesses and the Informal sector in vietnam | 37

If we consider the HBi of the strata S (e.g. female HBs owners on the Central Coast, in rural areas, aged 50 to 59).Post-weight HBi = size of the strata S in the 2014 LFS * (sampling weight of HB i/ sum of the sampling weight of all HBs in strata S).
3.fIElD ImplEmENTaTION
The field work was begun in November 2014 and it was finished in January 2015. The total duration of the implementation of the 2014/15 HB&IS survey was 55 days. The field implementation was conducted by the Mekong Development Research Insti-tute (MDRI) in strong collaboration with IRD-DIAL and CAF. The survey was conducted using tablet technology to optimize the quality of the data collected. The data was entered directly into a tablet during the interview instead of using a traditional paper questionnaire. Using 3G internet access, the entered data was transmitted directly back to an online server for immediate data checking and cleaning. This procedure eliminated errors during the data entry stage and allowed the supervisors to conduct in-depth control of the quality.
TrainingTo guarantee that the collected data would be of high quality, great effort was made in the recruitment and training of the enumerators. Training courses for 75 enume-rators were conducted in November in Hanoi (for the enumerators in the northern provinces) and Ho Chi Minh City (for the enumerators in the southern provinces), each lasting eight days, including one day of field practice. The training course was facilita-ted by IRD, CAF and MDRI experts. The enumerators were selected by MDRI based on three assessments: a mid-term paper test, a final paper test and field practice. Finally, 64 enumerators were selected, and most of them had graduated from a university.
Quality controlAs households were specifically identified in the sampling frame, each survey team was supported by one or two guides from the local (commune level) statistics office who were responsible for taking the interviewers to the surveyed households and introdu-cing the survey team to the respondents. The experience and understanding of the local cultural and the demographic and geographic characteristics provided by the guides ensured that the process of data collection went smoothly. For instance, in areas with a large proportion of ethnic minority residents (e.g. in Kon Tum), the local guides helped build trust, translated when needed and helped with transportation in remote areas.
| The household Businesses and the Informal sector in vietnam | chapter 0138

In addition to the field supervision by MDRI, CAF and IRD, the field survey was closely monitored using tablet technology. This technology enabled the automatic recor-ding of all the interviews for quality control. The data entry program used was Survey CTO, and it included logical checking to prevent the entry of illogical data during the interview process. Ex-post controls were added to this process. MDRI, IRD and CAF developed a monitoring mechanism based on a set of indicators derived from the filled-out forms. This set of indicators included, among other things, the length of the interview or some parts of the questionnaire and the number of imprecise answers. All these indicators for each enumerator were compared with the average of all the enumerators, and the control actions (e.g. listening to the recordings, phone calls and field visits) were triggered when the indicators fell below a certain threshold.
4.HB&IS SURVEy IN THE NaTIONal STaTISTICal SySTEm
Although run independently of the General Statistical Office (GSO), the HB&IS survey is part of the statistical system as it uses a sub-sample of the national sample of the LFS and it uses the same concepts and definitions. In addition, it benefited from technical expertise offered by the GSO.
As mentioned in the introduction to this chapter, the Vietnamese national statistical system has other surveys or censuses which focus on the household business sector and are implemented by the GSO. They include the Non-farm Individual Business Es-tablishments (NFIDBE) surveys and the Viet Nam Household Living Standard Surveys (VHLSSs). The NFIDBE surveys are conducted every year and have a sample size of more than 200,000 individuals or family businesses. The sample is based on the census of establishments, which is conducted every five years. The VHLSS is conducted every two years.
The objective of the NFIDBE surveys is to collect information for generalized calcula-tions of basic characteristics such as the production value and value added of non-farm individual business establishments throughout the country (GSO, 2011). Consequently, the contents of the surveys cover the general aspects of production including, reve-nue, labour, capital and intermediate inputs. The sample size of the surveys is large enough to be representative at both the provincial and the two-digit-industry level.
The definition of a household business in the NFIDBEs as well as the criteria for being included in the survey are quite restrictive, and that makes the scope of that survey diffe-
chapter 01 | The household Businesses and the Informal sector in vietnam | 39

rent from that of the HB&IS survey. According to the GSO (2011), “an individual business establishment is a privately-owned economic organization which is not registered and operational under the enterprise law […], where a regular business operation takes place with a definite address and at least one full-time employee.” This definition means that a household business has to meet two criteria: It must have a specific address and at least one full-time worker to be included in a survey. The survey thus excludes two components of the household business sector which are covered by the HIBS. The first component is businesses which do not have a fixed business location, and the second is businesses run by HB owners who run the business as a second job.
Therefore, compared to the Labour Force Survey, the NFIDBE surveys underestimate the number of unregistered HBs (see Table 1.2), which includes HBs without a fixed lo-cation. However, the difference in the definition of a HB should not affect the number of registered HBs since having a fixed location and a full-time activity are conditions for being registered.4 Nevertheless, the number of registered household business ac-cording to the NFIDBE surveys is only about 55 per cent of the number HBs according to the LFS. In addition, a comparison with the 2011 Rural, Agricultural and Fishery Census (GSO, 2012) confirmed the underestimation of HBs in the NFIDBE surveys: The number of non-farm households in rural areas is 5.12 million according to the RAFC census, which is close to the 4.94 million estimated in the 2014 LFS, but much higher than the 2.85 million reported in the 2012 NFIDBE survey. Consequently, the procedure used during the NFIDBE surveys to determine whether a business is a non-farm household business or not is questionable. This limitation of the NFIDBE surveys may be because some HBs located in a home were not identified. In conclusion, the coverage of household-based surveys is more exhaustive than the establishment cen-sus/surveys.
In terms of content, the NFIDBE surveys mainly ask for aggregated information. This causes difficulties in describing the operations of the sector and its links with other sectors. Aggregated information is more likely to generate measurement errors as most of the HBs do not have an accounting system.
4. Decree No. 109/2004/NĐ-CP dated 2. April 2004.
| The household Businesses and the Informal sector in vietnam | chapter 0140

The differences between the HB&IS and the Vietnamese Household Living Standard Surveys were well discussed in Cling et al. (2010). The main disadvantage of using the VHLSS to address the topic is that it was not designed to capture the HB sector. In particular, there is no link between the employment section and the activities of household businesses.
In conclusion, the 2014/15 HB&IS survey is the most suitable data source to analyse the household business and informal sectors in Vietnam. As will be seen in the fol-lowing chapters, it provides researchers and policy makers with new insights into the importance of household businesses and the informal sector in the Vietnamese economy, the strengths and constraints of this sector and the pathway to promote inclusive growth in Vietnam.
chapter 01 | The household Businesses and the Informal sector in vietnam | 41
TABLe 1.2.NUmBeR OF HBS eSTImATeD IN THe NFIDBe SURVeYS AND THe 2014 LFS
NFIDBe surveys 2014 LFS
2012 2014
Category Total included Fixed place Total included Ratio in the survey only in the survey
Total 4,624,885 4,093,084 4,671,339 8,913,150 45.9%
location Urban 1,574,532 3,977,866 39.6%Rural 2,518,552 4,935,284 51.0%
registration status Registered 1,263,400 2,287,034 55.2%Unregistered 2,829,684 6,626,116 42.7%
Source: GSO (2013), GSO (2015) and authors’ estimation from the 2014 LFS

| The household Businesses and the Informal sector in vietnam42

chapter 02 | The household Businesses and the Informal sector in vietnam | 43
evoluTIon of The Informal and household BusIness secTors In vIeTnam In a TIme of GrowTh and Trade lIBeralIzaTIon
pham minh Thailaure pasquier-doumer
Following the Doi Moi policy and in a context of rapid growth of labour supply, the labour market has undergone important structural changes. The major changes came from the dismantling of cooperatives and the shrinking of the state sector following the restructuring of state-owned enterprises (SOEs). This led to a rapid expansion of labour in the household business sector, which has been the main job provider for two decades. The informal sector developed accordingly as part of the non-farm HB sector.1
During the past decade, the Vietnamese economy has been marked by extensive growth and trade liberalization. The dual view of informal economy predicts that the informal sector should shrink as the economy grows (La Porta and Shleifer, 2014). The expansion of the formal sector leads to the decline of the informal sector in relative and eventually absolute terms. Informal household businesses disappear because they cannot compete with the much more productive formal firms and because the de-mand constraint for formal products is released with growth. In the meanwhile, most theories, especially the structuralist view, agree that globalization and the opening of markets in developing economies to trade should increase the size of the informal sec-tor (Bacchetta et al., 2009). The formal sector is triggering strong competition and it has reacted by outsourcing to the informal sector in order to reduce labour costs.
In addition to the change in the size of the informal and household business sectors, growth and trade openness could impact the working conditions in these sectors.
1. Before the first LFS conducted by the GSO in 2007, there was no clear definition of the informal sector in Vietnam, so it is difficult to trace it back statistically. But this is not the case for household businesses in general, which have long been used as a statistical category.
02

| The household Businesses and the Informal sector in vietnam | chapter 0244
The expected effect of growth and trade openness on working conditions in the informal sector is still a highly-debated question, as evidence from other countries and theoretical predictions differ according to the context and the hypothesis. If the informal sector is completely disconnected from the formal economy as supposed by the dual view, wages and other working conditions will remain relatively unaffected by growth and trade reforms in the formal sector. If there is vertical linkage between the formal and informal sectors, the impact of growth and trade reforms in the formal sector on the working conditions in the informal sector will depend on the transfor-mation in production modes and labour organization in the formal sector, on the flows of capital between the formal and informal sectors, and on the productivity in each sector (see Bacchetta et al., 2009 for a review).
This chapter aims at analysing how the household business and the informal sec-tors have changed during the past decade. It relies on data from the labour force surveys (LFS) that have been conducted by the General Statistics Office (GSO) since 2007. These surveys are representative at the national level. They are the most suitable dataset to measure the size of the household business and informal sectors in Vietnam and to compare the main features of these sectors to the ones of other institutional sectors.
The first section analyses whether the growth of the economy has led to a decline of the household business and informal sectors as predicted by the dual view, or whether these sectors have grown due to trade openness. It shows that both of these effects may have taken place as the size of the informal sector has declined, although very slowly. Section 2 aims at highlighting the changes in the working conditions that have appeared during this period of growth and trade openness. It demonstrates that working conditions have improved in the informal sector, but this improvement has been less than in most other institutional sectors, meaning that the gap between the informal sector and other sectors has increased.

chapter 02 | The household Businesses and the Informal sector in vietnam | 45
1. TOwaRDS a fORmalIzaTION Of THE VIETNamESE ECONOmy?
Considering the absolute change in the size of the informal sector, as measured by the number of production units, it appears that the informal sector has slightly declined, from 7.2 million production units in 2007 to 6.5 million in 2014 (see Figure 2.1). During the same period, the number of formal household businesses rose from 1.8 million to 2.4 million, which left the size of the HBIS almost unchanged (9.1 million in 2007 compared to 8.9 million in 2014) and resulted in a reduction of the share of informal household businesses in the HB sector from 80 to 72 per cent. This result suggests a trend towards the formalization of the economy, although at a slow pace.
Tenuous formalization of the economy is confirmed when the size of the informal sector is considered in relative terms and measured by the number of jobs. Figure 2.2 shows the overall picture of the distribution of jobs by institutional sector in Vietnam in 2007 and 2014. In 2014, the Vietnamese workforce was around 53.7 million compared to 47.2 million in 2007. Although the informal sector still remains predominant as it is the second largest job provider after the agriculture sector, with almost 11 million jobs in 2007 and 2014, its relative size fell from 23 to 21 per cent of employment between
0
1
2
3
4
7
5
9
10
8
6
InformalHBs 2007
InformalHBs 2014
FormalHBs 2007
FormalHBs 2014
TotalHBs 2007
TotalHBs 2014
FIgURe 2.1.NUmBeR OF HOUSeHOLD BUSINeSSeS IN 2007 IN 2014 (MILLIONS)
Source: 2007 LFS and 2014 LFS, GSO; authors’ calculation

| The household Businesses and the Informal sector in vietnam | chapter 0246
2007 and 20142. In contrast, the share of employment in the formal household bu-siness sector increased from 8 to 9 per cent during that period. The relative size of the other formal sectors has also grown, especially the domestic enterprise sector, with the exception of the public sector.3 Thus, the reduction of the informal sector is clearly observed in relative terms as well. However, the extent of the decline is particularly weak for a seven-year period. It is much lower, for instance, than the decline of the relative size of the agricultural sector during that period, which represented 46 per cent of the main jobs in 2014 compared to 50 per cent in 2007.
In addition, it appears that the reduction of the relative size of the informal sector and the agriculture sector was accompanied by a higher complementarily between these two sectors. At the household level and considering only households in which at least one member works in the informal sector or in agriculture, one fourth of all households were engaged in the agriculture sector and the informal sector at the same time in 2014 compared to 17 per cent in 2007 (see Figure 2.3). Thus, working in the informal sector is
2. When secondary jobs were considered as well, there were around 12 million jobs in the informal sector in 2007 and in 2014, and the relative size of the sector decreased from 23 to 19 per cent. This larger drop, compared to when only main jobs were considered, was due to a huge increase in the number of secondary jobs in agriculture between 2007 and 2014 (more than 3 million jobs).
3. The public sector includes government offices and agencies and state-owned enterprises.
0 %
10 %
20 %
30 %
40 %
50 %
60 %
70 %
100 %
80 %
90 %
2007 2014
Agriculture
Informal HB
Formal HB
Public sector
Foreign enterprise
Domestic enterprise
94
10
46
21
10
24
62
50
8
11
FIgURe 2.2.DISTRIBUTION OF mAIN jOBS BY INSTITUTIONAL SeCTOR IN 2007 AND 2014 (PERCENTAGE)
Source: 2007 LFS and 2014 LSF, GSO; authors’ calculation

chapter 02 | The household Businesses and the Informal sector in vietnam | 47
a strategy of agricultural activity diversification for a non-negligible share of households, and this strategy is becoming more and more widespread. This suggests firstly that the transition from farm to non-farm activity at the household level is smoothed when these two kinds of activity are combined. Secondly, the decline of the informal sector may be slowed in the coming years by this diversification strategy employed by households. The demand for jobs in the informal sector may still be high for agricultural households in the coming years because of the low entry barriers in that sector (see Chapter 6).
Another way to highlight the ongoing formalization process is to look at the changes in the structure of jobs by sector of activity. The question raised is whether all sectors of activity have experienced the ongoing formalization process uniformly or whether the extent of formalization varies across sectors of activity according to their exposure to trade openness and growth. Figure 2.4 shows that the formalization process has been the highest in trade activities. The relative share of the informal sector decreased by 10 points of percentage between 2007 and 2014. The formalization in this sector is mostly due to the development of formal household businesses, the relative share
0 %
10 %
20 %
30 %
40 %
50 %
60 %
70 %
100 %
80 %
90 %
Agriculture only Informal sector and Agriculture
Informalsector only
Total2007
17
28
56
Total2014
26
24
50
Urban2007
9
72
19
Urban2014
16
62
22
Rural2007
19
18
56
Rural2014
28
14
58
FIgURe 2.3.AgRICULTURAL ACTIVITY DIVeRSIFICATION AND THe INFORmAL SeCTOR AT THe HOUSeHOLD LeVeL IN 2007 AND 2014 (PERCENTAGE)
Source: 2007 LFS and 2014 LFS, GSO; authors’ calculation
Note: The unit of observation here is the household, and only households in which at least one member worked in the informal sector or in agriculture were considered.

| The household Businesses and the Informal sector in vietnam | chapter 0248
of which grew by 6 points of percentage, and domestic enterprises, which grew by 4 points of percentage. The extent of formalization was almost the same for the ma-nufacturing and construction sector, where the informal sector declined by 9 points of percentage between 2007 and 2014. However, this pattern of formalization is very different than the one observed in trade. The development of formal household bu-sinesses has played an insignificant role in that process. In contrast, the decline of the informal sector is largely explained by the development of foreign enterprises in that sector of activity. Their relative share increased from 9 to 17 per cent during that period. Finally, the service sector is where the formalization process was the slowest (a decrease of 5 points of percentage in the informal sector). One of the reasons could be that the informal sector is the least developed sector in the service sector, and it may be more difficult to reduce the residual informality. In addition, jobs in the service sector are mostly provided by the state, and this sector is then less exposed to trade openness. Furthermore, formalization in the service sector is mostly due to the deve-lopment of domestic enterprises.
0 %
10 %
20 %
30 %
40 %
50 %
60 %
70 %
100 %
80 %
90 %
Informal HB Formal HBPublic sectorForeign enterprise
Domestic enterprise
Manuf. &construct.
2007
11
19
9
10
51
Manuf. &construct.
2014
12
24
17
4
43
Trade2007
28
815
59
Trade2014
34
1214
49
Service2014
15
111
43
30
Service2007
13
7
44
35
1
FIgURe 2.4.DISTRIBUTION OF jOBS IN eACH SeCTOR OF NON-FARm ACTIVITY BY INSTITUTIONAL SeCTOR IN 2007 AND 2014 (PERCENTAGE)
Source: 2007 LFS and 2014 LFS, GSO; authors’ calculation

chapter 02 | The household Businesses and the Informal sector in vietnam | 49
It is interesting to know whether the formalization of a sector of activity has modified the structure of the informal sector in terms of activity. This change would be the result of the difference in the extent of formalization across sectors of activity and the size of each sector of activity in the informal sector. Figure 2.5 shows that the distribution of jobs in the informal sector by sector of activity remained almost unchanged between 2007 and 2014. There was no change if the service sector is considered as a whole and if construction is aggregated to manufacturing. Some changes appear when the ser-vice and construction sectors are disaggregated.4 The share of construction activities increased, but only very slightly (by 4 points of percentage), and the share of manu-facturing decreased by the same proportion. Trade was still the predominant sector of activity among workers in the informal sector, followed by manufacturing.5 Thus, if there has been a change in the structure of the informal sector, it cannot be observed at such a level of aggregation of the sectors of activity.
4. The reason why restaurants and accommodation are included in this section instead of the service sector as a whole is because such service activities are commonly considered to be the main activity of informal HBs in Vietnam.
5. However, when construction is aggregated to manufacturing as in other parts of this book, this sector is clearly predominant.
0 %
10 %
20 %
30 %
40 %
50 %
60 %
70 %
100 %
80 %
90 %
2007 2014
Other services
Restaurant and accomodation
Transport
Manufacturing
Construction
Trade
30
21
20
10
12
6
11
32
17
9
7
24
FIgURe 2.5.DISTRIBUTION OF jOBS BY SeCTOR OF ACTIVITY IN THe INFORmAL SeCTOR IN 2007 AND 2014 (PERCENTAGE)
Source: 2007 LFS and 2014 LFS, GSO; authors’ calculation

| The household Businesses and the Informal sector in vietnam | chapter 0250
Whether the formalization process has occurred homogeneously in the whole country or it has been more concentrated in some provinces deserves some atten-tion. The changes in the intensity of the informal sector in each province in Vietnam provide insight into that issue. The intensity of the informal sector is defined as the number of workers in informal household businesses in a province divided by the total number of workers in that province. A comparison of these intensities in 2007 and 2014 (see Figure 2.6) reflects the formalization process at the provincial level.
From 2007 to 2014 the intensity of the informal sector decreased in 41 of the 63 pro-vinces, most of which are in the most developed economic regions. Thus, the for-malization process has been the highest in the Red River Delta region (Bac Giang, Bac Ninh, Hung Yen, Thai Binh and Ha Nam), on the Central Coast (Quang Tri, Hue and Da Nang), in the Southeast region (Binh Duong), and in the Mekong River Delta region (Tien Giang and Dong Thap). This formalization process may be explained by the emergence of industrial parks in these provinces which employ a large number of formal workers in manufacturing factories.
On the other hand, other provinces experienced an increase in the proportion of workers working in IHBs from 2007 to 2014. Interestingly, the informalization pro-cess has appeared in the least developed provinces such as Tuyen Quang, Lai Chau and Phu Tho in the Northern Uplands region and in Vinh Long and Soc Trang in the Mekong River Delta region. For some of these provinces, like Lai Chau, Tuyen Quang and Phu Tho, an ongoing shift from agricultural activities to informal non-farm ac-tivities may be the main cause of this informalization process, as reflected by the very low intensity of the informal sector in these provinces in 2007.6 However, this explanation does not hold for two provinces where an increase in the intensity of the informal sector was observed, Nam Dinh and Hai Phong, although the share of the informal sector was already high in 2007. In addition, Hai Phong counts among the most developed provinces in Vietnam.
6. In addition, almost all the provinces with low intensity (below average) in the informal sector in 2007 have experienced an informalization process of their labour market or have remained stable in that aspect.

chapter 02 | The household Businesses and the Informal sector in vietnam | 51
2007 2014
0.03 to 0.12
0.12 to 0.20
0.20 to 0.25
0.32 to 0.43
0.25 to 0.32
Share of workers in HBby province 2007
0.03 to 0.10
0.10 to 0.18
0.18 to 0.22
0.29 to 0.37
0.22 to 0.29
Share of workers in HBby province 2014
Quần- đảo- Hoàng-Sa
Quần-đảo -Trường -Sa
Quần- đảo- Hoàng-Sa
Quần-đảo -Trường -Sa
FIgURe 2.6.INTeNSITY OF THe INFORmAL SeCTOR BY PROVINCe IN 2007 AND 2014
Source: 2007 LFS and 2014 LFS, GSO; authors’ calculation

| The household Businesses and the Informal sector in vietnam | chapter 0252
2. TOwaRDS aN ImpROVEmENT Of wORkINg CONDITIONS IN THE INfORmal SECTOR?
Before looking at the trend in the working conditions in the informal sector, it is useful to recall the characteristics of the workers in this sector compared to other institutional sectors (see Figure 2.7) and how these characteristics changed between 2007 and 2014 (see Table 2.1).
After the agriculture sector, the informal sector is the sector with the highest concen-tration of workers in rural areas: Around two thirds of the workers in the informal sector were located in rural areas in 2007 and 2014.
As in the other sectors, except the agriculture sector, ethnic minorities are poorly re-presented. In 2014 ethnic minorities accounted for 17 per cent of the labour force but only 6 per cent of the informal sector. The proportion of ethnic minorities in the informal sector slightly increased between 2007 and 2014, but the same trend was observed in all the institutional sectors (see Table 2.1).
The percentage of women in the informal sector (46 per cent) was just below the natio-nal percentage of women in the occupied population, which was 49 per cent. This goes against the common view that the informal sector is dominated by women. In contrast, the proportion of women working for foreign enterprises was very high (66 per cent). Most foreign enterprises are export oriented in labour intensive sectors such as garment/textile, shoes and electronics, and such enterprises mainly employ female workers. The percentage of women in the informal sector remained stable between 2007 and 2014.
Workers in the informal sector are older than workers at domestic and foreign enterprises, but they are almost the same age as those who work in the agriculture, formal house-hold business and public sectors. Interestingly, the average age of workers in the informal sector increased from 38 to 41 years old between 2007 and 2014 (see Table 2.1). This suggests that the integration of young people into the labour market occurs less often through the informal sector than before, and it supports McGaig and Pavcnik’s assess-ment (2015), which is based on the 1999 and 2009 population census, that the decline of informality is mostly explained by a shift toward formality among young workers.7
7. Note that informality is defined as the HB sector in their paper, but the comparison remains true as the average age of workers in the HB has increased from 37 to 39.

chapter 02 | The household Businesses and the Informal sector in vietnam | 53
0
10
20
30
40
50
60
70
80
90
100
Rural Female AgeEthnic minorities
>= Upper Sec. educ.
Public sector
Foreign enterprise
Domestic enterprise
Formal HB
Informal HB
Agriculture
FIgURe 2.7.SOCIO-DemOgRAPHIC CHARACTeRISTICS OF wORkeRS BY INSTITUTIONAL SeCTOR IN 2014 (PERCENTAGE)*
Source: 2014 LFS, GSO; authors’ calculation
*Reading: 43 per cent of the workers in the public sector work in rural areas; 91 per cent of the workers in agriculture are in rural areas; 8 per cent of the workers in the public sector are ethnic minorities. The “Age” column is the percentage of workers over the age of 35: 39 per cent of the workers in the public sector were more than 35 years old.
In terms of educational level, workers in the informal sector are on average the least educated workers. They are only slightly more educated than agricultural workers. Only one fifth have completed high school, which is less than half of the percentage of high school graduates observed at foreign and domestic enterprises, and less than one quarter of the percentage of high school graduates in the public sector. In addition, the educational gap between workers at formal and informal household businesses was larger than the gap between workers in the informal sector and agricultural workers (see Figure 2.7). The level of education increased in the informal sector between 2007 and 2014. However, Table 2.1 shows the extent of the increase (3 points of percentage) was slightly lower than what was observed for the entire working population (an increase of 5 points of percentage).

| The household Businesses and the Informal sector in vietnam | chapter 0254
To sum up, the main characteristics of workers in the informal sector have not really changed over the past seven years. With workers in the agriculture sector, they are still the least educated, and they are mostly located in rural areas. In addition, they are still most likely to be men. However, one remarkable change is the aging of the workers in the informal sector. The formalization process occurs as a result of less young people entering the informal sector. While the characteristics of workers in the informal sector have remained almost the same, have working conditions as well?
A first indicator of working conditions is the vulnerability of employment. According to the ILO (2015, KILM 3), the share of wage workers can be considered the reverse side of vulnerable employment that is constituted by self-employed and unpaid family workers. The higher the share of wage workers, the lower the incidence of vulnerable employment.8 As expected, the informal sector is where the share of wage workers is the lowest after the agriculture sector. Less than one third of the workers in the informal sector (30 per cent in 2014) are wage workers, compared to more than 90 per cent in the public sector and at private enterprises (see Figure 2.8).
The share of wage workers in the informal sector has remarkably increased compa-red to 2007, when it was 24 per cent. In addition, this increase constitutes the main contribution to the overall improvement of the rate of wage workers at the national
8. The share of employers is considered to be constant.
TABLe 2.1.SOCIO-DemOgRAPHIC CHARACTeRISTICS OF wORkeRS IN THe HB AND INFORmAL SeCTORS IN 2007 AND 2014 (PERCENTAGE)
Rural ethnic Female Age >= Upper minorities Sec. educ.
Formal HBs2007 46.0 6.1 46.5 36.9 31.2
2014 49.1 6.8 45.1 39.1 33.4
Informal HBs
2007 66.9 3.9 48.7 38.3 15.7
2014 62.8 5.7 46.3 41.1 19.1
All institutional sectors 2007 75.2 13.8 49.4 38.2 23.1
2014 70.3 16.8 48.5 40.3 27.7
Source: 2014/15 HB&IS survey, VASS-CAF & IRD-DIAL; authors’ calculations

chapter 02 | The household Businesses and the Informal sector in vietnam | 55
level (an increase of 5 points of percentage), as the share of wage workers remained almost stable in other institutional sectors. Consequently, the gap between formal and informal household businesses halved between 2007 and 2014 (from 10 points of percentage down to only five points of percentage). However, this change is mostly explained by the increase of wage workers in the construction sector. In that sector of activity, most of the workers were registered as wage workers (79 per cent and 87 per cent of the workers were wage workers in 2007 and in 2014 respectively). However, being a wage worker in the construction sector is not the same as being a wage worker in other sectors because most of them are somewhere between being self-employed and being a wage worker: They are temporarily contracted by employers and do not receive the guarantees that are usually granted to wage workers. They are closer to being self-employed by working for private households. By excluding the construction sector from the informal sector, the increase in the rate of wage workers in that sector becomes much lower, 12 per cent in 2007 and 15 per cent in 2014.
0
10
20
30
40
70
50
90
100
80
60
Publicsector
Foreignenterprise
Domesticenterprise
InformalHB
FormalHB
Agriculture Total
2007 2014
FIgURe 2.8.SHARe OF wAge wORkeRS BY INSTITUTIONAL SeCTOR IN 2007 AND 2014 (PERCENTAGE)
Source: 2007 LFS and 2014 LFS, GSO; authors’ calculation

| The household Businesses and the Informal sector in vietnam | chapter 0256
Another indicator of working conditions related to decent work as defined by the ILO (2012) is the share of workers covered by basic health care provisions. For comparison, we consider here the proportion of workers in the informal sector who paid for social security, because a specific question about health insurance was not asked in 2007.9 Figure 2.9 presents the share of workers who paid for social security by institutional sector. It shows that almost none of the workers in the informal sector paid for social security in either 2007 or 2014. While there was almost no progress in the informal sector in that area, some improvement was observed at the national level (social secu-rity coverage rose from 14 to 19 per cent between 2007 and 2014) due to a sharp in-crease in social security coverage in the domestic enterprise sector (from 43 to 58 per cent) and in the foreign enterprise sector (from 83 to 90 per cent).
9. Social security includes health insurance, but health insurance can be provided out of the paid social security scheme. According to the 2014 LFS, 78 per cent of the workers in the informal sector who received a health insurance card with their job stated that they did not pay for social security. The reason why there was such a discrepancy between social security coverage and health insurance is that a high proportion of workers in the informal sector benefited from social assistance and did not have to pay for social security. In Chapter 9 we show that 45 per cent of the owners of informal household businesses who had a health insurance card got their card through social assistance.
0
10
20
30
40
70
50
90
100
80
60
Publicsector
Foreignenterprise
Domesticenterprise
InformalHB
FormalHB
Agriculture Total
2007 2014
FIgURe 2.9.SHARe OF wORkeRS wHO PAID FOR SOCIAL SeCURITY BY INSTITUTIONAL SeCTOR IN 2007 AND 2014 (PERCENTAGE)
Source: 2007 LFS and 2014 LFS, GSO; authors’ calculation

chapter 02 | The household Businesses and the Informal sector in vietnam | 57
An appropriate amount of working time is an essential part of decent working condi-tions. Working time could be unsatisfactory for the worker if he or she has to work too much or does not receive enough hours. Excessive working time damages the health and security of workers, and it is also upsets their work-life balance. Time-related unde-remployment (also called visible underemployment)10 means that the informal sector does not provide workers with sufficient working time to fully utilise their productive capacity and earn a living.
According to international standards, excessive working time is defined as working more than 48 hours per week. With almost half of the workers (41 per cent) working more than 48 hours per week in 2014, the informal sector is the sector where the proportion of excessive working time is the highest, after the formal household bu-siness sector and the foreign enterprise sector (see Figure 2.10). Like in other institutio-nal sectors, except foreign enterprise, this percentage decreased between 2007 and 2014, but to a lesser extent than in other sectors.
10. According to the 16th International Conference of Labour Statisticians in 1998, visible underemployment relates to the number of employed persons whose hours of work in the reference period are insufficient in relation to a more desirable employment situation in which the person is willing and available to engage.
0
10
20
30
40
70
50
90
100
80
60
Publicsector
Foreignenterprise
Domesticenterprise
InformalHB
FormalHB
Agriculture Total
2007 2014
FIgURe 2.10.SHARe OF wORkeRS wHO wORk eXCeSSIVeLY AT THeIR mAIN jOB BY INSTITUTIONAL SeCTOR IN 2007 AND 2014 (PERCENTAGE)
Source: 2007 LFS and 2014 LFS, GSO; authors’ calculation
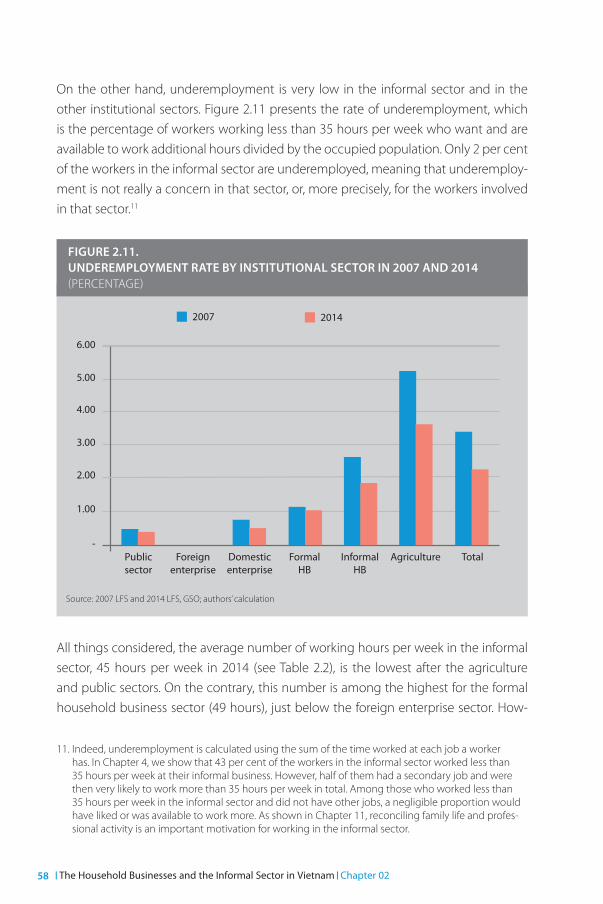
| The household Businesses and the Informal sector in vietnam | chapter 0258
On the other hand, underemployment is very low in the informal sector and in the other institutional sectors. Figure 2.11 presents the rate of underemployment, which is the percentage of workers working less than 35 hours per week who want and are available to work additional hours divided by the occupied population. Only 2 per cent of the workers in the informal sector are underemployed, meaning that underemploy-ment is not really a concern in that sector, or, more precisely, for the workers involved in that sector.11
All things considered, the average number of working hours per week in the informal sector, 45 hours per week in 2014 (see Table 2.2), is the lowest after the agriculture and public sectors. On the contrary, this number is among the highest for the formal household business sector (49 hours), just below the foreign enterprise sector. How-
11. Indeed, underemployment is calculated using the sum of the time worked at each job a worker has. In Chapter 4, we show that 43 per cent of the workers in the informal sector worked less than 35 hours per week at their informal business. However, half of them had a secondary job and were then very likely to work more than 35 hours per week in total. Among those who worked less than 35 hours per week in the informal sector and did not have other jobs, a negligible proportion would have liked or was available to work more. As shown in Chapter 11, reconciling family life and profes-sional activity is an important motivation for working in the informal sector.
-
1.00
2.00
4.00
3.00
6.00
5.00
Publicsector
Foreignenterprise
Domesticenterprise
InformalHB
FormalHB
Agriculture Total
2007 2014
FIgURe 2.11.UNDeRemPLOYmeNT RATe BY INSTITUTIONAL SeCTOR IN 2007 AND 2014 (PERCENTAGE)
Source: 2007 LFS and 2014 LFS, GSO; authors’ calculation

chapter 02 | The household Businesses and the Informal sector in vietnam | 59
ever, the gap in the number of working hours between formal and informal businesses decreased between 2007 and 2014 due to a larger decrease in the number of working hours at formal household businesses than in the informal sector.
Finally, one of the most important working conditions is undoubtedly income. Un-fortunately, the 2014 Labour Force Survey provides information on income only for wage workers. Thus, this analysis excludes self-employed workers, contributing family workers and employers. A more complete analysis is provided in Chapter 4.
Table 2.3 shows that the real value12 of the average hourly income of wage workers in Vietnam almost doubled (from 14,600 to 24,200 VND) between 2007 and 2014. The real hourly income of wage workers in the informal sector also increased (from 10,700 to 17,400 VND), but this was less than the average increase. Relatively, the real income of wage workers in the informal sector improved by 61 percent compared to 65 percent on average. The income of wage workers in the informal household business sector was still the lowest after the agriculture sector, although it was very close to what was earned by wage workers in the formal household business sector (17,700 VND in 2014). The highest growth of hourly income was observed in the domestic enterprise sector, followed by the foreign enterprise sector and the public sector. The fact that the average working hours of wage workers at their main job decreased from 47.8 to 45.5 hours per week between 2007 and 2014 while the real income of those workers grew means that a positive adjustment in the Vietnamese labour market was at play during that period. A higher income and less working hours provided more leisure time for wage workers, which means that the quality of jobs for wage workers improved.
12. The nominal income was adjusted to January 2014 prices.
TABLe 2.2.NUmBeR OF wORkINg HOURS PeR week BY INSTITUTIONAL SeCTOR IN 2007 AND 2014
2007 2014
Public sector 44.4 40.5
Foreign enterprise 51.0 49.4
Domestic enterprise 51.5 48.0
Formal HB 52.4 48.8
Informal HB 47.5 45.1
Agriculture 39.5 34.1
Total 43.8 40.3
Source: 2007 LFS and 2014 LFS, GSO; authors’ calculation

| The household Businesses and the Informal sector in vietnam | chapter 0260
CONClUSION
This chapter has shown that the size of the informal sector decreased in absolute terms when the number of production units is considered and in relative terms when the share of jobs in the informal sector is taken into consideration. During this period of extensive growth and trade liberalization, a formalization of the Vietnamese eco-nomy has been at play. However, this formalization process has been tenuous, and the informal sector remains by far the main job provider in the economy after the agricul-ture sector. In addition, the formalization is mostly explained by an increase in the size of the formal household business sector, rather than by an increase in the size of the domestic enterprise or the foreign enterprise sectors as expected. The formalization process was the highest in the trade sector, mostly due to the development of formal household businesses. In the manufacturing and construction sector, the decline of the informal sector is largely explained by the development of foreign enterprises. The service sector is where the formalization process has been the slowest.
In addition to the moderate pace of formalization, the emergence of complementarity between the informal sector and the agriculture sector suggests that the reduction of the informal sector will remain low in the coming years. Farm households seem to smooth their transition from farm to non-farm activities by combining agricultural and informal activities. Thus, the decline of the informal sector may be slowed in the coming years by this diversification strategy employed by agricultural households and their demand for jobs in the informal sector.
TABLe 2.3.ReAL mONTHLY AND HOURLY INCOme OF wAge wORkeRS BY INSTITUTIONAL SeCTOR IN 2007 AND 2014 (THOUSAND VND)
Real monthly income Real hourly income 2007 2014 2007 2014
Public sector 3,407 5,524 19.15 33.13
Foreign enterprise 3,112 5,144 15.28 25.58
Domestic enterprise 2,902 4,864 14.08 24.85
Formal HB 2,337 3,520 11.26 17.73
Informal HB 2,102 3,327 10.68 17.40
Agriculture 1,804 2,552 10.18 14.70Total 2,787 4,489 14.59 24.21
Source: 2007 LFS and 2014 LFS, GSO; authors’ calculation

chapter 02 | The household Businesses and the Informal sector in vietnam | 61
Growth and trade openness has not really affected the main characteristics of the workers in the informal sector: They are still the least educated after farmers; they are mostly located in rural areas; and they are still most likely to be men. However, one remarkable change is the aging of the workers in the informal sector, which suggests that the formalization process is due to less young people entering the informal sector.
Finally, the favourable economic context has improved the working conditions of all the workers. However, this improvement has been more moderate in the infor-mal sector compared to other non-farm institutional sectors. Workers in the informal sector still face the worst working conditions after the agriculture sector: The share of wage workers in the informal sector is small, especially when the workers in the construction sector are not taken into consideration; paid social security is almost nonexistent; excessive working time is widespread; and income is the lowest after the agriculture sector. These results call for an active policy towards the informal sector, in particular to guarantee those workers decent working conditions.

| The household Businesses and the Informal sector in vietnam62

chapter 03 | The household Businesses and the Informal sector in vietnam | 63
characTerIsTIcs of household BusInesses and The Informal secTor
nguyen Thi kim ThaiXavier oudinlaure pasquier-doumervu van ngoc
While Chapter 2 used the 2014 Labour Force Survey, this chapter focuses on the pro-minent characteristics of household businesses using the 2014/15 HB&IS survey. It compares informal HBs with formal ones and questions what formality means in the context of Vietnam.
The HB sector includes formal and informal businesses. This divide, which is commonly used in labour statistics and for policy purposes, has to be explained. An understanding of the relationship between the informal sector and the state can contribute to shed-ding light on how the informal sector can be managed, promoted or monitored by a government. The informal sector, in comparison with the formal system, is seemingly less protected and regulated (De Soto, 1989). In Weeks’s (1975) opinion, the informal sector is the consequence of failing to access the formal sector; it operates outside the government’s system of supports and regulations and thus fails to benefit from formal credit and foreign technology transfers. De Soto (1989) argues that informal activities are operated without legal status because of the excessive cost and red tape procedures of formalisation.
Although there is a continuum of situations in terms of size and economic perfor-mances among HBs, there are more or less clear differences with respect to the criteria commonly used to define the informal sector. This chapter elaborates on this topic by exploring the distribution of HBs by several characteristics that are used to define informality.
The first characteristic is the size of HBs in terms of the number of workers. Small size is a common characteristic of all HBs, but informal HBs are on average smaller than formal ones, as shown in section 1. The second characteristic is the operating conditions
03

| The household Businesses and the Informal sector in vietnam | chapter 03 64
of a business. We look at the type of premises and occupancy status. Section 2 shows that there are important differences between formal and informal HBs in terms of condi-tions for operating a business. Section 3 explores the linkages between the informal sector and the state which can be partly captured through the lens of formalization with administrative registers as well as the attitude of the owners of HBs towards registration, taxation and informal payment for administrative costs. It highlights the blocking factors towards greater formalization, which are mostly a lack of incentive to formalize and poor knowledge of the regulations. In addition, the link of formal HBs with the state remains weak as formal HBs often do not have the expected attributes of formality such as tax and social security registration or bookkeeping.
1.THE pREValENCE Of Small-SIzE HOUSEHOlD BUSINESSES
This section illustrates the distribution of formal and informal businesses by size using the number of workers. The size of establishments was not asked in the recent LFSs, so the information provided by the HB&IS survey is particularly relevant.
1.1. Distribution of HBs by size
The size of a business or scale of operation is a dominant criterion for defining the informal sector in the literature. It is most often measured by the number of people working in a unit. The small size of businesses in the informal sector has been men-tioned in the literature since the first studies on this sector (ILO, 1972). Although there are some variations across countries, many papers mention the strong association between the scale of operation and formality, which indicates that the size (number of employees) is positively correlated to the possibility of formality (Maloney, 2004; La Porta and Shleifer, 2008; Pratap and Quintin, 2006; De Paula and Scheinkman, 2011). This is also the case in Vietnam (see section 4 below).
According to the HB&IS survey, informal HBs have an average of 1.8 people per esta-blishment, including the owner of the business. One out of two informal businesses is comprised of just one person, and more than 40 per cent are comprised of the owner and his or her spouse and/or members of the family. This proportion has, however, sharply decreased compared to 2007 (65 per cent in the 2007 LFS). Only 8.5 per cent of the informal businesses have hired workers. Businesses with 3-5 workers and those with more than 6 workers account for 10 per cent and 2 per cent respectively (see Figure 3.1).

chapter 03 | The household Businesses and the Informal sector in vietnam | 65
Formal HBs are larger than informal ones, but the scale of operation is still very small. The average size of a formal business is 2.3 workers. Nearly one third (31 per cent) are comprised of the owner only, and half are comprised of the owner, his or her spouse and members of the family. Although the number of formal HBs that hire workers is significantly higher than the number of informal HBs that do so, only one out of four formal businesses has at least one wage worker.1 Formal businesses with 3-5 workers constitute 24 per cent of all formal HBs. This proportion is more than two times higher than that observed in the informal sector.
A breakdown of the size distribution of informal HBs by industry presents interesting findings (see Figure 3.2). Informal HBs in the service sector tend to be the smallest as nearly two thirds of the service businesses have only one worker, who is also the owner. This is mainly because the informal HBs in the service sector are food and be-verage and land transport (motorbike taxis) services, and they do not require many workers. In contrast, the share of informal HBs with at least three workers in the ma-nufacturing and construction sectors is the highest compared to those in trade and service sectors (19 per cent vs. 10 per cent and 9 per cent respectively).
1. 31 per cent of the wage workers at formal HBs are family members.
0 %
10 %
20 %
30 %
40 %
50 %
60 %
70 %
100 %
80 %
90 %
Informal HB
10
51
2
37
24
31
4
41
Formal HB Total
14
46
2
38
6-18 workers 3-5 workers 2 workers 1 worker
FIgURe 3.1.SIze DISTRIBUTION OF HOUSeHOLD BUSINeSSeS (PERCENTAGE)
Source: 2014/15 HB&IS survey, VASS-CAF & IRD-DIAL; authors’ calculations

In addition, the proportion of informal HBs with more than two workers in rural areas is higher than in urban areas (see Table 3.1). This phenomenon can be explained in several ways. It can be due to underemployment in rural areas: Family members of the owners working in the agriculture sector have vacant hours to take part in activities pertaining to the family business during off-season months (e.g. after the winter and spring rice crops). Another reason is that there are fewer opportunities for them to do other non-farm jobs. Moreover, many of the informal self-employed have activities which are typical of an urban environment, e.g. motorbike taxi driver, fruit and vege-table street vendor and running a street restaurant. Hence, informal HBs in rural areas are less likely to provide services (34 per cent of the rural informal HBs are in the ser-vice sector compared to 49 per cent in urban areas). However, service activities in the informal HB sectors are those with the highest proportion of self-employed people (see Figure 3.2). Informal HBs in rural areas are more represented in the manufacturing and construction sectors (32 per cent of the rural informal HBs compared to 24 per cent of the urban informal HBs), which is where the proportion of informal HBs with more than two workers is the highest. Finally, incentives to get a business license may be weaker in rural areas, so large HBs which would be formal in urban areas are
| The household Businesses and the Informal sector in vietnam | chapter 03 66
0 %
10 %
20 %
30 %
40 %
50 %
60 %
70 %
100 %
80 %
90 %
Manuf.& constr.
Trade Service Manuf.& constr.
Trade Service
6-18 workers 3-5 workers 2 workers 1 worker
Rural Urban
FIgURe 3.2.DISTRIBUTION OF INFORmAL HBS BY mAIN eCONOmIC SeCTOR AND SIze IN RURAL AND URBAN AReAS
Source: 2014/15 HB&IS survey, VASS-CAF & IRD-DIAL; authors’ calculations

informal in rural areas. This is the case in particular for construction businesses, which usually have more than two workers and are never registered in rural areas.
This explains why the average size of informal HBs is higher in rural areas than in urban areas (1.9 workers in rural areas vs. 1.7 in urban areas) while the size is nearly the same in both areas for formal HBs (2.5 workers). In particular, there are more informal HBs that have only one worker (self-employed) in urban areas than there are in rural areas (58 per cent and 47 per cent respectively) (see Table 3.1). The size gap between urban and rural areas is significantly wider for the trade sector (see Figure 3.2). In this sector, 37 per cent of the rural informal HBs are constituted of the owner only, compared to 58 per cent in urban areas. Again, this can be explained by the higher proportion of street vendors in urban areas. Although smaller, the same gap between urban and rural areas in the size of the informal HBs was observed in the manufacturing and construction sectors.
1.2. evolution of the structure of employment
The average number of workers has increased slightly since 2007, at least in Hanoi when compared with the results of the survey in Hanoi and Ho Chi Minh City (Cling et al., 2010). This is due to the fact that in both Hanoi and Ho Chi Minh City the share of those working alone has declined, especially in Hanoi: While 73 per cent of the informal HBs had one self-employed person and no other workers, in 2014 this was the case for only 53 per cent of the informal HBs in Hanoi. The number of HBs with at least one wage worker has increased in Hanoi but not in Ho Chi Minh City, and in both cities this number remains low for informal HBs: Nine out of ten have no hired (wage) workers. The relative decline of self-employed workers is mostly compensated by the increase in HBs where the spouse and other members of the family are involved (see Table 3.2).
chapter 03 | The household Businesses and the Informal sector in vietnam | 67
TABLe 3.1.SIze DISTRIBUTION OF HOUSeHOLD BUSINeSSeS BY AReA (PERCENTAGE)
Source: 2014/15 HB&IS survey, VASS-CAF & IRD-DIAL; authors’ calculations
Rural Urban
Informal Formal Total Informal Formal Total
1 worker 46.5 32.8 43.7 57.2 30.5 48.3
2 workers 40.2 39.9 40.1 32.9 42.1 36
3-5 workers 11.4 23.8 13.9 8.6 23.5 13.5
6-18 workers 1.9 3.6 2.2 1.3 3.9 2.2
Total 100 100 100 100 100 100

| The household Businesses and the Informal sector in vietnam | chapter 03 68
The decline in the number of self-employed people who work alone in Hanoi and Ho Chi Minh City is mainly explained by changes in the structure of the activities of the HBs in both cities. It is perhaps due to trade openness that precarious trade acti-vities, including street vendors and market vendors without a fixed location, sharply declined between 2007 and 2014, accounting for half of the decrease in the share of self-employed people. Street vendors and market vendors working alone constituted 14 per cent of the informal HBs in Hanoi in 2007 and only 5 per cent in 2014. A decline of 9 points of percentage in the proportion of these precarious informal HBs was also observed in Ho Chi Minh City (12 per cent in 2007 compared to 3 per cent in 2014).
Thus, although the size of the informal HBs remains low, as was expected, the 2014/15 HB&IS survey provides two new insights into informal HBs in Vietnam. First, the struc-ture of rural informal HBs differs from that of their urban counterparts. They are more oriented towards manufacturing and construction activities and are larger on average. Second, an analysis of the trend in the size of informal HBs shows that a structural change is at play, as self-employed workers, in particular in precarious trade activities, tend to be replaced by family HBs.
TABLe 3.2.AVeRAge NUmBeR OF wORkeRS AND STRUCTURe OF HBS BY CHARACTeRISTICS OF emPLOYmeNT IN HANOI AND HO CHI mINH CITY, 2007 AND 2014
Source: Cling et al. 2010 and the 2014/15 HB&IS survey, VASS-CAF & IRD-DIAL; authors’ calculations
Average number of
workers
Percentage with one worker only (self-employed)
Percentage with at least
one wage worker
Percentage with only
family workers
2007 2014 2007 2014 2007 2014 2007 2014
Hanoi Informal HBs 1.4 1.8 72.7 52.9 9.8 10.1 17.5 37.0Formal HBs 2.3 2.6 35.0 21.3 28.2 35.6 36.8 43.1All 1.6 2.0 65.4 45.0 13.3 16.5 21.3 38.5
Ho Chi minh City Informal HBs 1.5 1.6 70.7 61.2 10.6 9.4 18.7 29.4Formal HBs 2.6 2.4 31.0 29.7 37.8 31.4 31.2 38.9All 1.8 1.8 60.6 52.5 17.5 15.5 21.9 32.0

chapter 03 | The household Businesses and the Informal sector in vietnam | 69
2.pRECaRIOUS BUSINESS OpERaTINg CONDITIONS
For HBs, especially informal ones, one of the main difficulties in operating a business is not having an adequate premises. This can prevent them from growing in size and res-trict their capacity to hire more workers (Cling et al., 2010). Indeed, the type of premises is an important determinant of the stability or, on the contrary, of the precariousness of a business. Without an adequate premises, operating conditions in the informal sector are more likely to be insecure and poor. Although only one out of six business owners, formal and informal, reported difficulties related to having a premises (see Chapter 11), those who operate in improvised or non-permanent premises are more likely to be in a precarious situation.
2.1. Lack of a professional premises
Table 3.3 compares the types of premises in which informal and formal household businesses conduct activities in different economic sectors. Nearly a third of the in-formal HBs and 5 per cent of the formal HBs do not operate in a fixed premises.2 They operate their businesses on streets like vendors, in improvised locations outdoors and in markets, and from vehicles or at their customers’ homes.
Nearly half of the household businesses operate out of the owner’s home. This type of premises is popular among household businesses because the proprietors can avoid spending money on rent or buying a premises. The owners can therefore spend their capital on other assets and equipment. Many of those working at home (half of the informal and two thirds of the formal HBs) have a dedicated space in their home in which to operate their business.
Moreover, working at home allows reconciling family and professional activities. As explicated in Chapter 11, this motivation is important when setting up an own- account business instead of working as a wage worker. This motivation is more im-portant for those who work at home: One out of five heads of HBs who work at home, which is nearly twice as many as those who not work at home, mentioned that as the main reason why they decided to work on their own account. This motivation is
2. In principle, only businesses with a fixed premises can register their business. However, there are a few formal HBs which do not have a fixed premises, e.g. in the transportation sector. In these cases, the owners stated that their personal home is their professional premises even though they do not work there.

| The household Businesses and the Informal sector in vietnam | chapter 03 70
more important for women. However, working at home may impede the growth of a business, especially in urban areas, where the density of the population is high and the ability to expand the home is limited and costly.
More than half of the formal HBs, but only 25 per cent of the informal HBs, have a professional premises such as a permanent premises in a market, workshop, shop, restaurant or hotel. The high proportion of dedicated premises for operating a bu-siness in the formal HB sector illustrates that formal HBs tend to be more professional and stable, resulting in greater business prospects and more opportunities to expand their operation by increasing their business size. It should also be noted that it is more difficult to avoid registering a business when one has a professional premises.
Precarious operating conditions for informal businesses involved in service and trade activities are remarkably widespread, and many of them (46 per cent and 30 per cent respectively) do not have a premises. Informal HBs in the manufacturing and construc-tion sectors constitute a smaller share. Only 15 per cent of them have makeshift set-ups, while the owner’s home is by far the most common type of premises (60 per cent) in this sector (see Table 3.3).
The proportion of HBs located in a home, at a professional premises or without a fixed premises is similar in rural and urban areas for both informal and formal HBs. However, this does not hold true when sectors of activity are distinguished, reflecting once again the differences in the structure of HBs in urban and rural areas. The pro-portion of manufacturing and construction HBs with a professional premises is higher in rural areas (6 points of percentage higher for both formal and informal HBs). The upper tier of manufacturing HBs may be concentrated in rural areas, in particular on
TABLe 3.3.TYPeS OF PRemISeS AmONg HOUSeHOLD BUSINeSSeS (PERCENTAGE)
Informal HBs Total Formal HBs
No per-manent premises
Home Profes-sional premises
No per-manent premises
Home Profes-sional premises
Manuf. & constr.
14.9 60.7 24.4 100 0.7 46.5 52.8
Trade 30.4 39.1 30.5 100 4.2 41.1 54.7Service 45.8 33.2 21.0 100 8.9 43.6 47.5Total 32.1 43.0 24.9 100 4.9 42.9 52.2
Source: Cling et al. 2010 and the 2014/15 HB&IS survey, VASS-CAF & IRD-DIAL; authors’ calculations

chapter 03 | The household Businesses and the Informal sector in vietnam | 71
the periphery of cities, because of the need for space to conduct these activities and because there is less pressure on land in rural areas. On the other hand, formal HBs in the service sector are less likely to have a professional premises in rural areas. This suggests that HBs with high potential in the service sector are less developed in rural areas than in cities. For instance, activities in the telecommunication, human health and accommodation sectors are more frequently conducted in urban areas, while food and beverage services are more common in rural areas.3 Lastly, the proportion of informal HBs with a professional premises in the trade sector is lower in rural areas. This is because the retail sale of food at home is more common in rural areas and because markets are more organized in cities (permanent posts in a market are more common).
2.2. Space constraints
While having a fixed premises is a guaranty of stability and better working conditions, the space dedicated to an activity is a good indicator of the potential for growth of the business and of the working conditions as well. As expected, the space dedicated to the activity is much smaller among informal HBs than among formal HBs: On average, the surface dedicated for activities at informal HBs is 16 square meters, while the figure for formal HBs is more than 30 square meters. These are median figures. The amount of space is higher in rural areas, reflecting weaker pressure on land. Lastly, having a pro-fessional premises does not necessarily mean having more space in which to operate a business than at home.
3. Figures are not reported here but are available on request.
TABLe 3.4.meDIAN SURFACe OF PRemISeS BY TYPe AND AReA (m²)
Source: 2014/15 HB&IS survey, VASS-CAF & IRD-DIAL; authors’ calculations
Informal HBs Formal HBs Rural Urban Rural UrbanHome 20 12 35 32
Professional premises 20 16 40 25
Percentage with more than 100 m2 10.0 3.1 28.7 21.1

| The household Businesses and the Informal sector in vietnam | chapter 03 72
Nevertheless, some HBs, mainly formal ones, have a rather large premises in which to conduct their activities. One out of four formal HBs operates in a premises that is larger than 100 square meters. Informal HBs rarely have large premises, especially in urban areas.
The lack of an adequate premises in the informal sector has been reported in many papers (La Porta and Shleiter, 2008; Barwa, 1995). Without a permanent premises, many informal HBs are likely to have insufficient access to public services such as water, electricity and the internet, and they are under continuous threat of eviction. In addition to having less access to fixed premises, informal HBs have less space when they have a fixed premises.
2.3. High rate of ownership of a fixed premises
Ownership of a fixed premises (e.g. a home out of which a HB operates, a shop or a permanent premises in a market or workshop) is an indicator of the level of stability of the operating conditions. If household businesses are located in a rented premises, they face the possibility of being shifted to other premises, which may affect their investment and growth in the long run. Moreover, renting constitutes a burden that reduces profit.
More than three out of four HB owners own their premises, and the proportion is si-milar for formal and informal businesses. In addition, a few of them (2 per cent) partly own their premises. Nine out of ten of those who work at home own their home, while the proportion of those who have a professional premises is lower but still important: 68 per cent of the formal HBs and 56 per cent of the informal HBs (see Table 3.5).
Among the three sectors of activity, manufacturing and construction had the highest degree of ownership (88 per cent), followed by trade (74 per cent) and service (65 per cent). The manufacturing and construction sectors are usually marked by a high level of fixity, which means that HB owners use secure and stable locations like their homes to run their businesses instead of renting a premises.
The share of both whole and part ownership is significantly greater in rural areas than in urban areas (82 per cent and 63 per cent respectively), and it is also greater among formal HBs than informal ones.

chapter 03 | The household Businesses and the Informal sector in vietnam | 73
Ownership of a premises, especially when the premises is the home where the house-hold lives, is certainly a factor that facilitates the operation of a business. Many house-holds conduct a little trade or another type of activity in their home. Nevertheless, this alone is not enough to develop a business, and, in certain conditions, it may be an obstacle to increasing the level of activity.
2.4. High rate of free occupancy
Among HBs that have a fixed premises, 22 per cent of the HB owners do not own the premises where they operate their business. However, only half of them have to pay rent. This proportion is lower for informal businesses: 45 per cent of the informal HB owners who do not own their premises and 61 per cent of those who have a for-mal HB pay rent. Others occupy their premises freely, and a few of the informal ones occupy their premises as squatters. The proportion of non-owners that has to pay rent is much higher in the tertiary sector, especially in the trade sector (see Figure 3.3). Chapter 10 shows that free occupancy of a premises is highly correlated with the relationship with the landlord. More than half of the landlords of professional premises are family members of the owners of the HBs, and because of this familial relationship, HB owners are often allowed to occupy a premises without paying rent, especially if they are close relatives.
TABLe 3.5.PeRCeNTAge OF OwNeRS OF PRemISeS AmONg HOUSeHOLD BUSINeSSeS BY SeCTOR AND AReA
Formal HBs Informal HBs Rural Urban Rural UrbanManufacturing & construction 89.2 88.9 78.2 87.4
Trade 85.1 81.5 72.5 63.1
Service 83.6 70.4 74.3 67.9
Total 85.9 81.6 74.2 72.3
Source: 2014/15 HB&IS survey, VASS-CAF & IRD-DIAL; authors’ calculations

All in all, only 9 per cent of the HB owners have to pay rent for their premises. This proportion is higher for formal businesses because more of them have a professional premises away from their home that they have to rent (see Table 3.6).
The precariousness of activity is primarily shown by the high rate of informal HBs ope-rating without a premises. The rate of ownership of a premises is quite high, especially among formal HBs. It is possible that not owning a premises might deter informal HBs from formalizing their business.
| The household Businesses and the Informal sector in vietnam | chapter 03 74
0 %
10 %
20 %
30 %
40 %
50 %
60 %
70 %
100 %
80 %
90 %
Manuf.& constr.
Trade Service Manuf.& constr.
Trade Service
Squat Free occupancy Renting
Informal HB Formal HB
FIgURe 3.3.OCCUPANCY STATUS OF NON-OwNeRS BY AReA AND BY mAIN eCONOmIC SeCTORS
Source: 2014/15 HB&IS survey, VASS-CAF & IRD-DIAL; authors’ calculations
TABLe 3.6.DISTRIBUTION OF HBS BY OCCUPANCY STATUS
Informal HBs Formal HBs TotalOwnership 52.5 75.2 58.5
Free occupancy 8.0 6.7 7.7
Renting 7.4 13.2 8.9
No fixed premises 32.1 4.9 25.0
Total 100 100 100
Source: 2014/15 HB&IS survey, VASS-CAF & IRD-DIAL; authors’ calculations

2.5. Some improvement between 2007 and 2014
A comparison of the types of premises used by informal HBs in Hanoi and Ho Chi Minh City between 2007 and 2014 shows a structural change in progress (see Table 3.7). The share of informal HBs without a permanent premises in the trade sector declined considerably between 2007 and 2014, by 15 points of percentage in Hanoi and 22 in Ho Chi Minh City, and it increased in the service sector in Hanoi (among street restau-rants and motorbike taxis). Meanwhile the proportion of informal HBs with a professio-nal premises increased in Ho Chi Minh City. This change is particularly important in the trade sector in both cities, where the share of informal HBs with a professional premises increased considerably. This result converges with the decline of self-employed people in both cities and suggests that informal trade is conducted in a fixed premises more often than by itinerant petty traders.
chapter 03 | The household Businesses and the Informal sector in vietnam | 75
TABLe 3.7.eVOLUTION OF THe TYPe OF PRemISeS AmONg INFORmAL HBS IN HANOI AND HO CHI mINH CITY
Hanoi Ho Chi minh City No per-
manent premises
Home Profes-sional premises
Total No per-manent premises
Home Profes-sional premises
Total
2007 Manuf. & constr. 22.7 69.8 7.5 100 7.1 86.4 6.5 100Trade 49.0 29.6 21.4 100 42.9 41.8 15.3 100Service 52.3 34.4 13.3 100 55.1 34.4 10.6 100Total 45.7 39.1 15.3 100 40.6 48.2 11.2 100
2014 Manuf. & constr. 23.9 65.4 10.7 100 11.0 70.1 19.0 100Trade 34.4 34.2 31.5 100 20.8 43.3 35.9 100Service 61.4 28.6 10.1 100 47.8 37.8 14.4 100Total 47.8 36.6 15.6 100 32.9 47.0 20.2 100
Source: 2007 HB&IS, GSO-ISS/IRD-DIAL, 2014/15 HB&IS, VASS-CAF & IRD-DIAL; authors’ calculations

| The household Businesses and the Informal sector in vietnam | chapter 03 76
To conclude on premises, the type of premises used for an activity and their occupan-cy status are diverse among HBs. A non-negligible proportion of them, one third of the informal HBs, have no fixed location from which to run their business, reflecting a high level of instability and precariousness. However, this proportion is on the decline. Around half of the HB owners benefit from a high degree of stability as they operate their business out of their home, which they generally own. However, they are res-tricted in their growth prospects as space in their home is limited. Another segment is comprised of people who have a HB and do not own their premises but occupy freely premises owned by family members. Although they do not their premises, as a family member they benefit from a certain assurance regarding their stability. Howe-ver, free occupancy generates moral debt towards their family that can impact the functioning of their business (see Chapter 10). Finally, a minority of HBs, mostly formal ones, pay rent for a professional premises. That is why they can be more vulnerable to economic shocks, but they also have the highest potential for growth as they can adapt the surface of their premises to the size of their activity, and they operate in more adequate conditions.
3.THE INfORmal SECTOR aND aDmINISTRaTIVE REgISTRaTION
Whether or not a business has been registered is one of the criteria commonly used to determine if it belongs to the informal sector. It is recommended by the ILO as an offi-cial definition of the informal sector, although the type of registration varies according to the national context. In Vietnam, the GSO uses business registration to differentiate formal from informal businesses.
We consider here three types of administrative registration: business, tax and so-cial security registration. Registration reveals what the institutional relationships are between household businesses and the state. Household businesses, except for street vendor, mobile trading, petit services and low-income services (the low-income line is defined by the provincial authorities), are obliged to register.4 Registered HBs are gran-ted a tax code for business tax, income tax and value added tax, while non-registered HBs can register to pay an annual lump sum business tax.
Before exploring the characteristics of HBs in terms of administrative registration, we present some findings about the practice of bookkeeping. The absence of accounting
4. Article 49 (Item 2) in Decree 43/ 2010/ ND – CP concerning business registration.

chapter 03 | The household Businesses and the Informal sector in vietnam | 77
records is a major characteristic of both the informal sector and formal HBs. It is linked to administrative registration, in particular tax registration, because a lack of accoun-ting makes it difficult to have a consistent policy of taxation for this sector.
3.1. Lack of accounting tools
Bookkeeping is an important indicator of the quality of management. Proper bookkee-ping contributes to improvements in an entrepreneur’s financial performance and budgeting plans. However, most HBs, even formal ones, do not keep books or records of their activity. This means that in terms of management practice, formal HBs are closer to informal HBs than to domestic or corporate enterprises.
Most informal HBs (78 per cent) do not keep any accounts at all. Only around one out of five (21.8 per cent) keep some kind of personal books, and virtually none have for-mal accounts. These proportions are similar across all the economic sectors.
These figures are not surprising as not keeping accounts is one of the main charac-teristics of the informal sector. But formalization itself does not guarantee progress in bookkeeping. Only 5 per cent of the formal HBs do bookkeeping as required by law, and more than half of them do not keep any record of their accounts (see Table 3.8).
TABLe 3.8.BOOkkeePINg BY SeCTOR, FORmALITY AND SIze OF HBS
Informal HBs Total Formal HBs
Formalbook-keeping
Personal book-keeping
No bookkeeping
Formalbook-keeping
Personal book-keeping
No bookkeeping
Manuf. & constr.
0.1 24.0 76.0 100 8.1 31.9 60.0
Trade 0.0 29.5 70.5 100 4.6 43.9 51.6
Service 0.1 14.4 85.5 100 4.7 39.8 55.5
Total 0.1 21.8 78.1 100 5.3 40.3 54.4
Source: 2014/15 HB&IS survey, VASS-CAF & IRD-DIAL; authors’ calculations

| The household Businesses and the Informal sector in vietnam | chapter 03 78
However, larger HBs are more likely to do bookkeeping than smaller ones. Legal ac-counting and personal bookkeeping make up 4 per cent and 42 per cent respectively of the HBs with 3-5 workers, and 7 per cent and 69 per cent of the HBs with more than 5 workers. Obviously, growing in size requires better management tools, but it is difficult to know the direction of causality: Do those who have a better system of management grow in size, or is it having workers that determines whether or not HBs owners do bookkeeping? In any case, even among the largest HBs, only a small share of them (7 per cent) utilise a legal accounting system, and there are still a significant number of HBs that do no bookkeeping at all (53 per cent of the HBs with 3 to 5 workers and and 23 per cent of the HBs with more than 5 workers).
Moreover, although the number of HBs with only one person has declined in Ha-noi and Ho Chi Minh City, the practice of having legal or personal accounting for one’s business has also greatly declined. Among both formal and informal HBs in both cities, the percentage of HBs that do no accounting at all increased between 2007 and 2014/15. More worryingly, this percentage more than doubled in Hanoi and in Ho Chi Minh City among formal HBs (see Table 3.9).
0 %
10 %
20 %
30 %
40 %
50 %
60 %
70 %
100 %
80 %
90 %
1 person 2 persons 3-5 persons More than 5 persons
No bookkeeping
Personnal bookkeeping
Formal keeping
FIgURe 3.4.BOOkkeePINg BY SIze OF HB
Source: 2014/15 HB&IS survey, VASS-CAF & IRD-DIAL; authors’ calculations

chapter 03 | The household Businesses and the Informal sector in vietnam | 79
Bookkeeping is one of several characteristics which define a small segment of the HBs which are more dynamic and probably have the potential to increase the size of their operation. Formalization in itself does not guarantee progress in bookkeeping. When HBs owners engage in bookkeeping, it is a sign that they are on the way to scaling up their business. In our sample, the value added when a HB has a legal accounting system is more than double the value added to a HB which only has personal records and six times more than the value added to a HB that does no accounting.
If bookkeeping is an indicator of the quality of management of a business, then it can be said that formal as well as informal HBs in Vietnam have weak management. The comparison between 2007 and 2014, even though only for the two main cities, shows a strong decline in the number of HBs that do bookkeeping. A lack of tools for managing a business is clearly an obstacle to the development of this sector. There is an urgent need to improve the accounting of small businesses by raising awareness among owners about the utility of bookkeeping, by training them (at least the owners of formal HBs)5 and by providing some tools adapted to the operating conditions of these businesses.
5. Although the prevalence of doing accounting increases with the level of education of HB owners, only two thirds of the owners have completed secondary school, and 57 percent of those high school graduates do no accounting at all. Clearly a lack of education is not the main obstacle to better accounting practices among HB owners.
TABLe 3.9.TYPeS OF BOOkkeePINg IN HANOI AND HO CHI mINH CITY IN 2007 AND 2014
Formal bookkeeping Personal bookkeeping No bookkeeping2007 2014 2007 2014 2007 2014
HanoiInformal HBs 2.2 0.2 36.3 26.7 61.5 73.2Formal HBs 9.6 8.3 70.2 48.2 20.2 43.5
HCmCInformal HBs 1 0.6 20.5 15 78.5 84.5Formal HBs 8.8 7.4 59.9 28.4 31.3 64.3
Source: Cling et al. 2010 and the 2014/15 HB&IS survey, VASS-CAF & IRD-DIAL; authors’ calculations

| The household Businesses and the Informal sector in vietnam | chapter 03 80
3.2. One quarter of the HBs have a business certificate
Business registration is the criteria used by the General Statistics Office to differen-tiate formal from informal HBs. About one fourth of the total number of HBs (26 per cent) have a business certificate and are therefore considered to be formal HBs, which suggests relatively loose administrative links to the state of household businesses in general. Business registration is higher in the trade sector (37 per cent of the HBs) than in the service and manufacturing sectors (20 per cent).
Business registration is more important in urban areas, although, as we have seen, the average size of HBs there is not larger. While one third of the HBs in urban areas have registered as a business, in rural areas only 20 per cent have done so. Thus, the rate of formality is much higher in cities. This is probably due to looser administrative mo-nitoring of businesses in rural areas. As the implementation of the rules concerning business registration is at the discretion of district authorities, it seems that outside cities there is less pressure to register (see Table 3.10). This has been confirmed by an estimation of the probability of being registered (see the appendix). Rural HBs are much less likely to be registered than urban HBs. This can be seen once size, sector of activity, value added, premises and other characteristics are controlled for.
More generally, and as expected, the estimation of the probability of being registered shows that the bigger a HB is, the more likely it is to be registered: The number of wor-kers in an HB and the annual value added are positively and significantly correlated with the decision to register. The type of premises is one of the main determinants of regis-tration as HBs with a professional premises are more likely to be registered. Interestingly, the owners of HBs whose motivation in running a HB is to be independent (see Chapter 11 for more details) are less likely to register. Finally, female owners are less likely to regis-ter their business. This can be seen once other characteristics of HBs are controlled for.
TABLe 3.10.ADmINISTRATIVe RegISTRATION BY SeCTOR AND geOgRAPHICAL AReA
Rural Urban TotalManufacturing & construction 15.8 26.0 19.5
Trade 31.2 46.0 37.3
Service 12.0 27.4 20.3
Total 20.5 33.4 26.3
Source: 2014/15 HB&IS survey, VASS-CAF & IRD-DIAL; authors’ calculations

chapter 03 | The household Businesses and the Informal sector in vietnam | 81
3.3. Low compliance with tax and social security registration
Formal HBs, i.e. those which have a business certificate, are supposed to register with the tax department. A little more than two thirds of the HBs comply with this rule, and virtually none of the informal HBs do so. The rate of compliance for formal HBs is similar in all three economic sectors, which shows that tax registration is not related to a particular kind of activity.
Lack of tax registration is sometimes used instead of business registration as the crite-ria to define informal businesses. If this were the case in Vietnam, the informal sector would be 11 per cent larger and the number of formal HBs would be one third less. Tax registration among formal HBs is highly correlated to the level of value added of a business, as shown by an estimation of the probability of formal HBs having registered with the tax department (see Model 2 in the appendix).
Only 3 per cent of all HBs contribute to social security, and while relatively more formal than informal HBs contribute to social security, the rate of registration remains very low for all (see Table 3.11).6
Compliance with social security regulations increases with the size of a HB (the total number of workers, including the HB’s owner and spouse), but even among HBs with more than five workers, social security registration remains low at 12 per cent (see Figure 3.5). If we consider only HBs which have at least one wage worker, the rate of compliance is not much higher, only 5 per cent. In addition, the probability of social
6. Decree 152/2006 dated December 22nd, 2006 stipulates that HBs are obliged to register their business and contribute to social security.
TABLe 3.11.TAX AND SOCIAL SeCURITY RegISTRATION BY SeCTOR AND BUSINeSS RegISTRATION STATUS (PERCENTAGE)
Tax registration Social securityFormal HBs Informal HBs Formal HBs Informal HBs
Manufacturing & construction 67.4 0 1.6 2.4
Trade 69.3 0.3 7.2 1.1Service 68.9 0 7.3 3.4Total 68.8 0.1 6.1 2.4
Source: 2014/15 HB&IS survey, VASS-CAF & IRD-DIAL; authors’ calculations

| The household Businesses and the Informal sector in vietnam | chapter 03 82
security registration among formal HBs is not correlated to the size of a HB once the other characteristics of the business are taken into account (see Model 3 in the appen-dix). So enforcement of the legal regulations on social security contributions is very limited, even among formal HBs.
The very low rate of compliance with social security registration aggravates the vulne-rability of all the workers in the HB sector. Incentives to comply with social security regulations should be envisaged to improve the social protection of not only the informal sector but also workers at formal HBs.
There is hope for social security enrolment when one considers the evolution of social security registration over time in Hanoi and Ho Chi Minh City. There has been some progress in both cities among both informal and formal HBs, but not very much (2 to 6 points of percentage in seven years), and the number of HBs which are not registered is still considerable (19 out of 20).
An opposite trend can be seen concerning tax registration: a decline in both cities among formal HBs. The increase in formalisation, i.e. in business registration, that has been seen in the past years (see Chapter 2) has not translated into increased registration with the tax department. This shows that formalisation is very fragile (see Table 3.12).
0 %
10 %
20 %
30 %
40 %
50 %
60 %
70 %
100 %
80 %
90 %
1 person 2 persons 3-5 persons 6-18 persons
Not registered
Registered
FIgURe 3.5.SOCIAL SeCURITY RegISTRATION BY SIze OF HB
Source: 2014/15 HB&IS survey, VASS-CAF & IRD-DIAL; authors’ calculations

Formalisation has little impact on the social protection of workers. Concern about the social protection of workers goes beyond the informal sector. Even at formal HBs the vulnerability of workers is high. Extending social security to workers at household businesses should be a main axis of policies towards this sector (see Chapter 8 for further discussion).
4.faCTORS Of fORmalISaTION
As hinted above, the frontier of formalisation is fragile. Indeed, a significant number of informal HBs are willing, and are even preparing, to formalise their business by regis-tering and getting a business certificate. However, they are a minority of the informal businesses. For the majority, the advantages of formalisation are not so obvious, and there is clearly a lack of knowledge about the regulations.
In this section we first examine why informal HBs do not register and formalise their business, and we discuss the opinions of owners of informal HBs concerning regis-tration and having a business certificate. In the second part we look at the expected advantages of having a formal business.
4.1. why informal businesses are not registered
Owners of informal HBs were asked what their main reason was for not registering and getting a business certificate, which would formalise their business. Most of them (68 per cent) think they do not have to register to get a business certificate (see Table 3.13). This statement is quite surprising because owners of all kinds of informal
chapter 03 | The household Businesses and the Informal sector in vietnam | 83
TABLe 3.12.TYPeS OF RegISTRATION IN HANOI AND HO CHI mINH CITY IN 2007 AND 2014
Tax registration Social security registration2007 2014 2007 2014
HanoiInformal HBs 1.2 0 0 2.5Formal HBs 77.8 64.6 2.7 7.7
HCmCInformal HBs 0.1 0 0.4 2.2Formal HBs 86.3 75.4 2 7.9
Source: Cling et al. 2010 and the 2014/15 HB&IS survey, VASS-CAF & IRD-DIAL; authors’ calculations

| The household Businesses and the Informal sector in vietnam | chapter 03 84
businesses, small and big and in all economic sectors, said this. The precise require-ments for each HB, whether or not it should be registered, are unknown because it depends on the district context. However, those who have no premises, such as street vendors and motorbike taxi drivers, were more likely to say that they did not have to register. However, this is not the case. A similar proportion of informal HBs in all kinds of premises, including professional premises, think they are not subject to registration. Even HBs that have several workers or have high value added or make a high profit share this opinion. This clearly shows a lack of knowledge of the regulations, not only among the owners of HBs but among the local authorities as well.
Other reasons for not registering are much less prevalent. 12 per cent do not want to register, probably because they do not see any advantage in formalising their bu-siness. Having an instable income is another reason (10 per cent), and a rather good one, although it might not be accepted by district authorities. This shows, however, that formalising a business is a step towards a steadier and more established way of conducting an activity. This reason was given slightly more often by HBs which were created in recent years. This is also the case for those who do not know if they have to register. Here again, there is a lack of information. Finally, the cost of registration and the complicated procedures are not the main reasons for not registering (less than 1 per cent). Most of the informal HBs can afford the cost (the median cost has been 200,000 VND since 2010, and only 5 per cent of the HBs had to pay more than 3 million VND).
TABLe 3.13.ReASONS INFORmAL HBS HAVe FOR NOT RegISTeRINg
Too com- Too ex- Not Do not Unstable Do not Total plicated pensive man- know if income want datory they have to to registerManufacturing & const. 1.2 1.2 64.6 7.9 11.9 13.2 100
Trade 0.3 0.1 70.4 7.2 8.3 13.2 100
Service 0.6 0.4 69.6 5.7 11.6 11.3 100
Total informal HBs 0.7 0.6 68.4 6.8 10.7 12.4 100
Urban informal HBs 1.1 0.6 69.5 5.5 12.3 10.6 100
Rural informal HBs 0.4 0.5 67.6 7.6 9.6 13.7 100
willing to register* 66.2 22.8 21.1 44.8 16.8 22.6 22.7
* Read as follows: 66.2 per cent of those who stated that they have not registered because it is too complicated are nevertheless willing to register; 22.8 per cent of those who said it is too expensive are ready to register.
Source: 2014/15 HB&IS, VASS-CAF & IRD-DIAL; authors’ calculations

chapter 03 | The household Businesses and the Informal sector in vietnam | 85
The reasons for not registering are similarly distributed across economic sectors and among rural and urban HBs. Cost or complicated procedures were given as reasons for not registering by a very small number of HB owners everywhere. This was the case in Hanoi and Ho Chi Minh City in 2007 (Cling et al., 2010). If the objectives of policies are to facilitate registration, the problem to tackle is not so much the fees or the procedures but rather the lack of information about registering among HB owners.
Most of the owners of informal HBs do not intend to formalise their business. Only about one quarter of them (23 per cent) are eager to register.7 Interestingly, willingness to for-malise is not related to the number of workers or to the amount of value added or profit of a business. The same proportion of informal HBs owners willing to formalise is found among all kinds of informal businesses. This is verified when the operating conditions of a business (the type of premises in which the business is operated) are considered. Among those with no fixed premises (who are therefore not obliged to register), the proportion which stated that they were prepared to register is similar to those who work at home and even those who have a professional premises.
4.2. Advantages of being registered
Willingness to register greatly depends on how HB owners perceive the advantages of formalising their business. More than half of the informal HBs (53 per cent on average, but 58 per cent in rural areas) see no advantage in registering their business.
Access to loans is by far the main advantage of formalisation in the opinion of informal HB owners. 36 per cent of them stated this as an advantage of formalisation, and 24 per cent said this is the main if not the only advantage of formalisation. Other reasons are access to a better marketplace (in markets in particular) and the possibility to sell products to large firms. Formalisation has resulted in facing less corruption for only 13 per cent of the informal HBs owners.
7. A few of them (0.5 per cent) stated that registration is in progress.

For formal HBs the decision to register is mainly motivated by the obligation to have a business certificate rather than by the benefits they expect to receive as a result. 60 per cent stated that they registered because it is compulsory and 22 per cent said that they were forced to register. Only 17 per cent of the formal HBs registered because they thought that being officially registered would facilitate their business.
4.3. evolution since 2007
Although this study was limited to the two main cities in Vietnam, the evolution of the attitude of informal HBs towards formalisation sheds light on the applicability of bu-siness registration. This is done through three questions we have previously seen: Why have informal HBs not registered? What are the main advantages of registration they foresee? and How many of them are prepared to register?
Although at first glance the reasons for not registering appear to have been stable between 2007 and 2014, with the majority of owners saying registration is not manda-tory in their case, there have been significant evolutions among the other reasons (see Figure 3.7). As seen above, the majority of the owners who said that business registration
| The household Businesses and the Informal sector in vietnam | chapter 03 86
0
5
10
15
20
25
30
40
35
Accessto loans
Access tothe best
marketplace
Able to sellproducts tolarge �rms
Advertising Face lesscorruption
The main advantage One advantage
FIgURe 3.6.wHAT INFORmAL HB OwNeRS THINk ABOUT BUSINeSS RegISTRATION (PERCENTAGE)
Source: 2014/15 HB&IS, VASS-CAF & IRD-DIAL; authors’ calculations

is not mandatory were unaware that the regulations stipulate that most of them should register. Some of them said that they did not know whether or not they were supposed to register. In 2007 these were two reasons given by 90 per cent of the owners (more in Hanoi than in Ho Chi Minh City) who had not registered. In 2014, one of these two reasons was given by three quarters of the respondents in both cities. Awareness of the regulations has increased, but a lot remains to be done. This progress is tempered by the fact that an increasing proportion of informal HB owners (an increase of 10 points of percentage in both cities) stated that they do not want to register anyway.
It is clear that registration is not a problem of cost or red tape. Only a low percentage of the owners in 2007 stated this as their reason for not registering, and there has been no noticeable change since then.
In 2007 less than half of the informal HBs owners could not see any advantage in forma-lising their business (45 per cent in Hanoi and 49 per cent in Ho Chi Minh City). In 2014 the share of owners who did not foresee any advantage had jumped to 59 per cent in both cities. In addition, the advantages have significantly changed (see Table 3.14). While in 2007-2008 the main advantage was facing less corruption (58 per cent in Hanoi and 55 per cent in HCMC), other advantages were greater in 2014, with only 9 per cent
chapter 03 | The household Businesses and the Informal sector in vietnam | 87
0 %
10 %
20 %
30 %
40 %
50 %
60 %
70 %
100 %
80 %
90 %
Other, no answer
Don’t want to
Too complicated or expensive
Not mandatory
Don’t know if I have to
2007
2
18
73
2
5
2014
111
78
2
8
2007
2
07
80
10
2014
105
70
3
12
Hanoi Ho Chi Minh City
FIgURe 3.7.TReND IN THe ReASONS INFORmAL HBS HAVe FOR NOT RegISTeRINg IN HANOI AND HO CHI mINH CITY BeTweeN 2007 AND 2014 (PERCENTAGE)
Source: 2007 HB&IS, GSO-ISS/IRD-DIAL, 2014/15 HB&IS, VASS-CAF & IRD-DIAL; authors’ calculations

| The household Businesses and the Informal sector in vietnam | chapter 03 88
of the respondents in Hanoi and 4 per cent in HCM stating that facing less corruption would be the main advantage of formalising their business. Corruption is no longer a major concern for informal HBs owners. In 2014 HB owners were much more concerned with finding a way to expand their business, either by having easier access to loans or by selling to large firms.
The proportion of informal HBs that are prepared to register in order to become formal is relatively stable in Hanoi and Ho Chi Minh City, except in the case of the trade sector in Hanoi, where willingness to register has declined. In Ho Chi Minh City willingness to register has significantly increased in the manufacturing sector (see Table 3.15).
TABLe 3.14.TReND IN THe PeRCeIVeD ADVANTAge OF RegISTeRINg A BUSINeSS AmONg INFORmAL HB OwNeRS IN HANOI AND HO CHI mINH CITY IN 2007 AND 2014 (PERCENTAGE)
Hanoi Ho Chi minh City 2007 2014 2007 2014Access to loans 10.3 28.1 6.1 45.6
Access to a marketplace 18.0 19.3 20.1 1.8
Sales to large firms 5.8 34.6 4.9 37.7
Advertising 2.2 5.7 1.0 5.5
Face less corruption 57.8 9.8 55.1 4.0
Other 5.9 2.4 12.8 5.4
Total 100 100 100 100
Source: 2007 HB&IS GSO-ISS/IRD-DIAL, 2014/15 HB&IS, VASS-CAF & IRD-DIAL; authors’ calculations
TABLe 3.15.HBS PRePARINg TO RegISTeR IN HANOI AND HO CHI mINH CITY IN 2007 AND 2014 (PERCENTAGE OF INFORMAL HB OWNERS)
Hanoi Ho Chi minh City 2007 2014 2007 2014Manufacturing & construction 18.9 18.6 19.2 27.6
Trade 17.6 9.5 21.0 19.0
Service 14.1 15.3 18.4 20.1
Total 16.3 14.4 19.4 21.8
Source: Cling et al., 2010, p 174; 2014/15 HB&IS, VASS-CAF & IRD-DIAL; authors’ calculations

chapter 03 | The household Businesses and the Informal sector in vietnam | 89
CONClUSION
An examination of the classical characteristics of informality among HBs and more specifically in the informal sector confirms in some respects that there is a typical informal sector in Vietnam, e.g. small-size businesses, a disregard for state regulations and a lack of modern management tools. It also shows some heterogeneity in terms of the types of premises where businesses are operated and the degree of instability this implies. Likewise, it shows that some characteristics of informality are shared by formal HBs, which are not so different than informal ones in terms of size and respect for regulations.
As elsewhere, the HB sector, and more specifically the informal sector in Vietnam, is characterised by its small size. However, the trend in the size of informal HBs shows that a structural change is at play, as self-employed workers, in particular those in pre-carious trade activities, are being progressively replaced by family HBs.
The characteristics of a premises for an activity reflect the heterogeneity of the HBs. Al-though most of the HB owners operate their business out of their home and own their premises, a segment of the informal sector has either no fixed premises or a precarious occupancy status. One third of the informal HBs have no fixed location from which to run their business, reflecting a high level of instability and precariousness, and around half of the HB owners benefit from a high degree of stability because they operate their business in their home, which they generally own. However, they are restricted in their growth prospects as space in their home is limited. Finally, a minority of the HBs, mostly formal ones, rent a professional premises. Even though that results in an additional cost, these HBs operate in more adequate conditions and have a higher potential for growth as they are not constrained by the limited space in their own home.
About one fourth of the total number of HBs are formal HBs that have a business certificate, suggesting relatively loose administrative links to the state of household businesses in general. While one third of the HBs in urban areas are registered, only 20 per cent of the HBs in rural areas are registered, even though the average size of the HBs in rural areas is not smaller. Rural HBs are even larger on average and more oriented towards manufacturing and construction activities. This suggests a lack of enforcement of the regulations in rural areas.
The main reason why formalisation is not enforced and why informal businesses are not willing to formalise is a lack of information related to the regulations. Indeed, a

| The household Businesses and the Informal sector in vietnam | chapter 03 90
large proportion of the informal HB owners think that they are not subject to regis-tration, and this proportion does not vary according to the size of the business or the kind of premises. This clearly shows a lack of knowledge of the regulations, not only among the HB owners but also the local authorities. A lack of incentive to formalise is another obstacle as more than half of the informal HBs see no advantage in re-gistering their business. Only 17 per cent of the formal HBs registered because they thought that being officially registered would facilitate their business. The decision to register is mainly motivated by the obligation to have a business certificate rather than by any advantages they may expect as a result of registering.
In addition to the predominance of informal HBs, a non-negligible share of HBs de-fined as formal do not have the expected attributes of formality. Formal HBs, those which have a business certificate, are required register with the tax department. A little more than two thirds comply with this rule. While formalisation of HBs has had an effect on tax registration, this has not been the case with social security registration. The very low rate of compliance with social security registration requirements, even among formal HBs, aggravates the vulnerability of all the workers in the HB sector. Incentives to comply with social security regulations should be envisaged to improve the social protection of not only the informal sector but also workers at formal HBs. Finally, most of the HBs do not keep books or records of their activities, not even the formal HBs. In that respect formal HBs are closer to informal HBs than formal enter-prises. If bookkeeping is an indicator of the quality of management of a business, then it can be said that formal as well as informal HBs in Vietnam have weak management. This calls for policy aimed at improving the accounting of small businesses, especially formal ones, by training the owners and by implementing some tools adapted to the conditions of operation at these businesses.

chapter 03 | The household Businesses and the Informal sector in vietnam | 91
appENDIx - DETERmINaNTS Of REgISTRaTION Of HBS IN VIETNamThis section applies the probit regression model to identify factors behind the deci-sion to register or not among household businesses in Vietnam using data from the 2014/15 HBIS. The dependent variables are the binary response showing whether an HB has registered its business or not for all HBs (Model 1), whether an HB has complied with tax registration requirements or not (for formal HBs only) (Model 2), and whether an HB has complied with social security registration requirements or not (for formal HBs only) (Model 3). In order to identify the determinants of why owners decide to register their business or not, the marginal effects of all explanatory variables X on the probability of registering is calculated. This corresponds to a change in the probability of registering due to an increase of one unit of the explanatory variable from the ba-seline or reference group.
TABLe 3.A DeTeRmINANTS OF BUSINeSS RegISTRATION, TAX RegISTRATION AND SOCIAL SeCURITY RegISTRATION
(model 1) (model 2) (model 3) Probability of being Probability of tax Probability of social formal (registered as registration among security registration a business) vs informal formal HBs among formal HBs
Urban (ref. rural) 0.354*** 0.130 0.365** (0.0535) (0.0928) (0.159)
Sector of activity (ref. manuf & construction)
Trade 0.887*** 0.323*** 0.350* (0.0691) (0.120) (0.196)Service 0.561*** 0.211* 0.353* (0.0685) (0.121) (0.197)
Number of workers (ref. 1 worker)
Two workers 0.242*** 0.00726 0.262 (0.0594) (0.105) (0.171)
3-5 workers 0.542*** 0.0402 0.370* (0.0775) (0.126) (0.193)
6-18 workers 0.748*** 0.0960 0.295 (0.142) (0.212) (0.320)
Quartile of value added (ref. 1st quartile)
Quartile 2 0.108 0.191 0.218 (0.0783) (0.147) (0.246)
Quartile 3 0.424*** 0.524*** 0.0209 (0.0765) (0.139) (0.238)
Quartile 4 0.605*** 0.566*** 0.123 (0.0824) (0.143) (0.239)
Duration of the business (ref. 0-4 years)
5-9 years 0.140* 0.107 0.0391 (0.0744) (0.128) (0.190)
10-16 years 0.387*** 0.257** -0.0814 (0.0704) (0.118) (0.180)More than 16 years 0.315*** 0.360*** 0.00862

| The household Businesses and the Informal sector in vietnam | chapter 03 92
Note: Standard errors in parentheses; *** p<0.01, ** p<0.05, * p<0.1
Source: 2014/15 HB&IS, VASS-CAF & IRD-DIAL; authors’ calculations
Type of premises (ref: no fixed premises)
At home 0.941*** 0.113 -0.718*** (0.0839) (0.177) (0.218)
Professional premises 1.125*** 0.197 -0.737*** (0.0841) (0.176) (0.216)
motivation (ref: no job as wage worker or farmer)
Higher income 0.0766 0.194* 0.284 (0.0729) (0.115) (0.179)
Independence -0.199*** 0.0190 0.325 (0.0770) (0.132) (0.206)
Family tradition or other -0.0835 0.262** 0.250 (0.0665) (0.112) (0.182)
Female owner -0.149*** 0.00388 -0.0191 (0.0552) (0.0926) (0.135)
education level of the owner (ref. no diploma/certificate)
Primary 0.229*** 0.129 0.360* (0.0614) (0.108) (0.184)
Lower secondary 0.429*** 0.270** 0.420** (0.0663) (0.113) (0.184)
Upper secondary 0.572*** 0.363* 0.141 (0.125) (0.187) (0.284)
Superior 0.130** 0.0922 0.0980 (0.0570) (0.0936) (0.138)
Constant -2.968*** -0.891*** -2.218*** (0.134) (0.261) (0.400)
Observations 3,406 1,028 1,028

chapter 04 | The household Businesses and the Informal sector in vietnam | 93
workers In The Informal secTor: who are They and whaT are TheIr workInG condITIons?
nguyen Thu hien
As mentioned in Chapter 3, operating conditions in the informal sector are poor and insecure. In addition, Vietnam has experienced spectacular development over the past ten years. Therefore, how these precarious operating conditions affect employment and labour conditions in this sector and whether improvement of working conditions has come with this development warrants analysis. Based on HBIS surveys, this chapter complements Chapter 2 by providing an in-depth overview of the working conditions in the HB sector. With regard to the objective of inclusive growth, it aims to understand the source of vulnerability and the precariousness of the wor-kers in this sector and to identify the groups of workers that are the most vulnerable in order to ensure better protection and stability of the labour force.
This chapter includes three sections. Section 1 describes the socio-demographic characteristics of the workers in the informal sector and calls into question the common perception of workers in the informal sector, in particular with regards to the gender, migratory status, seniority and qualifications of the workers. Section 2 presents an overall picture of the working conditions in the informal sector. As shown in Chapter 2, although this sector is an important source of employment and it generates income for many people, the labour conditions are precarious and the workers lack protection. The HB&IS survey allows us to go further in the analysis of these conditions. In particular, it provides new knowledge about the earnings of workers in the informal sector, and it yields new insights into the lack of formal gua-rantees in this sector by considering the relationship between the owner and the employees as a substitute for formal arrangements. Section 3 analyses the trend in working conditions observed in Hanoi and Ho Chi Minh City between 2007 and 2014 and highlights a mitigated improvement of these conditions.
04

| The household Businesses and the Informal sector in vietnam | chapter 0494
1.wHO aRE THE wORkERS IN THE HOUSEHOlD BUSINESS aND INfORmal SECTORS?
This first section presents an overall picture of the socio-demographic characteristics of the workers in the informal sector, including gender, seniority, migratory status, education and training.
1.1. gender
As shown in Chapter 2, women are not overrepresented in the HB sector compared to the rest of the labour force: They account for 46 per cent of the labour force in the informal sector and 45 per cent in the formal sector. This section presents in greater detail the distribution of female workers in the HB sector to find out which indus-try or position attracts the most female workers. As shown in Figure 4.1, women are the spouse of the owner in the same proportion as men, but women are more likely to be own-account workers than men, and they are wage workers less often than men. Among formal HBs, they are slightly less likely to be employers than men as well. Although working on one’s own-account is usually considered to be vulnerable employment,1 it provides an important source of livelihood for women since working in this sector gives them more flexibility to fulfil family obligations. They can work at home or at a market. Over a quarter of the female informal HB owners say that they decided to work on their own account in order to be able to reconcile family and pro-fessional life, and this was the case for only 6 per cent of the men.2
Figure 4.1 shows that women are much more represented in the trade sector (espe-cially retail trade) and food services than men. In contrast, there are very few women in the transport and construction sectors, and they are underrepresented in the other services and in the formal manufacturing sector.
1. According to the ILO, Key Indicators of the Labour Market 03 (KILM03), although we will see in this chapter that this does not hold true in the HB sector when compared with the status of wage workers.
2. For further information, see Chapter 11.

1.2. migratory status
The share of migrants at urban informal HBs is very small, only 3 per cent of the total number of workers, including the HB owners. The urban manufacturing and construc-tion sector has the highest proportion of migrants, but the figure is still modest (5 per cent at informal HBs and 8 per cent at all HBs). The proportion of migrants at formal HBs is higher than that at informal ones, but it is only 7 per cent in urban areas. This finding is interesting as it goes against findings3 from other contexts which show that the urban informal sector mainly consists of migrants from rural areas. That is not the case in Vietnam.
3. Source: Urban Informal Sector in Asia: An annotated bibliography, Geneva, International Labour Office, 1992 (International Labour Bibliography, No. 13).
chapter 04 | The household Businesses and the Informal sector in vietnam | 95
0 %
10 %
20 %
30 %
40 %
50 %
60 %
70 %
100 %
80 %
90 %
InformalMale
InformalFemale
FormalMale
FormalFemale
InformalMale
InformalFemale
FormalMale
FormalFemale
Employer
Family helper
Spouse
Own-account worker
Apprentice
Wage worker
Construction
Other services
Transport
Manufacturing
Trade
Rest. & Accom.
FIgURe 4.1.DISTRIBUTION OF FemALe AND mALe wORkeRS BY jOB STATUS AND INDUSTRY (PERCENTAGE)
Source: 2014/15 HB&IS survey, VASS-CAF & IRD-DIAL; authors’ calculations

1.3. Seniority
The average seniority of workers at HBs is high, as was the case in 2007 in Hanoi and Ho Chi Minh City (Cling et al. 2010). Over one third (39 per cent) of the informal HB workers had more than ten years’ seniority at their HB, and only 4 per cent had been there less than one year. Seniority is correlated to job status.
Employers rank first with an average seniority of 11.5 years at informal HBs and 12.4 at formal ones, followed by own-account workers at 10.6 years. Both the long duration of HBs (see Table 4.2) and the fact that they rarely change ownership explain the high seniority for these categories of workers. The spouse and family helpers have high seniority as well, showing that they generally help the owner from the start of the business. On average, the spouse joins the business one year after it starts up while other family workers join it after three years. This suggests that family helpers are not an adjustment factor for the business activity. On the contrary, they join the business as soon as it reaches the critical level of activity, and they then become a structural element of the business. This illustrates the specific way that family businesses (which constitute 37 and 43 per cent of the informal and formal HBs respectively) function in the context of Vietnam, as described in Chapter 3.
High seniority was not observed for wage workers. They only work at an HB for around 4 years. Two reasons may explain the short duration of wage workers at HBs. First, HBs have to wait several years before being able to recruit wage workers. Second, wage workers are recruited or fired according to the needs of the business. This second expla-nation is the most convincing because only 18 per cent of the informal HBs with wage
| The household Businesses and the Informal sector in vietnam | chapter 0496
TABLe 4.1.SHARe OF mIgRANTS IN THe HB SeCTOR BY INDUSTRY AND FORmALITY STATUS (PERCENTAGE)
migrant (%)Rural Urban Total
Industries Manufacturing & construction 2.3 7.7 4.3Trade 0.9 3.6 2
Service 1.5 3.7 2.7Informal HBs 1 2.9 1.7Formal HBs 3.4 7.1 5.5
All HBs 1.6 4.7 2.9
Source: 2014/15 HB&IS survey, VASS-CAF & IRD-DIAL; authors’ calculations

chapter 04 | The household Businesses and the Informal sector in vietnam | 97
workers and 24 per cent of the formal ones have experienced a growth of their work-force since their start-up (see Chapter 6), which shows that most of the HBs with wage workers do not have to wait for several years before being able to hire wage workers.
1.4. education and training
As shown in Chapter 2, educational attainment in the informal sector is found to be significantly lower than in the other institutional sectors. Only one fifth of the informal HB workers have completed secondary education (see Figure 4.2). Moreover, more than half of them did not go further than primary education. Generally, educational attainment among formal HBs is higher than among informal ones for all kinds of workers (see Figure 4.2). On average, the proportion of workers who have completed upper secondary education and work at formal HBs is twice that of those who work at informal HBs (38 per cent and 20 per cent respectively). In addition, only one third of the formal HB workers and more than half of the workers at informal HBs have only a primary education or less.
Interestingly, wage workers have almost the same level of education as the owners or their spouses. In contrast, family helpers, who constitute 8 per cent of the wor-kers at HBs, are on average more educated than the others, especially in the informal sector: The proportion of family helpers having completed secondary education is 14 and 9 points of percentage higher than for other workers at informal and formal
TABLe 4.2.SeNIORITY OF wORkeRS AND DURATION OF HB, BY jOB STATUS (YEARS)
job status Informal HBs Formal HBsOwn-account worker 10.6 10.6Employer 11.5 12.4Spouse 9.0 10.5Wage worker 4.2 3.6Family helper 8.4 9.3Total 9.2 8.2
HB duration1 worker 12.0 10.42 workers 9.9 11.83-5 workers 11.6 12.86-18 workers 12.7 12.0Total 11.2 11.6
Source: 2014/15 HB&IS survey, VASS-CAF & IRD-DIAL; authors’ calculations

| The household Businesses and the Informal sector in vietnam | chapter 0498
HBs respectively. This can be explained by the upward mobility in education from one generation to the next. Indeed, two thirds of the family helpers (67 per cent) are the owner’s children. The majority of these children have a higher level of education than the owner and almost half of them have completed upper secondary school. On the one hand, this may be viewed as low prospects for the children of HB owners. On the other hand, this may be interpreted as an opportunity for HBs to benefit from new skills and potential to develop their business. The second interpretation should be preferred as a significant share of these children have another main job and only help to manage the family business. Nearly one third of them have a secondary job and two thirds of them are part-time workers.4
4. Part-time workers are defined as workers who work less than 35 hours per week (see section 2.5 of this chapter).
Owner Wage workerSpouse Family helper Total IHB
53.6
19.4
56.1
18.5
52.2
17.5
52.4
20.4
4033.3
Primary or less >= Upper secondary
Informal HBs
Owner Wage workerSpouse Family helper Total FHB
Formal HBs
34.637.7
32.7 34.2 34.438.1
33.237.9
26.7
47.5
FIgURe 4.2.LeVeL OF eDUCATION BY jOB STATUS AND FORmALITY STATUS (PERCENTAGE OF WORKERS)
Source: 2014/15 HB&IS survey, VASS-CAF & IRD-DIAL; authors’ calculations

chapter 04 | The household Businesses and the Informal sector in vietnam | 99
Apart from certificates, skills are crucial factors in guaranteeing the quality of the work-force as educational certificates (and the training they represent) may be insufficient for undertaking numerous economic activities. Figure 4.3 provides information about sources of skill acquisition. Skills which are used at HBs and in the informal sector are mainly learned outside formal education. More than three quarters of the HB workers acquired their skills through learning by doing and only 5 per cent through formal education (e.g. vocational/professional schooling or short courses offered by an asso-ciation). 69 per cent of the HB workers in the trade sector learned their skills through on-the-job training without a trainer, compared to around 36 per cent in the manu-facturing sector and 48 per cent in the service sector. Having a mentor in the training process only seems necessary in the manufacturing and construction sectors, which require more technical skills. Up to 45 per cent of the HB workers in the manufacturing and construction sectors are trained by their mentor, whereas only 16 per cent of the workers in the trade sector and 29 per cent in the service sector learn from a mentor. Finally, in some cases a family member teaches the required skills (12 per cent of the time). The sources of skill acquisition are almost the same for formal and informal HBs.
0 %
10 %
20 %
30 %
40 %
50 %
60 %
70 %
100 %
80 %
90 %
Self-learning
Trained by a family member
Learning by doing without a trainer
Learning by doing with a trainer
At school
Manuf.& constr.
Service InformalHBs
FormalHBs
AllHBs
Trade
FIgURe 4.3.TRAININg OF wORkeRS BY INDUSTRY AND FORmALITY STATUS (PERCENTAGE)
Source: 2014/15 HB&IS survey, VASS-CAF & IRD-DIAL; authors’ calculations

| The household Businesses and the Informal sector in vietnam | chapter 04100
2.wHaT aRE THE wORkINg CONDITIONS Of THE wORkERS IN THE INfORmal SECTOR?
While Chapter 2 concentrates on the trend in the working conditions in the informal sector and compares them with other institutional sectors, this section analyses more in detail the working conditions by industry and job status in the HB and informal sec-tors and the differences between rural and urban areas. In addition, we also examine how the relationship between workers and owners impacts working conditions.
2.1. job status According to the ILO (KILM 3), the indicator of status of employment distinguishes between three categories of employment: wage workers, self-employed workers and contributing family workers (also known as unpaid family workers). Figure 4.4 shows that around half of the workers at informal HBs (46 per cent) are own-account workers, while nearly one third are unpaid family workers: the owner’s spouse and other family helpers. The proportions of employers and wage workers are much lower, at 12 and 10 per cent respectively.5 This distribution with a large share of own-account workers is an indicator of the poor accumulation capacity of the informal sector (Cling et al., 2010).
5. As mentioned in Chapters 1 and 2, the 2014/15 HB&IS survey does not cover the construction workers who stated they are informal but are not related to any HB (because they work under contract for
Own-account worker
Employer
Spouse
Wage worker
Family helper
Apprentice
Partner
46
12
21
10
8
11
29
1723
22
8
11
Informal HBs Formal HBs
FIgURe 4.4.STRUCTURe OF emPLOYmeNT BY jOB STATUS IN THe FORmAL AND INFORmAL HBS (PERCENTAGE OF WORKERS)
Source: 2014/15 HB&IS survey, VASS-CAF & IRD-DIAL; authors’ calculations
chapter 04 | The household Businesses and the Informal sector in vietnam | 101
The structure of employment at formal and informal HBs differs by the share of own-account workers and wage workers. The proportion of own-account workers at formal HBs is two thirds of the share at informal HBs, whereas the proportion of wage workers is twice that observed at informal HBs.
Because the share of wage workers, defined as the ratio of the number of wage workers to the total number of workers, reflects both the working conditions of the workers and HBs having to resort to the market to get labourers, it deserves to be examined in grea-ter detail. As mentioned before and shown in Table 4.3, the share of wage workers in the total workforce at informal HBs is low at 11 per cent.6 The proportion is the highest in the manufacturing and construction sector (20 per cent). Not surprisingly, the share of wage workers is much higher at formal HBs than informal HBs, and this gap is par-ticularly large in the manufacturing and construction sector, where the ratio of wage workers is 41 per cent at formal HBs. Such a modest representation of wage workers at informal HBs could be associated with the predominance of own-account workers and the small percentage of employers hiring wage workers, as shown in Chapter 3.
In contrast, there is almost no difference between urban and rural areas, except in the trade sector, where the rate of wage workers in urban areas is particularly low. As men-tioned in Chapter 3, this is possibly because the trade sector in urban areas significantly involves mobile street vendors and other kinds of vendors who work alone.
6. See previous footnote.
individuals). For this reason, the share of wage workers in the informal sector is nearly 50 per cent lower in the HB&IS than the share estimated in the 2014 LFS. As the characteristics of the construction workers are specific to them (e.g. in terms of gender, age, educational level and migration status), the results of the HB&IS concerning wage workers at informal businesses are not comparable with the results of the LFS presented in Chapter 2.

Despite the minor proportion of wage workers in the total workforce of the informal sector, wage workers account for a large portion of the dependent workers (48 per cent), who are defined as workers other than owners, their spouse and partners (see Table 4.3). This means that almost half of the people who are hired are wage workers.
2.2. Type of contract and temporary status
More than a half of the dependent workers at informal HBs do not have any form of contract (verbal or written), and written contracts are almost non-existent (0.7 per cent of the workers and 1.2 per cent of the wage workers at informal HBs). The propor-tion of dependent workers without a contract is the highest in the informal trade sector, where 60 per cent of the workers do not have a contract (see Table 4.4), and the proportion for this sector is 86 per cent in urban areas. A lack of formal agreements was also observed at the formal HBs: Only 3 per cent of the dependent workers and 5 per cent of the wage workers have a written contract, while 23 per cent of the wage workers at formal HBs do not have a verbal or written contract. Again, the status of wage workers at HBs is not associated with increased stability, especially in urban areas.
| The household Businesses and the Informal sector in vietnam | chapter 04102
TABLe 4.3.RATe OF wAge wORkeRS BY INDUSTRY AND geOgRAPHICAL AReA (PERCENTAGE)
Share of wage workers(% of total workforce)
Share of wage workers(% of total dependent workers)
Rural Urban Total Rural Urban TotalInformal HBsManufacturing & construction
18.1 22.8 19.6 59.8 66.9 62.1
Trade 8.1 2 6.2 41.3 17.7 36Service 5.2 6.9 6.1 36.6 37.5 37.1Total IHB 11 10.1 10.6 49.4 46.4 48.3
Formal HBsManufacturing & construction
41.5 40.7 41.1 81.6 77.6 79.6
Trade 7.8 14.5 11.3 44.6 57.3 51.9Service 20.1 24.2 23 52 64.3 60.7
Total FHBs 20.1 23.7 22.2 62.1 65.7 64.2
All HBs 13.1 15.6 14.2 53.5 56.9 55
Source: 2014/15 HB&IS survey, VASS-CAF & IRD-DIAL; authors’ calculations

The lack of formal agreement can be explained by the fact that labour relations are based mostly on kinship or a personal connection between the employer and the em-ployees in the HB sector. It seems that these family ties act as a substitute for a formal arrangement. 63 per cent of the employees at informal HBs (except the spouse) are hired through family or friends of the owner (see section 2.4 and Chapter 10 for more details).
Besides the lack of a formal arrangement, nearly one worker out of ten occupies a temporary position in the informal sector (see Table 4.5).7 The manufacturing and construction sectors have the highest proportion, in particular in rural areas (11 per cent). Meanwhile, this figure is higher in urban areas for the trade sector (10 per cent). The share of temporary workers is smaller among formal HBs but the difference is very small (7 per cent).
7. Temporary workers are defined as workers recruited for a short period (one year or less) in order to fill a big order or to face a high demand.
chapter 04 | The household Businesses and the Informal sector in vietnam | 103
TABLe 4.4.SHARe OF DePeNDeNT wORkeRS wITHOUT A CONTRACT BY INDUSTRY, FORmALITY STATUS AND emPLOYmeNT STATUS (PERCENTAGE)
without a contract written contract Rural Urban Total Rural Urban TotalIndustries Manufacturing & construction 35.0 45.8 39.5 0.6 3.4 1.8
Trade 60.5 57.2 59.2 0.0 1.3 0.5
Service 57.5 56.5 56.9 2.6 3.3 3.0
Informal HBs 52.6 60.3 55.5 0.2 1.5 0.7
Formal HBs 35.8 46.2 42.1 2.3 4.1 3.4
All HBs 47.2 52.6 49.8 0.8 2.9 1.8Wage workers at informal HBs 21.8 37.0 27.5 0.3 2.8 1.2
Wage workers at formal HBs 10.7 30.2 22.7 3.4 5.8 4.9
Note: Dependent workers are workers who are not the owner or the owner’s spouse and partners.
Source: 2014/15 HB&IS survey, VASS-CAF & IRD-DIAL; authors’ calculations.

| The household Businesses and the Informal sector in vietnam | chapter 04104
Hence, working conditions in the informal sector are characterized by the preca-riousness of the job, with no formal guarantee of stability. In particular, written contracts are almost non-existent and recruitment for a temporary period is not negligible. The precariousness is higher in urban areas than in rural ones. Being a wage worker in the HB sector is not associated with greater stability.
2.3. Social security and other benefits
In addition to the privation of a guarantee, workers in the informal sector also face a lack of social protection (see Table 4.6). They are not covered by any kind of social security system as 98 per cent of the informal HBs are not registered with the social se-curity department. Only 26 per cent of the dependent workers at informal HBs benefit from health insurance.8 The percentage of dependent workers who receive a monetary bonus or paid leave is also fairly limited at informal HBs (19 and 28 per cent in rural and urban areas respectively).
8. As mentioned in Chapter 2, health insurance coverage and paid social security coverage are not comparable, especially because of the existence of social assistance, which provides beneficiaries with health insurance without them having to pay into the social security scheme. For this reason, the figure on health insurance in Table 4.6 cannot be compared to the results of Chapter 2, which are based on the LFS.
TABLe 4.5.SHARe OF TemPORARY wORkeRS AmONg DePeNDeNT wORkeRS BY INDUSTRY AND FORmALITY STATUS (PERCENTAGE)
Temporary workers Rural Urban TotalIndustries Manufacturing & construction 11.0 6.5 9.1
Trade 2.6 8.7 5.0
Service 5.9 9.6 8.3
Informal HBs 9.7 8.4 8.8
Formal HBs 4.0 8.1 6.5
All HBs 7.4 8.2 7.8
Note: Dependent workers are workers who are not the owner or the owner’s spouse and partners. Source: 2014/15 HB&IS survey, VASS-CAF & IRD-DIAL; authors’ calculations

chapter 04 | The household Businesses and the Informal sector in vietnam | 105
When comparing informal and formal HBs, it can be seen that formalization does not always result in better working conditions, especially regarding social security. The number of dependent workers who have health insurance is smaller at formal HBs than at informal HBs (22 and 26 per cent respectively). One interpretation of this result is that dependent workers are most likely to be a close relative of the owner in the informal sector (13 per cent are intimate with the owner compared to 9 per cent at formal HBs). As a consequence, the owners of informal HBs are more likely to provide them with social security as their vulnerability is more of a concern for him/her than if they did not have a close relationship. In the same way, wage workers benefit from health insurance about half as often as family helpers (17 per cent of them have a health insurance card compared to 38 per cent of the family helpers). For other conditions such as a contract, bonus or paid leave, workers at formal HBs are substantially better off than those at informal HBs: The share of workers without a contract is lower (42 compared to 55 per cent; see Table 4.4), and the proportion of workers who receive a monetary bonus or paid leave is more than twice as high (50 versus 22 per cent). Being a wage worker increases the likelihood of receiving bonuses or paid leave, but the proportion of wage workers without these benefits is still substantial (half of the wage workers at informal HBs and more than one third at formal HBs).
2.4. Level of intimacy between the owner and workers
As suggested in subsection 2.2, a close personal relationship between employees and their employer may serve as a substitution for a formal agreement. It is therefore impor-tant to examine how the strength of the relationship between workers and the owner of a HB (defined by their level of intimacy according to the owner of the HB) impacts their working conditions, particularly for wage workers.
TABLe 4.6.SOCIAL SeCURITY AND OTHeR BeNeFITS AmONg DePeNDeNT wORkeRS BY FORmALITY STATUS (PERCENTAGE)
Have health insurance Receive monetary bonuses or paid leave Rural Urban Total Rural Urban TotalInformal HBs 25.7 25.7 25.7 18.9 27.6 22.1
Formal HBs 24.5 19.6 21.5 44.6 52.7 49.6
All HBs 25.3 22.4 23.9 27 41.2 33.8
Note: Dependent workers are workers who are not the owner or the owner’s spouse and partners.
Source: 2014/15 HB&IS survey, VASS-CAF & IRD-DIAL; authors’ calculations

| The household Businesses and the Informal sector in vietnam | chapter 04106
Figure 4.5 illustrates that although workers who are close9 to the owner lack a formal agreement, they are more likely to receive other benefits. Indeed, the likelihood of having health insurance is 7 per cent when wage workers are not intimate with the owner compared to 24 per cent when they are very intimate. When intimacy is defined as having a family relationship, only 14 per cent of the non-family workers have a health insurance card compared to 32 per cent of the family workers.
In the same way, the probability of receiving a monetary bonus is 11 points of percen-tage higher when the relationship with the owner is very intimate than when it is not intimate. Finally, 33 per cent of the workers who are very intimate with the owner have no contract, while the share for workers who are not intimate is 24 per cent.
To sum up, these results confirm the intuition that strong ties between a wage worker and the owner of a HB are a substitute for a formal agreement and that this provides the worker with better working conditions.
9. Having a close link with the owner means that workers are intimate or very intimate with the owner of the HB (according to the owner of the HB).
0
5
10
15
20
35
25
40
45
30Not intimate
Intimate
Very intimate
Without a contract
24 26
33
Receive a monetary bonus
3536
41
Health insurance
7
17
24
FIgURe 4.5.LABOUR CONDITIONS BY ReLATIONSHIP wITH THe OwNeRS IN THe INFORmAL SeCTOR (WAGE WORKERS ONLY, PERCENTAGE OF WAGE WORKERS)
Source: 2014/15 HB&IS survey, VASS-CAF & IRD-DIAL; authors’ calculations

chapter 04 | The household Businesses and the Informal sector in vietnam | 107
2.5. working time
As mentioned in Chapter 2, the average number of working hours per week in the informal sector is 45 hours per week. This is lower than the legal Vietnamese working week (48 hours). Moreover, it is also lower than the average at formal HBs (49 hours). Working time differs according to the job status of the worker as well (see Table 4.7). The longest working time is found among the owners of household businesses (50 hours for employers and 49 hours for own-account workers at informal HBs). At informal HBs, workers in all of the remaining job categories work less than 48 hours per week. In particular, family helpers work the least, only 28 hours per week on average. The same differences according to job status were observed at formal HBs, although the average number of hours worked per week is greater at formal HBs than at informal HBs.
The low amount of working time among dependent workers is probably due to the high share of part-time workers. Although almost half of the workers at informal HBs have excessive working hours (more than 48 hours per week; see Chapter 2), the pro-portion of part-time workers, defined as workers working less than 35 hours per week, is very high as well at 44 per cent of the workers at informal HBs and 28 per cent at the formal ones (see Figure 4.6). In detail, part-time workers account for about two thirds of the unpaid family workers and one quarter of the wage workers.
Two reasons may explain the high share of part-time workers in the informal sec-tor. On the one hand, this may reflect the importance of visible underemployment. However, Chapter 2 shows that visible underemployment is not really a concern in that sector. On the other hand, this could be seen as a sign of flexibility offered by the informal sector to their workers: the personal management of time (Cling et al., 2010). This means that the individuals who do not work full time have the opportunity to
TABLe 4.7.wORkINg HOURS PeR week BY jOB STATUS AND FORmALITY STATUS (HOURS)
Average working hours per week (hours) Informal HBs Formal HBs All HBsOwn-account worker 48.6 63.0 51.8
Employer 50.4 61.9 54.7
Spouse 35.3 44.4 38.3
Wage worker 41.6 48.8 45.1
Family helper 28.2 38.2 31.4
Source: 2014/15 HB&IS survey, VASS-CAF & IRD-DIAL; authors’ calculations

| The household Businesses and the Informal sector in vietnam | chapter 04108
conduct other activities. This is demonstrated by the high percentage of workers who have a secondary job. Indeed, half of the part-time workers have a secondary job.
2.6. Low earnings on average but with high disparity
Table 4.8 shows that the level of earning in the informal sector is remarkably low: The average monthly income is 3.4 million VND and the median income is 1.6 million VND. The big gap between the average and median income reflects disparity in the informal sector, especially across job status (see Table 4.9). Level of earning also varies across industries, with the highest average income in the manufacturing and construction sector (around 4.2 million VND).
0%
10%
20%
30%
40%
60%
50%
70%
80%
100%
90%
InformalHBs
FormalHBs
All HBs Wage worker
Familyhelper
Own-accountworker
Employer Spouse
Part-time workers Full-time workers
44
28 39 3424 25
6756
FIgURe 4.6.SHARe OF PART-TIme wORkeRS BY FORmALITY STATUS AND BY jOB STATUS (PERCENTAGE)
Source: 2014/15 HB&IS survey, VASS-CAF & IRD-DIAL; authors’ calculations

chapter 04 | The household Businesses and the Informal sector in vietnam | 109
TABLe 4.8.eARNINgS BY INDUSTRY IN THe INFORmAL SeCTOR (THOUSAND VND)
Average median Average median monthly monthly hourly hourly income income income incomeInformal HBs Manuf. & constr. 4,234 1,660 27.7 12.5
Trade 2,813 1,036 16 5.2
Service 3,155 1,720 24.2 9.9
All informal HBs 3,404 1,570 22.8 8.7
All Formal HBs 4,937 2,500 36 11.3
All HBs 3,889 1,775 27 9.4
Source: 2014/15 HB&IS survey, VASS-CAF & IRD-DIAL; authors’ calculations
10
Figure 4.7 compares the distribution of the remuneration of workers by registration status and by geographical area. It shows that the average income at formal HBs is much larger than that at informal HBs and that the gap in earning between formal and informal HBs is higher in urban areas than in rural ones. Wage workers at formal HBs have a higher income than their counterparts at informal HBs, and this holds true when other characteristics of the business are controlled for, in particular its size, its level of capital and the level of education of the owner, as shown by the estimation of the determinants of earning (see Table 4.A, Model 3 in the appendix). The income of wage workers at formal HBs is 13 per cent higher than the income of wage workers at informal HBs, all other things being equal.
10. We took out 26 outliers of income. These outliers are values which are at least 5 standard deviations above the mean.

| The household Businesses and the Informal sector in vietnam | chapter 04110
Considering the informal sector only and distinguishing income by job status, it appears that employers earn the most on average: 9.5 million VND per month (see Table 4.9).11 Own-account workers rank second at 4 million VND per month. However, it should be noted that the incomes of employers and own-account workers include the remuneration of spouse and family helpers. Therefore, it mostly represents the
11. The income of the employer is actually the profit of the HB. See Chapter 6 for more details.
5 00000
.00005
.0001
.0002Density
.00015
10 000 15 000
Income distribution in rural areas
Informal HBs Formal HBs
Mean income of informal HBs
Mean income of formal HBs
5 00000
.00005
.0001
.0002Density
.00015
10 000 15 000
Income distribution in urban areas
FIgURe 4.7.INCOme DISTRIBUTION AT THe HBS
Source: 2014/15 HB&IS survey, VASS-CAF & IRD-DIAL; authors’ calculations

chapter 04 | The household Businesses and the Informal sector in vietnam | 111
earning of the business and not their personal income. At the bottom of the earning scale are the unpaid family workers (excluding the spouse). They receive no monthly remuneration, but they do receive some annual bonuses. The income of wage workers includes their monthly remuneration and annual bonuses. In fact, monthly remuneration accounts for 97 per cent of the total monthly income of informal HB wage workers. The average income of wage workers is 3.8 million VND. In addition, the variance of income is the lowest for wage workers, as demonstrated by the small gap between the average and the median income for this category of workers. Not surprisingly, wage workers in urban areas earn more than those in rural areas (an average income of 4.2 million compared to 3.6 million respectively).
The legal provisions on minimum wage do not apply to most of the workers in the informal sector. However, minimum wage is a possible instrument to ensure the minimum standard of living for workers. Therefore, comparing the income of wage workers who earn the minimum wage provides an insight into the standard of living of wage workers in the informal sector. The minimum wage differs by region because of differences in the cost of living. Since January 2014, the minimum wage has ranged from 2.7 million VND in region I to 1.9 million VND in region IV.12
The income of wage workers in the informal sector is much higher than the minimum wage in their respective regions. Table 4.10 shows that the ratio of the average income to the minimum wage varies between 1.3 in region II to 1.9 in region IV, while the ratio
12. Circular Number 33/2013/TT-BLDTBXH. Region I includes the urban districts in Hanoi and Ho Chi Minh City and some of their rural districts, and Region II is comprised of the rest of the districts in Hanoi and Ho Chi Minh City, the surrounding cities and some of the main cities in the country. Region III is comprised of the remaining urban districts and some of the rural districts in the main cities. Region IV includes the remaining districts. In our sample, region IV accounts for 35 per cent of the wage workers, region I constitutes 30 per cent, region III 25 per cent and region II only 10 per cent.
TABLe 4.9.eARNINgS BY jOB STATUS AT INFORmAL HBS (THOUSAND VND)
Average monthly income median monthly income Rural Urban Total Rural Urban Total
Own-account worker 4,031 3,885 3,971 2,040 2,600 2,200
Employer 9,711 9,295 9,544 4,070 4,167 4,167
Wage worker 3,589 4,186 3,820 3,150 3,783 3,400
Family helper 29 24 27 0 0 0
Total informal HBs 3,315 3,545 3,404 1,240 1,950 1,570
Source: 2014/15 HB&IS survey, VASS-CAF & IRD-DIAL; authors’ calculations

| The household Businesses and the Informal sector in vietnam | chapter 04112
of the median income to the minimum wage ranges between 1.2 in region II to 1.7 in region III. Both ratios have minor variation across the four regions. Moreover, the small gap between the median and average incomes for each region confirms that dispa-rity of income among wage workers in the informal sector by region is low.Only one quarter of the wage workers at informal HBs earn less than the minimum wage in their respective regions. The proportion varies between 20 per cent in region III to 34 per cent in region II. Three quarters of the workers with an income below the minimum wage are part-time workers and/or have a secondary job.
The income of wage workers depends highly on their socio-demographic characte-ristics and on the characteristics of the HB where they work. We analyse how these characteristics are associated with income using an econometric model (see Table 4.A, Models 1 and 3 in the appendix for informal HBs and all HBs respectively). As expected, wages rise with level of education. In the informal sector, upper secondary school graduates earn 26 per cent more than those with only a primary school edu-cation or less. The number of years of experience also affects income. The greater the seniority, the higher the wage, but at a decreasing pace. There also exists an income gap between male and female workers. A male worker earns 34 per cent more than a female worker in the informal sector, all other things being equal.
It is interesting to note that wage workers who are family members of the owner earn 15 per cent less than those who are not, all other things being equal. Perhaps in addition to remuneration and bonuses, other remuneration mechanisms are at work.
The characteristics of HBs correlate to the income of wage workers as well. Wage workers earn less at informal HBs than at formal ones, once other characteristics are
TABLe 4.10.COmPARISON OF THe INCOme OF wAge wORkeRS IN THe INFORmAL SeCTOR AND THe mINImUm wAge BY RegION (THOUSAND VND)
Region minimum Average median Average median % of wage wage income income income income workers earning to minimum to minimum less than the wage ratio wage ratio minimum wageI 2,700 4,488 4,027 1.7 1.5 23
II 2,400 3,092 3,000 1.3 1.3 34.4
III 2,100 3,467 3,600 1.7 1.7 20.1
IV 1,900 3,606 3,042 1.9 1.6 25.7
Source: 2014/15 HB&IS survey, VASS-CAF & IRD-DIAL; authors’ calculations

chapter 04 | The household Businesses and the Informal sector in vietnam | 113
controlled for. Working at a HB located in an urban area provides a lower income than working at a rural HB. The sector of industry affects income as well. Wage workers in the construction sector are paid the highest among all the industries, followed by the trade sector. Wage workers in the manufacturing sector earn more than those who work at restaurants or accommodation facilities. However, working at a large HB does not always result in a better income in the informal sector. All other things being equal, wages at informal HBs that employ 3-4 workers are higher than wages at infor-mal HBs that hire less than 3 workers, but there is no significant difference in wages at informal HBs with more than 4 workers than at informal HBs with less than 3 workers.
3. Trend in labour conditions in Hanoi and Ho Chi minh City from 2007 to 2014
This section aims to elucidate the evolution of labour conditions and earnings in Hanoi and HCMC over the 2007-2014 period.
After eight years, the informal and HB sectors in Hanoi and HCMC still face a lack of guarantees and protection. Most employees (except the spouse of the owner) have no access to secure work, benefits or welfare protection. Supporting the findings of Chapter 2, working conditions have improved in both cities when health insurance coverage is considered. Workers at informal HBs in Hanoi were totally excluded from health insurance benefits in 2007, but in 2014 nearly 25 per cent of them were covered by health insurance. In HCMC this figure increased from 7 per cent in 2007 to 18 per cent in 2014. The improvement of working conditions is not so clear when access to a contract, bonuses and paid leave are considered. The proportion of workers who receive monetary bonuses or paid leave increased slightly in Hanoi (from 32 to 35 per cent), and it decreased sharply in HCMC in the informal sector (from 40 to 27 per cent) and in Hanoi at the formal HBs. Not having any kind of contract has become more widespread in the informal sector in both cities and at the formal HBs in HCMC.

| The household Businesses and the Informal sector in vietnam | chapter 04114
The income of owners in 2007 and in 2014/15 cannot be compared, because for the 2007 HB&IS survey owners were asked to state their personal income, and for the 2014/15 HB&IS survey income reflects the earning of the business as it includes the remuneration of the spouse and family helpers. Thus, this part only analyses the fluc-tuation of the earnings of wage orkers in Hanoi and HCMC from 2007 to 2014. As mentioned in Chapter 2, the real average income of wage workers at informal HBs in Vietnam increased by 61 per cent over this period. According to Table 4.12, this figure increased much more significantly in Hanoi and HCMC. In Hanoi, the average monthly income increased enormously (+91 per cent in real terms). The evolution of the me-dian income was also positive (+46 per cent). In HCMC, there was also an increase in the average income (+ 79 per cent) and the median income (+ 64 per cent)
TABLe 4.12.eVOLUTION OF THe AVeRAge AND meDIAN ReAL INCOme BY INDUSTRY 2007-2014 (PERCENTAGE, ONLY WAGE WORKERS)
Source: 2007 & 2014/15 HB&IS surveys, VASS-CAF & IRD-DIAL; authors’ calculations. Incomes in 2014/15 are adjusted for inflation.
Hanoi HCmC monthly monthly monthly monthly average median average medianManuf.& constr. 87.0 68.5 87.6 115.9
Trade -23.0 -61.5 19.7 54.6
Service 154.3 155.9 48.2 67.1Total Total informal HBs 90.8 46.2 79.2 63.7
Source: 2014/15 HB&IS survey, VASS-CAF & IRD-DIAL; authors’ calculations.
TABLe 4.11.LABOUR CONDITIONS OF DePeNDeNT wORkeRS IN THe INFORmAL SeCTOR (PERCENTAGE)
without Have health Receive monetary a contract insurance bonuses or paid leave 2007 2014 2007 2014 2007 2014Hanoi Informal HBs 42.3 47.3 0 24.6 31.8 35.2
Formal HBs 47.9 32.9 0.9 17 55.1 38.5Total HBs 44.7 41.4 0.4 21.5 41.7 36.5
HCmC Informal HBs 49.9 73.7 7 17.8 40.2 26.7
Formal HBs 26.4 52.3 2.6 9.9 59.6 57.1Total HBs 36.6 63.3 4.5 14 51.2 41.5

chapter 04 | The household Businesses and the Informal sector in vietnam | 115
Considered by industry, the average and median real monthly incomes have increased except in the trade sector in Hanoi. The most significant growth rate is in the service sector, where the increase was about 155 per cent for both the average income and the median income. There was also a big increase in the manufacturing and construction sector (an 87 and a 68 per cent increase for the average and median incomes respecti-vely). Surprisingly, the median income of workers in the trade sector in Hanoi declined by 61 per cent. More competition in this sector may be the reason (see Chapters 6 and 11).
In HCMC the earnings rose in all of the sectors. The highest increase was in the ma-nufacturing and construction sector (the average income increased by 88 per cent). The median income increased considerably: by 116 per cent. Contrary to Hanoi, the average and median incomes for wage workers in the trade sector increased greatly (by 20 per cent and 55 per cent respectively).

| The household Businesses and the Informal sector in vietnam | chapter 04116
CONClUSION
This chapter presents some features of the profiles and working conditions of workers in the household business and informal sectors. It confirms the precariousness of the workers in those sectors, and it provides some new insights as well into the workers and their working conditions.
First, the informal sector is not mainly composed of women and migrants, not even in urban areas. It is worth highlighting this specificity of the informal sector in Vietnam as many stakeholders target their support exclusively to these two groups. Migrants constitute 3 per cent of the workers at HBs. The proportion of women is obviously higher than that, but it is still lower than the proportion of men. Women constitute 46 per cent of the workers in the informal sector. However, their status of employment differs from that of men. They are more likely to be own-account workers. This sta-tus is usually associated with more vulnerability. On the other hand, it provides them with more flexibility to fulfil family obligations. In addition, they earn less than their male counterparts who have the same level of education or seniority. Finally, they are concentrated in the sectors of activity which face the highest competition (e.g. the retail trade sector) and thus provide an income that is lower than in other sectors. Thus, although women are not overrepresented in the informal sector, they generally conduct activities that are associated with higher vulnerability.
Second, this chapter highlights another specificity of the HB sector: the key role of family helpers. They have a high level of seniority, reflecting their permanent status, which is combined with the duration of the HB. However, wage workers are recrui-ted for short periods of time and are used as flexible labour to adapt to the needs of the business. Family labour may constitute important human capital for a business as well. Indeed, family helpers excluding the spouse are much more educated than other workers, providing opportunities for HBs to utilise new skills and constituting a potential source of innovation in a general context where the level of formal educa-tion of the workers is low on average, especially at informal HBs.
In addition, a close relationship between the HB owner and an employee who be-longs to the same family may provide the worker with more stability than being a wage worker. This chapter reports the working conditions at HBs and in the informal sector that are still poor despite the huge economic growth experienced by Viet-nam. Formal guarantees of work and social protection are almost non-existent. Most workers have no contract and are not covered by any kind of social security system

chapter 04 | The household Businesses and the Informal sector in vietnam | 117
through the HB at which they work. When they do benefit from health insurance, it is through other channels. Written contracts are almost non-existent. Formalization does not provide much better working conditions, except for earnings. Besides the poor working conditions, precarious work arrangements or non-standard forms of employment13 are a frequent phenomenon, with high shares of part-time and tem-porary workers. However, the lack of formal guarantees is partially compensated by strong ties between the owner of the HB and the employee. As a result, family wor-kers are more likely to benefit from elements associated with decent work such as health insurance or increased stability. This goes against the idea developed by the ILO, according to which family workers and own-account workers constitute vulne-rable employment while wage workers and employers are more likely to have decent working conditions. This may hold true for private enterprises, but not the HB sector in Vietnam. Although the earnings of the wage workers are higher than the earnings of other employees (and they are rarely lower than the minimum wage), they benefit from health insurance about half as often as family workers, one out of four do not have any kind of contract, more than a third do not receive bonuses or paid leave, and their duration in the business is half that of family workers.
Finally, this chapter contributes to filling in the knowledge gap about earning in the HB and informal sectors. The level of income in the informal sector is low: The average monthly income is 3.4 million VND. However, this low level of income hides huge disparities as half of the workers in the informal sector earn 1.6 million per month or less. Incomes highly differ according to job status and sector of activity. The highest incomes are in the manufacturing and construction sector and among employers. Most wage workers earn more than the minimum wage, and there was remarkable improvement in Hanoi and Ho Chi Minh City between 2007 and 2014. However, this improvement should not hide the still unsatisfactory working conditions in the HB sector, which calls for supportive policies, in particular towards women and wage workers who do not benefit from solidarity mechanisms as family workers do.
13. “Non-standard forms of employment” (NSFE) refers to jobs that fall outside the realm of standard work arrangements and includes temporary or fixed-term contracts, temporary agency or dispatched work, and dependent self-employment and part-time work, including marginal part-time work, which is characterized by short, variable and often unpredictable hours.
Source: ILO (http://www.ilo.org/global/topics/employment-security/non-standard-employment/lang--en/index.htm)

| The household Businesses and the Informal sector in vietnam | chapter 04118
appENDIx – DETERmINaNTS Of wagE wORkER INCOmE
TABLe 4.A eSTImATION OF THe DeTeRmINANTS OF THe LOgARITHm OF INDIVIDUAL INCOmeS OF wAge wORkeRS BY mCO14
Informal HBs Formal HBs All HBs (model 1) (model 2) (model 3)
education15
Lower secondary 0.190** -0.0815 0.0305 (0.0791) (0.0580) (0.0490)
Upper secondary or higher 0.232** -0.00626 0.103** (0.0946) (0.0556) (0.0519)
experience 0.0725*** 0.0369*** 0.0495*** (0.0240) (0.0135) (0.0129)
experience squared -0.00265* -0.000985 -0.00159** (0.00142) (0.000758) (0.000745)
Female -0.420*** -0.407*** -0.437*** (0.0789) (0.0534) (0.0471)
Urban 0.0893 -0.178*** -0.0781* (0.0708) (0.0478) (0.0419)
Family -0.162** -0.196*** -0.176*** (0.0680) (0.0501) (0.0424)
Industries16
Construction 0.594*** 0.188 0.305*** (0.104) (0.423) (0.0713)
Restaurant & accommodation 0.0510 -0.309*** -0.181** (0.157) (0.0713) (0.0722)
Other services 0.235** -0.104 -0.00557 (0.113) (0.0673) (0.0625)
Trade 0.369*** 0.00688 0.121** (0.109) (0.0645) (0.0582)
Number of workers17 3-4 workers 0.267*** 0.112** 0.192*** (0.0889) (0.0543) (0.0501)
More than 4 workers -0.114 0.190*** 0.103* (0.0965) (0.0617) (0.0554)
Capital18 0.000665 -0.0166* -0.0111
(0.0143) (0.00937) (0.00838)
Formal HBs 0.122*** (0.0462)
14. Our sample has 1,270 wage workers age 15 or older. Due to a large number of missing values for education and age variables, there are 937 observations left.
15. Level of education dummies (reference category: primary education or less).16. Sector activity dummies (reference sector: manufacturing).17. Number of workers in household business dummies (reference category: less than 3 workers).18. Natural logarithm of HB’s assets without land and premises.

chapter 04 | The household Businesses and the Informal sector in vietnam | 119
Constant 2.360*** 3.221*** 2.819*** (0.176) (0.115) (0.105)
N 440 497 937adj. R2 0.257 0.282 0.236
Standard errors in parentheses. * p < 0.10, ** p < 0.05, *** p < 0.01

| The household Businesses and the Informal sector in vietnam120

chapter 05 | The household Businesses and the Informal sector in vietnam | 121
conTrIBuTIon of hBs and The Informal secTor To The economy
Xavier oudin
This chapter focuses on a macroeconomic view of HBs and on the informal sector in particular. The 2014/15 HB&IS survey provides reliable information on the main economic activity indicators of HBs. As this survey is representative at the national level, aggregates can be computed for the whole country by economic sector and by urban and rural area. In particular, we are able to compute the contribution of the non-farm household business sector as a whole, and of the informal sector in particu-lar, to the national economy.
The first section presents the main aggregates of the informal and household busi-nesses sectors in the framework of national accounts at the national level, and it shows the contribution of the HB sector to the gross domestic product (GDP). The informal sector constitutes 12 per cent of the GDP. The contribution of all the HBs amounts to 23 per cent of the GDP. The bulk of the HB value added is the profit made by the businesses, as payroll and taxes do not account for a high amount. Informal taxation is marginal as well. The second section deals with labour productivity in the HB sector, which is an important indicator of the performance of this sector. The productivity of the informal sector is very low, especially due to a labour surplus. In contrast, the productivity of the formal HBs is closer to that of the private enterprise sector. The third section addresses the seasonal variations of production and sales, which is an important feature of this sector. The fourth section looks at the linkages between the informal sector and household businesses with the rest of the economy. The HB sec-tor has weak linkages with the rest of the economy when measured by upward and downward transactions. Formal HBs are slightly better integrated and act as a buffer between formal enterprises in the public and private sectors and the informal sector.
05

| The household Businesses and the Informal sector in vietnam | chapter 05122
1.HOUSEHOlD BUSINESSES aND THE INfORmal SECTOR IN THE NaTIONal ECONOmy
The level of operation of HBs is low on average, although a wide range of situations exists. Nevertheless, HBs supply jobs and generate wealth and income for more than one quarter of the population. Despite low productivity on average and the low level of income generated, their participation in the economy is far from being marginal.
1.1. Calculation of the contribution of household businesses and the informal sector to the gDP
The methodology used in the 2014/15 HB&IS survey allows building simplified accounts for each household business. Since most of them do not do bookkeeping and are not able to provide clear accounts of their activity, we had to reconstruct their accounts using a set of questions. Moreover, there was some reluctance among the respondents to give a fair report of their receipts, income and other accounting figures for their business. Some survey techniques were used to overcome this obstacle as much as possible.
We used the 1-2-3 survey methodology, which is currently the best way to get a fair estimate of the level of operation of HBs (Asian Development Bank 2011, ILO 2012). It allows for a more in-depth economic analysis of the informal sector (and the entire HB sector) and its integration into the national economy, which is something that no other survey can do. Some aggregates asked in one general question in other surveys are here the synthesis of a detailed investigation. For example, the payroll is the sum of wages, bonuses, insurance and other expenditures for each employee. Not only do we get information about workers, as analysed in Chapter 4, but also a much more accurate estimate of the payroll. It is the same for the number of hours worked as detailed by the workers. At the macro level, the calculation of productivity per hour is much more relevant with this detailed account of the hours worked.
Questions about income, profit and other economic aggregates are asked in different ways in the questionnaire. Production and the purchase of raw materials or merchandise are asked item by item except when it is not relevant. The period of reference is chosen by the respondent to fit better with the rhythm of his or her activity. When different ag-gregates appear to be somewhat incoherent, figures are recalculated, generally based on the purchase of merchandise or raw materials, which is deemed to be more reliable.

chapter 05 | The household Businesses and the Informal sector in vietnam | 123
We reconstruct the accounts of the HBs following a structure based on the natio-nal accounts system. We first calculate the value added of the businesses. The value added is the creation of net wealth by the enterprises. It shows the extent to which labour and capital contribute to the creation of new wealth. At the enterprise level, it measures how efficiently inputs (raw materials, labour and capital) are used to produce wealth.
The value added is measured by subtracting the non-labour costs of inputs from the amount of sales. For the trade sector we calculate the margin that is the difference between sales and the purchase of merchandise. We determine the value added by subtracting other operation costs, e.g. electricity and the transport of merchandise. For manufacturing and service businesses, the value added is calculated by subtrac-ting the purchase of raw materials and other costs from the total production of goods and services. We then see how the value added is decomposed in the payroll, taxes and profit of the business.
The 2014/15 HB&IS survey thus supplies us with incomparable information both about the weight at the macro level and about the structure and performance of the HBs (see Chapter 6). Analyses can be performed on a macroeconomic as well as a microeconomic scale.
We compare the results with the figures of the 2014 GDP published by the GSO (GSO, 2015). However, in the distribution of the GDP by institutional sector, the household business sector encompasses all activities run by individuals and households, inclu-ding agriculture, fisheries and forestry. It accounts for 1,241 trillion VND or 31.5 per cent of the GDP. To estimate the non-farm household share of the GDP, we have to deduct agricultural production by households. However, this figure is not known. We only have the total value added of the agriculture sector, which was 697 trillion VND in 2014. We estimate here that 92 per cent of the value added in the agriculture sector (641 trillion VND) comes from households.1
Having estimated the agricultural production of households, we can then calculate the contribution of non-farm household businesses to the GDP, which is 1,241 – 641 = 600 trillion VND. Although these figures should be considered as estimates made by the authors, they are consistent with other figures produced by the GSO. This figure corresponds to 15.2 per cent of the GDP of Vietnam.
1. Calculated by the authors using the figures of the 2012 VHLSS survey.

| The household Businesses and the Informal sector in vietnam | chapter 05124
1.2. A high contribution made by household businesses and the informal sector to the gDP
The contribution of the informal sector to the national economy is the sum of the value added of the HBs in this sector. The annualised value added of the informal sector amounts to 472 trillion VND (see Table 5.1). The informal sector contributes 12 per cent to the GDP of Vietnam. This contribution increases to 15 per cent when considering only the non-farm GDP. As the definition of the informal sector excludes activities in the agriculture sector, it is more meaningful to relate its contribution to the non-farm GDP.
The contribution of all the HBs, i.e. both the formal and the informal HBs, amounts to 23 per cent of the entire actual GDP and 28 per cent of the non-farm GDP. Thus, the informal sector and the formal HBs each contribute around half of this amount.
The estimate of the contributions made by the informal sector and HBs to the natio-nal GDP given here is probably the most relevant calculated so far. Since the 2014/15 HB&IS survey is the first national survey on HBs, its coverage is wider than other surveys, and it was conducted with a dedicated methodology to calculate the value added (see Chapter 1). The total value added of the HB sector is 891 trillion VND (42 billion USD), with 472 trillion VND generated by informal HBs. The GSO does not produce separate GDP figures for the formal and informal HB sectors; it provides figures for each institutional sector only. Thus, the HB&IS estimate led to a revaluation of the contribution of the HBs to the GDP. We found that the contribution to the GDP made
TABLe 5.1.TOTAL VALUe ADDeD OF THe HBS AND THe INFORmAL SeCTOR AND THeIR SHARe OF THe gDP
gDP (billion VND) Contribution of HB value added to actual gDP (%) Vietnam (a) All HBs (b) Informal All HBs Informal HBs (b) HBsAgriculture 726,330 - - - -
Manufacturing 1,475,361 334,705 181,261 22.7 12.3
Trade 550,019 345,144 164,756 62.8 30.0
Service 1,186,146 210,733 125,618 17.8 10.6
Total non-farm 3,211,526 890,582 471,635 27.7 14.7Total (incl. agriculture) 3,937,856 890,582 471,635 22.6 12.0
Source: (a) GSO national GDP figures for 2014, (https://www.gso.gov.vn/default_en.aspx?tabid=775) preliminary figures; (b) 2014/15 HB&IS survey, VASS-CAF & IRD-DIAL; authors’ calculations.

chapter 05 | The household Businesses and the Informal sector in vietnam | 125
by HBs was underestimated by 291 trillion VND. The new estimate is 891 trillion VND, which is 48.5 per cent higher than the estimate based on the GSO figures (600 trillion VND). This in turn led to a revaluation of the total GDP, and the new estimate is 7.4 per cent higher than the previous one.
This new estimate of the GDP corresponds to the value added of the missing workers in the GSO’s calculation of the GDP. The contribution of the HBs to the GDP, which comes from the Non-farm Individual Business Establishment (NFIDBE) survey, is based on a figure of 7.9 million workers in this sector, while there are 15.7 million workers according to the Labour Force Survey (LFS). Thus, the contribution of 7.8 million wor-kers in the labour force is not taken into account in the current calculation of the GDP. The NFIDBE covers all the formal HBs and a share of the informal HBs, but it leaves out an important number of workers. The additional value added calculated from the 2014/15 HB&IS survey is the contribution of these workers to the GDP. We will see below that this contribution is a low estimate, but at the same time the results of the 2014/15 HB&IS survey are consistent with those from the NFIDBE survey for the formal HBs and the upper part of the informal sector.
This should be considered as a minimum estimate. As seen in Chapter 1, the GSO’s NFIDBE survey leaves out a great number of the self-employed and small informal HBs, and it is not consistent with the employment figures of the LFS. The 2014/15 HB&IS survey corrects this anomaly by calculating the contribution to the GDP of all workers based on the LFS figures. Despite the revaluation, the contribution per worker is still quite low (see section 2 below), and this is why we think that the total value added of the HB sector calculated from the 2014/15 HB&IS survey and based on the LFS figures of employment is not overestimated.
The weight of the informal sector and the formal HBs in the economy differs among economic sectors. The HBs represent 63 per cent of the GDP in the trade sector and 23 per cent in the manufacturing and construction sector (see Table 5.1 and Figure 5.1). In the service sector (which includes public administration), the share of HBs is smaller (18 per cent). The contribution made by informal HBs to the GDP is 12 per cent in the manufacturing and construction sector, 30 per cent in the trade sector and only 11 per cent in the service sector.
It is noteworthy that HBs are the main operators of commercial activities in Vietnam. Most HBs, and more specifically informal HBs, sell to the final consumers (see section 3 below), who seem to favour local retailers rather than supermarkets. Many factors

| The household Businesses and the Informal sector in vietnam | chapter 05126
may explain this structure of commerce. In addition to consumer preference, there are technological factors such as an insufficiently developed cold chain, a lack of ade-quate transportation and a weak organisation of wholesale and large commercial networks. However, the domination of HBs in the trade sector may hide a deteriora-tion of business operations due to a more fragmented structure of commerce.
The value added in the informal sector in rural areas is higher than in urban areas. 62 per cent of the total value added in the informal sector is generated in rural areas (see Figure 5.2). This is similar to the share of rural labour in the informal sector (see Chapter 3), showing that the average productivity of labour is similar in rural and urban areas across economic sectors.
Formal sector (excl. HBs) Formal HBs Informal HBs
77%
10%
82%
7%11%12%
33%
30%
37%
Manufacturing Trade Service
FIgURe 5.1.SHARe OF HBS IN THe NON-FARm gDP BY eCONOmIC SeCTOR
Source: 2014/15 HB&IS survey, VASS-CAF & IRD-DIAL; authors’ calculations

While the informal sector is predominantly rural, formal HBs produce more in urban areas. 63 per cent of the value added of formal HBs is generated in urban areas, and as much as 79 per cent is generated in the service sector. One reason for this gap between informal and formal HBs is probably the fact that registration is more com-mon in urban areas due to the proximity of fiscal or district authorities and perhaps better enforcement of the regulations on business registration.
The highest decile of HBs in terms of value added (the 10 per cent with the highest value added) generates 60 per cent of the total value added of all the household businesses. On the other hand, the lowest 5 deciles of HBs, which are very small (mainly the self- employed), generates less than 11 per cent of the value added of the HBs. Considering only the informal HBs, the largest 10 per cent in terms of value added generate 54 per cent of the informal sector’s contribution to the national GDP, while the lowest 5 deciles only generate 12 per cent of this contribution. The economic sector where the contri-bution made by large HBs is the highest is the construction and manufacturing sector, while in the service sector the share of large HBs is less remarkable. This shows that the dynamism of the sector is the result of the activities of a small number of entrepreneurs, and the bulk of the informal HBs operate on a very modest scale (see Chapter 6).
chapter 05 | The household Businesses and the Informal sector in vietnam | 127
0
10
20
30
40
70
50
80
60
Manuf. &constr.
Trade Service All sectors
Informal HBs
Formal HBs
FIgURe 5.2.SHARe OF VALUe ADDeD PRODUCeD IN RURAL AReAS BY INFORmAL AND FORmAL HBS AND BY eCONOmIC SeCTOR (PERCENTAGE)
Read as follows: 65 per cent of the total value added for informal HBs in the manufacturing sector is generated in rural areas, and this percentage is 41 per cent for formal HBs.
Source: 2014/15 HB&IS survey, VASS-CAF & IRD-DIAL; authors’ calculations.

| The household Businesses and the Informal sector in vietnam | chapter 05128
It is also possible to form an estimate of the participation of the informal sector and HBs in the gross fixed capital formation. However, these figures are less reliable for rea-sons explained in the next chapter. Investment made by HBs is defined as expenses for equipment, furniture and premises that may not always be included in the gross fixed capital formation according to the definition used in the national accounts, so the figures given here are rough estimates. They highlight the fact that this sector not only contributes to the wealth created, but also to capital accumulation and to the creation of wealth in the future through investment.
In 2014, the gross fixed capital formation in Vietnam was 938.4 trillion VND (GSO, 2015). Informal HBs and formal HBs contributed 52.5 and 35.4 trillion VND (or 5.6 per cent and 3.8 per cent) respectively. This is less than the contribution of HBs to the GDP. The investment rate (gross fixed capital formation/value added) is thus lower for HBs than for the rest of the economy. The rate of investment at the national level is 11 per cent for informal HBs and 7.5 per cent for formal ones, while the average for the whole economy is 23 per cent.
1.3. Breakdown of the value added of HBs by industry
HBs and the informal sector are important players in all non-farm sectors of the eco-nomy. There is no major industry where they are not present.
The manufacturing and construction sector provides 40 per cent of the value added in the informal sector, while the various services (transportation, restaurants and other services) produce 31 per cent (see Table 5.2). The rest of the value added, 29 per cent, is contributed by the trade sector. The structure of the value added of formal HBs is quite different. The share contributed by the manufacturing and the trade sectors is higher than that of the informal sector. In contrast, formal HBs are nearly non-exis-tent in the construction and transportation industries. These two industries are almost exclusively comprised of informal HBs, as they can operate without registering their business when they operate on a small scale.2
2. We do not take into account here the bulk of the “wage workers” in the construction sector, who in reality are self-employed workers who work on contract directly for households and were considered in the LFS to be part of the informal sector (see Chapters 1 and 2). Their contribution to the GDP is not counted as part of the informal sector, but most likely as capital formation (in the construction sector) or consumption by HBs.

chapter 05 | The household Businesses and the Informal sector in vietnam | 129
The distribution of informal and formal HBs, as measured by their value added, is quite different in rural and urban areas. Service HBs are relatively more developed in urban areas (due to the higher number of restaurants in cities), where they account for 38 per cent of the value added of all HBs, compared to 27 per cent in rural areas. In contrast, the contribution made by the manufacturing and construction sector is relatively more significant in rural areas (44 per cent of the value added generated by all the HBs in rural areas compared to 34 per cent generated by those in urban areas).
1.4. Decomposition of the value added
The value added is divided into three components: payment made to workers (not including the owner and family members), taxes due to the state, and profit made by the owner. The decomposition of the value added tells us how wealth created by the informal sector is distributed among these three components (see Table 5.3).
The bulk of the value added is constituted of profit made by the owner. Profit accounts for 86 per cent of the value added for all of the HBs on average, and the figures are very similar for formal and informal HBs. As most of the HBs have no hired workers, the owner’s share of the profit is logically high. Profit here is the gross operation surplus, and it corresponds to the remuneration of the owner and eventually family members engaged in the business, as well as the remuneration of the capital of the business.
TABLe 5.2.DISTRIBUTION OF VALUe ADDeD AND emPLOYmeNT BY INDUSTRY IN THe HB SeCTOR (PERCENTAGE)
Informal HBs Formal HBs Value added employment Value added employment
Manufacturing 26.5 28.8 36.4 28
Construction 13.2 7.2 0 0
Trade 28.8 29.8 37.5 43.2
Transport 11.6 7.1 1.3 1.2
Rest. & Accom. 10.8 15.8 14.1 15.6
Other service 9.1 11.3 10.8 11.9
Total 100 100 100 100
Source: 2014/15 HB&IS survey, VASS-CAF & IRD-DIAL; authors’ calculations.

| The household Businesses and the Informal sector in vietnam | chapter 05130
The share of the payroll is also very similar for both formal and informal HBs: around 13 per cent of the value added. This is more significant in the manufacturing and construction sector, where there are more wage workers, both at informal and formal HBs (see Chapter 3).
These average figures may be misleading as 84 per cent of the HBs (89 per cent of the informal HBs and 71 per cent of the formal HBs) have no hired workers. For those that hire workers, the breakdown of the value added is very different (see Table 5.4). It should be noted that HBs (informal as well as formal ones) that have wage workers have on average a value added that is eight times higher than those that do not have wage workers. They are also more profitable and earn a higher profit per worker. Hiring a wage worker is an economically rational decision that goes along with the growth of a business, but this is not true for non-wage workers.
TABLe 5.3.COmPONeNTS OF THe VALUe ADDeD IN THe HB SeCTOR BY eCONOmIC SeCTOR(PERCENTAGE)
Informal HBs Formal HBs Payroll Tax Profit VA Payroll Tax Profit
Manuf. & constr. 21.5 0.1 78.4 100 19.3 1.0 79.7
Trade 7.1 1.0 91.8 100 8.0 2.3 89.7
Service 6.4 0.7 92.9 100 14.3 2.4 83.3
Total 12.3 0.6 87.1 100 13.6 1.9 84.5
Source: 2014/15 HB&IS survey, VASS-CAF & IRD-DIAL; authors’ calculations.
TABLe 5.4.COmPONeNTS OF THe VALUe ADDeD OF INFORmAL AND FORmAL HBS wITH wAge wORkeRS (PERCENTAGE)
Informal HBs Total Formal HBs Payroll Tax Profit VA Payroll Tax Profit
Manuf. & constr. 36.4 0.1 63.5 100 21.9 0.8 77.4
Trade 21.5 1.3 77.1 100 18.3 1.6 80.2
Service 25.1 0.4 74.5 100 25.6 1.6 72.8
Total 25.1 0.4 74.5 100 21.7 1.2 77.2
Source: HB&IS survey 2014/15, VASS-CAF & IRD-DIAL; authors’ calculations

chapter 05 | The household Businesses and the Informal sector in vietnam | 131
1.5. Taxation
Taxes, which are the share of the value added going to the state, are very low in the informal sector, from 0.1 per cent of the value added in the manufacturing sector to 1 per cent in the trade sector among informal HBs. Although this share is more than twice as high among formal household businesses, it remains very small: 1.9 per cent on average (see Table 5.3). The share of taxes in the value added is higher in urban areas (only for formal HBs) than in rural areas, at 2.2 and 1.4 per cent of the value added respectively.
Only 13 per cent of the informal HBs pay some taxes to the state (see Table 5.5). Among those that pay, the median value of the taxes is 0.3 million VND per year. The situation is quite different among formal HBs. Most of them (84 per cent) pay taxes, and the median amount paid is 2.1 million VND per year. For the taxpayers, the share of taxes in the value added is still low: 2 per cent of the value added on average. Only 2 per cent of the informal HBs and 13 per cent of the formal ones pay at least 10 per cent of their value added in taxes.
Household businesses have to pay several types of tax: a business tax, a personal income tax and several other types of taxes. The value added tax (VAT) is not payable by HBs as they do not utilise a legal accounting system, but they pay it on goods that they purchase.3 These taxes are lump sum payments determined by the tax or district authorities according to the sector of activity, the type of business and the estimated income. Since most of the HBs, even formal ones, do not keep accounts, the adminis-tration cannot calculate taxes on a real basis.
The payment of at least one type of tax can be considered as an indicator of com-pliance with, or at least adherence to, administrative regulations or as an indicator of the ability of the tax department to enforce the tax regulations. Table 5.5 shows the proportion of HBs that pay at least one type of tax (the business tax, the income tax or other taxes) by registration status.
3. According to legal regulations, a household business has to pay three different types of tax: a license/business tax (an annual fixed tax based on the monthly revenue which the HB owner reported to authorities, stipulated in Circular 96/2012/TT-BTC dated 24/10/2012 from the Ministry of Finance) and a personal income tax (stipulated in Decision 16334/CT-QD dated 30/12/2008 from the Ministry of Finance). Other taxes are related to specific activities (excises and licenses).

Paying at least one tax is the main criterion that differentiates formal from informal businesses. Since they register their business, formal HBs are most likely to pay the business tax and some of the other taxes, but informal HBs are unlikely to do so. Those which act otherwise, i.e. formal businesses that do not pay any tax (10 per cent of them) and informal HBs that pay some tax (10 per cent of them) appear to be special cases: formal businesses that have not yet made their first tax payment and informal businesses that have to pay some specific tax even though they have not registered their business.
1.6. Informal payment in the informal sector
If HBs do not pay much in taxes, do they suffer from informal taxation in the form of bribes or other forms of corruption? It could be hypothesized that informal HBs that are not subject to taxation or pay very little in taxes are in fact obliged to pay bribes to officials or to the police at different levels. The literature on the informal sector has of-ten emphasized this aspect of the informal sector. Bribery can occur at different levels: when starting the business, for example, by paying extra fees to obtain authorization to run the business or to replace taxes that are (sometimes) due.
Experience of corruption is often measured in two steps. First, people are asked if they have had any contact with different administrative bodies in the past twelve months. Second, they are asked if they have had to deal with an administrative body and, as a result, were the victim of an act of corruption, e.g. having to make a gift, having to pay fine without receiving a receipt, or any other form of bribery. The occurrence of corruption is measured by comparing the number of people who reported an instance of corruption to the number of those who had contact with the incriminated administration.
| The household Businesses and the Informal sector in vietnam | chapter 05132
TABLe 5.5.PAYmeNT OF DIFFeReNT TAXeS (PERCENTAGE OF HBS THAT PAY EACH TYPE OF TAX)
Pays at least Business tax Income tax Other taxes one type of taxInformal HBs 13.4 7.3 1.5 6.6
Formal HBs 84.1 80.2 43.0 17.0
All HBs 32.0 26.5 12.4 9.4
Source: HB&IS 2014, VASS-CAF & IRD-DIAL; authors’ calculations

Only 27 per cent of the HBs owners stated that they have dealt with the People’s Committee, the police, market administrators or residential authorities in the past twelve months. Formal HB owners have contact with such people more often than informal HB owners. More than half of the formal HB owners and only 18 per cent of the informal HB owners had contact with at least one of these administrative bodies. 6 per cent of the formal HB owners reported that they had experienced corruption.
These are the consolidated results for five types of administration. The frequency of contact varies, from 5 per cent for those who had contact with the police to 9 per cent for those who had contact with market administrators. The question only concerns contact related to business, not private matters. Incidents of corruption occurred more often with the police (14 per cent of the encounters with the police ended with the HB owner paying a fine or offering a gift without getting a receipt), but the incidence of corruption is negligible for encounters with the People’s Committee (see Figure 5.3).
chapter 05 | The household Businesses and the Informal sector in vietnam | 133
0
5
10
15
25
20
30
People’sCommitee
Police Residentialrepresentative
Marketadmin.
Other All
% had contact % paid a bribe
FIgURe 5.3.SHARe OF HBS THAT HAD CONTACT wITH THe DIFFeReNT ADmINISTRATIVe BODIeS AND THe SHARe OF HBS THAT HAD TO PAY A BRIBe (PERCENTAGE)*
(*) % that had contact: the number of HBs that had contact with different administrative bodies divided by the total number of HBs; % that paid a bribe: the number of HBs that had to pay a fine or offer a gift without getting a receipt divided by the number that had contact with the administrative body.
Source: 2014/15 HB&IS, VASS-CAF & IRD-DIAL; authors’ calculations

| The household Businesses and the Informal sector in vietnam | chapter 05134
While previous questions concerned taxes and bribes, a similar question with a broa-der scope was asked about informal payments, including all kinds of contact with officials from any administrative body.4 4.2 per cent of the HBs (3.5 per cent of the informal HBs and 6.2 per cent of the formal ones) have experienced some form of corruption when dealing with the various authorities. When relating corruption prac-tices only to HBs that have had contact with an administrative body (69 per cent of the informal and 81 per cent of the formal HBs), the proportion of those that were victims of some form of corruption increases to 5 per cent of the informal HBs and 7.3 per cent of the formal HBs.
No matter how the question is phrased, household businesses do not suffer much from corruption. Those that have experienced corruption paid rather small amounts (less than 2 per cent of the value added) that are comparable to the amount of taxes owed. On the macroeconomic scale, “informal taxes” account for less than 0.1 per cent of the GDP produced by HBs.
The largest HBs experience corruption most often.5 Ten per cent of the HBs with a monthly value added of over 10 million VND stated that they had experienced corruption in the past twelve months, while the average for all HBs is 4 per cent. Formal HBs experience corruption more often than informal ones, urban HBs experience corruption more often than rural ones, and HBs in the trade sector experience corruption more often than HBs in other sectors. Thus, informal HBs, and in particular petty traders (who often operate in a grey zone between legality and illegality), are not particularly exposed to corruption. Some street vendors may be hassled by the police, but this is not representative of the bulk of the informal sector. On the contrary, informal HBs experience corruption less often than formal HBs.
A recent study of corruption in the HB sector in Vietnam (Giang et al., 2016) found relatively high occurrences of corruption (collusion with tax officers or extortion) in the HB sector. However, this study focused on the upper segment of the HBs. All are formal and only 20 per cent of them have a revenue of less than 20 million VND per
4. The question was: It is said that establishments are sometimes required to make gifts or informal payments to public officials to obtain authorization to do things like occupy a sidewalk or to “get things done” with regard to licenses, regulations, conflict resolution, and other types of services. In the frame of your activity, did you or anyone in your business have to make an informal payment to a government official or to an intermediary in the past year? Consider all possibilities, from paying a small bribe in order to occupy a sidewalk to paying a commission to facilitate contracts.
5. This is consistent with the fact that some studies report a higher incidence of corruption among larger enterprises (see Giang et al., 2016).

chapter 05 | The household Businesses and the Informal sector in vietnam | 135
month (while in the 2014/15 HB&IS survey, 80 per cent of the formal HBs made a profit of less than 20 million VND per month). This shows that corruption is most likely to occur in lieu of excise taxes that are specific taxes for a trade HB such as a pharmacy or a karaoke parlour. Informal payments in lieu of registration fees and for business taxes are rare.
Corruption is essentially an urban phenomenon: 10 per cent of the urban HBs and only 3.5 per cent of the rural ones stated that they had experienced corruption.
Corruption is neither a major problem in the informal sector nor is it rampant in the HB sector in Vietnam.6 The shortfall in state revenue that is due to corruption is pro-bably very low, and it is a low percentage of the taxes collected in the HB sector, which is also very low.
It is thus true to say that the informal sector does not contribute much to the state revenue, including at the local level. This is also true for “informal taxes,” which are not important or were not correctly captured in the survey. There is space for a fiscal policy that is adapted to the working conditions of informal and formal HBs that might increase their contribution to the state revenue. Nonetheless, such policies should be very cautious and gradual in order not to disrupt the dynamics of this sector.
6. Questions about corruption always relate to the framework of the business. They do not take into account bribery at schools or hospitals or with local authorities concerning matters related to administrative documents, land titles and things like that. The fact that HBs, as businesses, are not subject to much corruption does not mean that ordinary citizens do not face much corruption.

| The household Businesses and the Informal sector in vietnam | chapter 05136
2. laBOUR pRODUCTIVITy
Labour productivity is the output per unit of labour. It is an important indicator of the performance of the economy and of its different components. Two indicators of pro-ductivity are calculated. The first one (VA/L1) is the value added per worker per year, regardless of the number of hours worked. The second indicator is the value added per hour worked (VA/L2). It is more accurate but also more difficult to compute as detailed information on the hours worked by workers in the different economic or institutional sectors is seldom available.
2.1. Productivity per worker
The first indicator, value added per worker, is easy to calculate but it is not always accurate, as workers can work only part time or have two different jobs (and in this case, only the main job is taken into account). The value added per worker is the same for one worker working 24 hours a week and another one working 48 hours a week, even though the productivity of the second worker is twice as high as that of the first worker. Nevertheless, this indicator is often used at the aggregate level because detailed information about the hours worked per activity is not available.
We use two different GSO sources to calculate the productivity of each institutional sec-tor. The value added comes from the published figures of the 2014 GDP (GSO, 2015), while data on employment is extracted from the Labour Force Survey 2014. Both sets of figures were compiled independently, so there is no guarantee that they match perfectly.
The productivity of HBs is calculated from the results of the 2014/15 HB&IS survey presented above. The GDP of HBs is the sum of the value added calculated for these businesses extrapolated nationwide using the number of HBs in the 2014 LFS. The LFS provides a figure of 8.9 million businesses and 15.7 million jobs (see Chapter 2). This is much higher than the 4.7 million establishments and 7.95 million jobs covered by the GSO’s NFIDBE survey (see Chapter 1).
In the informal sector, the productivity per worker is around 40 million VND per worker per year, and it is of the same magnitude in all three economic sectors. At formal HBs, productivity per worker is nearly twice as high as at informal HBs. This shows a higher scale of operation among formal HBs, which use more equipment to produce goods, hence the higher productivity.

chapter 05 | The household Businesses and the Informal sector in vietnam | 137
This calculation differs from the one that used the GSO’s data, because it applies to a higher estimate of the value added, as seen above. It also provides more information about the divide between formal and informal non-farm businesses. This new calcula-tion does not modify the ranking of all the institutional sectors in the national econo-my. Formal HBs are in between private sector enterprises and informal HBs, and they are closer to the former. This is an indication that formal businesses are somewhere between informal HBs and domestic enterprises and that they could become corpo-rate enterprises if the conditions were favourable. Our estimate of the productivity of the informal HBs is close to the GSO’s estimate of productivity for all the HBs, despite the fact that the GSO’s coverage of the HBs does not include the most precarious and unstable HBs, which are likely to be informal (see Figure 5.4).
0
50
150
100
200
350
300
250
400
mill
ion
VND
/ w
orke
r
State sector FDI Private enterprisesector
FormalHBs
InformalHBs
Agriculture
2014
Source: GSO Source: 2014/15 HB&IS Source: GSO236
401
9073
39 27
FIgURe 5.4.VALUe ADDeD PeR YeAR AND PeR wORkeR (LABOUR PRODUCTIVITY) BY INSTITUTIONAL SeCTOR (MILLION VND)
Note: Productivity is calculated using published figures of the GDP per institutional sector divided by employment by sector from the Labour Force Survey.Source: Authors’ calculation based on the 2015 GSO survey and the 2014/15 HB&IS survey, VASS-CAF & IRD-DIAL; authors’ calculations.

| The household Businesses and the Informal sector in vietnam | chapter 05138
2.2. Productivity per hour
The second indicator is productivity per hour, which is deemed to be a more relevant measurement of productivity. It overcomes the disadvantage of the first indicator by considering production by the number of hours actually worked, thus taking into ac-count the duration of the work and the periods when there was no activity. Moreover, hours worked are related to a specific activity, and workers who have two or more jobs are counted in the calculation using the time spent at each of these jobs. This indicator requires more information, which is not available for the whole economy.
The 2014/15 HB&IS survey allows a detailed calculation of the hours worked at each HB. It takes into account the hours worked by the owner, his/her spouse and the workers, who fall into several categories, including the temporary workers who work during periods of high activity. For the HBs which cease their activity for a period of time each year, only the months worked are taken into account. This allows a calculation of productivity that is much more accurate than calculations offered by many other sources (see Table 5.6).
As shown in Chapter 4, many HBs owners do not work full time, so the calculation of productivity per worker may be misleading when we compare sectors or businesses which have a different number of hours worked.
When computed per hour, productivity is very similar in the service and trade sectors, both at informal and formal HBs. Productivity of labour per hour is significantly higher in the manufacturing sector, above all among formal HBs. Manufacturing activities usually require some technical knowledge and the use of more capital, while in the petty trade and service sectors there are fewer entry barriers (see Chapter 6).
TABLe 5.6.LABOUR PRODUCTIVITY PeR YeAR AND PeR wORkeR (VA/L1) AND PeR HOUR (VA/L2) (THOUSAND VND)
Informal HBs Formal HBs VA VA/L1 VA/L2 VA VA/L1 VA/L2Manuf. & constr. 93,400 41,300 22.6 323,200 92,800 41.5
Trade 75,800 42,400 16.7 138,700 67,300 23.6
Service 53,200 34,500 16.3 152,800 63,000 24.9
Total 71,800 39,300 18.4 179,000 73,200 28.3
Note : VA/L2= productivity per hour worked. Source: HB&IS survey 2014/15, VASS-CAF & IRD-DIAL; authors’ calculations; VA/L1= productivity per worker

chapter 05 | The household Businesses and the Informal sector in vietnam | 139
The gap between informal and formal HBs is wider when one considers the produc-tivity per worker instead of productivity per hour. This is due to the fact that part time work and seasonal work are more widespread among informal HBs. The productivity per worker at formal businesses is nearly twice that of informal workers, while the productivity per hour is 50 per cent higher at formal HBs.
2.3. Surplus of labour
Low productivity, especially at informal HBs, raises the question of labour surplus in this sector. Low productivity in the informal sector has been long pointed out in the li-terature (Hart, 1972; Blunch et al., 2001). Productivity is an indicator of the efficiency of a business, so the low productivity encountered at informal HBs tends to show a low efficiency in this sector. Moreover, low productive businesses may not be able to sur-vive, as their workers might shift to activities which yield higher output and incomes.
The persistence of low productive HBs and of the informal sector itself can be explai-ned by the surplus of labour. In Vietnam, large cohorts were born in the 1970s and the 1980s (when fertility was high), and this boosted the labour supply when they entered the labour market in the 1990s and the 2000s. With more than one million newcomers in the labour market every year, which is an increase of 2-3 per cent of the labour force each year, the capacity of labour absorption among formal enterprises is insufficient (Oudin et al., 2014). As agriculture does not absorb the surplus of labour, many workers choose to work in the informal sector.
A labour surplus can be detected in the employment of family members at HBs. While employing a wage worker corresponds to economic needs, this is not the case for family workers. The marginal productivity of additional wage workers is positive, but it is negative for family workers. Many HB owners employ their spouse or children (some of them part-time) even though so doing does not improve the performance of the business. They share their small profit with family members and thus reduce productivity per worker.
On the contrary, the employment of wage workers (many of whom have family ties with the owner) is done when it is profitable for the business. Additional wage workers contribute to boosting productivity. Table 5.7 shows that the average hourly producti-vity per worker declines with the number of workers when there are no wage workers, but it increases when there are wage workers.

| The household Businesses and the Informal sector in vietnam | chapter 05140
This has important implications. It means that if these family workers were unem-ployed, the average productivity per worker of small businesses would be higher. By employing jobless family members, spouses in particular, HBs contribute to limiting unemployment, but this reduces productivity.
However, the reduction of the labour supply which is expected in the near future (because less people will be entering the labour market) will gradually contribute to a reduction of the labour surplus and, in turn, increase the average productivity of the HB sector.
2.4. Changes in productivity
A comparison of labour productivity per hour between 2007 and 2014 in Hanoi and Ho Chi Minh City raises some crucial questions. As a whole, labour productivity has declined among informal HBs in Hanoi and stagnated in Ho Chi Minh City, and it has improved slightly, by 15 per cent in constant currency, among formal HBs (see Table 5.8). Although these findings have some limitations and cannot be generalised to the whole country, they suggest that part of the informal sector has not benefited from growth.
TABLe 5.7.AVeRAge PRODUCTIVITY PeR HOUR BY SIze OF THe HBS AND THe NUmBeR OF wAge wORkeRS (THOUSAND VND)
No wage 1 wage worker 2 wage workers workers workers or more1 worker 31
2 workers 25 35
3-5 workers 12 36 47
6 workers or more 13 49 81
Source: 2014/15 HB&IS survey, VASS-CAF & IRD-DIAL; authors’ calculations

chapter 05 | The household Businesses and the Informal sector in vietnam | 141
There is a serious decline of productivity per hour in the trade sector and to a lesser ex-tent in the service sector in both cities. Even if the data is not fully comparable,7 it shows a degradation of the performance and/or the working conditions for at least a compo-nent of the informal sector. As hinted above, there is corroborating evidence that petty traders are in a highly precarious situation. Their situation may be worse in big cities, where their number is too high for the demand. The average productivity of labour in Hanoi and in Ho Chi Minh City in the trade sector in 2014 is below the national average for informal HBs, but it is above the national average in the other sectors (see Table 5.6).
In Chapter 2 we saw that the wage workers in the informal sector experienced the slowest growth in wages of all the wage workers in the various institutional sectors. A comparison with the 2007 findings suggests that the situation could be worse for non-wage workers, especially in the trade sector. As the number of persons working alone has declined and the number of HBs that use family labour has increased, a fall in productivity corresponds to what we have just seen above, i.e. the self-employed sharing the profit with family members who are employed but do not increase the value added and profit of the HB.
Things are different for formal HBs in the two cities. They perform better and there has been an increase in the average productivity of labour in both cities. This is an indica-tion that formal HBs are more efficient economically and probably more integrated into the market.
7. In 2007, the spouses of the self-employed were not correctly recorded and this contributed to an overestimation of productivity, especially in the trade sector.
TABLe 5.8.LABOUR PRODUCTIVITY PeR HOUR IN HANOI AND HO CHI mINH CITY, 2007-2014 (THOUSAND 2014 VND)
Hanoi Ho Chi minh City 2007 2014 2007 2014InformalManufacturing & construction 21.5 24.3 18.3 27.9
Trade 21.9 12.8 18.7 15.3
Service 25.5 22.7 23.5 18.5All informal HBs 23.1 20.8 20.5 20.8
All formal HBs 32.7 37.7 32.9 37.7
All HBs 25.9 27.7 25.5 22.4
Source: Cling et al. (2010) and 2014/15 HB&IS survey, VASS-CAF & IRD-DIAL; authors’ calculations

| The household Businesses and the Informal sector in vietnam | chapter 05142
3.SEaSONalITy
HB production is not constant throughout the year. There are seasonal variations in the activity of HBs which are detailed in this section. We first consider seasonal varia-tions at the macroeconomic level, and then we study the variations for the average HB according to geographic area and formality status.
3.1. Seasonal variations in production among HBs at the macro level
As the survey covers only one month of activity per HB, the yearly economic aggre-gates need to be seasonalized in order to take into account the yearly variations and therefore avoid the bias due to the month of data collection. This is done by taking into account an entire year and asking the owners to state whether the activity for each month was high, medium, low or none at all.
As a whole, the difference in the total production during the peak month compared to the low season is not very significant. The whole aggregated production of HBs reaches a peak in December, and then it declines in January and gradually returns to the level it was in November. The decline continues between January and June, which is the month where the aggregated production is at its lowest: 17 per cent less than in December. This can be interpreted as an increase before the lunar new year festivities (Têt, which was on the 31st of January in 2014) and a decrease afterward until the sum-mer, when it stabilizes before increasing again after August (see Figure 5.5).
Production fluctuates differently and at different periods of the year across economic sectors. On average, fluctuations are more significant for manufacturing and construc-tion HBs. On the other hand, the service sector (transportation, restaurants, repair and other services) is relatively stable all year long. In the trade sector, production peaks in January, just before Têt.

3.2. Seasonal variations in the production of HBs
These averages hide important differences between HBs. For each month there is a significant proportion of HBs that stated that it is a month of high activity or, on the contrary, a month of low activity. For 35 per cent of the HBs, the Têt period is definitely a period of high activity (see Figure 5.6).
chapter 05 | The household Businesses and the Informal sector in vietnam | 143
0
20 000
40 000
60 000
80 000
120 000
140 000
100 000
Nov-13
Dec-13
Janv-13
Feb-14
Mar-14
Apr-14
May-14
Jun-14
Jul-14
Aug-14
Sep-14
Oct-14
Total Informal HBs Formal HBs
FIgURe 5.5.TOTAL mONTHLY PRODUCTION BY FORmALITY STATUS (MILLION VND)
Source: 2014/15 HB&IS survey, VASS-CAF & IRD-DIAL; authors’ calculations.

Some informal HBs do not work all year long. In rural areas, 14 per cent of the informal HBs and 7 per cent of the formal ones cease activity for two months per year or more. This is due to the fact that these activities complement farm work, so they have to cease HB activity at the peak of the agricultural season. In urban areas, the proportions are just slightly lower, showing that farm activity also impacts urban HBs (see Table 5.9).
| The household Businesses and the Informal sector in vietnam | chapter 05144
TABLe 5.9.DISTRIBUTION OF HBS BY THe NUmBeR OF NON-wORkINg mONTHS, RegISTRATION STATUS AND AReA
months of non-activity Rural Urban Total Informal Formal Informal Formal HBs HBs HBs HBs Works the whole year 80.7 90.8 84.5 89.1 84.21 month 5.5 1.9 4.4 2.9 4.42 months 5.0 2.7 4.1 2.8 4.13 to 5 months 5.4 4.5 5.0 4.1 5.0Half of the year or more 3.4 0.2 2.1 1.1 2.3Total 100 100 100 100 100
Source: 2014/15 HB&IS survey, VASS-CAF & IRD-DIAL; authors’ calculations
0
90%
100%
70%
80%
50%
60%
30%
40%
10%
20%
Nov-13
Dec-13
Janv-13
Feb-14
Mar-14
Apr-14
May-14
Jun-14
Jul-14
Aug-14
Sep-14
Oct-14
No ActivityLow ActivityMedium ActivityHigh Activity
FIgURe 5.6.DISTRIBUTION OF HBS BY LeVeL OF ACTIVITY eACH mONTH (PERCENTAGE)
Read as follows: In November, 4 per cent of the HBs are inactive; 16 per cent have a low level of activity; 57 per cent have a medium level of activity; and 23 per cent have a high level of activity. Source: 2014/15 HB&IS survey, VASS-CAF & IRD-DIAL; authors’ calculations

At the HB level, seasonal variations are much more significant than shown by the macroeconomic figures, because HBs do not all have a reduction of activity at the same time. The exposure of businesses to seasonal fluctuations constitutes a ma-jor characteristic of the HB sector, and it is more acute for formal HBs than for infor-mal HBs. Table 5.10 shows the ratio between the level of production for the highest month and the level of production for the lowest month. On average and for all HBs, the peak-month production is nearly three times the value of the lowest month’s production. Formal HBs have on average a higher ratio between the highest and the lowest months of production, which corresponds to the high seasonal variations in the informal HB sector.
These high seasonal variations may be an indication of instability among the affected HBs and of difficulty for HBs to ensure a regular income all year long. A comparison of the ratios in 2007 and 2014 in Hanoi and Ho Chi Minh City shows that the situation has worsened in both cities, for the informal as well as the formal HBs. In all cases, the seasonal fluctuations were more significant in 2014 than in 2007 (see Figure 5.7).
chapter 05 | The household Businesses and the Informal sector in vietnam | 145
TABLe 5.10.AVeRAge RATIO BeTweeN THe mAXImUm AND mINImUm LeVeLS OF PRODUCTION
max/min ratio* Rural Urban Total Informal Formal Informal Formal HBs HBs HBs HBs Average 2.77 3.10 2.51 3.02 2.77Median 2.00 2.50 1.88 2.00 2.00
*Note: For HBs that are inactive for one or more months, the lowest month of production is used to calculate the maximum/minimum ratio.Source: 2014/15 HB&IS survey, VASS-CAF & IRD-DIAL; authors’ calculations

| The household Businesses and the Informal sector in vietnam | chapter 05146
0.00
0.02
0.02
0.01
0.01
0.01
0.01
0.01
0.00
0.00
0.02
InformalHBs
FormalHBs
InformalHBs
FormalHBs
InformalHBs
FormalHBs
InformalHBs
FormalHBs
Hanoi 2007 Hanoi 2014 HCMC 2007 HCMC 2007
FIgURe 5.7.meDIAN RATIO BeTweeN THe mAXImUm AND mINImUm PRODUCTION LeVeL, 2007-2014, HANOI AND HO CHI mINH CITY
Source: 2014/15 HB&IS survey, VASS-CAF & IRD-DIAL; authors’ calculations
4.lINkagES wITH OTHER SECTORS
The extent to which the HB sector, and specifically the informal sector, is integrated into the national economy is an important issue that may infer on policy provisions towards this sector. A better integration will indeed promote inclusive growth and a convergence of labour productivities and incomes, while isolation will have counter effects. The transfer of skills and technologies is also facilitated when the various com-ponents of the national economy are better integrated.
We consider here the upward and downward linkages between HBs and the rest of the economy in the form of the purchase and sale of products by HBs from or to the formal enterprise sector, but also to other sectors (e.g. farmers and the final consu-mers). Who are the suppliers and the customers of the informal and HB sectors, and what is the amount of goods and services that they exchange? This section answers these questions. We first consider the linkages from a macroeconomic point of view by considering the amount of goods purchased and the main suppliers.8 We then
8. Integration can be understood here by filling in an input–output table of institutional sectors. In

chapter 05 | The household Businesses and the Informal sector in vietnam | 147
study to whom the HBs sell their production and merchandise. Finally, we also consi-der another type of linkage: subcontracting arrangements. We conclude this section with an assessment of the integration of the HB sector, and specifically the informal sector, into the national economy.
4.1. Purchase of raw materials and merchandise
Household businesses mainly buy their inputs (raw materials and merchandise) from other household businesses. Street vendors who sell fruit buy their fruit from a mar-ket seller who buys it from farmers. Small restaurants buy their products from small grocery stores. The upward linkages with the formal enterprise sector, especially the private domestic sector, are not negligible, but they are far fewer than the linkages with household businesses. The whole HB sector buys three quarters of its inputs from other HBs. However, the figure is quite contrasted between formal and informal HBs (see Table 5.11).
Informal HBs buy 82 per cent of their inputs from other HBs (or farmers or individuals). In all economic sectors, HBs are by far the main suppliers of informal HBs for raw ma-terials and merchandise. The second supplier of informal HBs is the formal domestic enterprise sector. All in all, the percentage of purchases made by informal businesses from private enterprises is about 17 per cent of the total purchases made by the informal sector. Purchases made by informal HBs from state companies as well as direct purchases from abroad are negligible.
The situation is somewhat different for formal HBs. Other HBs are still the main sup-plier of formal HBs, but their share is only 55 per cent. The amount of merchandise and raw materials purchased from the formal enterprise sector (private, public and abroad) is much higher than the amount purchased from informal HBs (45 per cent in total and 50 per cent in the trade sector). These purchases are mainly through private enterprises. Purchases from the state sector or directly from abroad are still negligible, but the portion is higher than the amount purchased from informal HBs.
economics, an input–output table shows the amount of production of each agent sold to other agents as intermediate products and to final consumers. Based on the Leontief matrix (Leontief, 1986), it shows the interdependencies between the different branches or agents of a national economy.

| The household Businesses and the Informal sector in vietnam | chapter 05148
TABLe 5.11.ORIgIN OF PRODUCTS PURCHASeD BY HBS (PERCENTAGE OF ANNUAL VALUE OF PURCHASES)
Informal HBs Total Formal HBsPublic sector
Private enter-prises
HBs Abroad Public sector
Private enter-prises
HBs Abroad
Manuf. & constr.
0.5 11.2 88.3 0.0 100 0.4 21.5 75.2 2.4
Trade 0.4 17.0 81.7 0.1 100 1.1 47.9 50.0 1.0
Service 2.0 20.6 77.0 0.4 100 3.9 15.1 80.3 0.8
Total 0.7 16.7 82.1 0.1 100 1.2 42.3 55.3 1.2
Source: 2014/15 HB&IS survey, VASS-CAF & IRD-DIAL; authors’ calculations
All HBs, both formal and informal, buy a larger amount of their merchandise and raw materials from the private enterprise sector in rural areas than in urban areas: 19 per cent of the purchases of rural informal HBs and only 11 per cent of the purchases of ur-ban HBs come from private enterprises. For formal HBs, the share of products bought from private enterprises is quite high (48 per cent), but it is only 32 per cent in urban areas. This can be explained by the fact that there is a higher density of informal HBs in cities, so they have more inter-linkages.
Previous figures were calculated from the total amount of purchases made by HBs at the macroeconomic level. Turning to the main supplier for each HB, we gain further insight into who the suppliers of formal and informal HBs are.
17 per cent of the informal businesses and 33 per cent of the formal ones have as their main supplier a public and incorporated enterprise in the formal sector (see Figure 5.8). Many raw materials, e.g. sheet metal and cement, are produced by large enterprises, and some HBs, more often formal ones, buy these materials directly from formal enterprises.
The fact that most HBs buy their inputs from other HBs does not mean that the ma-jority of raw materials and merchandise used as inputs are produced by other HBs. Indeed, many products in the formal sector are channelled to the HB sector by HB traders. For example, a furniture maker will buy wood from an informal trader who bought the wood from a formal enterprise. Some formal HBs in the trade sector ap-pear to act as intermediaries between the formal enterprise sector and the bulk of the HB sector, in particular informal HBs.

chapter 05 | The household Businesses and the Informal sector in vietnam | 149
The share of farmers and individuals who provide raw materials is also significant. (They were counted with the HBs above.) One out of ten informal HBs in the manu-facturing, construction and service sectors and 8 per cent of the formal ones have farmers or individuals as their main supplier.
In the trade sector, where merchandise purchased is resold without transformation, 30 per cent of the formal HBs, and only 10 per cent of the informal HBs, have as their main supplier a company in the (mainly private) formal enterprise sector. Formal HBs in the trade sector, which are often grocery stores, also resell to petty traders. Trade is thus organised in a cascading manner so that most of the transactions before the final sale are made between HBs. Although many products originate from formal en-terprises, they pass through several hands, e.g. from medium-size grocery stores to petty traders.
Thus, if the linkage between HBs and the formal enterprise sector appears to be weak in terms of amount of transactions, one cannot conclude that the informal econo-my is isolated from the formal enterprise sector or that it operates in a closed circuit. Formal household businesses, which purchase nearly half of their products from formal enterprises, may act as an entry gate for products from the formal enterprise sector to the informal sector. There are channels of penetration for products from the formal sector which greatly contribute to the dissemination of these products in the informal sector.
Individuals or farmers
HBs
Public or SOE
Private enterprise73%
4%10%13% 7%
59%
6%
27%
Informal HBs Formal HBs
FIgURe 5.8.DISTRIBUTION OF HBS BY mAIN SUPPLIeR OF RAw mATeRIALS (THE TRADE SECTOR IS NOT INCLUDED)
Source: 2014/15 HB&IS survey, VASS-CAF & IRD-DIAL; authors’ calculations

| The household Businesses and the Informal sector in vietnam | chapter 05150
Public or SOE
Private enterprises
HBs
Farmers
Individuals
Abroad & FDI
30%
4%61%
3%
1%
14%
4%
62% 19%
1% 0%1%
Informal HBs Formal HBs
FIgURe 5.9.TOTAL AmOUNT OF SALeS OF HBS BY TYPe OF CUSTOmeR (PERCENTAGE)
Source: 2014/15 HB&IS survey, VASS-CAF & IRD-DIAL; authors’ calculations
Informal HBs seem to be more isolated in terms of upward linkages. However, when compared with the situation in Hanoi and Ho Chi Minh City in 2007, the share of raw materials bought by informal businesses in the manufacturing sector directly from formal enterprises is on the rise, from 10 to 15 per cent in Hanoi, and from 4 to 19 per cent in Ho Chi Minh City. This is a significant change, although informal HBs continue to buy massively from other HBs.
4.2. who are the customers of the informal sector?
Informal as well as formal HBs work mainly for the final consumers, who are individuals (see Figure 5.9). They also sell their products to other HBs (and in a small proportion to farmers), but it is difficult to know whether products sold to other HBs are really inputs for those HBs or if the HBs are the final consumers, as with individuals.
Here again, there is a significant difference between formal and informal HBs. The for-mer sell a more significant proportion of products to private enterprises than the latter.
Most HBs sell only to one kind of customer. 2 per cent of the informal and 5 per cent of the formal HBs have more than one type of customer (e.g. individuals and pu-blic enterprises, or farmers and HBs). Most of the HBs sell only to individuals for final consumption, but there is a small portion of them who primarily sell to farmers or other HBs, but also to the state sector or private enterprises.

chapter 05 | The household Businesses and the Informal sector in vietnam | 151
Although the amount of sales to state entities is small, a significant number of HBs stated that they sell some of their products to the public sector. (There was a specific question regarding this.) The public sector here includes state-owned enterprises as well as public services and the local People’s Committee. It is not uncommon that authorities at the commune or village level utilise small businesses for different kinds of work and services such as the supply and repair of furniture or equipment, construc-tion work, food services or transportation (see Table 5.12).
Finally, the production of the informal sector is nearly entirely for the domestic market. Less than 1 per cent of the informal HBs stated that they directly export all or part of their products, and even less export their products indirectly.9 These HBs include some manufacturing HBs, e.g. those that process wood or make handicrafts, and also some wholesale traders in the border provinces.
The informal sector thus mainly sells its products and services to the final consu-mers. These consumers are not the informal sector. (Such a statement would be meaningless.) Customers who utilise motorbike taxis or street restaurants come from all walks of society, including workers at large private and public enterprises. Just be-cause upward and downward economic linkages with the formal enterprise sector are weak does not mean that the informal sector produces only for itself. As a provider of a multitude of goods and services, the informal sector is well embedded in society.
9. Direct export means that the customer is abroad. Indirect export means that the products are sold to an agent or company in Vietnam that then sells the products abroad. This distinction is based on the HB owner’s statement.
TABLe 5.12.PeRCeNTAge OF HBS THAT SeLL A PORTION OF THeIR PRODUCTS AND SeRVICeS TO STATe eNTITIeS
Informal HBs Formal HBs TotalManuf. & construction 7.1 20.4 9.7Trade 2.6 9.0 5.0Service 4.0 17.1 6.7Total 4.5 13.6 6.9
Source: 2014/15 HB&IS survey, VASS-CAF & IRD-DIAL; authors’ calculations

| The household Businesses and the Informal sector in vietnam | chapter 05152
4.3. Subcontracting linkages are few
Subcontracting is the practice of assigning some of the tasks of production to another party known as a subcontractor. It is another kind of possible linkage between the formal and the informal sector. It does not concern trade.
Much emphasis has been put on subcontracting practices in the informal sector, i.e. informal HBs doing some of the work that formal HBs have been contracted to do, especially in Asia. Some authors have put forward that through this kind of arrange-ment the informal sector supplies the formal sector with products at a low price, and the workers receive low remuneration for their labour and no social protection (Chen, 2007; Amin, 2002). The extension of subcontracting in Asian countries in the 1970s (which is limited, however, to several economic sectors) has often led to theories of the informal sector being seen as a provider of cheap and unprotected labour for the formal sector (Canagarajah and Sethuraman 2001), with informal HBs such as sweats-hops and home workers (cottage industries) selling their entire production to one enterprise or to one trader, upon whom they are totally dependent.
Cling et al. (2010) found no evidence of a significant amount of subcontracting with large firms in the informal sector in Vietnam. They found that barely 1 per cent of the informal businesses are engaged in subcontracting arrangements with formal enterprises. Their analysis was limited to Hanoi and Ho Chi Minh City, and they concluded that we need to conduct a national survey of the informal sector, including rural areas, to determine whether or not subcontracting is a significant characteristic of this sector in Vietnam.
The 2014/15 HB&IS survey can provide an answer to this question. Our results confirm those of Cling et al. for Hanoi and Ho Chi Minh City. Subcontracting with formal en-terprises is not common among HBs in Vietnam. One per cent of the informal HBs and only a slightly higher percentage of the formal HBs in the manufacturing and construction sector have contracts with large enterprises in the whole country (see Table 5.11). In Hanoi and Ho Chi Minh City, the proportion is slightly higher than ave-rage, and it is higher than in 2007, but one cannot conclude that there has been any significant change based on such low figures. Therefore, the idea of a strong linkage between HBs (those in the informal sector in particular) and the formal enterprise sector through subcontracting can definitely be ruled out. HBs that have subcontrac-ting arrangements with large enterprises are found mainly in the garment, metal and wood industries; in the construction and transportation sectors; and among HBs that repair computers and equipment (and all in small numbers).

chapter 05 | The household Businesses and the Informal sector in vietnam | 153
The above findings only concern subcontracting between HBs and large enterprises, and there are other subcontracting arrangements within the HB sector. Subcontracting between HBs, especially informal ones, is much more common than with large enter-prises. In addition, when dealing with individuals, subcontracting refers to production that is made to order, where the customer supplies or selects the raw materials and defines an expected tailor-made product. This is common in the garment industry and in the furniture-making industry. The frequency of these kinds of contracts is shown in Table 5.13 (for the manufacturing and construction sector only).10
Subcontracting with other HBs is more common than with formal enterprises, al-though it is not widespread. In the manufacturing sector alone, less than 9 per cent of the HBs work as subcontractors for another HB for part or all of their production. Subcontracting HBs are found in significant numbers in the garment industry above all, where one out of five HBs is engaged in subcontracting for another HB. We find the same proportion in basketry. There is nearly no subcontracting in the service sector.
More interestingly, HBs often do made-to-order work for their customers. This is typi-cal of the way tailors and seamstresses operate, for instance, but this way of operating is also found in other industries and in some services. The customer supplies the raw materials (or buys them in the shop), places an order and sets the specificities. He or she then has to pay for the processing, which is in fact the cost of labour. 36 per cent of the HBs in the manufacturing sector carry out mainly (24 per cent) or partially (12 per cent) made-to-order work. The sectors where this way of operating is most common
10. This analysis is based on a set of questions: Do some of your customers give you (or pay you to buy) raw materials and then ask you to transform them? What is the percentage of the turnover from these customers for the past month of operation? Which one is your most important customer? (1. State/SOE, 2. Domestic enterprise, 3. Foreign enterprise, 4. Household business, 5. Individual, 6. Direct exportation)
TABLe 5.13.PeRCeNTAge OF HBS wORkINg AS SUBCONTRACTORS OR PRODUCINg mADe-TO-ORDeR gOODS IN THe mANUFACTURINg INDUSTRY
Subcontract Subcontract Orders No orders Total with formal with other from or sub- enterprises HBs customers contracting Informal HBs 1 9.4 34.4 55.2 100Formal HBs 1.4 5.4 43.5 49.7 100Total 1.1 8.6 36.2 54.1 100
Source: 2014/15 HB&IS survey, VASS-CAF & IRD-DIAL; authors’ calculations

| The household Businesses and the Informal sector in vietnam | chapter 05154
are the furniture-making industry (three out of four HBs), the construction sector, the garment industry and the metal industry, where half of the HBs work in this manner.
The amount of turnover that stems from subcontracting was also calculated. In the manufacturing sector, subcontracting with large firms yields 1.3 per cent of the total turnover of HBs. If we count subcontracting with other HBs (excluding orders from individuals), the amount of production subcontracted is 7 per cent of the total production of informal HBs in the manufacturing sector. This is not negligible. In the garment sector, where subcontracting is more common, 5 per cent of the production comes from subcontracting with large firms. This percentage increases to 30 per cent when we also include subcontracting with other HBs.
In terms of percentage of turnover, subcontracting is more significant among formal HBs. In the manufacturing sector, 10 per cent of the production of formal HBs stems from subcontracting with large firms. This proportion increases to 20 per cent when we include subcontracting with other HBs. Formal HBs which do subcontracting work are larger than average.
A negligible portion of the HBs in the informal sector, and in the HB sector in general, subcontract. In some industries (garment and metal) the amount of the production that is subcontracted is slightly higher. However, few businesses subcontract with the formal private enterprise and public sectors. Subcontracting between HBs is more widespread.11
4.4. Competition
Competition is very high within the informal sector. Competition contributes to kee-ping the prices low and reduces the profit margins. This is the main problem per-ceived by the owners of informal HBs (see Chapter 11). Entry barriers are low in many industries, especially in the service and trade sectors, as anybody can start a business at any moment with a minimum of initial funds (20 per cent of the informal HBs start their business with less than 1 million VND (see Chapter 6), and this fosters greater competition.
11. There might be some informal middlemen or traders who sell products subcontracted to household businesses to formal enterprises. This practice, if it occurs, is not captured by the survey.

chapter 05 | The household Businesses and the Informal sector in vietnam | 155
However, more than one third (36 per cent) of the informal HBs and 24 per cent of the formal HBs stated that they have no competitors. Competition is most acute in the trade sector, and only one quarter of the informal HBs in this sector stated that they have no competitors (29 per cent of the informal and 21 per cent of the formal HBs), while nearly half of the informal HBs and one third of the formal HBs in the manufac-turing and construction sector think they have no competitors (see Figure 5.10).
Who are the main competitors of HBs? The answer is clear: The main competitors are other HBs or individuals, i.e. the self-employed, who are counted with the HBs. Less than 1 per cent of the owners of informal HBs experience competition with private or public enterprises. It appears that the large private, foreign and public enterprise sectors serve a totally separate segment of the demand. The situation is similar for formal HBs (see Table 5.14).
0
10
20
30
40
70
50
80
90
60
Manuf. &constr.
Trade Service Total
Informal HBs
Formal HBs
FIgURe 5.10.PeRCeNTAge OF HBS THAT STATeD THAT THeY HAVe COmPeTITORS
Source: 2014/15 HB&IS survey, VASS-CAF & IRD-DIAL; authors’ calculations

This shows that somehow the informal sector works in a bubble. Informal owners are in their own world and assess their situation in comparison with similar HBs. Despite existing linkages and despite the fact that HBs mainly work for final customers (as many formal enterprises do), their feelings about who their competitors are reflects a lack of understanding of the economic changes at stake. Petty traders do not incri-minate supermarkets, street restaurants do not feel threatened by the development of modern restaurants, and motorbike taxi drivers do not see taxi companies as their competitors.
| The household Businesses and the Informal sector in vietnam | chapter 05156
TABLe 5.14.mAIN COmPeTITORS BY FORmALITY STATUS AND eCONOmIC SeCTOR (PERCENTAGE)
Formal HBs Informal HBsmanuf.- constr.
Trade Service Total manuf.-constr.
Trade Service Total
Public or foreign enterprises
1.1 0.0 1.2 0.5 0.8 0.0 1.1 0.7
Domestic enterprises
2.7 2.0 4.3 2.8 1.0 0.7 1.1 0.9
HBs 93.0 91.8 85.6 90.2 84.2 87.4 84.1 85.2Farmers or individuals
3.2 6.3 8.9 6.5 14.1 11.9 13.7 13.2
Total 100 100 100 100 100 100 100 100
Source: 2014/15 HB&IS survey, VASS-CAF & IRD-DIAL; authors’ calculations

chapter 05 | The household Businesses and the Informal sector in vietnam | 157
CONClUSION
The HB&IS survey provides the first estimate ever of the contribution of the informal sector to the GDP. This contribution of 12 per cent is far from being negligible. In the trade sector alone, the contribution of the informal sector amounts to 30 per cent of the total value added of this sector. The informal sector thus plays an important role in the national economy. Taking into account all of the household businesses, the contri-bution is nearly one quarter of the GDP, or 22.6 per cent. This estimate is higher than those produced before, because the coverage of the HB&IS survey, which is based on the Labour Force Survey, is wider than the coverage of other surveys. Our results sug-gest that the contribution of the entire HB sector should be revaluated and increased by at least 16 per cent. This in turn should result in a revaluation of and a 3 per cent increase in the national GDP.
The 2014/15 HB&IS survey allows a good measurement of the labour productivity of HBs. Productivity is low in general, especially in the informal sector. Productivity per worker is nearly twice as high for formal HBs than for informal HBs, reflecting a higher scale of operation and the use of technology and equipment at formal HBs. Therefore, formal HBs are in between private sector enterprises and informal HBs, and they are closer to the former. This is an indication that formal HBs could become enterprises in favourable conditions. A surplus of labour, especially family labour, is one of the causes of low labour productivity, as shown by the negative marginal productivity of additio-nal family workers. In contrast, the marginal productivity of additional wage workers is positive. Thus, employing a wage worker corresponds to economic needs, while this is generally not the case for family workers. However, the on-going reduction of the labour supply in Vietnam should contribute to increasing the average productivity of the HB sector by reducing the labour surplus.
This chapter has also highlighted the seasonality of HB activities, in particular for formal HBs. The exposure of businesses to seasonal fluctuations constitutes a major characte-ristic of the HB sector. Seasonality translates as a variation of the time worked at HBs, which results in large changes in the level of production, with the highest period of production just before the lunar new year (Têt) and the lowest during the summer. The production during the highest period could be three times the value of the produc-tion during the lowest period. Seasonal fluctuations are significant, and they increased between 2007 and 2014, suggesting that it has become more difficult for formal and informal HBs to ensure a regular income all year long.

| The household Businesses and the Informal sector in vietnam | chapter 05158
Another important finding in this chapter is that the linkages of the informal sector with the rest of the economy are weak when measured by upward and downward transactions, which are the amount of purchases and sales of merchandise from or to the formal enterprise sector. This relative isolation of the informal sector may explain its resilience in the case of economic shocks and why the fluctuations of the formal enterprise sector have a small impact on the informal sector. In contrast, the informal sector and HBs in general are highly dependent on the final demand. Formal HBs are slightly better integrated and act as a buffer between formal enterprises in the public and private sector and the informal sector in a cascading system where some formal HBs serve as wholesale traders (and sometimes buyers) for the informal sector. Most inputs that come from big firms are channelled to the informal sector through a limited number of HBs, mostly formal ones. An increasing percentage of the products used in the informal sector are manufactured products that are made by large manufacturing firms or are imported, but the informal sector still operates mainly in relative isolation.

chapter 06 | The household Businesses and the Informal sector in vietnam | 159
performance of hBs and The Informal secTor
Xavier oudin
Household businesses, even if they are constituted of only one self-employed per-son, are economic units which produce or distribute goods and services, generate income and have expenditures. They can own assets and invest part of their profit. This chapter deals with the accounts of HBs and evaluates their performance in terms of turnover, value added and profit. It also discusses the dynamics of the HBs through their investments and changes in employment in the previous year.
The first section deals with the economic performance of household businesses, their structure and their characteristics. The value added generated by a HB is low on average, with a median value added of 3 million VND per month for all HBs and 2.4 mil-lion VND for informal HBs. As HBs do not employ many workers, the value added of a HB greatly determines the amount of profit made by the owner. However, there are very diverse situations. Section 2 focuses on the heterogeneity of the HBs and compares the profit earned by HBs with the minimum wage and the poverty line. The third section deals with the capital and investment of HBs. Most of them do not invest and only maintain their equipment. Formal businesses are not more prone to investing than informal ones. The last section confirms this lack of dynamism, as most HBs have been stable in terms of employment for the past twelve months. However, a minority of HBs have increased in size.
06

| The household Businesses and the Informal sector in vietnam | chapter 06160
1.aCCOUNTINg RESUlTS fOR HOUSEHOlD BUSINESSES aND THE INfORmal SECTOR
The weight of the non-farm HBs and, in particular, of the informal sector in the national economy is due to the large number of HBs which operate in this sector rather than to the individual performances of the businesses. These are low on average, with a low turnover and low value added and profit. Investment, as seen at the macroeconomic level, is even weaker.
1.1. Turnover, value added and profit: The low but contrasting performances of household businesses
Turnover is the amount of products, merchandise and services sold. The median monthly turnover for all HBs is 9 million VND, but this figure encompasses a wide range of situations. The difference of scale between informal and formal HBs is signifi-cant, with a median turnover of 7.5 million VND for the former and 22 million VND for the latter (see Table 6.1). Differences in the median turnover among sectors of activity are very large. The service sector is where the median turnover is the lowest, and the manufacturing and construction sector is where it is the highest, except for informal HBs in the trade sector, which have a higher median turnover than those in the ma-nufacturing and construction sector. However, the differences are partly explained by the different signification of turnover across sectors. In the trade sector it is the amount of sales of untransformed merchandise, while in other sectors it is the amount of goods and services produced and sold. Thus, at the same level of value added, HBs in the trade sector have a higher turnover than HBs in the manufacturing and construction and the service sectors. Manufacturing HBs tend to have a high turnover because they use a great amount of raw materials to produce goods. Thus, the turno-ver is not the most suitable indicator of the performance of the HBs. Value added is a better indicator of the performance of the HBs as it reflects the creation of net wealth by the HBs (see Chapter 5 section 1.1 for a more detailed definition).
The median value added of informal HBs is around half that of formal HBs, 2.6 million VND and 5.5 million VND per month respectively. Variations between sectors are almost non-existent in the informal sector (between 2.6 and 2.8 million VND per month), but they are larger among formal HBs, from 4.1 million VND in the trade sector to 8 million VND in the manufacturing and construction sector. In this sector there are more employees on average, and a significant part of the value added is comprised of the salaries of workers.

chapter 06 | The household Businesses and the Informal sector in vietnam | 161
TABLe 6.1.AVeRAge mONTHLY TURNOVeR, VALUe ADDeD AND PROFIT IN THe HB SeCTOR (MILLION VND)
Informal HBs Formal HBs Turnover Value Profit Turnover Value Profit Added AddedManuf. & constr. Mean 22.7 9.3 6.1 64.0 27.3 21.5 Median 6.2 2.8 2.3 28.0 8.0 4.9Trade Mean 37.7 5.1 4.8 70.3 10.0 9.1 Median 13.3 2.6 2.5 25.7 4.1 3.9Service Mean 13.0 5.1 4.1 30.6 13.1 10.6 Median 6.0 2.6 2.2 13.6 6.5 4.8Total mean 23.4 6.3 4.9 57.6 14.3 12.0 median 7.5 2.6 2.3 21.9 5.5 4.3
Source: 2014/15 HB&IS survey, VASS-CAF & IRD-DIAL; authors’ calculations
The median profit for all HBs is just below 3 million VND per month, and differences across sectors are even lower. However, looking at the profitability, i.e. the profit correc-ted from the level of activity (profit/turnover ratio, calculated on means), differences across sectors appear. The profitability of HBs is around 20 (meaning that the profit represents 20 per cent of the turnover), and it is similar for informal and formal busi-nesses. For both, it is much lower in the trade sector, at 13 per cent. HBs in the trade sector are definitively less profitable on average than HBs related to the production of goods and services, and formality status does not affect profitability, despite the fact that formal HBs have a higher scale of activity than informal HBs. These businesses are on average more profitable in urban than in rural areas. This reveals the existence of obstacles to mobility across sectors as well as the cost of entry into the sectors with the highest profitability: the service sector and the manufacturing and construction sector. Otherwise the tendency to equalize profits would be observed across sectors under economic rationality.
1
The differences between the mean and the median in Table 6.1 illustrate the extre-mely unequal distribution of the value added and other aggregates in the informal sector, and they are detailed in the next section.
1. One HB out of 10 conducts mixed activities comprised of production and trade or service and trade. Their turnover is the addition of goods and services produced and merchandise sold.

| The household Businesses and the Informal sector in vietnam | chapter 06162
1.2. Determinants of the value added
What are the main determinants of the value added?2 Answering this question may highlight some of the characteristics of HBs in general and also provide some indica-tions for policies to improve the performance of this sector.
We use an OLS model to explain the value added of the HBs by variables on assets and investment, employment, sectoral characteristics and individual characteristics of the owner (see Table 6.A in the appendix). This model shows that the performance of the HBs is highly correlated with labour. Compared to being self-employed and working alone, having one employee increases the value added of a HB by 21 per cent, and having two to four employees increases the value added by around 125 per cent.
Assets are the actual values of machines, tools, furniture and vehicles used for the activity. We do not include here land and premises, which are treated separately.3 The actual value of assets is correlated with the value added, but weakly: An increase of 10 per cent of the value of the assets increases the value added by 1 per cent. In the same way, investment, which includes here the purchase of new or secondhand tools, machines, furniture or vehicles and the expense of maintaining equipment du-ring the past 12 months, has a weak, although significant, effect on the value added. For most HBs, these expenditures for investment are small and sometimes difficult to distinguish from those for raw materials (e.g. tools and furniture that last less than one year). Nearly 80 per cent of the HBs have an annual investment of less than 4 mil-lion VND (see section 3 below). Moreover, for those that have made a higher level of investment, it will yield returns in the following years and it is too early to expect an effect on the value added of the year. Unfortunately, the investment of previous years is not known.
Being formal is strongly associated with the amount of value added, all other things being equal. This suggests a better use of the factors (capital, labour and skills) and a difference in nature (i.e. not only scale), which is not captured by other variables of the model. Formal HBs, on average, yield 54 per cent more value added than informal ones with the same amount of capital and labour. This can be seen as an
2. More than the determinants, we are identifying here the factors associated with the level of value added, as no causal inference has been done.
3. The value of land and premises is mentioned by only 15 per cent of the HBs in the sample, and for half of them this value constitutes more than 90 per cent of the total value of their assets (see details in section 3 below).

chapter 06 | The household Businesses and the Informal sector in vietnam | 163
efficiency premium for formal HBs. This is true for both urban and rural HBs: They have a value added that is 17 per cent higher when other characteristics including size are controlled for.
Value added is also highly correlated with being innovative. Other things being equal, a HB which innovates its product or production process, or one which prospects for new customers or changes its suppliers to reduce its costs, has a value added that is 23 per cent higher than a HB which does not do any of these things. Chapter 8 gives more insight into this topic.
Longstanding HBs are more likely to be associated with a high level of value added. This could be explained by a selection process in which the most efficient HBs persist.
The individual characteristics of the owners are also associated, although only slightly,4 with the performance of the HBs. Females are much less likely to have high value added to their HB: The value added of a HB owned by a woman is on average 48 per cent lower than the value added of a HB owned by a man. The strong negative effect of being female can be explained by “hidden” variables, i.e. characteristics which were not identified in the survey. This can be a lack of opportunities to have better opera-ting conditions. At the sectoral level, they might be confined to activities which are less profitable. For instance, female street vendors may sell items which have a lower profit margin than items sold by their male counterparts. Further in-depth analysis is needed to identify the reason why women are more involved with HBs that have a lower level of efficiency. Similarly, Kinh and Hoa owners (87 per cent of the population of HBs owners) have an advantage which is probably related to the precise location of their businesses, e.g. a better or less remote location, and this was not captured in the survey. As expected, the education level of the owner is positively associated with the value added of a HB, but the correlation is weak.
Not surprisingly, the production factors, labour and capital, are the main determinants, but they are only a partial explanation for the amount of value added. Labour is much more significant and has a stronger impact than capital and investment. Formality and the use of innovative technologies or methods of marketing also characterise the best performing HBs.
4. Their contribution to the adjusted R2 of the model is small.

| The household Businesses and the Informal sector in vietnam | chapter 06164
1.3. How income in the informal sector relates to the minimum wage
We compare the profit of the businesses with the minimum wage in order to have a view of how working at a HB can provide a living in the context of the Vietnamese labour market. Taking the minimum wage as a benchmark to assess the position of HBs is justi-fied by the fact that the minimum wage is calculated in order to provide workers with a minimum but decent income. One of the mainstream theories about the informal sector, derived from the Harris and Todaro model (Harris and Todaro, 1970), states that informal activities expand due to a supply of labour that cannot enter the formal sector because of barriers or an insufficient labour demand. Excess labour supply in the informal sector makes wages and income in this sector lower than in the formal sector, especially when wages are institutionally set in this sector. A comparison of incomes in the informal sector with the minimum wage set in the formal sector validates this view. In Chapter 4 we saw that three quarters of the wage workers in the informal sector have a salary that is above the minimum wage. However, wage workers only account for 11 per cent of the total labour force in the informal sector. We consider here the case of HB owners.
The minimum wage differs by region because of differences in the cost of living (see Chapter 4). In our sample, which is representative of the whole country, region I constitutes 19 per cent, region II 9 per cent, region III 25 per cent and region IV 47 per cent of the HBs.
While in Chapter 4 we compare the legal minimum wage with the wages of wage workers at HBs and in the informal sector, here we compare it with the income of bu-sinesses owners. The figure we use here is the profit of the business, which is the value added minus wages and taxes. This profit can be utilised as income by the owner, but it can also be saved or used for investment or the reimbursement of debts. It is shared by the household in the case of a family business. In addition, households often have other sources of income not taken into account here, the profit of the business of one of its members being only one of them. Profit is thus a potential income and should be considered as a proxy for individual remuneration for the business owner in the absence of other figures more comparable to the minimum wage.
Nevertheless, this remains an interesting indicator of how HBs, and in particular the self-employed who work alone, adjust to the conditions of the labour market in terms of income. Although the segmentation of the labour market may hinder wage adjust-ments between sectors, the minimum wage in the formal sector has spillover effects on the informal sector (Hohberg and Lay, 2015). Setting a minimum wage in the formal

chapter 06 | The household Businesses and the Informal sector in vietnam | 165
sector may deter employers from hiring more workers, so the labour supply will turn to the informal sector, which offers lower rates of income (Maloney and Nuñez Men-dez, 2004). However, the empirical literature quoted by these authors shows mixed results concerning the impact of a minimum wage in the formal sector on informal sector incomes. It is likely that the lower incomes in the informal sector are reserva-tion wages (the minimum under which one would prefer not to work) under normal conditions. This “lighthouse effect” of the minimum wage beyond the segment of the labour market that it is meant to benefit was highlighted by Souza and Baltar (1979) in the case of Brazil, and many other empirical studies have confirmed the impact of the minimum wage on the informal sector (Harrison and Leamer, 1997; Khamis, 2008).
Since the minimum wage in Vietnam is set at a low level, it should impact the reserva-tion wage.5 In other words, the minimum wage for formal workers impacts income in the informal sector. The results shown below give substance to this hypothesis.
The literature is unclear about what the comparison between wages in the formal and informal sectors represents: only wage workers in the informal sector, the only category for which a strict comparison is possible, or HBs owners whose income is the profit? Wage workers comprise only a small portion of the workers in the informal sec-tor. As seen in Chapter 4, wage workers at HBs, and in the informal sector in particular, receive, on average, a wage significantly higher than the minimum wage.
Around half of the informal HB owners and one quarter of the formal ones yield a profit that is below the minimum wage in their respective region. These proportions are very similar in all four regions defined above, despite the utilisation of different thresholds (see Table 6.2).
5. See Falk et al. (2005).

Moreover, HBs that make a profit that is below the minimum wage are most often owned by people who work part time. Nearly four out of ten owners who make a profit that is below the minimum wage work part time, which is twice as many as those who earn more than the minimum wage. In addition, many of them (around one third) have a second job. All in all, more than half (55 per cent) of the HBs that make a profit that is below the minimum wage are in one of these two situations or both.
| The household Businesses and the Informal sector in vietnam | chapter 06166
TABLe 6.2.meDIAN mONTHLY PROFIT OF HBS COmPAReD TO THe mINImUm wAge (THOUSAND VND)
Informal HBs Formal HBs minimum median profit % above median profit % above wage minimum minimum 2014 wage wageRegion I 2,700 3,200 55.6 6,600 80.2
Region II 2,400 2,700 52.5 6,000 73.5
Region III 2,100 2,300 56.6 3,800 74.6
Region IV 1,900 1,900 49.5 4,000 82.6Total 2,300 52.8 4,300 79.3
Source: 2014/15 HB&IS survey, VASS-CAF & IRD-DIAL; authors’ calculations

These results do not allow deciding which theoretical view of the informal sector better applies to the Vietnamese case. The fact that half of the informal HBs make a profit that is below the minimum wage may be interpreted as support for the dualistic view of the informal sector. Moreover, our analysis is based on the profit made by HBs, but if we also count the employees, a large share of the workers in the informal sector earn less than the minimum wage. However, we can also see that half of the HBs in the informal sector generate a profit that is above the minimum wage. This can be interpreted as an indication that the informal sector is not mainly a refuge for those who cannot find a job in the formal sector, or that income opportunities are not less attractive in this sector. This hypothesis is further explored in Chapter 11.
chapter 06 | The household Businesses and the Informal sector in vietnam | 167
0
10
20
30
40
70
50
90
100
80
60
Informal HB HB owner isa part-time worker
HB ownerhas a 2nd job
YesMakes a pro�t below the minimum wage No
HB owner isa part-time worker
or has a 2nd job
Read as follows: 94 per cent of the HBs that make a profit that is below the minimum wage in their region are informal, while 65 per cent of those that make a profit that is above the minimum wage are informal. Source: 2014/15 HB&IS survey, VASS-CAF & IRD-DIAL; authors’ calculations.
FIgURe 6.1.CHARACTeRISTICS OF HBS BY LeVeL OF PROFIT ReLATeD TO THe mINImUm wAge (PERCENTAGE)

| The household Businesses and the Informal sector in vietnam | chapter 06168
2.HOUSEHOlD BUSINESSES aRE HIgHly HETEROgENEOUS IN TERmS Of pERfORmaNCE
Average values of value added, profit and productivity hide important differences between household businesses. The informal sector and, to a lesser extent, formal household businesses are highly heterogeneous in terms of performance. The high heterogeneity of the HBs also contributes to not reducing the informal sector to a sector where workers are confined because of their lack of skills and opportunities to get a better job.
2.1. Heterogeneity of the performances of household businesses
The distribution of performance in the informal sector is extremely unequal. Half of the HBs have value added that is less than 3 million VND per month, while a few of them (2 per cent) have value added that is over 50 million VND per month. Household businesses in the formal sector, where the value added is twice as high on average than among informal HBs, are a bit less unequal. In the informal sector, the largest 10 per cent of the HBs generate value added that is 22 times higher than the value added generated by the smallest 10 per cent of the HBs, and in the formal sector the largest 10 per cent of the HBs generate value added that is 19 times higher than the value added by the smallest 10 per cent of the HBs.
In the informal sector, the distribution is more unequal in the manufacturing and construction sector than in the other economic sectors. More than one third of the informal HBs in the manufacturing sector generate value added of less than 1.5 mil-lion VND per month. These are mainly small garment makers or individuals working in food and beverage processing and in basketry. They are found in rural as well as in urban areas in similar proportions. At the top of the ladder, 17 per cent of the informal HBs in the manufacturing and construction sector have value added of over 10 mil-lion VND per month, especially furniture makers and construction HBs, but also some successful tailors or HBs in the food processing sector (see Table 6.3).
Formal businesses have on average a higher level of operation, although one third of them generate value added of less than 3 million VND per month. However, 30 per cent of the formal household businesses have value added of over 10 million VND per month.

The value added is above all correlated with the number of workers. While 60 per cent of the self-employed who work alone generate value added of less than 3 million VND per month, more than 95 per cent of the HBs with more than five workers (including the owner, the spouse, family workers and hired workers) generate value added of over 10 million VND per month. HBs with more than five workers only represent 2 per cent of all the HBs, and most of them are formal (see Figure 6.2).
chapter 06 | The household Businesses and the Informal sector in vietnam | 169
TABLe 6.3.DISTRIBUTION OF THe mONTHLY VALUe ADDeD BY SeCTOR AND RegISTRATION STATUS (PERCENTAGE)
Informal HBs Formal HBs manuf. Trade Service manuf. & Trade Service & constr. constr. < 1 million 18.3 20.7 16.8 4.8 6.4 5.7
1 to < 3 million 33.7 36.8 40.0 19.0 27.8 16.0
3 to < 6 million 19.7 22.0 25.1 13.7 26.2 26.8
6 to < 10 million 11.1 9.2 8.2 18.7 18.3 21.2
>= 10 million 17.2 11.2 9.9 43.8 21.4 30.3
Total 100 100 100 100 100 100
Source: 2014/15 HB&IS survey, VASS-CAF & IRD-DIAL; authors’ calculations
0 %
10 %
20 %
30 %
40 %
50 %
60 %
70 %
100 %
80 %
90 %
>= 10 million
6 to < 10 million
< 1 million
1 to < 3 million
3 to < 6 million
1 worker 2 workers 3-5 workers 6-18 workers
Source: 2014/15 HB&IS survey, VASS-CAF & IRD-DIAL; authors’ calculations
FIgURe 6.2.DISTRIBUTION OF HBS BY CATegORY OF mONTHLY VALUe ADDeD AND TOTAL NUmBeR OF wORkeRS (PERCENTAGE)

| The household Businesses and the Informal sector in vietnam | chapter 06170
More specifically, HBs which have wage workers are more likely to generate more va-lue. This is not surprising as those HBs must generate enough value added to pay their wage workers. Nearly half of the informal HBs and two thirds of the formal ones with wage worker generate value added of over 10 million VND per month. Among those which have no wage workers, only 11 per cent of the informal HBs and 23 per cent of the formal ones generate value added of over 10 million VND per month.6
2.2. Distribution of HBs by profit
The value added tells us about the performance and the size of the businesses. The profit is rather an indicator of profitability and above all of the income of the owner of a HB and his or her family. Although the profit has on average a value amounting to 86 per cent of the value added, it is more unequally distributed than the value added.
Around one third of the informal HBs yield a profit of less than 1.5 million VND per month (14 per cent of the formal HBs) (see Figure 6.3). At the other end of the scale, 11 per cent of the informal HBs and twice as many of the formal HBs generate a profit of over 10 million VND per month. The distribution of HBs per category of profit is similar in rural and urban areas. There are slightly more low-profit HBs in rural areas, but many of them have another source of income. The distribution is more unequal in the manufacturing and construction sector.
Looking at the quintiles of profit, the poorest 20 per cent of the informal HBs make a monthly profit of less than 500,000 VND (less than 1 million VND for the formal ones). These values can be compared to the poverty line,7 which was 400,000 VND per per-son per month in rural areas and 500,000 VND in urban areas in 2014 (Demombynes and Vu, 2015). For households of four to five persons, the poverty line is 1.6 to 2 mil-lion VND in rural areas and 2 to 2.5 million VND in urban areas. Thus, following this hypothesis about household size, one third (34 per cent) of all the HBs in rural areas generate a profit below the poverty line (1.8 million VND per month per household), and the proportion is the same in urban areas (below 2.2 million VND).8 In addition to
6. Only 5 per cent of the informal HBs and 12 per cent of the formal ones have at least one wage worker.7. There are two official poverty lines in Vietnam: the GSO-WB poverty line, which is used to compare
the level of poverty throughout time and with other countries, and the Ministry of Labour, Invalids and Social Affairs (MOLISA) poverty line, which is used to define the beneficiaries of social programmes. The poverty line used here is the MOLISA poverty line, which is lower than the GSO-WB poverty line.
8. Let us recall that profit is not necessarily the individual or household income, and it cannot be strictly compared with individual monetary measurements of poverty. Businesses that generate a low profit can be temporarily in a bad situation. In addition, their profit may constitute only one of several sources of income for the owner and his/her family.

chapter 06 | The household Businesses and the Informal sector in vietnam | 171
the poor HBs, there is a large group of near-poor and lower-middle-income HBs. At the country level, this category is largely represented in the informal sector. Moreover, as these people “are not eligible for social assistance and yet also cannot access social insurance” (UNDP 2015), they are particularly vulnerable. As their income fluctuates, they may fall back into poverty.
There is a segment of well-off HB owners, primarily among the formal HBs. Interestin-gly, there are more of them in rural areas among informal businesses. Here again, the reason might be that registration is easier to avoid in rural areas: The biggest informal HBs in rural areas would probably be formal if they were located in urban areas.
0
5
10
15
25
30
35
20
< 1.5 million 1.5 to < 3 million
3 to < 6 million
Informal HBs Formal HBs
6 to < 10 million
>= 10 million
Read as follows: 32 per cent of the informal HBs make a monthly profit of less than 1.5 million, and 15 per cent of the formal HBs make a monthly profit of less than 1.5 million. Source: 2014/15 HB&IS survey, VASS-CAF & IRD-DIAL; authors’ calculations
FIgURe 6.3.DISTRIBUTION OF INFORmAL AND FORmAL HBS BY CATegORY OF mONTHLY PROFIT (PERCENTAGE)

| The household Businesses and the Informal sector in vietnam | chapter 06172
2.3. Second job and other sources of income
The secondary activity provides HB owners and their families with a non-negligible complement of income. The range of income generated by a secondary activity is smaller than the range of income generated by HBs. For those who make a small pro-fit and have a low income, the secondary activity doubles their income on average, while for the biggest HBs, the additional income is a more marginal complement. Thus, the secondary activity reduces the variance of incomes in the informal sector and more generally among all HBs (see Figure 6.4).
This result softens the conclusions above. Around one quarter of the HBs which generate a profit under the poverty line have another activity and another source of income. Nevertheless, the number of HBs which can be considered poor or near poor remains high.
0
2 000
4 000
6 000
8 000
12 000
16 000
18 000
14 000
10 000
0
5
10
20
25
30
15
< 1.5 million 1.5 to < 3 million
3 to < 6 million
Median pro�tof the HB
Median secondaryactivity income
6 to < 10 million
>= 10 million
% that have a 2nd activity (right scale)
Source: 2014/15 HB&IS survey, VASS-CAF & IRD-DIAL; authors’ calculations
FIgURe 6.4.meDIAN PROFIT OF THe HBS AND SeCONDARY ACTIVITIeS BY CATegORY OF mONTHLY PROFIT (THOUSAND VND IN THE LEFT SCALE, PERCENTAGE IN THE RIGHT SCALE)

chapter 06 | The household Businesses and the Informal sector in vietnam | 173
3. CapITal aND INVESTmENT
Detailed questions were asked about the assets and the purchase of equipment (investment). Assets are divided into five categories (machines, tools, vehicles, furni-ture and land/premises). For each of these categories, it was possible to list up to three items, and for each of them questions were asked about their cost and other maintenance expenses for the past twelve months, their present value, and also the ownership and the way the expenses are paid. This allows a more accurate recons-truction of the capital and investment expenditures of HBs than through a unique question.
Capital is a main factor of production, but its importance for small, and especially informal, businesses cannot be analysed in the same way as for large enterprises. The amounts of capital declared by the owners are very small, and the main factor of production is undoubtedly labour. Thus, capital is significant only for the higher segment of HBs.
3.1. A small stock of capital on average
To define the stock of capital, we excluded land and premises from the analysis be-cause only a small share of the HBs (12 per cent of the informal HBs and 27 per cent of the formal ones) declared land and/or premises as capital for their business. This un-derdeclaration of land and premises as capital in our survey comes from the difficulty of distinguishing this kind of HB capital from what is owned as individual property, especially when HBs operate out of their home (41 per cent of the HBs, see Chapter 3). When they declared land and/or premises as part of their capital, the value was huge compared with other elements of capital. For informal HBs, the average value of land and premises used for their business, when they declared an amount, was 192 million VND, or 84 per cent of their capital. For formal businesses it was 1,350 million VND, or 95 per cent of their capital. For this reason, land and premises are not considered as capital in this analysis.
A small share of the HBs (8 per cent of the informal and 5 per cent of the formal HBs) stated that they had no capital at all. It is true that some activities require no equip-ment, or only tools that are counted as raw materials when they last less than one year. Moreover, the respondents were asked to state the market value of their equipment and assets, and several stated that their equipment had no more value on the market.

| The household Businesses and the Informal sector in vietnam | chapter 06174
The amount of capital is generally very small. Excluding those who stated they had no capital, the median value of the capital without land and premises is 4 million VND. It is around twice as high for formal HBs and even higher for formal manufacturing and service HBs (see Table 6.4). Nevertheless, many formal HBs, especially in the trade sector, have very limited assets.
The distribution of assets among all the HBs is extremely unequal, more than what we have seen with the value added and the profit. One third of the formal HBs and nearly half of the informal ones evaluate their assets at less than 3 million VND (see Figure 6.5). However, a portion of the HBs have a significant amount of capital: 35 per cent of the formal HBs and 14 per cent of the informal HBs declared a capital over 50 million VND.
TABLe 6.4.meDIAN AND meAN ASSeTS BY mAIN SeCTOR (THOUSAND VND)*
Informal HBs Formal HBs Total median mean median mean median meanManuf. & constr. 7,200 26,000 34,350 91,000 9,300 39,000
Trade 1,762 24,000 3,030 22,000 2,300 23,000
Service 3,170 44,000 13,650 107,000 4,040 57,000Total 3,020 33,000 7,050 61,000 4,000 40,000
* Excluding HBs which declared no capital; land and premises not included.Source: 2014/15 HB&IS survey, VASS-CAF & IRD-DIAL; authors’ calculations

The structure of the capital, i.e. the proportion of physical capital items such as machines, furniture, vehicles or tools, is presented in Figure 6.6. The capital is mostly used for machines in the manufacturing and construction sector among both formal and informal HBs. In the trade and service sectors, the structure of the capital among formal HBs differs from the structure of the capital among informal HBs. Informal HBs in the trade and service sectors use their capital mostly for transportation. The use of furniture, machines and tools is negligible. Among formal HBs in these sectors of activity, machines, furniture and tools constitute more than half of their capital. This reflects the different mode of production at informal and formal HBs in the trade and service sectors, where formal HBs use more advanced technologies than informal HBs.
chapter 06 | The household Businesses and the Informal sector in vietnam | 175
0 %
10 %
20 %
30 %
40 %
50 %
60 %
70 %
100 %
80 %
90 %
> 50,000
> 10,000 & <= 50,000
> 0 & <= 500
0 (no assets)
> 500 & <= 3,000
> 3,000 & <= 10,000
Informal HBs Formal HBs
* Land and premises not included.Source: 2014/15 HB&IS survey, VASS-CAF & IRD-DIAL; authors’ calculations
FIgURe 6.5.DISTRIBUTION OF HBS BY VALUe OF ASSeTS (PERCENTAGE AND THOUSAND VND)*

| The household Businesses and the Informal sector in vietnam | chapter 06176
Most of the equipment, tools, machines, vehicles and furniture were purchased by the owner. In a few cases, equipment was inherited (2 per cent) or was given to them by someone (3 per cent). Rental or loans of equipment are rare (2 per cent of the assets). HBs, both formal and informal, almost never resort to loans or the leasing of machines or vehicles. They do not gain access to physical capital such as machines or vehicles in this manner, and that may hinder the development of their business.
3.2. Initial capital
The informal sector has often been defined as a sector with no entry barrier (Sethura-man, 1976). Among the barriers, one of the greatest is the amount of capital needed to start a business. The average amount of initial capital needed depends on the type of activity. It is negligible for street vendors (1.6 million VND on average), but it can be rather significant for some manufacturing activities, e.g. a median initial capital of 30 million VND for the manufacturing of metal products or furniture, and around 300 million VND for high-tech industries.
0 %
20 %
40 %
60 %
100 %
80 %
Manuf &constr.
Trade Service Manuf &constr.
Trade Service
Tools Vehicles MachinesFurnitures
Informal HBs Formal HBs
* Land and premises not included.Source: 2014/15 HB&IS survey, VASS-CAF & IRD-DIAL; authors’calculations
FIgURe 6.6.STRUCTURe OF CAPITAL AmONg HBS BY FORmALITY STATUS AND SeCTOR (PERCENTAGE)*

chapter 06 | The household Businesses and the Informal sector in vietnam | 177
Some of the HBs interviewed in the 2014/15 HB&IS survey have been around for over three decades and it is thus difficult to compare the value of the initial capital of HBs created recently with those created earlier. In order to make the values comparable, we applied a deflation rate that was calculated after the inflation rate was calculated. However, we did not apply the calculation to HBs older than 16 years because changes in the price structure made the deflation rate less accurate as we went back in time (and also because the respondents’ statements are less reliable for expenditures made such a long time ago).
Less than 5 per cent declared that they had no initial capital (this includes non-answers), so there is nearly always a barrier, however small, to setting up an informal HB. Nearly no informal HB can be started without a minimum of funds.9 However, these funds did not exceed 1 million VND for one fifth of the informal HBs, regardless of the sector of activity. The median initial capital of 9.7 million VND represents four times the median monthly profit made by informal HBs (see Tables 6.2 and 6.5). However, 55 per cent of the informal HBs started their activity with a capital of over 5 million VND, which is a non-negligible amount as more than half of the informal HBs stated that they are not able to borrow this amount within a week (see Chapter 10). Thus, the entry barrier is low, but for a small segment of the informal sector only.
The median initial capital is higher in the manufacturing sector and lower in the trade sector. In the service sector, the amount of initial capital differs across industries: Trans-portation HBs need a large amount of initial capital, while for some repair HBs a set of tools is sufficient. For restaurants, the amount of capital varies greatly depending on how the HB is operated. A street restaurant that only serves soup can be operated with very little capital, while a restaurant that has a dedicated premises is much more expensive to run.
This diversity is rendered by a comparison of the initial capital that informal and for-mal businesses have at their disposal. Very often, for the same activity, the difference in the amount of initial capital is great. In the service sector, for example, the median initial capital for formal businesses is 5 times greater than the initial capital for informal businesses (see Table 6.5).
9. The question was about the amount of money needed to set up the HB. It is broader than capital in the form of equipment, tools or furniture, as it included a revolving fund and the constitution of stocks.

When comparing initial capital with the stock of actual capital, one can see that two thirds of the HBs have a lower value of capital now than when they started their business. This proportion is similar for formal and informal businesses. This indicates that many businesses do not intend to expand their business after its creation. This characteristic is not related to the year of creation of the business. We found similar proportions of businesses whose current assets have a lower value than their initial capital among businesses created recently and others created more than a decade ago. These businesses do not invest more capital to expand their business but only maintain or replace equipment when necessary. Meanwhile, one third of the businesses have increased their capital. This is consistent with other indicators of the dynamism of HBs (see section 4).
3.3. Investment
In the previous chapter we looked at investment made by HBs from a macroeco-nomic point of view and showed that investment in the HB sector is very low. This section details investment at the HB level.
It is difficult to define investment in such a survey with the precision of an accountant. We consider here as investment all expenses related to assets, i.e. the purchase (in most cases), repair and maintenance of machines, furniture, vehicles or tools in the past 12 months. Here again, we exclude investment in land and premises.
More than one third of the HBs do not invest at all. When excluding those that do not invest, the median level of total investment was 1.4 million for informal HBs and 3 mil-lion VND for formal HBs for the year 2014. These are very small values. Only 15 per cent
| The household Businesses and the Informal sector in vietnam | chapter 06178
TABLe 6.5.meDIAN VALUe OF INITIAL CAPITAL OF HBS BY eCONOmIC SeCTOR (THOUSAND VND)
Informal HBs Formal HBs Total median mean median mean median meanManuf. & constr. 14,600 34,600 81,100 141,000 18,300 53,500
Trade 5,200 28,500 30,700 163,000 10,200 79,500
Service 12,200 61,400 76,700 323,400 15,200 117,400Total 9,700 43,300 43,200 207,000 14,400 87,200
* Excluding HBs created more than 16 years ago, HBs with zero initial capital and no answers; 2014 prices. Source: 2014/15 HB&IS survey, VASS-CAF & IRD-DIAL; authors’ calculations

of the informal HBs and 24 per cent of the formal HBs invested more than 5 million VND during the previous year. Only one third of the HBs with a yearly profit of over 50 million VND invested more than 5 million VND. This share is higher for the largest HBs but it remains small. It is remarkable that one third of the formal businesses which generate a high profit do not invest at all (see Figure 6.7).
For formal HBs, investment is poorly correlated with the value added and the profit of the business, meaning that the larger HBs in terms of value added or those which gene-rate more profit are not necessarily those that invest the most. Moreover, the investment rate (the share of value added that is invested) is not at all related to the amount of value added. Small businesses which invest small amounts may, however, invest a large share of their profit, while businesses that make a large profit do not necessarily invest a large share of their profit.
chapter 06 | The household Businesses and the Informal sector in vietnam | 179
0 %
20 %
40 %
60 %
100 %
80 %
< 10 million
10 to < 25 M.
25 to < 50 M.
50 to < 100 M.
>= 100 M.
< 10 million
10 to < 25 M.
25 to < 50 M.
50 to < 100 M.
>= 100 M.
> 5 million VND 1 to < 5 million VND No investment< 1 million VND
Yearly investment
Yearly pro�t
Informal HBs
Yearly pro�t
Formal HBs
* Investment for the year 2014, only if investment >0, land and premises are excluded. Source: 2014/15 HB&IS survey, VASS-CAF & IRD-DIAL; authors’ calculations
FIgURe 6.7.DISTRIBUTION OF HBS BY CATegORY OF PROFIT AND INVeSTmeNT (VALUES PER YEAR)*

| The household Businesses and the Informal sector in vietnam | chapter 06180
The levels of investment differ greatly across sectors of activity. Manufacturing and construction is the most dynamic sector in that aspect. Only 27 per cent of the HBs in this sector do not invest at all. 44 per cent of the HBs in the trade sector and 31 per cent in the service sector do not invest at all. The median value of investment among HBs that invest is 2.7 million VND in the manufacturing and construction sector, and that is almost three times higher than the amount of investment in the trade sector (1 million VND) and twice the median value of investment in the service sector (1.5 million VND).
The structure of investment also differs by economic sector, with the bulk of investment being made in machines and tools for manufacturing activities (see Figure 6.8). In the service sector, more than half of the investment is spent on vehicles, mainly motorcycles purchased by informal HBs. This is due to the weight of motorbike taxis, which are in-formal. Among formal services, the main investment is in furniture (at restaurants and hotels) but also personal services such as hairdressers (salons) and computer services.
Most of the investment is financed by a household’s own savings. Nevertheless, bor-
0 %
20 %
40 %
60 %
100 %
80 %
Manuf &constr.
Trade Service Manuf &constr.
Trade Service
Tools Vehicles MachinesFurnitures
Informal HBs Formal HBs
* Investment for the year 2014, only if investment >0, land and premises are excluded. Source: 2014/15 HB&IS survey, VASS-CAF & IRD-DIAL; authors’ calculations
FIgURe 6.8.DISTRIBUTION OF INVeSTmeNT BY TYPe OF INVeSTmeNT AND SeCTOR* (PERCENTAGE)

chapter 06 | The household Businesses and the Informal sector in vietnam | 181
rowing from a bank or other formal institution occurs in some cases, but only for small amounts (see Figure 6.9).
The 2014/15 HB&IS survey captures many more HBs in Hanoi and Ho Chi Minh City which have invested than the 2007 survey did. In 2014, two thirds of the HBs stated that they had invested, and only one out of six stated that they had invested in 2007. Although figures on investment have to be taken cautiously, this shows that the 2014/15 survey captured the amount of investment fairly well and that the rate of those which do not invest reflects the reality of the situation. As seen in the previous chapter, the investment rate (investment divided by the value added) is low at the macro level when taking the sum of investment of all the HBs into account.
Capital and investment among household businesses is difficult to measure for two main reasons. First, it is not always easy to say when assets are the capital of the HB and when they belong to the family. This is the case mainly for premises, but also for vehicles and some other assets. Second, as HBs do not calculate depreciation, the net carrying amount of capital goods is difficult to estimate. Moreover, many HBs use secondhand and old equipment for which the book value is meaningless.
Savings
Gift
Inheritance
Family loan
Customer / supplier loan
Usurer
Bank
Micro�nance institution
Other & no answer
73%
4%10%13% 7%
59%
6%
27%
Informal HBs Formal HBs
Source: 2014/15 HB&IS survey, VASS-CAF & IRD-DIAL; authors’ calculations
FIgURe 6.9.mODe OF FINANCINg INVeSTmeNT (PERCENTAGE)

| The household Businesses and the Informal sector in vietnam | chapter 06182
HBs do not invest much, and most of them, especially the informal ones, have a very small amount of capital. In these conditions, the usual indicators, e.g. the rate of return on investment and the productivity of capital, cannot be calculated or are meaningless.
4.gROwTH Of HOUSEHOlD BUSINESSES
This lack of dynamism is also rendered by the evolution of the HBs through time in terms of employment. Three quarters of the informal HBs have not changed size in terms of workers since their creation. This proportion is lower for formal HBs (64 per cent).
Table 6.6 shows that HBs are more likely to experience growth than a downturn in their labour force: While 12 per cent of the HBs had to decrease the number of workers between the start of their business and 2014, around one quarter have been able to increase their manpower. This may be explained by the large proportion of owners who started their business without any additional workers (55 per cent).
A comparison of formal and informal businesses shows that formal HBs appear to expe-rience more fluctuation in their manpower than informal ones. Although they are more likely to expand their business, they are also more vulnerable to a downturn in their labour force. This could reflect the higher entrepreneurship of formal businesses going hand in hand with less risk aversion.
Growth of the businesses differs according to geographical area as well. Informal HBs in urban areas are more likely to reduce the size of their business than those in rural areas,
TABLe 6.6.gROwTH SINCe THe START OF THe BUSINeSS IN TeRmS OF wORkeRS BY AReA AND RegISTRATION STATUS
Informal HBs Formal HBs Rural Urban All Rural Urban AllDecrease of workers 4.6 6.9 5.5 13.1 11.7 12.3
Same number of workers 75.8 76.2 76.0 65.3 62.3 63.6
1 additional worker 14.3 13.2 13.8 15.0 16.7 16.0
More than 1 additional worker 5.2 3.8 4.7 6.5 9.3 8.1Total 100 100 100 100 100 100Positive growth 19.5 17.0 18.5 21.6 26.0 24.1
Source: 2014/15 HB&IS survey, VASS-CAF & IRD-DIAL; authors’ calculations.

chapter 06 | The household Businesses and the Informal sector in vietnam | 183
and they also experience positive growth less often. This demonstrates that they face higher competition than their rural counterparts. As far as formal HBs are concerned, urban formal HBs seem to be more dynamic than rural ones because they are more likely to increase their labour force, and they are less likely to reduce it or keep it as it is, i.e. remain stable.
Looking at manpower growth across industries (see Figure 6.10), the manufacturing sector is the most vibrant sector, and opportunities for growth are more prevalent there. The highest rate of a decline for informal HBs is in the service sector, and the highest rate of decline for formal HBs is in the trade sector.
0
10
20
30
40
70
50
80
90
60
Decrease in workers
Same numberof workers
More than1 additional
worker
1 additionalworker
Manufacturing ServiceTrade
Source: 2014/15 HB&IS survey, VASS-CAF & IRD-DIAL; authors’ calculations
FIgURe 6.10.gROwTH OF IHBS IN TeRmS OF wORkeRS BY SeCTOR

| The household Businesses and the Informal sector in vietnam | chapter 06184
CONClUSION
This chapter has highlighted the low level of performance of HBs as a whole. With a median value added of 2.6 million VND per month for informal HBs and 5.5 million VND for formal HBs, the creation of net wealth by HBs is weak, reflecting again a poor use of technology and low labour productivity. Around half of the informal HB owners and one quarter of the formal ones yield a profit that is below the minimum wage. One can roughly estimate that one third of the HBs generate a profit that is below the poverty line, although some of them only partially rely on their HB to make a living. The level of capital is generally very small, and significant investments are rarely made. Two thirds of the HBs do not invest in expanding their business with more capital but instead only maintain or replace equipment when necessary.
However, this global picture hides huge differences across sectors of activities and regis-tration status. The manufacturing and construction sector is the best performing sector, with the highest level of value added. It is also where the HBs are the largest in terms of labour, as shown in Chapter 3, and the performance of the HBs is highly correlated with labour. The HB sector is clearly labour intensive, with a higher value added among the HBs with more workers. Nevertheless, the manufacturing and construction HBs also have the highest level of capital and invest the most as well. The trade sector is definitely the least profitable sector, and it has the lowest level of capital and investment. In addi-tion, it is the sector with the lowest entry barrier: It is easy to start a business in the trade sector, but on average it provides less income than HBs in other sectors, partly because of high competition. As a consequence, the HB owners in the trade sector are more likely than the HB owners in other sectors to have started their business because they had no other choice (see Chapter 11).
Comparing formal with informal businesses, formal HBs are characterized by much higher performance than informal HBs. The value added they generate, the amount of capital they use and the amount they invest is on average twice as high as among informal HBs. Better performance among formal HBs, even when other characteristics of the business such as the size are controlled for, suggests a better use of production fac-tors and a different mode of production with greater use of technologies than among informal HBs.
The performance of HBs is extremely contrasted, not only between formal and infor-mal HBs, but inside each of these sectors. The informal sector and, to a lesser extent, formal household businesses are highly heterogeneous in terms of performance. In the

chapter 06 | The household Businesses and the Informal sector in vietnam | 185
informal sector, the largest 10 per cent of the businesses generate value added that is 22 times higher than the smallest 10 per cent of the businesses. Around one informal HB out of ten generates a profit of over 10 million VND per month, and almost the same proportion has a capital of over 50 million VND. The high heterogeneity of the HBs also contributes to not reducing the informal sector to a sector where workers are confined because of their lack of skills or opportunities to get a better job.
Thus, as in other countries, the household business sector in Vietnam is highly heteroge-neous. A large segment is definitely living in poverty or at least is vulnerable. At the other end of the scale, around one third of the HBs are performant and dynamic: 19 per cent of the HBs make a monthly profit of over 50 million VND; 3 per cent of the HBs invest more than half of the total investment in the sector; and one third of the HBs have increased their capital since they started their activity. In between, there is a segment of low-and middle-income HBs which are very vulnerable, above all when they do not have a social safety net.

| The household Businesses and the Informal sector in vietnam | chapter 06186
appENDIx
TABLe 6.A DeTeRmINANTS OF THe (LOg) VALUe ADDeD (OLS eSTImATION)
Characteristics of the HB
Assets (log) without land and premises 0.0399*** (0.00728)
Value (log) of land and premises 0.0161** (0.00502)
Investment (log) 0.0219*** (0.00447)
Number of workers (ref. 1 worker)
Two workers 0.190** (0.0474)3-5 workers 0.805*** (0.0588)6-18 workers 2.439*** (0.132)
Premises (ref. no fixed premises)
Home -0.177* (0.0668)Professional premises 0.0449 (0.0921)
Duration of the business (ref. 0-4 years)
5-9 years 0.372*** (0.0731)10-16 years 0.231** (0.0612)More than 16 years 0.365** (0.0947)
Formal HB 0.432*** (0.0657)
Urban 0.158** (0.0386)
Sector of activity (ref. Manufacturing)
Construction 0.377 (0.178)Transport -0.0899 (0.128)Restaurant & Accommodation 0.125* (0.0514)Other service -0.135* (0.0564)Trade 0.150* (0.0587)Innovative HB 0.209**(Continue…) (0.0455)
Characteristics of the HB owner
Female -0.395*** (0.0751)
Kinh Hoa 0.200** (0.0706)
Age 0.0104 (0.0144)
Age2 -0.000286 (0.000149)
Education level of the owner (ref. No diploma/certificate)
Primary 0.160* (0.0684)Lower secondary 0.118* (0.0519)Upper secondary 0.144* (0.0624)Superior 0.190 (0.129)
Has a secondary activity -0.287*** (0.0428)
Constant 9.495*** (0.392)
Observations 3,381
R-squared 0.373
Note: Standard errors in parentheses. * p<0.1, ** p<0.05, *** p<0.01.
Source: 2014/15 HB&IS survey, VASS-CAF & IRD-DIAL; authors’ calculations.

chapter 07 | The household Businesses and the Informal sector in vietnam | 187
are household BusInesses consTraIned In TheIr access To credIT?
camille saint-macary yoann lamballe
This chapter proposes an overview of the credit market that serves the formal and informal HBs in Vietnam. Credit access is indeed an important aspect of informal bu-sinesses, as it enables intertemporal decisions, such as investment as well as income and consumption smoothing, and it offers HBs a means to bear shocks. In a fluctuating economic and institutional context, where insurance mechanisms are often inexistent or incomplete, accessing credit may thus be an important determinant of economic performance. However, due to their small size, their lack of collateral or their informal character, many HBs are likely to remain excluded from the main credit channels pro-vided by commercial banks, and they are forced to rely on expensive informal credit suppliers, on their business partners or on their friends and relatives to access liquidity.
Different types of lenders coexist in Vietnam’s credit market: formal credit institutions that are regulated by the state such as banks, microfinance institutions (MFI), mass organisations and informal credit institutions that are unlicensed (e.g. friends and family, customers and suppliers, usurers and other types of lenders). As other studies on Vietnam have suggested, these suppliers are quite dynamic and offer a plurality of products (differing in average value lent, the collateral requirements, the interest rate and the duration of the loan) that the person applying for credit can access depending on his or her characteristics and needs. The significant presence of informal credit as a source of funding shows that formal lenders cannot adequately meet the demand of every HB.
On the demand side, different profiles of HBs are present on the market and they differ in their needs and access, and some appear to be more constrained than others. Using the rich information on the topic contained in the 2014/15 HB&IS survey, this chapter characterizes the credit market by examining both the supply and the demand,
07

| The household Businesses and the Informal sector in vietnam | chapter 07188
and by analysing the extent and determinants of credit constraints. This chapter esti-mates that larger household businesses whose owners have greater human and social capital tend be less credit constrained. The rationing of credit by formal institutions, due mostly to their inefficiency, does not adequately meet the credit demand, leaving some HBs rejected or self-rejected from the credit market. Those HBs cannot provide enough guaranties for commercial banks, are not targeted by MFIs and do not have the required social capital to overcome asymmetry of information when applying for informal loans.
This chapter is organised as follows: After presenting and describing the main lenders and the characteristics of the loans they offer in section 1, we examine the demand for credit among HBs. In the last part of this chapter we analyse the extent and deter-minants of credit rationing among HBs. 1.CHaRaCTERISINg THE CREDIT SUpply TO HBS IN VIETNam
The World Bank’s Doing Business report of 2016 surprisingly ranks Vietnam 28th in terms of ease of getting credit, which is above countries such as Indonesia, China, Thailand and the Philippines.1 This high ranking is mainly due to the efforts that authorities have made to improve the credit information system. Multiple reforms took place between 2011 and 2016 to improve the legal framework in order to faci-litate access to credit and improve its allocation. These measures consisted in giving borrowers the right to examine their own credit report and data (2011) and in creating a new credit bureau2 in order to expand the borrowers’ coverage and improve the credit information system (2014-2016).
1.1. A variety of actors
Following former studies on Vietnam’s credit market (Barslund and Tarp, 2007), we distinguish two broad segments: a formal segment and an informal one. The formal segment of credit supply is composed of officially licensed institutions such as com-mercial banks, but also state-owned microfinance institutions that are closely related to mass organisations. The Vietnamese microfinance system is uncharacteristic of
1. The database is composed of private limited liability companies which have their headquarters and only a base of operations in the largest city, up to 50 employees and are 100 per cent domestically owned.
2. An information collection agency that aims to report the ability of individuals and firms to repay debt. Their sources predominantly come from financial institutions.

chapter 07 | The household Businesses and the Informal sector in vietnam | 189
countries with a strong presence of those types of institutions, as most of it is control-led by the state: Since 2007, more than 50 per cent of the formal credit delivered to the economy has come from state-owned commercial banks (ADB, 2014). Microfinance institutions and mass organisations are merged into the same category for the analysis as they regroup the types of lenders whose purpose is mainly development oriented. The two main microfinance institutions in Vietnam are the Vietnamese Bank for Social Policies (VBSP) and the Vietnam Bank for Agriculture and Rural Development (VBARD), and are both state-owned institutions. At the end of 2013, 82 per cent of the microfi-nance clients and outstanding microloans belonged to one of them (ADB, 2015). The VBSP, whose role is to offer microloans at low interest rates to a targeted population composed mainly of poor households, outsources its lending activities to locally-based mass organisations in order to sustain low operating costs. The VBARD is a profit- oriented bank whose role is to support rural development by providing loans to agricultural and non-agricultural enterprises. Its interest rates are higher than the VBSP’s, and there is little competition between the two institutions. Though they are structu-rally different and do not target the same population, their main goal is to provide rural areas with affordable credit to help them increase productivity and production. In addition, 50 major semiformal MFIs are also present in Vietnam’s microfinance sector, and they are mostly related to mass organisations and are funded by local govern-ments and by domestic and international private donors.
On the other hand, a multitude of informal lenders who are not officially registered also supply loans. Those lenders are divided in the literature into two broad categories: non-profit and profit-oriented. We include in the first category loans from relatives and friends who offer those loans at a low or no interest rate. In the second category we include subcategories of loans from customers or suppliers of HBs, loans from usurers and money lenders, and a subcategory grouping of loans from other sources. We believe that these products are sufficiently distinct to be considered separately.
Formal and informal institutions that lend money differ in their capacity to overcome information asymmetry. While banks and other formal lenders often require mortgage collateral, informal lenders mainly rely on trust if the owner is part of their social network and/or they lend money at high interest rates.
Data shows that both types of lenders are very active in the credit market that serves HBs, with formal lenders covering a larger share of the market. Formal institutions re-present about 62 per cent of the total amount of credit supplied to HBs, and informal institutions 38 per cent (see Figure 7.1).

| The household Businesses and the Informal sector in vietnam | chapter 07190
The co-existence of formal and informal lenders in the same territory is common in developing countries, and this is notably the case in Vietnam (Barslund and Tarp, 2007; Saint-Macary, 2015). This may not be entirely explained by the segmentation of the credit demand, i.e. the existence of a constrained segment that can only access credit through informal lenders and of an unconstrained segment that borrows from banks. As explained by Kochar (1997), Chaudhuri (2001) and Boucher and Guirkinger (2007), the formal and informal credit supplies may well complement each other, offering different types of loans that respond to different preferences and needs.
0 %
10 %
20 %
30 %
40 %
50 %
60 %
70 %
100 %
80 %
90 %
UsurerCustomer & supplier Other informal loans
Banks Micro�nance & Mass org. Friends & family
Total Informal / Rural Formal / Rural Informal / Urban Formal / Urban
Source: 2014/15 HB&IS survey, VASS-CAF & IRD-DIAL; authors’ calculations
FIgURe 7.1.mARkeT SHAReS OF DIFFeReNT LeNDeR TYPeS IN THe HB CReDIT mARkeT BY RegISTRATION STATUS AND geOgRAPHIC AReA OF THe HBS (PERCENTAGE OF AMOUNT LENT)*

chapter 07 | The household Businesses and the Informal sector in vietnam | 191
Throughout the country, commercial banks are the primary suppliers of credit to HBs: They represent 53 per cent of the total amount granted to HBs since 2011. Microfinance institutions and mass organisations share a smaller part of the formal credit market that serves HBs, a share which is nevertheless significant at the natio-nal level at 9 per cent of the total loan supply. At the national level, informal lenders comprise a smaller share than formal lenders: 38 per cent. Friends and relatives are the primary credit supplier in this segment of lenders, and they comprise 79 per cent of the informal credit supply. Usurers are the second largest group of informal lenders, and other types of informal lenders comprise marginal shares of the credit supply offered to HBs.
Figure 7.1 further decomposes the market share held by the different lenders by different types of HBs. This decomposition shows striking differences between rural and urban HBs and between formal and informal HBs. Commercial banks represent 78 per cent of the entire amount of credit granted to urban formal HBs since 2011. In comparison, these institutions provide only 32 per cent of the amount lent to their informal counterparts. Furthermore, they account for relatively greater shares of the credit supply to both informal and formal HBs in rural areas, 42 per cent and 44 per cent respectively. The informal segment of lenders is more important for formal rural HBs and for informal urban HBs, where it represents around 50 per cent of the amount lent.
The greater reliance of rural entrepreneurs on informal credit may be explained both by a supply and a demand effect. Apart from the VBARD and microfinance institutions, which are well developed in rural areas, the formal credit supply is usually less avai-lable in rural areas as the main commercial banks concentrate their activities in urban centres. It is indeed more costly to lend in rural areas, where cash flows fluctuate more strongly and transactions costs are higher. A second explanation is that the commercial credit supply is also less adaptable in terms of the duration of loans or the required collateral, and some rural entrepreneurs may prefer instead to turn to informal lenders, in particular to their friends and relatives, who are deemed more flexible and whose supply may fit better their needs and preferences.3
3. Boucher and Guirkinger (2007) and Guirkinger (2008) in Peru show that in spite of a formal credit supply that is advantageous and flexible, many households prefer to borrow from the informal sector, where they borrow at higher rates because of high risk aversion. Indeed, the perceived risk of losing their main and often only asset (i.e. their land) pushes farmers to rely on more expensive credit sources.

| The household Businesses and the Informal sector in vietnam | chapter 07192
In addition to rural/urban differences, distinct lending patterns can be observed between informal and formal HBs in both rural and urban areas. First, microfinance and mass organisations represent 14 to 17 per cent of the informal HB market share and 4 to 6 per cent of the formal HB market share. Second, informal HBs borrow money from usu-rers more often than formal HBs do, 8 to 15 per cent and about 1 percent respectively. This indicates that the microfinance sector targets entrepreneurs who face difficulties borrowing from commercial banks, but that this supply remains insufficient to cover the entire demand, forcing some informal HBs to continue to rely on expensive loans.
1.2. Lending conditions in the formal and informal sectors
One hypothesis explaining the coexistence of formal and informal lenders is that due to specific institutional constraints of the lenders in solving information asymmetries and related problems, the products offered by different lenders have different cha-racteristics and thus respond to different needs. Table 7.1 presents some descriptive statistics on the characteristics of the loans granted by different types of lenders and it shows large differences. For informal lenders, we further distinguish between small and large loans and set the threshold at 5 million VND in order to make informal loans comparable with those of the formal lending sector.
On average, commercial banks grant loans that are 6.6 times larger than the average loan offered by a microfinance institution and 4.7 times higher than the large loans of-fered by friends and family. However, the amounts of the loans are extremely dispersed, with a standard deviation of 140 million VND. The maturity of the loans is rather low, with half of the loans lent for a one-year period or less. Although these loans would be well suited for enabling long-term investment with regards to their amount, their short duration may explain why the level of investment of HBs is so weak (see Chapter 6). Other formal lenders (in the second column) are development oriented and offer less risky loans, of lower amounts, at lower interest rates and for longer maturity periods. Heterogeneity in this category is also high as different institutions are considered here: The VBSP has low interest rates thanks to a high level of subsidies; other institutions that offer slightly higher interest rates, such as VBARD, have different social objectives; and semi-formal MFIs that are not funded by the government but instead by international donors such as the CEP (Capital Aid for Employment of the Poor, which is linked to the Labour Confederation of HCMC) are based on models with higher returns on loans and self-sustainability. However, those institutions can compensate the HBs’ lack of collateral with the backing of local mass organisations or though group lending, both of which can serve as a guarantee of creditworthiness and reduce information asymmetries.

chapter 07 | The household Businesses and the Informal sector in vietnam | 193
Informal lenders offer a greater number of loans than formal lenders, and this cre-dit has more heterogeneous characteristics. Such loans are, as expected, of lower amounts and of shorter duration than formal loans. This is due to lenders having less access to large capital flows and insurance mechanisms. Informal lenders compensate for the lack of insurance by applying high interest rates or by relying on social ties to select borrowers, monitor them and enforce repayment. This explains the differences we observe between lenders that are friends, relatives, customers or suppliers of the borrowers on one side and usurers on the other. Those in the first group can make use of social ties or commercial contracts held with the borrower to enforce the loan contract, while moneylenders and others cannot and therefore lend at higher interest rates. Thanks to this, friends and relatives (the informal lenders who most frequently lend money to HBs) are able to offer larger loans at low or no interest rates and for longer periods than other informal lenders. Loans from customers and suppliers are less frequent, but they are much cheaper than loans offered by usurers.
A relatively large number of loans, including loans greater than 5 million VND, are bor-rowed from usurers at extremely high interest rates. Most of these loans are borrowed over very short periods – half of them have to be paid back within 4 months –, which explains the 3-digit annual interest rates.
Thus, as with other studies on Vietnam’s credit sector, the findings show that the credit supply sector that serves HBs is lively and diverse, thanks to the presence of different actors offering differentiated products.4 Nevertheless, the scarcity of long-term loans must be stressed.
However, although the credit supply is active, we need to relate it to the HBs’ demand for credit and explore to what extent it meets the needs of HBs. As shown in Figure 7.1, different types of HBs tend to rely on different lenders. We have seen that this may be the result of both supply and demand features. In particular, we have noted the importance of informal credit (from friends, relatives, customers, suppliers or money-lenders) as a source of funding for rural HBs as well as informal urban HBs. This tends to show that the formal supply does not entirely meet the demand of those HBs that find more suitable loans in the informal sector.
4. It should also be noted that the methodology used to collect the data in this survey allows the recording of a high number of loans, thanks to the inclusion of small loans from different types of lenders. The data is not directly comparable to the data from previous surveys on household businesses, such as the 2007 HB&IS in Hanoi and HCMC, and it is not possible to reach a conclusion regarding the evolution of this sector since 2007.

| The household Businesses and the Informal sector in vietnam | chapter 07194
TABL
e 7.
1.g
eNeR
AL
LOA
N C
HA
RAC
TeRI
STIC
S BY
LeN
DeR
AN
D L
OA
N S
Ize
Co
mm
er-
mic
rofin
ance
Fr
iend
s
Cust
omer
s
Usu
rers
O
ther
ci
al b
anks
&
mas
s or
g.
& fa
mily
&
sup
plie
rs
in
form
al lo
ans
<5m
5m
+
<5m
5m
+
<5m
5m
+
<5m
5m
+
#
of lo
ans
414
493
2814
76
9 28
2 49
43
8 15
9 36
6 62
Amou
nt *
(M V
ND
) M
ean
96
.7
14.6
1.
0 20
.4
1.2
8.9
1.5
13.7
0.
4 17
.6
Med
ian
50
.0
10.0
0.
2 5.
0 1.
0 5.
0 1.
0 7.
0 0.
2 5.
0
SD
140.
2 16
.0
1.4
51.9
0.
9 16
.7
1.2
17.2
0.
6 19
.1
Annu
alise
d in
tere
st ra
te (%
) **
Mea
n
14.2
10
.9
0.6
4.4
0.0
11.7
27
9.3
106.
0 12
.0
9.1
M
edia
n
12.0
9.
0 0.
0 0.
0 0.
0 0.
0 16
8.0
30.0
0.
0 2.
0
SD
14.2
6.
9 5.
1 9.
6 0.
0 18
.4
338.
8 20
5.4
60.3
14
.3
Dur
atio
n (m
onth
s)
Mea
n
19.0
26
.4
1.2
10.3
1.
2 7.
0 1.
8 7.
9 1.
2 12
.3
Med
ian
12
.0
24.0
0.
2 5.
0 0.
2 8.
0 1.
0 4.
0 1.
0 12
.0
SD
14.8
18
.2
2.4
21.2
2.
9 4.
9 2.
0 11
.9
1.5
9.7
*The
que
stio
ns a
bout
loan
s for
am
ount
s bet
wee
n 20
0,00
0 an
d 5
mill
ion
VND
co
vere
d th
e six
mon
ths p
rece
ding
the
surv
ey, a
nd th
e qu
estio
ns a
bout
loan
s fo
r am
ount
s les
s tha
n 20
0,00
0 VN
D c
over
ed th
e tw
o m
onth
s pre
cedi
ng th
e su
rvey
. In
this
tabl
e, th
eir f
requ
ency
has
bee
n w
eigh
ted
(mul
tiplie
d by
6 o
r 18)
in
ord
er to
mat
ch lo
ans o
f ove
r 5 m
illio
n VN
D d
urin
g th
e pa
st 3
yea
rs.
** T
he a
nnua
lised
inte
rest
rate
s are
cal
cula
ted
usin
g th
e sim
ple
inte
rest
rate
m
etho
d, w
hich
is c
omm
on in
Vie
tnam
. The
ann
ualis
ed in
tere
st ra
te is
ca
lcul
ated
on
the
prin
cipa
l (th
e am
ount
bor
row
ed o
r the
am
ount
still
ow
ed
on a
loan
) onl
y by
ada
ptin
g th
e in
tere
st ra
te fo
r the
ent
ire d
urat
ion
of th
e lo
an
to th
e tim
e un
it of
one
yea
r.
Sour
ce: 2
014/
15 H
B&IS
surv
ey, V
ASS-
CAF
& IR
D-D
IAL;
aut
hors
’ cal
cula
tions

2.HBS’ DEmaND fOR CREDIT
Measuring the demand for credit is not as straightforward as it seems. Potential borrowers frequently censor themselves and do not demand credit out of fear of re-jection. If no precautions are taken when collecting data, those who ask for credit may be confounded with those who do not ask for credit because they do not need it. It also happens that lenders agree to lend only a portion of the requested amount, and the amount borrowed therefore does not reflect the demand. As a result, only looking at the amounts borrowed is likely to lead to an underestimation of the credit demand.
The definition of the demand for credit we use in this part of the chapter encompasses the demand expressed and satisfied, the demand expressed and not fully or not at all satisfied, and the demand that is not expressed. For demand that is not expressed, we distinguish among the non-borrowers those who declared that they have no need for credit from those who did not ask for a loan out of fear of rejection.
2.1. HBs’ demand for credit and their application for credit from formal and informal institutions
The data shows that between 2011 and 2015, 39 per cent of all HBs had a demand for credit, and that 28 per cent made at least one application for a formal or an informal loan of an amount greater than 5 million VND. Figure 7.2 shows the demand and per-centage of HBs that applied for credit from formal and informal lenders by different types of HBs and other characteristics.
The demand for credit among urban informal HBs is significantly lower than among other types of HBs (33 per cent of the urban informal HBs versus 41 to 42 per cent of the other types of HBs). This could be explained by the fact that in urban areas many informal businesses do not require significant investment (e.g. street food businesses and motorbike taxis). This may also be due to the fact that informal entrepreneurs in urban areas have less access to a limited credit supply.
Elsewhere, formal and informal businesses have about the same level of demand, yet they do not apply for loans from the same lenders. Formal rural and urban HBs tend to apply more often than informal rural HBs for loans from formal lenders. Nevertheless, all of these HBs frequently apply for loans from informal lenders: Between 11 and 13 per cent of the informal urban and rural HBs applied for such loans, and 23 per cent
chapter 07 | The household Businesses and the Informal sector in vietnam | 195

| The household Businesses and the Informal sector in vietnam | chapter 07196
of the formal rural HBs did so as well. The number of formal rural HBs that apply for informal loans is even more significant than the number of those that apply for formal loans. One must consider, however, that the informal lending sector comprises a he-terogeneity of actors and borrowing conditions. As seen in section 1, loans obtained from friends and relatives have distinctive characteristics from the ones obtained from other informal moneylenders in that they are borrowed at a low or no interest rate over longer periods. We already discussed this strong reliance on informal lenders in rural areas when we examined the origin of HB debt in section 1.1 and showed that a large portion of the informal loans obtained by formal entrepreneurs were from friends and relatives and that a larger share of informal entrepreneurs borrowed from moneylenders and other expensive sources.
The fact that formal rural HBs – which are supposedly less constrained in accessing formal credit – strongly rely on informal lenders tends to show that this sectoral choice is not constrained. These observations thus tend to show that, in rural areas at least, one decisive condition explaining sectoral choice in borrowing is whether an en-trepreneur has access to a social network from whom he or she is able to borrow money. One important question that remains to be answered is whether the formal and informal credit supplies, in particular the supply from an entrepreneur’s social network, complement and substitute each other. Descriptive statistics cannot answer this question, and further multivariate analysis is needed to explore this question. This is left for further research.

chapter 07 | The household Businesses and the Informal sector in vietnam | 197
0 10 20 30 40 50
Quintiles of assets Q5Q4Q3Q2Q1
0 10 20 30
Sector of activity
ServiceTrade
Manuf. 0 10 20 30 40 50
Nb of employee
6 to 183 to 15
21
0 10 20 30
Quintiles of pro�tQ5Q4Q3Q2Q1
0 10 20 30 40 50
Age of HB
> 16 years10-16 years
5-9 years0-4 years
Formal loans only Self-rejectedInformal loansonly
Formal and informal loans
0 10 20 30 40 50
Type of HB
Rural / InformalRural / Formal
Urban / InformalUrban / Formal
40 50
40 50
Source: 2014/15 HB&IS survey, VASS-CAF & IRD-DIAL; authors’ calculations
FIgURe 7.2.APPLICATION AND SeLF-RejeCTION RATeS FOR FORmAL AND INFORmAL CReDIT (MORE THAN 5 MILLION VND) ACCORDINg TO HB CHARACTeRISTICS (PERCENTAGE)

| The household Businesses and the Informal sector in vietnam | chapter 07198
When decomposing the HBs’ demand for credit by sector of activity, no large diffe-rences were found in the demand for credit among HBs in the trade and service sec-tors (40 per cent of the HBs have a positive demand in both sectors), but the rate was lower among HBs in the manufacturing sector (35 per cent). There is more variation in the application rates: Although HBs in the service sector have a significant demand, only a few apply for a loan (25 per cent), while in the manufacturing and trade sectors the application rates are 28 and 30 per cent respectively.
As expected, we found a positive correlation between the size of the HBs and the demand for credit: HBs that have a larger number of workers or that are in the higher quintiles of annual profit and the higher quintiles of assets have the highest application rates (see Figure 7.2). The self-rejection rates are inversely correlated with HB size, be it measured in terms of profit, assets or number of employees. Interestingly, the demand and application rates are higher among young HBs. Nascent HBs created during the last 4 years have an even greater application rate for formal loans than other HBs. This may be explained by the high investment required at the start of a business in order for it to reach a sufficient level of activity to be self-sustaining.
Finally, it is interesting to observe that the choice between formal and informal credit is not entirely explained by an HB’s sector, size or age. HBs from all sectors and of all sizes apply for informal loans. Their significant numbers in all categories indicate that the demand for informal credit cannot only be explained by constraints in accessing formal credit but also by the attractiveness of the credit offered by informal lenders, in particular that offered by friends and relatives.
Looking at the characteristics of HB owners (see Figure 7.3), there are noticeable diffe-rences related to gender. HBs run by men and women have similar demand rates (38 and 40 per cent respectively), but male owners are much more likely to apply for large loans from both formal and informal lenders.

chapter 07 | The household Businesses and the Informal sector in vietnam | 199
0 10 20 30 40 50
Age
60 and more
50-59 y.
40-49 y.
30-39 y.
18-29 y.
0 10 20 30 40 50
EducationCollege / University
Vocational school
Upper secondary
Lower secondary
Completed primary
Some primary
No education
0 10 20 30 40 50
Membership*
No membership
Other assoc.
Mass org.
Administration
Formal loans only Self-rejectedInformal loansonly
Formal and informal loans
0 10 20 30 40 50
Gender
Men
Women
*Note: Admin. refers to the VCP, the People’s Committee or the People’s Council. Mass org. refers to mass organisations. Source: 2014/15 HB&IS survey, VASS-CAF & IRD-DIAL; authors’ calculations
FIgURe 7.3.APPLICATION RATeS FOR FORmAL AND INFORmAL CReDIT (MORE THAN 5 MILLION VND) ACCORDINg TO THe CHARACTeRISTICS OF HB OwNeRS (PERCENTAGE)

| The household Businesses and the Informal sector in vietnam | chapter 07200
There is a rather ambiguous relationship between education and the demand for credit, yet a very clear one when considering expressed demand only, i.e. applica-tions made for large loans. The probability of applying for credit strongly increases with the education level of the owner. Applying for a formal loan seems to require at least some reading and writing skills as very few owners with no education submit an application. Those who do turn almost exclusively to the informal sector, where the procedure is simpler. The rate of application to formal lenders increases with the level of education, but no such pattern has been observed regarding informal credit applications.
Age is negatively correlated with credit demand and with the rate of application for credit. It is mostly the youngest owners who apply to formal lenders (see Figure 7.3). This finding is related to the observation that the application rate is higher among young HBs (see Figure 7.2). Young entrepreneurs may be more motivated and less risk averse than older ones. They also need to acquire capital more often than older people, who may have accumulated capital over time. Finally, lenders may also prefer to lend to owners below a certain age threshold as they are more likely to live long enough to repay the loans.
Finally, we found no particular relationship between the demand for credit and mem-bership in organisations, yet there is a significant link when looking at application rates. This suggests that these organisations are a place where information about credit availability and application procedures circulates. For lenders, relying on such organisations is also a possible way to obtain information about potential borrowers, and in some cases membership is a necessary condition for accessing some types of loans (e.g. loans distributed through the Women’s Union). Members of administra-tive organisations (the Vietnamese Communist Party, the People’s Council and the People’s Committee) have a higher rate of application for credit, and from formal lenders in particular. Members of these organisations are rigorously selected and they are usually well educated. In these organisations they may acquire some information and a reputation that ease their access to credit from formal lenders (see Chapter 10). Members of mass organisations and other associations apply for credit comparati-vely less often from formal lenders than members of administrative organisations, and they turn more often to informal lenders.

chapter 07 | The household Businesses and the Informal sector in vietnam | 201
2.2. Determinants of the demand for credit
The demand for credit and the decision to apply for it seem therefore to be closely related to the HB and the characteristics of its owner. To assess the relative importance of these factors and find out more about the determinants of access to credit, we estimate using a two-stage probit model to predict HBs’ access to credit. In the first stage we model the probability of there being a positive demand for a loan grea-ter than 5 million VND, and in the second stage the probability of there being some constraints. The findings are presented in Table 7.A in the appendix, and the results from the demand model are reported in the first column. The results are relative to the demand. The advantage of this econometric approach is that it allows a multivariate analysis and enables us to explore simultaneous factors.
Among the significant determinants, rural businesses are more likely than urban ones, and formal businesses are more likely than informal ones, to have a demand for large loans. As previously observed, we found a significant relationship between the demand for credit and the age of the HBs. The probability of a demand for credit decreases at first with the age of the HBs, and then it starts to increase after an esti-mated threshold of 12 years. As previously observed, the demand for credit increases with the business size, measured here as the number of employees.5
Regarding the characteristics of HB owners, once HB characteristics are controlled for, there are no significant differences in the probability of there being a demand for cre-dit between men and women or between owners with different levels of education, as shown in the descriptive statistics. However, there are in large differences in appli-cation rates: Women and less-educated owners are less likely to apply even when they have a need for credit (see Figure 7.3). HB owners who are members of an association have a higher probability of having a demand for credit. Finally, we found that HBs whose owners responded positively to the question Do you think there is a future for an establishment like yours? (a question meant to capture the owners’ aspirations) are much more likely to have a demand for credit.
5. We do not include, as we do for the descriptive statistics, assets owned or level of profit. These variables are very much correlated with the number of employees, and their inclusion may be a source of multicollinearity. In addition, these measures of HB size are quite endogenous to credit access and may bias our results.

| The household Businesses and the Informal sector in vietnam | chapter 07202
In sum, a large share of HBs, about 40 per cent, have a demand for credit, for purchasing raw materials, and for investing in premises and equipment. Demand is influenced by HB size, and larger HBs (in terms of manpower) are more likely to need credit. It evolves along the life cycle of a HB, and it is also influenced by registration status: Formal HBs are more likely than informal ones to ask for credit. Despite there being a positive demand, many HBs (around 12 per cent, which is a third of those that need credit) are discouraged from applying for a loan because they fear their appli-cation would be rejected or because they do not have information about how to get such a loan. In the next section we focus on all forms of credit constraints and evaluate to what extent HBs in Vietnam are affected.
3.aRE HBS CREDIT CONSTRaINED?
This section studies the extent of credit rationing among HBs in Vietnam. From a policy vantage point, evaluating credit constraint and its determinants is particularly important, as credit constrained HBs are the ones who face difficulties investing and are unable to reach their full potential. Understanding these constraints and iden-tifying solutions is therefore important both for equity and efficiency considerations.
3.1. measuring HBs’ credit constraints
Credit rationing describes a situation in which an entrepreneur with a viable project is not able to borrow at a given interest rate. This phenomenon is common and has been explained theoretically by Stiglitz and Weiss (1981). They show that the main source of credit rationing lies in information asymmetries that generate screening, monitoring and enforcement costs at the expense of the lender. In order to maintain a reasonable interest rate, lenders must ration their supply and select borrowers on observable creditworthiness characteristics (the possession of collateral, e.g. land, mortgageable assets or household income). A number of credit demanders, gene-rally the poor, are thus denied access to credit and are limited in their investment capacity.
In this section we consider to be credit constrained those HBs that have a positive demand for credit but are not able to borrow the entire amount needed. We identify them as (1) those that had not asked for credit because they were too discouraged to ask for it (self-rejected); (2) those that had asked for loans but had had at least one

chapter 07 | The household Businesses and the Informal sector in vietnam | 203
application rejected (fully rejected), and (3) those that had obtained a loan of an amount inferior than the amount asked for (partially rejected).6
Table 7.2 displays the proportion of HBs in the various credit constraint categories, according to geographic area and registration status. Overall we found that a non-negligible share of HBs have difficulty obtaining the amount of credit they need, 16 per cent in total. The majority, 12 per cent, are self-constrained, 4 per cent have expe-rienced full rejection and less than one per cent have received less than they asked for.7
Rand (2007), in his analysis of the credit constraints of small and medium enterprises (SME) in Vietnam, found that 14 per cent of the enterprises in the manufacturing sector were denied credit after they applied, and that overall 25 per cent were credit constrained. This figure is close to ours in terms of self-rejection, but we obtained much smaller results in terms of rejection. Differences in methodology and in sam-pling do not allow for a direct comparison. Rand (2007) used data collected in 2001 from household businesses located in four of the provinces in Vietnam, while our data is more representative of the country. However, we cannot discard the fact that the
6. In their analysis of Vietnam, Barslund and Tarp (2007) define credit rationing as having an application rejected by both formal and informal lenders. Their approach thus does not take into account cases of self-rejection and cases of partial rejection by lenders.
7. This last form of constraint is perhaps underestimated due to the fact that borrowers may ask for less than needed to adapt their demand to the lenders’ lending capacity.
TABLe 7.2.CReDIT RATIONINg BY geOgRAPHIC AReA AND RegISTRATION STATUS (PERCENTAGE OF HBS)
Unconstrained ConstrainedStatus/Area No All ap- Totally Self- At least At least Totally Need plications Unconst- Rejec- one ap- one ap- Const- fully rained tion plication plication rained granted fully partially rejected rejected Rural Informal 58.8 23.1 81.8 14.1 3.4 0.7 18.2
Formal 57.6 35.7 93.4 3.3 3.3 0.1 6.6
Total 58.6 25.7 84.3 11.9 3.4 0.6 15.8
Urban Informal 66.7 16.5 83.1 12.6 4.1 0.2 16.9
Formal 58.6 29.5 88.1 7.8 2.5 1.6 11.9
Total 63.9 20.8 84.8 11.0 3.6 0.6 15.2
Total HBs 61.0 23.5 84.5 11.5 3.5 0.6 15.5
Source: 2014/15 HB&IS survey, VASS-CAF & IRD-DIAL; authors’ calculations

| The household Businesses and the Informal sector in vietnam | chapter 07204
gap between these two observations, one made a decade earlier than the other, can also be explained by the development of the credit market in Vietnam between 2001 and 2014.
Informal HBs constrain themselves more often than formal HBs out of fear of being rejected, and they are consequently more often constrained. Table 7.4 shows that applications from informal HBs are also more often rejected by formal lenders. Registe-ring a business appears to improve access to credit, but this is a weak determinant and it is certainly not a necessary condition for accessing formal credit. We saw in section 2 that some informal HBs are also able to access large formal loans. We have already shown in this section that registration status and geographic location are only weak determinants of access to credit. However, informal businesses appear to be much more constrained than their formal counterparts in their access to credit, and this appears to be due to their characteristics rather than because they are not registered. We explore this question through a multivariate analysis in section 3.2.
Table 7.3 displays the constraint rates of HBs according to their characteristics and those of their owners. Sector of activity appears to be a strong determinant, as almost half of the businesses engaged in service activities are constrained, while only a third of those in other sectors face difficulties.
Female entrepreneurs are also much more often constrained (and this is mostly due to self-censoring) despite the fact that many loans from MFIs are partly oriented towards women, in particular thanks to the support of the Women’s Union, and there are several reasons for this. As mentioned in a report by Hampel-Milagrosa et al. (2010), women tend to be discriminated against in credit markets as they often lack collateral and they are usually not mentioned on the household land title and may thus feel discouraged from applying. A second explanation is that according to social norms female entrepre-neurs are seen as being less creditworthy because they are engaged in less productive activities or because they are more risk averse. It may also well be that females have the kinds of businesses that are less prone to investment: They are proportionally less pre-sent than men in the manufacturing and service sectors (38 per cent and 44 per cent respectively of the HBs in those sectors are owned by women), and they are mostly present in the trade sector (72 per cent), as shown in Chapter 4, and the trade sector is where investments are the lowest (see Chapter 6). We further explore the gender issue using a multivariate approach in the next subsection to test whether the female variable remains a significant and negative determinant of credit access once business characteristics are controlled for.

As shown in Table 7.3, the probability of being credit constrained increases with the age of the owner. Above the age of 50, more than half of the entrepreneurs face strong difficulties accessing credit, probably because they are considered less creditworthy, either because they are less productive or because lending to them is considered to be more risky. Finally, the probability of being constrained strongly decreases with an increase in the education level of the owner. The probability of being rationed is about four times higher for an entrepreneur who has no education than for an entrepreneur who has attended college or university. Here again, self-rejection is the main form of rationing. Illiteracy is certainly a strong obstacle, as it may be necessary to be able to read and fill out documents when applying for a loan from a formal lender. The ability to calculate and anticipate future earnings and costs associated with investment may also be required.
chapter 07 | The household Businesses and the Informal sector in vietnam | 205
TABLe 7.3.CONSTRAINT RATeS AmONg HBS wITH A DemAND FOR CReDIT ACCORDINg TO THeIR CHARACTeRISTICS AND THe CHARACTeRISTICS OF THe OwNeRS
Credit Credit Total constrained unconstrained Sector of activity
Manufacturing 35.3 64.7 100
Trade 33.4 66.5 100
Service 48.8 51.2 100
gender of HB owner Female 46.1 53.9 100
Male 32.9 67.1 100
Age of HB owner 18-29 18.3 81.7 100
30-39 35.2 64.8 100
40-49 41.2 58.8 100
50-59 47.4 52.6 100
> 60 years 66.6 33.3 100
education No education 80.3 19.7 100
Some primary school 67.3 32.7 100
Completed primary school 35.7 64.3 100
Lower secondary school 39.9 60.1 100
Upper secondary school 25.5 74.5 100
Vocational and professional school 21.8 78.2 100
College or university 21.4 78.7 100
Source: 2014/15 HB&IS survey, VASS-CAF & IRD-DIAL; authors’ calculations

| The household Businesses and the Informal sector in vietnam | chapter 07206
After self-rejection, which is by far the first and main source of credit rationing, constraint is also a result of lenders rejecting loan applications either partially or totally. Table 7.4 shows the proportion of unsuccessful loan applications by lender type and type of ap-plicant. Informal HBs are on average less likely to have their loan applications approved than formal HBs, with 16 and 20 per cent of their loan applications being either totally or partially rejected in both rural and urban areas respectively, while the proportions for formal HBs operating in rural and urban areas are 11 and 2 per cent respectively. Registration status appears to be a strong selection criteria in urban areas for all types of lenders, as only a very small proportion of formal HBs face rejection (partial or to-tal) compared to informal HBs. Registration status does not appear to be a factor that affects the rejection rates of formal and informal businesses in rural areas. One explana-tion for this is that lenders in rural areas have access to a wider range of information and can thus use registration status as one of several factors to screen and select borrowers, while in urban areas information is scarcer and formal registration constitutes a main signal of creditworthiness. Rejection rates may also be generally higher in rural areas (among informal lenders in particular) because the global credit supply there is lower and because it is concentrated in urban centres. In 40 per cent of the recorded cases, a loan was rejected by an informal lender because of insufficient funds, while in the case of formal loans, this was the reason for 9 per cent of the applications that were rejected (see Table 7.5). Rejection by a formal lender is more often due to a lack of guaranties on the part of the borrowers (23 per cent) or documents being incomplete (16 per cent).
TABLe 7.4.PROPORTION OF UNSUCCeSSFUL* LOAN APPLICATIONS BY LeNDeR TYPe, geOgRAPHIC AReA AND RegISTRATION STATUS FOR LOANS OVeR OR eQUAL TO 5 mILLION VND (PERCENTAGE OF LOANS)
geographic HB Commer- micro- Friends Usurer Other Totalarea status cial bank finance & family informal & mass org. loans # of loans 439 529 845 174 123 2,110
Rural Informal 11.1 16.7 19.2 11.7 23.9 15.9
Formal 5.9 8.6 13.2 5.7 23.0 10.6
Urban Informal 20.5 16.5 20.9 25.0 10.7 19.7
Formal 2.7 1.4 2.8 0.0 1.7 2.1
Total 6.5 8.6 10.3 8.6 11.4 8.7
*Note: Unsuccessful loan applications correspond to rejected loans or credit, the granted value of which was less than 100 per cent of the amount requested.Source: 2014/15 HB&IS survey, VASS-CAF & IRD-DIAL; authors’ calculations

3.2. The determinants of credit constraint
The multivariate analysis introduced in section 2.2, the results of which are reported in the right-hand side of Table 7.A in the appendix, informs us about the determinants of credit constraints among HBs that have a demand for credit. Credit constraint here takes all three forms detailed in section 3.1 and is equal to 1 if the owner self-censored him- or herself, or if he or she submitted an application which was totally or partially rejected.
The results show that once other factors are taken into account, geographic location and registration status do not significantly affect access to credit.8 There is, however, a quadratic relationship to the age of a HB, and the younger ones are more often constrai-ned than the older ones, but after a certain age HBs again face strong constraints. Thus, experience matters, but after a certain time HBs may not be considered (or consider themselves) to be creditworthy anymore. The size of a HB, measured here by the num-
8. We also introduced an interacted variable to test for the differentiated effect of business registration in urban and rural areas, but the coefficient turned out to be insignificant.
chapter 07 | The household Businesses and the Informal sector in vietnam | 207
TABLe 7.5.ReASONS gIVeN FOR COmPLeTe RejeCTION OF APPLICATIONS FOR LOANS OVeR OR eQUAL TO 5 mILLION VND OVeR THe PAST 3 YeARS
Reasons for loan rejection (%) All loans Formal Informal loans loans# of observed rejected loans in the sample 164 61 103
Lender had no funds 26.6 8.8 40.2
Insufficient guaranties 15.1 22.6 9.3
Too much debt 9.9 4.9 13.8
Complete but unconvincing documents 7.5 14.6 2.0
Incomplete documents 6.9 16.0 0.0
Insufficient initial capital 6.1 5.6 6.5
Profile did not fit the loan (i.e. not poor/not a farmer) 5.8 13.4 0.0
Activity/enterprise deemed not viable 4.7 7.2 2.7
No answer from the lender 0.9 1.1 0.8
Do not know 16.5 5.9 24.6
Total 100 100 100
Source: 2014/15 HB&IS survey, VASS-CAF & IRD-DIAL; authors’ calculations

| The household Businesses and the Informal sector in vietnam | chapter 07208
ber of employees, while being a main determinant of the demand for credit, was not found to affect the probability of being credit constrained.
In the previous sections (see Figure 7.3 and Table 7.3) we showed that male entre-preneurs are less often credit constrained than their female counterparts. However, results from the model indicate that once everything is controlled for, the gender effect is insignificant. This confirms our hypothesis that the gender gap is rather explained by the different characteristics of the businesses run by male and female entrepreneurs than by discrimination based on gender alone. Having a higher level of education considerably reduces the probability of being credit constrained, and it is correlated with a better ability to navigate application procedures and to convince lenders. In addition, better-educated individuals tend to run their businesses better and have convincing investment plans. Members of administrative organisations have a lower probability of being constrained, but members of mass organisations and other associations, everything else being equal, are more often constrained than non-members. This is, at first sight, counterintuitive as we know that such organiza-tions help to circulate information. Some microfinance programs even rely on mass organizations to select borrowers, distribute credit and collect repayments. However, as a large proportion of the population takes part in these mass organizations (39 per cent of the HB owners are a member of at least one mass organisation), the selection process may become more rigorous through this channel than through others.
4.wHaT DO HBS NEED CREDIT fOR?
The previous sections highlighted the relatively high need for credit among HBs in Vietnam, in particular that about 40 per cent of them have a positive demand, but also that only two thirds of them were able to access the full amount needed between 2011 and 2014. This last section looks at how HBs use this credit. We thus focus here only on HBs that have applied for and obtained a loan, and we do not consider the needs of the self-constrained and the fully rejected entrepreneurs. Table 7.6 reports the different ways that HBs make use of the formal and informal loans they receive.
Our findings show that the loans are primarily used for the purchase of raw materials: Borrowers spend more than half of the money on such expenditures rather than on short-term investments. To a lesser degree the loans are used for long-term invest-ments like premises or the acquisition and maintenance of equipment. Decomposi-tion by localisation and registration status (not shown here for the sake of brevity) do

chapter 07 | The household Businesses and the Informal sector in vietnam | 209
not show significant differences in how the money is used between the types of HBs. This finding is surprising as one would expect credit to be needed primarily for the financing of long-term investments and the expansion of the business. One expla-nation for this may be found in the characteristics of the loans as presented in Table 7.1. Formal loans from commercial banks are borrowed on average for a duration of 1.5 years, and half of them are for a period of less than a year, while microcredits are borrowed on average for a duration of 2.2 years. Informal loans have a significantly shorter duration and do not usually exceed one year.
Investments in premises or equipment, however, may require borrowing money for longer periods of time, as the returns may only be generated over the long term. The-refore, the question arises as to whether this surprisingly low share of long-term expen-ditures (of the total amount of credit supplied) reflects an inadequate supply or if this is due to other factors. As analysed in Chapter 11, access to credit remains an important preoccupation for 26 per cent of the HBs in Vietnam. In addition, a lack of space or pre-mises and a lack of equipment are cited as a main problem by 16 and 13 per cent of the HBs respectively. All together, these numbers tend to indicate that a substantial share of the HBs need to invest, and that the credit supply does not fully meet this need.
A second issue we explore here is whether the formal and informal credit supplies complement or substitute each other. As seen in section 1, the supply in both sectors significantly differs depending on various loan characteristics (i.e. amount, duration and interest), and use of this credit may differ accordingly. One hypothesis often pro-posed in the literature for the coexistence of the formal and the informal sector in the same area is that the supply in each sector, due to different means used by lenders in both sectors, is different and responds to different needs. While we do not formally test this hypothesis in this chapter, a descriptive analysis can provide some insights that so far tend to contradict this hypothesis. In section 2 we observed that only a small share (8 per cent) of the HBs that have a demand for credit apply for credit in both sectors. Most HB owners choose one sector or the other.
There are some differences in how the loans obtained from each sector are used. About three quarters of the total amount borrowed from informal lenders is used to finance the purchase of raw materials, while less than 10 per cent is invested in premises or equipment. The share spent on raw materials is lower when the loan is formal, but this remains the primary use (46 per cent of the total amount). About 40 per cent of these loans are used for long-term investments. For other types of expenses, there is almost no difference between formal and informal loans.

| The household Businesses and the Informal sector in vietnam | chapter 07210
Therefore, formal loans appear to be better suited for responding to the investment needs of HBs, but they may not be sufficient, as explained above. The fact that a large share of the formal loans are still spent on short-term expenses casts doubt on the complementary character of the formal and informal credit supplies. Rather, this tends to show that formal lenders like commercial banks and microfinance institutions could further differentiate their supply from that of informal lenders by increasing the dura-tion of their loans, and by so doing trigger long-term investment by HBs and growth in this sector.
CONClUSION
This chapter has explored access to credit and the constraints faced by HBs. It first highlighted the presence of a diversity of lenders, both formal or informal, that lend to all types of HBs, formal and informal, rural and urban. Access to credit from commercial banks is not the privilege of formal entrepreneurs only. The informal supply appears to be very heterogeneous and composed of a variety of actors, among which an entre-preneur’s social network occupies an important share. In fact, the data shows that an entrepreneur’s friends and relatives are the first source of credit for a HB in terms of the number of loans and the amount borrowed. In rural areas, social networks are the main source of credit. This is remarkable as social networks are often considered a limited source of credit, both in terms of their lending capacity and their high exposure to risk.
This observation also raises some questions about the adequacy, and perhaps also the sufficiency, of the formal credit supply, as many HBs with access to formal credit turn to
TABLe 7.6.USe OF THe LOANS BY SOURCe OF CReDIT (PERCENTAGE OF TOTAL AMOUNT)
All loans Formal loans Informal loans
Business expenses (Total) 97 96.7 97.3Purchase of raw materials 56.1 46.4 72.1
Premises 18.6 24.8 8.3
Acquisition & maintenance of equipment 12.5 14.4 9.4
Repayment of previous debts 6.5 7.7 4.5
Other businesses expenses 3.3 3.4 3
Household expenses 3 3.2 2.7
Total 100 100 100
Source: 2014/15 HB&IS survey, VASS-CAF & IRD-DIAL; authors’ calculations

chapter 07 | The household Businesses and the Informal sector in vietnam | 211
the informal sector to borrow. However, whether these two supplies are complemen-tary or substitute, i.e. whether HBs turn to informal lenders because the formal supply is insufficient or because the formal supply has not adapted to the needs of HBs is a question left for further research.
About 40 per cent of the HBs have a demand for credit, a demand that varies greatly according to the characteristics of a HB but little according to the characteristics of the owner. However, credit constraint strongly varies among the different groups of en-trepreneurs. In particular, female, older and poorly-educated entrepreneurs are more often constrained than others, but this seems to be due more to selection based on the characteristics of their business than discrimination based on their personal characte-ristics, since the results from the multivariate regression show that these variables have no significant effect. Overall, we found that a third of the HBs with a demand for credit and 16 per cent of all the HBs are constrained in their access to credit.
Finally, analyses of how credit is used show that only a small portion of the borrowed money is dedicated to long-term investments in premises or in equipment, and that a large share is used for the purchase of raw materials. This is particularly true for loans from informal sources, but it is also true, to a large extent, for loans from the formal sector. However, about a quarter of all the HBs in this survey stated that they have dif-ficulty realising long-term investments. Thus, the short- and medium-term loans (from less than a year to two years in duration) offered by the market do not seem sufficient to enable HBs to make long-term investments and thus to grow.
The findings in this chapter call for several recommendations. The first would be to explore the reasons for the high reliance of HBs, both formal and informal, on their social network to access loans; to examine the possibilities for formal lenders to better capture this demand; and to expand its supply. Second, the state also needs to address the high constraint rate observed among the HBs in need of credit. The current efforts being made by microfinance institutions with the support of the Women’s Union do not appear sufficient considering the high share of female entrepreneurs that remain credit constrained. Finally, the findings uncovered an urgent need to develop the sup-ply of long-term loans that would foster investment in the HB sector and thus promote inclusive growth.

| The household Businesses and the Informal sector in vietnam | chapter 07212
appENDIx
TABLe 7.A DeTeRmINANTS OF CReDIT ACCeSS – TwO-STAge PROBIT RegReSSION mODeL
Pr(demand) Pr(constraint)
Characteristics of the HB
Urban -0.172* -0.0819 (0.0973) (0.0781)
Registered 0.172*** -0.143 (0.0606) (0.0964)
Sector: Trade 0.0547 -0.0817 (0.0718) (0.0653)
Sector: Service -0.0494 -0.0102 (0.0510) (0.0371)
Age HB -0.0192*** -0.0168*** (0.0050) (0.0043)
Age HB squared 0.000144*** 0.000179*** (0.0001) (0.0001)
=1 if self-employed -0.0839* -0.0328 (0.0458) (0.0657)
Number of employees 0.0541*** 0.00335 (0.0148) (0.0198)
Characteristics of the owner
Age -0.00402 -0.000243 (0.0037) (0.0045)
Gender (1=male) 0.0773 0.00183 (0.0599) (0.1180)
Education: some primary 0.0526 0.0267 (0.1110) (0.1720)
Education: completed primary -0.231 -0.398*** (0.1460) (0.1470)
Education: lower secondary -0.216* -0.332* (0.1190) (0.1750)
Education: upper secondary -0.181 -0.330** (0.1510) (0.1500)
Education: college or university -0.291 -0.531*** (0.2190) (0.2050)
Member of an administrative org. -0.101 -0.511** (0.0891) (0.2080)
Member of a mass org. 0.0967 0.152** (0.0590) (0.0618)
Member of other association 0.177** 0.172* (0.0811) (0.0901)
Aspiration 0.157*** - (0.0404)
Regional dummies YES YES
Constant -0.245 -1.042*** (0.1800) (0.2460)
Observations 3,015
Censored observations 1,908
Uncensored observations 1,107
Chi² 165.69***
p-value Wald test (rho=0) 0.000
Robust standard errors in parenthesis clustered at the provincial level.
Source: 2014/15 HB&IS survey, VASS-CAF & IRD-DIAL; authors’ calculations

chapter 08 | The household Businesses and the Informal sector in vietnam | 213
InnovaTIon In The household BusIness and Informal secTors
la hai anh
Vietnam is at a crossroads. Over the past 30 years political and economic reforms have fulfilled their tasks: significant economic growth, a transition from low to lower-middle income status and remarkable poverty reduction. However, signs of a growth slowdown have recently emerged in Vietnam as the drivers of growth and poverty reduction have run out of steam and Vietnam is facing new challenges. Along with population ageing and premature deindustrialization challenges1 expected to take place in Vietnam (Rodrik, 2014), boosting productivity is the only way for Vietnam to return to a high-growth trajectory.
In the new global context of the fourth industrial revolution,2 the single most important driver of productivity in Vietnam is innovation. The economic exploration of innovation started at the beginning of the 20th century, and the dynamics of economic growth back then cannot be explained by the production function models of Solow (1956) and Swan (1956). Innovation and technical change are considered a potential way that nations can enhance their competitive positions in global value chains (Gereffi et al., 2005).
Innovation is a complex activity which is difficult to precisely define. There are va-rious definitions of the word innovation, which derives from the Latin innovatio, i.e. the creation of something new. The diversity of definitions lies in the different purposes of examining this phenomenon (Johannessen et al., 2001). Schumpeter (1934) defined innovation as the introduction of new or improved products/production processes, the development of new sales/supply markets, and the restructuring of a company. Creating new products, improving existing products and production processes, and
1. Premature deindustrialization was shown to impede growth and delay convergence with the advanced economies.
2. The fourth industrial revolution is characterised by the increasing digitization and interconnection of products, value chains and business models.
08

| The household Businesses and the Informal sector in vietnam | chapter 08214
utilising new tools are not only a reaction to fierce competition among producers. They also characterise a quick response to market demand and supply (Bryceson, 2002; Kraemer-Mbula and Wamae, 2010) to overcome shortcomings of the economy and to adapt foreign products to local conditions. These kinds of innovations can be fostered across all sectors of an economy by using the internet. Firms can use the internet for marketing or advertising to attract new customers and services as well as to support existing ones (Kalakota and Whinston, 1997).
Although innovation is the single most important driver of productivity after economic growth, this system in developing countries is poorly constructed and very fragmen-ted (Aubert, 2005). In Vietnam, a weak national innovation system,3 a loose relationship between science and enterprises, a lack of international linkages (Nguyen et al., 2013; OECD, 2013), and an inherent internal incapability hinders firms from developing new-to-the-world innovations. A report by CIEM, the DOE and the GSO (Tarp and Rand, 2012) has shown that in 2011, only 800 out of the nearly 8,000 surveyed Viet-namese SMEs conducted R&D, and these firms preferred to adapt outside technology brought in from external sources.
Studies on innovation in Vietnam are rare, and the characteristics of innovation at the company level in the country are still unclear, especially for the household business sector. In spite of accounting for around one third of the total employment in Vietnam (see Chapter 2), very little is known about the extent to which new processes, products and other types of innovations have been applied in this sector, what role the internet plays in fostering these types of innovation among HBs, and how large innovation contributes to business productivity. This chapter represents one of the first attempts to answer these questions.
The chapter gives an overall picture of the utilisation of innovation among household businesses in Vietnam and compares informal and formal HBs in rural and urban areas as well as in the three main industrial sectors: manufacturing and construction, trade and service. Innovation is measured by various indicators, including those defined by Schumpeter (1934): (1) the introduction of a new product or the improvement of an existing one; (2) the introduction of a new production process/technology and the improvement of an existing one, (3) the prospect of new customers, and (4) the utilisation of new suppliers for cost reduction purposes. These indicators are conside-red in association with internet usage and future plans for strengthening manpower
3. This system is characterised by limited business funding for research and development activities.

chapter 08 | The household Businesses and the Informal sector in vietnam | 215
or business activities. All the innovation indicators are observed in relationship with labour productivity, which is measured as value added per worker. The chapter also investigates the nexus between the utilisation of innovation, characteristics of house-hold businesses and their owners, and productivity.
1.THE applICaTION Of INNOVaTION amONg HBS
This section looks at the extent to which different types of innovation have been applied among HBs and compares the utilisation of innovation among informal and formal HBs in rural and urban areas as well as across the three main industries. It also tests the association between innovation and business productivity.
1.1. Product and process innovation
In practice, product innovation deals with the introduction of a new product or the improvement of an existing one in order to create new markets or satisfy current customers, while process innovation allows businesses to improve their product quality or production efficiency. Product innovation is therefore more focused on the market and is mainly driven by customers, whereas process innovation is primarily driven by efficiency (Utterback and Abernathy, 1975). Furthermore, product innovation is associated with the early stages of industry development, while process innovation comes at later stages (Abernathy and Utterback, 1978).
The proportions of product and process innovators among HBs during the past year are illustrated in Table 8.1. They include businesses that introduced new products or improved existing ones and those that applied new production techniques or new technology in their service supply within the past 12 months.

Overall, approximately 10 per cent of the Vietnamese HBs innovated their products and/or applied new technology during the past year. Less than 2 per cent of these HBs innovated both their products and their technology, 4 per cent carried out product innovation only and another 4 per cent only improved their production technique. These proportions are, however, much lower than those observed among manufac-turing SMEs (40 and 13 per cent respectively) (Vu and Doan, 2015).
The proportions of product and process innovators are pretty similar in rural and urban areas and slightly higher among formal HBs than informal ones (10 and 9 per cent respectively). In particular, there is a significant difference in these proportions across the three main industries. Only 1 per cent of the traders introduced a new product or technology or improved an existing one during the past 12 months, whereas one fifth of the manufacturing HBs introduced innovation in their products or their pro-duction process during the same period. This difference is due to the characteristics of each industry. While an innovation in product/technology certainly results in profit for businesses that produce food, textiles or clothing, it may be unnecessary in the whole-sale and retail trade sectors. This kind of innovation seems to be homogenous among informal and formal HBs in the manufacturing and trade sectors, possibly implying a negligible impact of formalization on product/process innovation.
| The household Businesses and the Informal sector in vietnam | chapter 08216
TABLe 8.1.PROPORTION OF HBS THAT INNOVATeD THeIR PRODUCT/TeCHNOLOgY wITHIN THe PAST 12 mONTHS (PERCENTAGE)
manufacturing & construction Trade Service TotalRural areas Informal HBs 21.0 0.9 7.8 9.7Formal HBs 23.1 1.3 19.2 9.7Total rural HBs 21.3 1.0 9.2 9.7
Urban areas Informal HBs 18.3 2.1 6.9 8.3Formal HBs 20.1 2.3 17.8 11.0Total urban HBs 18.8 2.2 9.9 9.2
All Informal HBs 20.1 1.3 7.4 9.2Formal HBs 21.6 1.8 18.2 10.4Total HBs 20.4 1.5 9.6 9.5
Source: 2014/15 HB&IS survey, VASS-CAF & IRD-DIAL; Authors’ calculations

Similar to HBs in the manufacturing sector, the proportion of service businesses that formally run a small restaurant or supply repair and transport services and that inno-vate their product/process is approximately 20 per cent. However, this share is much lower among informal HBs (7 per cent), implying a high segmentation of the service market among formal and informal businesses. Approximately half of the formal HBs and only 4 per cent of the informal HBs in the service sector offer telecommunication, financial or professional services.
It is obvious that product/process innovation results in higher labour productivity, which is measured as value added per worker. Table 8.2 compares the average values of labour productivity among HBs that innovated their product or process during the past 12 months and those that did not. A ratio between them is calculated. On ave-rage, the productivity of innovators (in product or process) is nearly double that of the non-innovators. This fact is robust whatever the geographic area, formality status or industry, except for businesses in the trade sector because a change in the products or technology applied by traders may be driven by low profit or low competitiveness. This again confirms the reason why a negligible share of the trade HBs apply this type of innovation (see Table 8.1).
Looking further inside each industry, the extent that labour productivity is improved with product/process innovation seems to drive the likelihood that a business will apply this kind of innovation. Both formal service businesses and all types of manu-facturing HBs significantly improved their labour productivity (by 100-150 per cent), explaining their relatively higher shares of product or process innovators in each category. In contrast, labour productivity improved by only 20 per cent in the informal service market, which has a much smaller proportion of innovators.
chapter 08 | The household Businesses and the Informal sector in vietnam | 217
TABLe 8.2.RATIO OF LABOUR PRODUCTIVITY BeTweeN PRODUCT/TeCHNOLOgY INNOVATORS AND NON-INNOVATORS*
Informal Formal Rural Urban Total HBs HBs HBs HBs Manufacturing & construction 2.1 2.2 2.4 1.9 2.2Trade 1.0 0.6 0.7 0.8 0.8Service 1.2 2.5 1.2 2.6 2.0Total 1.7 2.1 1.8 1.9 1.9
Note: * Innovators are defined as HB owners who have innovated their products or processes. Source: 2014/15 HB&IS survey, VASS-CAF & IRD-DIAL; Authors’ calculations

| The household Businesses and the Informal sector in vietnam | chapter 08218
1.2. Output and input market innovation
Another kind of innovation is related to output and input markets. HB owners were asked if they had prospected for new customers or changed their suppliers during the past year to reduce their costs or increase their profit. This is known as output and input market innovation. This type of innovation is more common than product/process innovation (approximately 30 vs. 10 per cent respectively) (see Table 8.3). This may be because the former type of innovation may require less expense and result in higher profit than the latter. The higher prevalence of input/output market innovation is shown consistently regardless of geographical area, formality status, industry or any combination of these classifications.
Similar to product/process innovation, the share of HBs involved in output/input mar-ket innovation is fairly similar in rural and urban areas, but it is higher in the formal sector (37 per cent) than the informal sector (26 per cent). During the past 12 months, formal HBs in all industries and geographical areas were more likely to change their suppliers or customers than informal HBs in the same industry or area. In particular, nearly 30 per cent of the HBs in the trade sector innovated their input or output market during the past year. Thus, traders rarely improved their product or process, and their activities were much more driven by the discovery of new markets or a reaction to fierce competition among producers.
TABLe 8.3.PROPORTION OF HBS THAT INNOVATeD THeIR INPUT/OUTPUT mARkeT DURINg THe PAST 12 mONTHS (PERCENTAGE)
manufacturing & construction Trade Service TotalRural Informal HBs 29.2 22.4 23.9 25.1Formal HBs 43.2 27.8 54.7 36.3Total rural HBs 31.4 24.1 27.6 27.4
Urban Informal HBs 37.3 26.5 23.4 27.6Formal HBs 41.9 42.6 29.0 37.4Total urban HBs 38.5 33.9 24.9 30.9
Total Informal HBs 31.9 23.8 23.7 26.1Formal HBs 42.6 35.3 36.0 36.9Total HBs 34.0 28.1 26.2 28.9
Source: 2014/15 HB&IS survey, VASS-CAF & IRD-DIAL; Authors’ calculations

chapter 08 | The household Businesses and the Informal sector in vietnam | 219
Similar to product/process innovation, HBs that prospect for new customers or change suppliers consistently have higher labour productivity than their counterparts who do not carry out output/input market innovation regardless of geographical area, for-mality status or industry (see Table 8.4). On average, the productivity of the former group is higher than that of the latter by more than 50 per cent. In particular, traders in both the formal and informal sectors as well as in both rural and urban areas tend to improve their labour productivity most significantly (by around 100 per cent) when they change their customers or suppliers, which explains why a much larger share of them apply these kinds of innovations instead of product or process improvement.
1.3. Combined innovation
Businesses carried out different types of innovation over the past 12 months. An inno-vative HB is therefore defined as one that applied at least one type of innovation during the past year, including: (1) the introduction of a new product or the improvement of an existing one; (2) the introduction of a new production process/technology and the improvement of an existing one, (3) the prospect of new customers and (4) the utilisa-tion of new suppliers for cost reduction purposes.
TABLe 8.4.RATIO OF LABOUR PRODUCTIVITY BeTweeN INPUT/OUTPUT mARkeT INNOVATORS AND NON-INNOVATORS
Informal Formal Rural Urban Total HBs HBs HBs HBs Manufacturing & construction 1.1 1.6 1.3 1.5 1.3
Trade 2.0 2.0 2.2 1.9 2.1
Service 1.6 1.5 2.0 1.5 1.7
Total 1.5 1.7 1.8 1.6 1.7
Source: 2014/15 HB&IS survey, VASS-CAF & IRD-DIAL; Authors’ calculations

Table 8.5 shows the prevalence of the different combinations of innovative methods. Overall, a third of the HBs innovated their activities during the past year. This share is similar in rural and urban areas but larger in the formal sector (42 per cent) than in the informal one (31 per cent). As expected, HBs in the manufacturing sector very actively carried out some kind of innovation (44 per cent of them), at least 10 percentage points higher than the share of innovators among businesses in the service and trade sectors.
Approximately 30 per cent of the innovators only change their suppliers to reduce their costs. HBs that only prospect for new customers account for approximately 30 per cent of the innovators, whereas only 6 per cent of the innovators only improve their products and 8 per cent of them only conduct process innovation. Thus, nearly 70 per cent of the innovators only carried out one type of innovation during the past 12 months. The share of HBs that innovate at least both their products and technology is also small (only 5 per cent of the innovators), while other innovators are more likely to combine at least both prospecting for new customers and changing their suppliers
| The household Businesses and the Informal sector in vietnam | chapter 08220
TABLe 8.5.AmONg THe INNOVATORS: A COmBINATION OF INNOVATION meTHODS (PERCENTAGE)
Innova- Innovation methods as % of innovators tors as % Only Only Product Only Only Customer Other of total product process & process customer supplier & supplier mix of (1) (2) (3) (4) (5) (6) innova- tion methods (7)
All 34.0 6.2 7.6 4.7 28.5 27.6 20.3 5.6
Rural 32.7 6.1 9.5 5.2 27.8 26.6 20.5 5.2
Urban 35.6 6.5 5.6 4.2 29.2 29.2 20.2 5.9
Informal 31.3 7.3 8.6 4.5 29.1 26.5 19.2 5.1
Formal 41.8 4.3 6.0 5.5 26.6 30.1 23.0 6.5
Manuf. & const. 43.5 8.3 12.0 8.7 19.3 20.7 22.3 10.3
Trade 29.2 1.7 1.4 1.0 31.2 39.7 24.3 0.7
Service 32.0 8.4 9.1 4.4 34.7 24.1 15.0 5.6
Notes: (1) Only product innovation; (2) only process innovation; (3) at least product and process innovation; (4) only output market innovation; (5) only input market innovation; (6) at least output and input market innovation; (7) one type of product/process innovation and one type of output/input market innovation.Source: 2014/15 HB&IS survey, VASS-CAF & IRD-DIAL; Authors’ calculations

to reduce their costs or increase profit (20 per cent of them). Meanwhile, a mix of one type of product/process innovation and one type of output/input market innovation is applied by nearly 6 per cent of the innovators.
Labour productivity between innovators who conduct different kinds of improve-ment and non-innovators is compared in Table 8.6. On average, a HB that conducts at least one type of innovation has a 90 per cent higher productivity rate than a HB that does not conduct any type of innovation. The gain of productivity associated with innovation is similar in urban and rural areas and across industries, and it is on average higher among formal HBs than in the formal sector.
chapter 08 | The household Businesses and the Informal sector in vietnam | 221
TABLe 8.6.RATIO OF LABOUR PRODUCTIVITY BeTweeN INNOVATORS AND NON-INNOVATORS
All Only Only Product Only Only Customer Other innova- product process & process customer supplier & supplier mix of tors (1) (2) (3) (4) (5) (6) innova- tion methods (7)
All 1.9 2.9 1.4 2 1.9 1.2 2.4 2.9
Rural 1.9 4.3 0.9 2 2 0.9 2.5 2.1
Urban 1.9 1.4 2.4 2 1.8 1.5 2.3 3.8
Informal 1.6 3.3 1 1.2 2 1 1.4 1.3
Formal 2.6 1.5 2.6 3.5 1.7 1.6 4.1 5.7
Manuf. & const. 1.9 4.6 1.3 1.9 1.5 1 2.2 2.3
Trade 2.1 1.1 0.4 1.7 2.4 1.4 3.2 0.9
Service 1.7 1.6 1.7 2.2 1.7 1.2 1.5 4.3
Notes: (1) Only product innovation; (2) only process innovation; (3) at least product and process innovation; (4) only output market innovation; (5) only input market innovation; (6) at least output and input market innovation; (7) one type of product/process innovation and one type of output/input market innovation.Source: 2014/15 HB&IS survey, VASS-CAF & IRD-DIAL; Authors’ calculations

| The household Businesses and the Informal sector in vietnam | chapter 08222
2. INNOVaTION THROUgH USINg THE INTERNET aND INNOVaTION aS a mEaNS TO ExpaND fUTURE aCTIVITy
This section looks at the role of the internet in fostering innovation as well as the association between current innovation and future activity expansion. In the 2014/15 HB&IS survey, household businesses were asked whether they used the internet to find a way to produce their products, provide their services, find clients or conduct advertising. Table 8.7 illustrates the answers to these questions, and it is obvious that the internet is more likely to be used by innovators than non-innovators, although the use of the internet remains low on average (7 per cent of all the HBs).
14 per cent of the innovators stated that they use the internet for their activities, which is four times the percentage among non-innovators. The share of internet users among innovators is greater than the share of internet users among non-innovators in every category. Thus, as expected, the internet seems to foster innovation. Among both innovators and non-innovators, urban, formal and service businesses are most likely to take advantage of the internet. Labour productivity has improved among innovators who use the internet. This improvement is consistently found in both rural and urban areas, across industries, among formal HBs and in the informal sector.
TABLe 8.7.INTeRNeT USAge AmONg INNOVATORS AND NON-INNOVATORS (PERCENTAGE)
% of non-innovators % of innovators Labour productivity who use the internet who use the internet ratio between internet and non-internet users among innovatorsAll 3.5 13.9 1.5Rural 1.2 10.9 1.1
Urban 6.4 17.4 1.8
Informal 2.0 9.7 1.7
Formal 8.3 22.8 1.1
Manufacturing & construction 2.0 15.7 1.0
Trade 2.2 8.5 3.1
Service 5.7 17.0 1.2
Source: 2014/15 HB&IS survey, VASS-CAF & IRD-DIAL; Authors’ calculations

Current innovation is not only fostered by internet usage but also by future activity plan-ning (see Table 8.8). HBs were asked whether they plan to strengthen their manpower or increase their activity level. Generally, innovators are more likely to be involved in strengthening their activities in the future. 13 per cent of the innovators plan to increase their manpower and 42 per cent plan to increase their activity level, and only 4 per cent and 21 per cent (respectively) of the non-innovators plan to do so. The pattern of lower shares among non-innovators appears consistently in both urban and rural areas, in both the formal and the informal sector and across industries. This is because planning helps small business owners to innovate (Beaver and Prince, 2004). Through the plan-ning process, small business owners are more likely to identify issues related to the need for new technology and training in order to help their business grow.
Table 8.8 also compares the average labour productivity of innovators who plan to increase their activities with those who do not. As a result, HBs with a plan to strengthen activity and manpower consistently have higher labour productivity. In sum, planning and usage of the internet not only foster innovation but also improve business productivity.
chapter 08 | The household Businesses and the Informal sector in vietnam | 223
TABLe 8.8.FUTURe INNOVATION AmONg INNOVATORS AND NON-INNOVATORS (PERCENTAGE)
Share of HBs among non-innovators
Share of HBs among innovators
LP ratio between innovators planning to increase manpower and those not planning to do so
LP ratio between innovators planning to increase activity and those not planning to do so
Plans to increase manpower
Plans to increase activity
Plans to increase manpower
Plans to increase activity
All 3.9 21.3 12.7 42.0 1.7 1.6
Rural 3.8 23.8 14.2 42.7 1.9 1.5
Urban 4.0 18.1 11.1 41.2 1.4 1.8
Informal 3.8 19.3 12.2 40.9 1.0 1.3
Formal 4.3 28.1 13.9 44.3 2.5 2.0
Manuf.& construc.
6.8 21.6 20.8 46.9 1.2 1.5
Trade 1.9 24.3 5.6 46.6 4.2 1.9
Service 4.2 18.1 11.3 33.2 1.3 1.5
Note: LP is labour productivity Source: 2014/15 HB&IS survey, VASS-CAF & IRD-DIAL; Authors’ calculations

| The household Businesses and the Informal sector in vietnam | chapter 08224
3. INNOVaTION aND THE CHaRaCTERISTICS Of HBS
This section explores the characteristics of the HB owners who are most likely to inno-vate, as shown in Table 8.9.
Firstly, business size is a critical factor often discussed in the literature to explain why a small business is not innovative (Hussin et al., 2002; Hadaya, 2006). It is obvious in Table 8.9 that an innovative HB tends to be larger than one that does not innovate. 65 per cent of the HBs with more than 5 workers innovated their activities within the past 12 months, and only 36 per cent of the HBs with 3 to 5 workers and 30 per cent of the HBs with 1 or 2 workers have done so. These patterns are robust across industries and formality status. Hadjimanolis (2000) suggests that small companies tend to lack resources and bargaining power, and this hinders their ability to be innovative. In contrast, the age of a business seems not to affect the application of innovation among HBs (see Table 8.9).
TABLe 8.9.INNOVATION ACROSS OwNeR AND HB CHARACTeRISTICS BY RegISTRATION STATUS AND INDUSTRY (PERCENTAGE)
All Informal Formal manuf. Trade Service & const.Business size
1-2 workers 29.8 29.6 30.9 35.5 25.2 30.4
3-5 workers 36.4 32.2 45.1 46.2 31.5 33.3
6-18 workers 65.2 57.2 75.3 73.5 47.9 62.6
Age of business 0-1 year 29.1 27.4 34.5 45.4 22.3 26.8
2-4 years 36.5 32.0 57.7 44.2 30.3 35.5
5-9 years 35.1 34.4 36.6 48.8 26.5 37.3
10 years or more 33.5 30.2 41.7 41.1 31.7 29.0
Owner’s level of education Primary or less 28.1 26.3 35.9 37.2 25.1 24.7
Lower secondary 34.6 31.3 43.7 45.2 28.3 32.1
Upper secondary or higher 44.9 44.5 45.6 55.7 37.8 45.3
Owner’s age Under 36 40.5 35.0 58.8 50.3 35.7 38.7
From 36 to 55 33.5 31.6 38.5 43.9 28.9 30.1
Over 55 26.1 24.8 30.4 30.5 21.5 27.8
Source: 2014/15 HB&IS survey, VASS-CAF & IRD-DIAL; Authors’ calculations

chapter 08 | The household Businesses and the Informal sector in vietnam | 225
Secondly, the characteristics of business owners (i.e. their level of education and age) also impacts innovation among HBs. As shown in Table 8.9, innovative HBs tend to be managed by better educated and younger owners. 45 per cent of the HB owners who have a high school diploma or higher and 28 per cent of the HB owners who only finished primary school or have an even lower level of education attainment innovate their activities. Similarly, more than 40 per cent of the HB owners below the age of 36 conducted at least one type of innovation during the past year, followed by 34 per cent of the owners in the 36 to 55 age group. The oldest group (over 55 years old) is least likely to innovate (only 26 per cent). All the above patterns are shown to be consistent in both the formal and informal sectors and in the three main sectors. This is because well-educated and younger owners are more likely to be able to handle new technology, which might be related to the introduction of new products, and they can easily use the internet to find clients or conduct advertising activities.
While labour productivity has been proven to be positively correlated with innovation (see section 2 of this chapter), household characteristics associated with innovation (larger businesses and younger and better-educated owners, as shown above) may be the main drivers of productivity instead of innovation itself. To remove these charac-teristics and test again the relationship between innovation and labour productivity, an OLS model was applied with labour productivity in logarithm form treated as the dependent variable and a main independent variable equal to 1 if a HB innovates their process/product and input/output market within the past 12 months and 0 otherwise. The results are presented in the appendix (see Table 8.A). The statistically significant coefficients on dummies of innovation shown in Table 8.A consistently imply that in-novation is always one of the main drivers of labour productivity, even after controlling for other characteristics.

| The household Businesses and the Informal sector in vietnam | chapter 08226
CONClUSION
This chapter gives an overall picture of the utilisation of innovation among household businesses in Vietnam. Innovation is measured by the introduction of a new product/process and the improvement of an existing one, prospecting for new customers or the utilisation of new suppliers, i.e. input/output market innovation. A third of the HBs have conducted innovation in their activities within the past year, 70 per cent of which only carried out one type of innovation. Input/output market innovation is more prevalent than product/process innovation, which is rarely conducted by HBs in the trade sector but is conducted by one fifth of the HBs in the manufacturing sector. Formal HBs are more likely than informal HBs to innovate.
The intensity of applying innovation was shown to be positively correlated with labour productivity regardless of geographical area, industry or formality status. Innovators are more likely than non-innovators to utilise the internet and have a plan to strengthen their activities in the coming year. Innovative HBs also tend to be lar-ger in size than non-innovative HBs and to be run by higher-educated and younger owners. The age of a business does not seem to affect the application of innovation among HBs.
This chapter demonstrates the existence of a dynamic segment of the HB sector. Encouraging this segment through sound policy could be an efficient way to improve productivity in the sector, in particular if spillover effects are at play. As HBs interact mostly with each other (as shown in Chapter 5), innovation can spread to the whole sector through a cascading effect.

chapter 08 | The household Businesses and the Informal sector in vietnam | 227
appENDIx Table 8.A shows changes in the association between innovation and labour pro-ductivity before controlling for other variables (Column 1) and after controlling for geographical area, informality status and industry (Column 2). Household and owner characteristics are then added as other control variables (Column 3). Because the in-ternet and planning foster both innovation and labour productivity, these variables are further added in Column 4 to examine to the extent that innovation is associated with labour productivity. In the last two columns, associations with different kinds of innovation are considered.
TABLe 8.A FACTORS ASSOCIATeD wITH HB LABOUR PRODUCTIVITY: OLS RegReSSIONS
Ln (labour productivity) (1) (2) (3) (4) (5) (6) Applies any kind of innovation 0.364*** 0.332*** 0.271*** 0.229*** (0.041) (0.041) (0.041) (0.042)
Applies product/process innovation 0.237*** (0.067)
Applies input/output market innovation 0.209*** (0.043)
Urban HB 0.057 0.075* 0.069* 0.066 0.068* (0.041) (0.041) (0.041) (0.041) (0.041)
Formal HB 0.585*** 0.534*** 0.497*** 0.498*** 0.497*** (0.044) (0.046) (0.046) (0.046) (0.046)
Manufacturing and construction 0.048 0.011 -0.007 -0.031 0.010 (0.050) (0.050) (0.050) (0.051) (0.050)
Service 0.138*** 0.154*** 0.138*** 0.113** 0.147*** (0.048) (0.048) (0.048) (0.048) (0.048)
Ln (total employment) 0.025 0.003 0.010 0.008 (0.037) (0.037) (0.037) (0.037)
Ln (owner’s age) -0.699*** -0.632*** -0.655*** -0.643*** (0.083) (0.084) (0.084) (0.084)
Owner: Lower secondary school 0.141*** 0.137*** 0.141*** 0.138*** (0.047) (0.047) (0.047) (0.047)
Owner: Upper secondary school or higher 0.131*** 0.096* 0.106** 0.100** (0.049) (0.050) (0.050) (0.050)
Age of business: 2-4 years 0.049 0.074 0.092 0.073 (0.080) (0.079) (0.079) (0.079)
Age of business: 5-9 years 0.290*** 0.316*** 0.339*** 0.314*** (0.078) (0.078) (0.078) (0.078)
Age of business: 10 years or more 0.333*** 0.375*** 0.395*** 0.378*** (0.073) (0.073) (0.073) (0.073)
Uses the internet 0.387*** 0.386*** 0.409*** (0.074) (0.075) (0.074)
Plans for future activity expansion 0.093** 0.123*** 0.097** (0.044) (0.044) (0.045)

| The household Businesses and the Informal sector in vietnam | chapter 08228
Constant 14.418*** 14.158*** 16.498*** 16.215*** 16.351*** 16.263*** (0.026) (0.046) (0.317) (0.322) (0.321) (0.321)
Observations 3,407 3,407 3,407 3,407 3,407 3,407
F-Statistics 77.0 55.0 32.0 30.0 29.0 30.0
P-value 0.000 0.000 0.000 0.000 0.000 0.000
Adjusted R2 0.022 0.074 0.099 0.107 0.103 0.106
Notes: Standard errors in parentheses; * p ≤ 10%, ** p ≤ 5%, *** p ≤ 1%.
Source: 2014/15 HB&IS survey, VASS-CAF & IRD-DIAL; Authors’ calculations

chapter 09 | The household Businesses and the Informal sector in vietnam | 229
undersTandInG household BusIness vulneraBIlITy and The challenGe of socIal proTecTIon
axel demenet
Operating a small-scale household business is risky. A particular feature of HBs is that they largely rely on a single worker’s labour input (or in the best case scenario, a few). In addition to what are considered common risks for medium and large businesses, HB activity may be negatively impacted by any adverse event that affects the owner of a HB, and sometimes even by those that affect other members from the same household. While a construction company is unlikely to suffer from a worker being ill, even though s/he has major responsibilities, an informal bricklayer will lose income for any day spent in bed – and s/he will probably lose customers as well.
In the first section of this chapter a framework for understanding HB vulnerability is developed. Exploiting a special module of the 2014/15 HB&IS survey, it describes the type of adverse events faced by HB owners, the frequency with which they occur and the coping strategies that are used. It appears that HBs frequently experience shocks and that health problems are by far the main vulnerability factor. Dealing with the resulting expenditures often implies borrowing or selling productive assets, which can have lasting consequences on a HB.
Turning to the existing social safety nets, the second section of this chapter measures the inclusion of HB owners in the social protection schemes – a ceaseless and topical challenge, as universal coverage is a clearly stated policy target. Pension and health in-surance schemes have achieved unequal progress in including HB workers. Less than 8 per cent of the HB owners will rely on Vietnamese social security (VSS), compulsory or voluntary, as their retirement pension. The overwhelming majority will have to keep on working to make a living, often hoping to receive support from family members. A persistent lack of information about the pension system hinders their inclusion, as
09

| The household Businesses and the Informal sector in vietnam | chapter 09230
does a problematic cost-benefit perception. Contributions are too expensive for the level of income that HBs generate. On the other hand, health insurance coverage has improved considerably. The remaining uninsured individuals put forward two reasons for not joining. The cost of premiums is a problem, mainly among the poorest of the informal HB owners. Among the better-off formal HB owners there is a self-selection problem. The owners do not take out insurance because they are healthy. Beyond the coverage of HB owners, evaluating progress towards universal protection also in-volves discussing the quality and accessibility of care. In this regard, it appears that (1) insured individuals utilise healthcare services more often than uninsured people, (2) overall satisfaction with healthcare is high, although some users insured through social assistance schemes are less satisfied than others, and (3) while out-of-pocket health expenditures account for a large share of the profit generated by the busi-nesses, being insured increases the amount spent and decreases the likelihood of using coping strategies such as selling assets.
1.UNDERSTaNDINg THE VUlNERaBIlITy Of HOUSEHOlD BUSINESSES
1.1. From individual risks to the vulnerability of HBs
Risks faced by HBs are twofold and can affect a business directly as well as through its owner. On the one hand, systematic risks (i.e. risks that similarly affect all HBs in the same geographical area or sector) include macroeconomic factors such as high infla-tion, supply or demand shocks and raw material availability. They also include climate-related events. Not only major catastrophes such as floods or hurricanes can affect HBs. Bad weather can affect the numerous businesses that operate outdoors (22 per cent). Finally, the legal context in which HBs operate is changing and remains largely unclear to informal HB owners (see Chapter 3), which adds to the general uncertainty of the environment. Laws and regulations change rapidly and can push many HBs that are already operating in a regulatory grey zone into an illegal position.1 On the other hand, idiosyncratic risks (i.e. risks that are peculiar to an individual), especially poor health, can affect HBs or HB owners. A specific event considered to be an idio-syncratic risk from a social protection point of view is disability due to old age, against which it is necessary to be collectively insured.
1. Street vendors, for instance, have always navigated in troubled waters regarding permission for or tolerance of their activity. They have been negotiating a ban in many preferred locales since 2008 (Turner and Schœnberger, 2012).

chapter 09 | The household Businesses and the Informal sector in vietnam | 231
Total vulnerability must be considered against this backdrop as the addition of risks faced by businesses and those faced by the individuals operating those businesses. Adverse events experienced by an individual might in turn affect the HB s/he runs through two channels: money and time. First and foremost are the direct and indirect monetary costs that result from shocks. In the case of sickness, the financial burden directly associated with treatment2 can represent a large share of the household’s budget, and transportation costs to the healthcare facility and other indirect expendi-tures such as specific kinds of food must be added (Nguyen et al., 2012b). In countries where public healthcare systems are underfunded, substantial “unofficial” payments or gifts may also augment indirect costs3 (Nguyen et al., 2012a). Overall, considering that households are budget-constrained and that household and HB budgets are of-ten mingled, large monetary costs following adverse events might crowd out expen-ditures at a household business and threaten its activity or survival. Secondly, time costs can be of importance: Taking again sickness as an example, not only does the ill individual spend time recovering, other healthy household members might have to devote time to caregiving (Sauerborn, Adams and Hien, 1996). Table 9.A in the appen-dix shows that there is indeed a decrease in both the hours and the number of days worked by individuals when they are sick.
1.2. Adverse events
The vulnerability of household businesses to shocks can be seen in Figure 9.1. HB owners reported the incidence of events that generated significant expenditures over the past 24 months – a recall period that allows capturing this kind of event. Overall, 30 per cent of the HB owners had to face at least one type of shock, either a loss of stock or harvest to theft or climate events (7 per cent), a natural disaster (2 per cent), a work-related injury (4 per cent) or a severe disease (21 per cent). The occurrence of occupational injury might seem low, only 4 per cent of the informal HB owners and 3 per cent of the formal HB owners. However, a rapid comparison with the average percentage in developed countries reveals that figures in those countries are usually lower than 1 per cent, which shows that occupational injury in Vietnam is not low in comparison.4 Poor working conditions, low capitalisation and low quality materials
2. However, not all illnesses are treated, and even when they are, the efficacy of the treatment is not assured (Sepehri et al., 2008), and such a situation generates costs.
3. This is notoriously the case in Vietnam. Even when accessing healthcare does not require immediate additional fees, they can rarely be avoided since they are later requested for “services” as simple as not sharing a bed with another patient.
4. The incidence of nonfatal occupational injury and illness cases requiring days away from work was 107.1 cases per 10,000 full-time workers in 2014 in the US (BLS, 2015).

| The household Businesses and the Informal sector in vietnam | chapter 09232
make informal jobs risky. Informal businesses and their owners are more vulnerable than formal businesses in every way, because on average they are poorer and operate under more precarious conditions.
Health shocks are by far the most common of the risks faced by workers in the in-formal sector: In the past 24 months, one informal HB owner out of four (one out of five in the formal HB sector) had to cope with significant expenses after s/he or a family member suffered from a severe disease. In addition, a third of the HB owners mentioned that health issues were a moderate to major problem. This is confirmed by the data in Table 9.1, which shows the proportion of HB owners who during the past 12 months experienced sickness that affected her/his work, even if only moderately.5 This proportion logically increases with age, is significantly higher among informal workers (which may again reflect harder working conditions) and markedly decreases with quartile of profit. If one can become poor as result of getting sick (as explained below), it seems that one might also get sick more often if one is poor.
5. The figures in Table 9.1 differ from those in Figure 9.1 because the reference period is not the same (12 months for Table 9.1 and 24 months for Figure 9.1) and because only sickness generating significant expenditures are considered in Figure 9.1.
0
5%
10%
15%
25%
30%
20%
35%
Occupationalinjury
Severedisease
Naturaldisaster
Loss of stockor harvest
At least one type of event
Informal HBs Formal HBs
FIgURe 9.1.ADVeRSe eVeNTS eXPeRIeNCeD BY HB OwNeRS wHICH geNeRATeD SIgNIFICANT eXPeNDITUReS IN THe PAST 24 mONTHS (PERCENTAGE)
Source: 2014/15 HB&IS survey, VASS-CAF & IRD-DIAL; authors’ calculations

Overall, HB owners – in particular informal ones – frequently suffer from shocks. The most frequent source of large and unexpected expenditures are idiosyncratic shocks, and health problems are by the far the most common type of shock.
1.3. Coping mechanisms and potential vicious circles
How do HB owners react when faced with such adverse events? The findings of the HB&IS survey presented in Figure 9.2 confirm previous empirical results (Sauerborn et al., 1996; MacIntyre et al, 2006) on the type and frequency of the coping strategies: (1) using cash or savings – which covers the full costs for a small minority of the house-holds only; (2) borrowing from family, friends or money lenders; and (3) selling assets.
chapter 09 | The household Businesses and the Informal sector in vietnam | 233
TABLe 9.1.INCIDeNCe OF SICkNeSS AmONg HB OwNeRS (IN THe PAST 12 mONTHS) BY Age AND BY PROFIT CATegORY (PERCENTAGE)
By age Informal Formal By profit Informal Formal HBs HBs quartile HBs HBs15-29 31.9 31.7 Q1 58.4 53.1
30-45 36.3 34.2 Q2 41.8 52.5
46-60 48.2 47.3 Q3 33.6 37.2
> 60 73.5 58.5 Q4 30.1 29.7 Total 43.3 40.7 Total 43.3 40.7
Source: 2014/15 HB&IS survey, VASS-CAF & IRD-DIAL; authors’ calculations

More than half of the HB owners who experienced adverse events in the past 24 months had to use their own cash or savings, and 39 per cent of the informal and 31 per cent of the formal HB owners had to borrow additional money, raising concerns about possible crowd-out effects for other business-related loans. Almost half of the HB owners who faced a shock (45 per cent) had to cut expenditures. While a portion of these expenditures was devoted to consumption, a portion might have been business related, which means the cut in expenditures could have a lasting influence on the HBs. Eventually, close to 9 per cent of the HB owners who had faced a shock had to sell productive assets, which may hinder their capacity to generate income in the medium and long run. In the medium run, expenditures also have an impact on the labour supply at 17 per cent of the informal HBs and 10 per cent of the formal HBs since additional family members had to start working at the household business or elsewhere. Adverse events themselves, but also the resulting coping stra-tegies, can thus have lasting negative effects on HBs.
As the vulnerability factors are mainly related to shocks that affect HB owners rather than their businesses, social protection schemes might have positive externalities that favour HB development if they effectively protect individuals against the conse-quences of those risks.
| The household Businesses and the Informal sector in vietnam | chapter 09234
0
5%
20%
30%
50%
60%
40%
70%
Sell assets Cutexpenditures
Dissave Familystarts
workling
Removechildren
fromschool
Borrow
Informal HBs Formal HBs
FIgURe 9.2.STRATegIeS FOR COPINg wITH ADVeRSe eVeNTS AmONg HB OwNeRS wHO eXPeRIeNCeD ADVeRSe eVeNTS IN THe PAST 24 mONTHS (PERCENTAGE)
Note: HB owners can rely on several strategies.
Source: 2014/15 HB&IS survey, VASS-CAF & IRD-DIAL; authors’ calculations.

2.SOCIal pROTECTION aND THE INfORmal SECTOR
The inclusion of the informal sector in both of the major components of the social protection scheme (pensions and health insurance) is challenging by nature. As put by Castel and Gian (2010), part of the challenge lies in “designing an efficient collec-tion of contributions and linking them with sufficient benefits while the majority of the jobs are […] in unregistered household businesses, implying limited information on economic activity.” One of the main outcomes of the HB&IS survey in this regard is to provide direct information about the extent to which existing schemes include HB owners, the reasons behind individual adhesion (or lack thereof ) and the effecti-veness of the coverage for insured individuals.
Health insurance and social insurance in Vietnam date back to 1992 and 1995 respec-tively. The mandatory part of the scheme, largely considered to be the core, covers public sector workers and private sector workers who have been employed for more than three months and have a labour contract. In practice these categories amount to a relatively small share of the total number of workers, as the vast majority of jobs are found in the agricultural and HB sectors, and many private and public sector workers have no contract. Voluntary schemes were accordingly introduced: health insurance in 2005 and social insurance in 2008. Vietnam is willing to develop a comprehensive system of health and social insurance and plans on achieving universal coverage of health insurance, which means covering 70 per cent of the population, by 2015.6 The results of the HB&IS survey serve to evaluate the progress of the scheme in terms of efficiently including informal sector workers.
2.1. Pension system
People are eligible to receive a retirement pension if they (1) retire after having worked in the public sector or as a wage worker in the formal sector, and thereby contribu-ted to the mandatory Vietnamese social security scheme; (2) have contributed to the voluntary scheme established in 2008, or (3) are eligible to receive social assistance.7
6. Decision 538/QĐ-TTg dated 29/3/2013 states that 70 per cent of the population should be covered by health insurance in 2015, and 80 per cent in 2020.
7. Unconditional social pensions are provided for people age 80 and above who are not covered by other pensions. Merit pensions are also provided to half a million individuals.
chapter 09 | The household Businesses and the Informal sector in vietnam | 235

| The household Businesses and the Informal sector in vietnam | chapter 09236
A first indication of the performance of the pension scheme (which is not tackled by the HB&IS survey) is the percentage of the population above 65 years old currently receiving a pension. Figures from the 2012 VHLSS (reported in Castel et al., 2014) indi-cate that less than 50 per cent of the elderly in the poorest quintiles receive any sort of pension, and those pensions are very low. While indicative of the current needs of the elderly, this approach does not inform about the performance of existing schemes that include future retirees. A second indication, about which this chapter provides new insights, is the share of the working population that is currently contributing to a scheme on which they will rely to get a pension. One fifth (21 per cent) of the wor-kers were covered in 2013, but the majority were wage workers in the formal sector (Ministry of Health, 2013). Participation in the scheme is very low among workers in the informal sector.
The HB&IS survey provide insights into the extent to which the current pension sys-tem is credible among HB owners, i.e. whether they consider the social insurance schemes to be plausible sources of future income. Figure 9.3 reports the answers to the question What will be your source of income when you are old? Those who stated that they expect to rely on the Vietnamese social security scheme imply not only that the workers contribute to the scheme, but also that they perceive the future pension level to be sufficient. A tiny minority of the household business owners (8 per cent) plan to rely on a pension from the Vietnamese social security scheme, and the percen-tage is even less (6 per cent) among informal businesses. The overwhelming majority of workers will have to continue working, either at the same job (58 per cent) or ano-ther (less tiring) job (37 per cent). The latter option is chosen by workers at informal HBs more often than those at formal HBs (38 and 34 per cent respectively), which is yet another indication of the greater arduousness of their work. 60 per cent of the informal HB owners and 63 per cent of the formal HB owners plan to receive support from family members or use their own savings. This is more widespread among formal workers, perhaps because they have a higher savings capacity.

The inclusion of the informal sector in the pension system has largely failed. Getting individuals who are not formal wage workers to participate will remain on the agenda for the coming years. The reasons why the coverage is so low despite the efforts put into enlarging the scheme have to be better understood. Figure 9.4 shows that two main problems are at stake: a deficit of information on the one hand and a cost pro-blem on the other. There is furthermore a marked difference between formal and informal HBs in the ranking order of reasons for not contributing to the VSS pension scheme. Workers at formal HBs predominantly rely on other sources income or feel that the VSS scheme is too expensive, which agrees with the problematic cost-benefit relationship and issues of trust in the fairness of the system. For workers at informal HBs, affordability, instability of income and awareness are the main reasons they do not participate in the VSS scheme. More than a third of the workers at informal HBs (but only 23 per cent of those at formal HBs) stated that they had never heard about the scheme. Similarly, 36 per cent of the informal HB owners (but only 26 per cent of those at formal HBs) consider the scheme too expensive to join.
Spreading information and enhancing the cost-benefit appraisal of participation could have a marked effect on the participation of HB workers in the pension system.
chapter 09 | The household Businesses and the Informal sector in vietnam | 237
0
10%
20%
30%
50%
60%
70%
40%
80%
Vss or statepension
Continuethis job
A less tiring job
Support fromchildren or
family
Own savings
Informal HBs Formal HBs
FIgURe 9.3.SOURCeS OF INCOme ON wHICH HB OwNeRS PLAN TO ReLY wHeN THeY ARe OLD (PERCENTAGE)
Note: HB owners can rely on several strategies.
Source: 2014/15 HB&IS survey, VASS-CAF & IRD-DIAL; authors’ calculations

2.2. Health insurance
Given the high incidence of health problems among informal workers and the po-tentially large and lasting impact of health expenditures on their business, efficient health insurance coverage has an economic prominence as much as a social one. Along the path of its transition towards a socialist-oriented market economy, Vietnam shifted from a state-funded healthcare system to a privatized user fee system (Nguyen et al., 2012a), where in 2007 out-of-pocket payments represented three quarters of the total healthcare expenditures and absorbed around 5 per cent of the total house-hold consumption on average (Van Doorslaer et al., 2007). Public healthcare is still underfunded and a private component is developing. As a consequence, the cost of healthcare is rapidly increasing, and the inclusiveness of health insurance, as well as its efficiency in covering the costs, is gaining importance and attention.
The HB&IS survey provides estimates of the inclusion of the informal sector in the health insurance schemes and allows monitoring progress in this regard. Previous figures are scarce. Castel and Gian (2010) put forward that in 2006 only 2.5 million
| The household Businesses and the Informal sector in vietnam | chapter 09238
0
5
10
15
25
30
35
20
40
I count onanotherscheme
I have never heard
about it
It is tooexpensive
I would notbe able tocontributeto it longenough
I will relyon otherincomesources
Informal HBs Formal HBs
FIgURe 9.4.ReASONS FOR NOT CONTRIBUTINg TO THe VSS PeNSION SYSTem (PERCENTAGE)
Source: 2014/15 HB&IS survey, VASS-CAF & IRD-DIAL; authors’ calculations

(or 6 per cent) of the informal sector workers and the unemployed had bought health insurance, and that until 2008 overall participation had not changed. Thanks to pre-vious HB&IS surveys, representative figures for the informal sector that are restricted to business owners exist for 2007 and 2009, but only for Hanoi and Ho Chi Minh City. 47 per cent of the HB owners knew about the voluntary scheme in 2007 and 7 per cent were participating. In 2009, less than 22 per cent had any type of health insurance.
Significant progress has been achieved over the past few years. 54 per cent of the household business owners had health insurance in 2014. A significant difference re-mains between formal and informal business owners: Only half of the informal HB owners and 61 per cent of the formal HB owners are covered. Among the available schemes (see Figure 9.5), the voluntary system was by far the most efficient way to expand health insurance coverage, as more than half of the insured HB owners use it. An important share of the informal HB owners (45 per cent) is covered through the Vietnamese social assistance scheme because they are mainly classified as poor. A large (though lesser) percentage of the formal HB owners are also insured through social assistance (33 per cent). While some workers benefit from the compulsory insurance scheme, thanks to contributing through a previous or current formal job (or because they are included in a family member’s plan), they represent less than 5 per cent of the insured individuals. Private and subsidized schemes are still marginal.
chapter 09 | The household Businesses and the Informal sector in vietnam | 239
TABLe 9.2.HeALTH INSURANCe COVeRAge AmONg HOUSeHOLD BUSINeSS OwNeRS: A COmPARISON wITH PReVIOUS FINDINgS (PERCENTAGE)
Formal HBs Informal HBs All HBs2007 Hanoi and HCMC 14.8 13.2 13.62009 Hanoi and HCMC 27.3 20.8 21.92014 Hanoi and HCMC 48.1 41.9 43.42014 Whole country 60.9 52.1 54.4
Note: All figures exclude private health insurance.Source: 2014/15 HB&IS survey, VASS-CAF & IRD-DIAL; 2007&2009 HB&IS, IRD/GSO, authors’ calculations.

Figures from the HB&IS survey also suggest a coverage gap for the near poor. When disaggregating coverage figures by profit quartile (see Table 9.3), which are correlated with household income, it appears that the percentage of insured HB owners de-creases along with profit. The lowest quartile of HB owners (which likely includes the poorest individuals) benefit from health insurance mainly through social assistance, and while the richest can afford to participate in the voluntary scheme or buy private insurance,8 those in between can do neither.
It should be stressed that although the poorest quartile of HBs are better covered than the others, only 30 per cent of them benefit from social assistance. As these are the HB owners who are most affected by sickness (see Table 9.1) and who make a profit that is less than the minimum wage (see Chapter 6), there is a call for extending social as-sistance towards this highly vulnerable segment of the HB sector or for a reallocation of social assistance. 10 per cent of the quartile of HBs that make the highest profit and 17 per cent of the third quartile benefit from social assistance.
8. Private insurance is almost nonexistent in the sample as only 1.51 per cent of HB owners have it, hence their inclusion in the same category as the compulsory VSS insurance.
| The household Businesses and the Informal sector in vietnam | chapter 09240
0
10
20
40
50
30
60
Compulsory Voluntary Private Subsidized Socialassistance
Informal HBs Formal HBs
FIgURe 9.5.TYPe OF HeALTH INSURANCe AmONg HB OwNeRS wHO HAVe A HeALTH INSURANCe CARD (PERCENTAGE)
Source: 2014/15 HB&IS survey, VASS-CAF & IRD-DIAL; authors’ calculations

The participation of half of the informal business owners in a health insurance scheme is noticeable progress, and it should be stressed that this was achieved thanks to the voluntary scheme. It is still of importance to understand the reasons why so many remain uninsured despite the clearly stated policy objective of achieving universal coverage.
Similar to the reasons given for participating in the pension system, the reasons offered by business owners for not contributing to the voluntary health insurance scheme can be seen in Figure 9.6. First, only a tiny minority of the informal workers were aware of the existence and functions of the voluntary health insurance scheme in 2007 and 2009,9 and impressive progress has been made in this regard as only 5 per cent stated that they did not know how to join or that joining is too complicated.10 Second, if universal coverage is to be achieved in the near future, there is an urgent need to rethink the cost of premiums, which are considered too expensive by 44 per cent of the informal HB owners. Third, more than one third of the HB owners without health insurance fall into the classical insurance problem known as adverse selection, i.e. not buying insurance because they are healthy, and thus plan to participate only when they get sick. Last but not least, a small share of the respondents questioned the efficacy of the insurance scheme, and they have not joined the scheme because they feel that the quality of healthcare is insufficient (6 per cent) or because they prefer to choose their doctor or facility (5 per cent) and voluntary health insurance is restrictive in this regard.
9. Figures from the 2007 HB&IS survey indicate that less than half of the HB owners knew of the existence of the voluntary health insurance.
10. Comparable figures, restricted to Hanoi and HCMC, are 6 and 7.9 per cent of the respondents respectively.
chapter 09 | The household Businesses and the Informal sector in vietnam | 241
TABLe 9.3.HeALTH INSURANCe COVeRAge AND TYPe AmONg HOUSeHOLD BUSINeSS OwNeRS BY PROFIT QUARTILe (PERCENTAGE)
Health Insurance coverage Type of scheme Informal Formal All Voluntary Assistance VSS or HBs HBs HBs privateQ1 60.3 71.2 61.9 43.4 52.2 4.4
Q2 54.4 69.6 57.9 45.4 49.7 5.0
Q3 43.1 57.1 47.5 57.3 36.7 6.0
Q4 45.2 53.2 48.5 67.4 21.8 10.8Total 52.1 60.9 54.4 51.4 42.5 6.1
Source: 2014/15 HB&IS survey, VASS-CAF & IRD-DIAL; authors’ calculations

| The household Businesses and the Informal sector in vietnam | chapter 09242
Increasing the share of the population included in health insurance schemes is only one aspect of achieving universal coverage. Other aspects include the effectiveness of the health insurance scheme in improving access to quality healthcare and redu-cing out-of-pocket payments. All are interrelated as workers’ perceptions that health insurance does not help improve access to healthcare partly determines whether they participate in the scheme or not. Does health insurance improve healthcare utilisation among HB owners? Figure 9.7 shows the probability of utilising healthcare services (by health insurance status) among individuals who stated that they have had a serious sickness. Healthcare utilisation is higher (85 per cent) among the insured HB owners than among the uninsured ones (68 per cent). However, this suggests that adverse selection is at play as well: Those who subscribed to health insurance seem to have done so because they knew that they were sick.
0
5
10
15
25
30
20
35
45
40
50
Tooexpensive
I don’tknowhow
Toocomplicated
Health service is of insu�-
cientquality
I prefer to
choose the doctor
I amhealthy
I can copewith theexpendi-
tures
Informal HBs Formal HBs
FIgURe 9.6.ReASONS FOR NOT BUYINg HeALTH INSURANCe (PERCENTAGE)
Source: 2014/15 HB&IS survey, VASS-CAF & IRD-DIAL; authors’ calculations

In addition, overall satisfaction with accessibility and quality is relatively high among the HB owners who have utilised healthcare facilities (see Figure 9.8). In terms of level of satisfaction with several aspects of healthcare utilisation, no marked differences appear between insured and uninsured individuals or between types of insurance scheme. It should, however, be stressed that uninsured individuals are slightly more satisfied than insured ones as regards the overall quality of care, the procedures and the waiting time. This difference was expected given that several types of health insu-rance (in particular in the framework of social assistance) are tied to certain healthcare facilities, the quality of which has raised concern. An explanation for the smallness of the satisfaction gap could be that uninsured individuals, given the average income in the population considered, cannot afford to go to healthcare facilities other than the insured ones anyway. One dimension in which satisfaction remains relatively low (64 per cent on average) is the complexity of the referral system that is required to access healthcare, i.e. the need to get a written order from a primary doctor to access a specialist. Being insured seems to ease some constraints given the higher level of satisfaction among those who are insured.
chapter 09 | The household Businesses and the Informal sector in vietnam | 243
0
10%
20%
30%
40%
70%
80%
90%
50%
100%
60%
Use health care &have healthinsurance
Use health care & do not have health
insurance
Informal HBs
Formal HBs
FIgURe 9.7.HeALTHCARe UTILISATION AmONg HB OwNeRS wHO HAD AN ILLNeSS wITHIN THe PAST 12 mONTHS BY HeALTH INSURANCe STATUS (PERCENTAGE)
Source: 2014/15 HB&IS survey, VASS-CAF & IRD-DIAL; authors’ calculations

Last but not least, the purpose of health insurance is to efficiently reduce the health expenditures of individuals. It is also a concern from an economic point of view if health expenditures have the potential to hurt HB activity. Table 9.3 provides the ave-rage total of health expenditures over the past 12 months before the survey, including payments not covered by insurance and all additional payments, e.g. for medicine and gifts for doctors. This provides a comparative picture of the level of out-of-pocket payments (OOP) by type of insurance. It also relates it to the annual profit generated by the businesses11 by calculating the percentage of the profit that these payments represent.
Health problems have the potential to generate large expenditures for a household, and that might in turn impact HBs. Indeed, among informal HBs, OOP health expenditures by individuals using healthcare facilities amount to 41 per cent of the profit genera-ted by their business. The percentage is higher among insured informal HB operators (47 per cent) as they expect to be reimbursed for a portion of these expenditures, but it
11. These figures do not measure the final weight of health expenditures since some of these payments will eventually be reimbursed by insurance.
| The household Businesses and the Informal sector in vietnam | chapter 09244
0
10
20
30
40
70
50
80
100
90
60
Quality of care
Accessibilityof facility
Availabilityof service
Procedure &waiting time
Referrals to access
No health insurance Subsidized or freeVSS or private
FIgURe 9.8.SATISFACTION wITH HeALTHCARe UTILISATION AmONg HB OwNeRS BY HeALTH INSURANCe STATUS (PERCENTAGE)
Source: 2014/15 HB&IS survey, VASS-CAF & IRD-DIAL; authors’ calculations

is also large (28 per cent) among the uninsured. In other words, informal HBs are parti-cularly vulnerable to health shocks and the expenditures they involve. Equivalent figures for formal HBs are less of a concern as health expenditures represent 14 per cent of the annual profit (up to 15 per cent among the insured) earned by formal HBs on average. The higher profits among formal HBs explain a large part of this difference.
The existence of health insurance does make a difference among HB owners, especially informal HBs, in the sense that they spend more on healthcare when they are covered, which implies that some individuals who are not covered cannot afford treatment. But the main (and worrying) message is that the levels of OOP health payments are overall very high in Vietnam. They amount to such a large percentage of a HB’s profit that they are likely to affect their operations or even threaten their sustainability. Health insurance is thus one of the key elements needed to reduce vulnerability among household businesses.
High levels of OOP health payments may translate into reduced expenditures for a business and trigger varied coping strategies that can lead to permanent income loss. A final way to evaluate the efficiency of the health insurance scheme is to compare the coping strategies of individuals who are seriously ill according to their insurance status (see Figure 9.9).
Insurance status is linked to household income to a large extent, and selection into insurance prevents the drawing of any causal conclusions. However, Figure 9.9 shows that insured individuals have a lower propensity to cut expenditures or sell productive assets, knowing that both measures can lead to impoverishment. A lower likelihood to sell productive assets was observed only among owners insured through the VSS (compulsory or voluntary), suggesting that those who receive social assistance are probably too poor to not sell assets when they have large health expenditures.
chapter 09 | The household Businesses and the Informal sector in vietnam | 245
TABLe 9.4.ANNUAL HeALTH eXPeNDITUReS (THOUSAND VND) AND SHARe OF THe ANNUAL PROFITS eARNeD BY HBS (PERCENTAGE)
Informal HBs Formal HBs Total % of Total % of health exp. the profit health exp. the profitNo health insurance 3,122 27.56 5,332 10.23
Health insurance 3,864 46.93 3,920 15.10Total 3,625 40.70 4,276 13.87
Source: 2014/15 HB&IS survey, VASS-CAF & IRD-DIAL; authors’ calculations

CONClUSION
Household businesses are vulnerable to a variety of factors. Their small size, together with their entanglement with the household budget, makes them particularly likely to suffer from the consequences of shocks that affect them directly. Some shocks that are experienced by and affect the owner are related to a HB’s activity, some are related to the owner’s personal life, and some are experienced by members of the owner’s family in the same household. Results from the 2014/15 HB&IS survey show that these types of shocks are frequent: In the past 24 months, 30 per cent of the HB owners had significant expenditures after a shock, and they were related to healthcare in three cases out of four. The long-term adverse effects of these shocks can be further aggra-vated depending on the coping strategy adopted: 9 per cent of the respondents had to sell productive assets.
Social insurance against risks has been on the policy agenda in recent years, espe-cially the objective of reaching universal coverage of health insurance. Of the major challenges raised, the inclusion of the informal sector is not the least. The results from
| The household Businesses and the Informal sector in vietnam | chapter 09246
0
10%
20%
30%
40%
50%
60%
70%
Sell assets Cutexpenditures
Familystarts
working
Removefrom
school
BorrowDissave
No health insurance Subsidized or freeVSS
FIgURe 9.9.COPINg STRATegIeS OF HB OPeRATORS wHO HAVe HeALTH PROBLemS BY HeALTH INSURANCe STATUS (PERCENTAGE)
Source: 2014/15 HB&IS survey, VASS-CAF & IRD-DIAL; authors’ calculations

chapter 09 | The household Businesses and the Informal sector in vietnam | 247
this chapter are thus relevant from a policy perspective and the message is positive: Impressive progress has been made in increasing health insurance coverage. More than half (54 per cent) of the HB owners are insured, and this improvement was made possible thanks to the combination of the voluntary scheme and social assistance programmes.
Further progress towards reaching universal coverage would benefit from a redefini-tion of the cost, which is currently not affordable for the poorest households, and an extension of social assistance. The cost of health insurance is indeed the main obstacle preventing informal HBs from buying health insurance. As a consequence, 38 per cent of the poorest HBs are not covered by any kind of health insurance, although they are the most vulnerable. The coverage of health insurance for these HBs could be impro-ved by an enlargement – or a better allocation – of social assistance. More than two thirds of the poorest quartile of HBs do not benefit from social assistance, while a non-negligible share of the HBs that earn the highest profit do. In addition, the long-term sustainability of the voluntary scheme is questioned by the observed phenomenon of adverse selection. It appears that the voluntary scheme is mostly subscribed to by the less healthy HB owners. Raising awareness among the HB owners who are currently healthy about the importance of being covered against health risks and thus encoura-ging them to contribute to the voluntary scheme would increase the sustainability of the scheme and make funds available for better reimbursement of health expenditures or for increasing the coverage of social assistance. Concerning the pension scheme included in social protection, progress has been par-ticularly low as participation in this scheme is almost non-existent in the HB sector. This chapter shows that inclusion in the pension scheme could be improved by pro-viding better information about the scheme, which thus far remains largely unknown. But the lack of information is not the only thing hindering the spread of this scheme. To informal HB owners, subscription to this scheme seems unaffordable, while formal HB owners find the cost-benefit relationship to be problematic. They prefer to rely on other schemes that may be more attractive or more trustworthy.

| The household Businesses and the Informal sector in vietnam | chapter 09248
appENDIx
TABLe 9.A. SICkNeSS AND LABOUR INPUT: VARIATION (/LAST YeAR) IN THe AVeRAge NUmBeR OF HOURS wORkeD PeR wORkeR AND THe NUmBeR OF DAYS wORkeD IN THe LAST mONTH
Informal HBs % Formal HBs % All (number of days worked) Sick Not sick Sick Not sick Not sick SickIncreased 8.5 8.2 4.9 6.4 Age>45 26.0 25.6
Decreased 25.0 19.3 16.1 11.4 Age<45 25.8 24.7
No change 66.6 72.5 79.0 82.2 All 25.9 25.1
Source: 2014 HB&IS survey, VASS-CAF & IRD-DIAL; authors’ calculations

chapter 10 | The household Businesses and the Informal sector in vietnam | 249
The use of socIal neTworks In The funcTIonInG of household BusInesses
laure pasquier-doumernguyen Thi Thu phuong
Various studies suggest that social networks are a key determinant of the performance of enterprises. Social network is defined here as a set of human contacts known to a business owner whom that owner would expect to support a given set of activities. Social networks play a central role in accessing inputs, in conveying information about technologies and market opportunities, in reducing uncertainty regarding reliance on partners or the productivity of prospective employees, and also in enhancing risk- sharing and informal credit arrangements (Hoang and Antoncic, 2003; Durlauf and Fafchamps, 2005; Ioannides and Loury, 2004). However, little is known in Vietnam about (1) the role played by social networks in the household business and informal sectors, and (2) about the specific effects of the different dimensions of social networks.
The first section of this chapter focuses on how household businesses use social networks to access informal and formal credit. It highlights the importance of per-sonal relationships in accessing initial credit, informal loans, trade credit and even formal loans. In the second section, the association between social network and access to physical capital, including premises and equipment, is examined. This section shows that the strength of a tie with one’s landlord is highly associated with the rental conditions and the quality of the premises. As labour is one of the main inputs of household businesses, the third section analyses to what extent a social network releases constraints that household businesses face when looking for trustworthy and productive workers. It concludes that the use of family connections is the main way to release these constraints, but this does not guarantee a worker’s productivity as the recruitment of family members is associated with family obligations and a lack of intermediaries to recruit workers. Section 4 scrutinizes the role of social networks in accessing information. It shows that social networks are not an efficient channel of information for HBs. Information is collected through a social network mostly when a
10

| The household Businesses and the Informal sector in vietnam | chapter 10250
business starts up and from close relatives. Section 5 examines whether HBs can rely on a social network as a way to be less vulnerable, and it stresses that a large tier of the HB sector is excluded from informal risk-sharing mechanisms. Section 6 concludes.
1. TO wHaT ExTENT aCCESS TO CREDIT IS SHapED By a SOCIal NETwORk
Household businesses still self-finance most of their physical capital in Vietnam as shown in Figure 10.1. For more than half of the HBs, own resources are the main source of financial capital used to start the business activity (59 per cent). In addition, three quarters of the HBs have used their own resources during the past three years of acti-vity as they have not received any large loans (a credit of more than five million VND) during that period, either because they do not need one (61 per cent) or because they cannot access such loans (14 per cent). While saving is the main way to finance HB activities, this section will demonstrate that the role of personal relationships or social network to access capital is far from being negligible. Subsection 1.1 shows that the use of informal loans obtained from personal contacts is comparable to formal loans in the financing of HBs. In addition, access to formal loans is associated with the content of social networks as illustrated in subsection 1.2. Finally, trade credit is another important source of financing for HBs, and it depends on the quality of the personal relationship between the owners of the HBs and their suppliers (subsection 1.3).

chapter 10 | The household Businesses and the Informal sector in vietnam | 251
0
10
20
30
40
50
60
70
80
Main source of initial capital
Medium credit Large credit
Formal loans
Informal usurer
Personnal contact
Own ressources
No initial capital
Formal loans
Informal usurer
Personnal contact
No need
No access in credit
93
17
59
12
1 39
71
16 14
39
61
14
For initial capital For medium and large credit
FIgURe 10.1.SOURCe OF FINANCIAL CAPITAL AmONg HBS BY TYPe OF CAPITAL (PERCENTAGE)
Note: The main source of initial capital was determined by asking the owners What were the main sources of funding for the start of your activity? Medium credit was determined by asking During the last 6 months, how many loans of between 200,000 to 5 million VND have you obtained from formal or informal lenders for your activity? and large credit was determined by asking During the last 3 years, how many loans greater than 5 million VND have you obtained from formal or informal lenders for your activity? For large credit the category “No need” included owners who did not obtain any loans because they did not apply for any and stated that they did not apply because there was no need to do so. The category “No access to credit” refers to owners who did not obtain any loans because (1) they unsuccessfully applied for a loan or (2) they did not apply for a loan because they did not think they could get one. For medium credit, not needing a medium loan and not having access to credit cannot be distinguished because the reason why owners did not apply for a medium loan was not asked during the survey. Owners who did not apply for medium loans were divided into the two groups according to the same breakdown observed for large credit.
Source: 2014/15 HB&IS survey, VASS-CAF & IRD-DIAL; authors’ calculations

| The household Businesses and the Informal sector in vietnam | chapter 10252
1.1. Importance of a social network in facilitating access to informal loans
Informal loans are typically available more quickly and on more flexible terms than formal ones, and they then play a particular role in the financing of HBs. Figure 10.1 shows that HBs rely more often on their social network, defined as their personal contacts, to raise funds when they start their business than on the formal credit market. Indeed, 17 per cent of the HBs used loans or gifts from their relatives or friends as the main source of financing when starting their business, while only 9 per cent took out formal loans. Medium or large loans from personal contacts are used by nearly one out of ten HBs to finance operating costs or activity development. The formal credit market was accessed by a barely higher proportion: Over the past 3 years, 14 per cent of the HBs took out loans of over 5 million VND from a bank, microfinance institution or mass organization to finance their activities, even though the amounts requested were higher for formal loans (see Chapter 7).
In order to identify the characteristics of HBs that use social networks to access informal credit, we estimated the probability of obtaining a loan larger than 5 million VND from personal contacts.1 This probability was estimated using a probit model and by control-ling for geographic area of an HB, its registration status, its industry, its size in terms of workers and in terms of value added, its duration, the education level of the owner and the age of the owner. This analysis is limited to large loans as they account for 90 per cent of the total amount of loan applications (see Chapter 7). The results are presented in the appendix (see Table 10.A, Model 1). We find that formal HBs and HBs with higher value added are more likely to rely on loans from personal contacts than informal busi-nesses or businesses that generate low added value. This is mostly because informal and small businesses are more likely to self-finance their activity.2 Another interesting result is that the use of one’s social network to access credit is associated with the early stages of development of a business: Longstanding HBs (10 years or more) are less likely than younger HBs to borrow money from personal contacts. In contrast, older HBs and owners rely more on their own resources that they have been able to accumulate over time,
1. The reference for this probability is not having a loan larger than 5 million VND or having this kind of loan but from a formal source of credit or usurer.
2. This is shown by the results of a multi-logit estimation of the probability of taking out loans from personal contacts versus the probability of using his/her own resources or the probability of relying on formal loans or informal loans from a usurer (see the results in the appendix, Table 10.A, Model 2). The probability of relying on own resources versus taking out large loans from personal contacts is significantly higher for informal HBs than for formal HBs. In contrast, formal HBs are not significantly associated with the probability of having large loans from the formal market or a usurer instead of from personal contacts. HBs in the lowest quartile of value added have a higher probability of using their own resources instead of borrowing money from a personal contact compared to those in the other quartiles (especially the fourth one, where the coefficient is significant at the 5% level).

chapter 10 | The household Businesses and the Informal sector in vietnam | 253
but they take out more formal loans as well, perhaps because formal credit institutions see long-established businesses as a low risk (see Model 2 in the appendix). HBs in the service sector are less likely to rely on personal contacts to get large loans. In both rural and urban areas, neither the number of workers nor the education level of the owner are significantly associated with the likelihood of relying on personal contacts for large loans.
What we now have to consider is on whom the owners of HBs rely in their social network to access informal loans. Figure 10.2 shows that most of the personal contacts used to access informal loans are family members and relatives. The use of one’s family to access credit is the most common way to get the initial capital for a HB. 89 per cent of the contacts mobilized to raise funds are family members, meaning that 15 per cent of the HBs started their business with family funds as the main source of financing. 3The share of relatives in one’s social network used to access informal loans of more than 5 million VND is high as well (76 per cent). While the bulk of the family members who provide credit at the start of a business are very close relatives (79 per cent are a parent, sibling, child or spouse), 41 per cent of the family members who lend large amounts of money are distant relatives (see Figure 10.3).
Friends, neighbours and business contacts play a role in accessing informal credit, but only informal medium loans, i.e. loans of 200,000 to 5 million VND, are provided by personal contacts (see Figure 10.2). They provide almost half of the medium loans (43 per cent) and only 24 per cent of the large loans. Thus, non-family contacts may be mobilized as well, but mostly when the amount is low (less than 5 million VND) and the financial commitment is weak. In addition, when personal contacts other than family members are mobilised, these persons and the owner are linked through strong ties. The strength of these ties is defined by a high frequency of contact and an intimate relationship.4 The owner meets the non-family members who provide medium loans at least once a week in nine cases out of ten. For the providers of large loans who are not family members, the frequency of contact is at least once a month for large loans in nine cases out of ten, and they usually have an intimate or very intimate relationship5 (80 per cent in the case of medium loans and 83 per cent in the case of large loans).
3. This proportion corresponds to 89 per cent of the 17 per cent of the HB owners who relied on personal contacts as their main source of financing when they started their business (see Figure 10.1).
4. To measure the strength of the ties, the name generator methodology was used. We asked the owners to provide a list of names of those who had provided them with a loan or credit. Further questions about the characteristics of the cited persons, as well as the relationships between these persons and the owner, were then asked. Frequency of contact was measured by asking How often do you meet [name of the contact]? Intimacy of the relationship was measured by asking What is the level of intimacy you have with [name of the contact]?
5. “Thân thiết” or “Rất thân thiết.

| The household Businesses and the Informal sector in vietnam | chapter 10254
0 %
10 %
20 %
30 %
40 %
50 %
60 %
70 %
100 %
80 %
90 %
Initial capital Medium credit Large credit
Business contact Friend Neighbour Family
FIgURe 10.2.COmPOSITION OF SOCIAL NeTwORkS BY TYPe OF INFORmAL CReDIT (PERCENTAGE)
Source: 2014/15 HB&IS survey, VASS-CAF & IRD-DIAL; authors’ calculations
0 %
10 %
20 %
30 %
40 %
50 %
60 %
70 %
100 %
80 %
90 %
Initial capital Medium credit Large credit
Other family member
SiblingParent (father, mother)
Child of the head,spouse
FIgURe 10.3.COmPOSITION OF FAmILY NeTwORkS BY TYPe OF INFORmAL CReDIT (PERCENTAGE)
Source: 2014/15 HB&IS survey, VASS-CAF & IRD-DIAL; authors’ calculations

chapter 10 | The household Businesses and the Informal sector in vietnam | 255
1.2. Importance of a social network in facilitating access to formal loans
Accessing formal loans is highly correlated with the social network of HB owners as well. Formal loans are defined as loans of over five million VND provided by banks, mass organizations or micro-finance institutions. 14 per cent of the HB owners rely on such loans (see Figure 10.1). The results shown in Table 10.1 stress that owners who have access to formal loans are much more likely to have a close relationship with employees at a formal bank, with leaders of mass organizations or with members of the Communist Party. Almost a fifth of them (18 per cent) can contact at least one em-ployee at a formal bank at any time, including at night, for help, while only 7 per cent of the owners without access to formal loans can do so. The same gaps are observed when the relationships with mass organisation leaders or Communist Party members are considered. The significant association between having a formal loan and having a close connection with a bank employee, mass organisation leader or Communist Party member remains true when controlling for the characteristics of HBs, and the association is stronger for a close connection with a bank employee.6
This result generalises the findings of other authors based on case studies in Vietnam or other segments of the labour market. Le Ngoc and Nguyen Thang (2009) have demonstrated that utilising a relationship with government officials for business purposes significantly increases the probability of getting a bank loan. Their study is based on a small and non-representative sample of 230 registered and private small and medium manufacturing enterprises. By using the 2006 Vietnam Provincial Competitiveness Index (PCI) Survey, a survey of 6,400 registered private enterprises, Malesky and Taussig (2008) found evidence that banks place greater value on connec-tions than performance.
6. We estimated separately the effect of these three close connections on the probability of getting a formal loan with a probit model and by controlling for the geographical area of the HB, its registration status, its industry, its size in terms of workers, its size in terms of value added, its duration, the education level of the owner and the age of the owner. We found that having this close connection had a positive and significant effect on the probability of getting a formal loan of more than 5 million VND during the last three years. The results are presented in Table 10.B in the appendix.

In a context of a high degree of uncertainty in a business environment and a lack of reliable business information, recommendations by bank employees or government officials is one way used by banks to collect information about the creditworthiness of a business. Nguyen Thang et al. (2006) showed through 23 in-depth interviews with bankers of state-owned and private banks in Vietnam that the use of a personal rela-tionship with a banker or a government official is a trust-building mechanism between a bank and a business owner. Thus, networking with a bank employee or government official enhances accessibility to formal loans by helping HBs improve their legitimacy.
1.3. Importance of social networks in facilitating access to trade credit
Trade credit is another source of financing for HBs. It refers to the facilitation by the supplier of the purchase of supplies without immediate payment. Trade credit is com-monly used by HBs as a source of short-term financing. Around one third of the HBs (34 per cent) benefit from trade credit in the form of late payment from their main supplier, and this proportion increases to two thirds (68 per cent) when HBs that work with many suppliers and do not have a main one are excluded.
What then is the relationship needed between an HB owner and a supplier to grant the HB a trade credit? The comparison of the ties between HB owners and their sup-pliers when they are engaged in trade credit and when they are not provides some insights into this question.7 Table 10.2 shows that trade credit is more often granted to
7. This analysis only includes owners who stated that they have one main supplier (839 observations) and it excludes the ones who said that they have many suppliers and no main supplier.
| The household Businesses and the Informal sector in vietnam | chapter 10256
TABLe 10.1.SOCIAL NeTwORkS OF HB OwNeRS BY ACCeSS TO FORmAL LOANS AND BY AReA (PERCENTAGE)
Source: 2014/15 HB&IS survey, VASS-CAF & IRD-DIAL; authors’ calculations
All Rural UrbanOwners can contact Owners Owners Owners Owners Owners Ownersthe following people without with a without with a without with aat any time, including a formal formal a formal formal a formal formalat night loan loan loan loan loan loan
Bank employees 7.3 17.6 7.3 15.4 7.3 20.7
Mass organisation leaders 18.5 28.5 21.5 29.8 14.8 26.7
Communist Party members 9.5 15.5 10.7 14.0 8.0 17.5

owners who maintain a close and strong relationship with his/her supplier. Trade credit is provided when there is an intimate relationship between the owner of an HB and his/her supplier much more often than when there is no such relationship (44 per cent and 16 per cent of the time respectively). Around one third of the owners who benefit from trade credit interact with their supplier through social events (e.g a Lunar New Year celebration or a wedding), and less than one fifth of the owners who do not receive trade credit interact in such a way with their supplier. Concerning informal loans, trade credit is associated with frequent contact. Strong ties with one’s suppliers establishes business trust and access to trade credit. Owners thereby influence their suppliers’ per-ception of the likelihood of payment default and the likelihood that they will honour contracts since the social sanctions in the case of payment default may be too high for a HB owner. This has already been shown by McMillan and Woodruff (1999), but with non-representative data at the national level and for the private enterprise sector only.8
8. More precisely, they used surveys of 259 medium and large manufacturing enterprises that were registered (the median firm had 32 employees). The data covered Hanoi and Ho Chi Minh City.
chapter 10 | The household Businesses and the Informal sector in vietnam | 257
TABLe 10.2.CHARACTeRISTICS OF THe TIeS BeTweeN AN OwNeR AND HIS/HeR mAIN SUPPLIeR wHeN THe SUPPLIeR OFFeRS TRADe CReDIT AND wHeN He/SHe DOeS NOT (PERCENTAGE)
The supplier … Trade credit No trade credit
Has another relationship with the owner 15.3 10.2
Is not a family member or a friend 84.7 89.8
Lives in the same neighbourhood 32.0 32.4
Lives more than 2-3 km from the owner 68.0 67.6
Knew the owner before the start of the business 34.1 31.0
Knew the owner after the start-up phase 65.9 69.0
Sees the owner at least once a week 64.1 48.6
Sees the owner less frequently than once a week 35.9 51.4
Is intimate with the owner 43.9 16.2
Is not intimate with the owner 56.1 83.8
Invites the owner over during Têt 30.1 13.9
Does not invite the owner over during Têt 69.9 86.1
Is invited by the owner to family events (a new house, a wedding) 37.3 17.5
Is not invited by the owner to family events 62.7 82.5
Invites the owner to family events (a new house, a wedding) 37.3 19.9
Does not invite the owner to family events 62.7 80.1
Source: 2014/15 HB&IS survey, VASS-CAF & IRD-DIAL; authors’ calculations

| The household Businesses and the Informal sector in vietnam | chapter 10258
Even more interestingly, the strength of the ties between an owner and his/her suppliers counts more towards getting trade credit than business characteristics, in particular its financial standing. Indeed, the coefficient of the intimate relationship variable (whether it exists or not) is much higher than the coefficients of the size of the business, its sector of activity, its duration or even its formality status when the probability of getting trade credit is estimated with a probit model (see Table 10.C in the appendix, Model 6).
In this section, we have demonstrated the importance of a social network in facilita-ting access to financial capital, especially at the early stage of development of a HB. Household businesses rely more often on their social network to raise funds at the start of a business than on the formal credit market, and loans from personal contacts are used by one out of ten HBs to finance their activities. Social networks even facili-tate access to formal loans since connections are a channel used by formal institutions to collect information about the creditworthiness of an HB. In addition, the use of social networks to facilitate access to credit may be a source of inequality since the social networks mobilised to access informal credit are mostly constituted of family members. The capacity to access credit from a network depends therefore on the wealth of the family. Finally, access to all kinds of credit is associated with strong ties with the lender.
2.SOCIal NETwORk aND aCCESS TO pHySICal CapITal
A premises is one of the main assets of a HB. It is therefore important to examine whether a social network facilitates access to a premises. Only HBs with a professio-nal premises (i.e. a permanent premises in a market, workshop, shop, restaurant or hotel) are taken into consideration in this analysis.9 They account for 28 per cent of the HBs (see Chapter 3). Accessing an adequate professional premises is challenging in the context of Vietnam as one out of five HBs with a professional premises complain about the quality of their premises (e.g. a lack of space or the premises is inadequate for their activities). Almost half of the HB owners with a professional premise (41 per cent) do not own their premises. What then is the relationship they have with their landlord, and does this relationship facilitate access to the premises?
9. Access to a private home (45 per cent of the premises) follows a different logic than access to a professional premises. It depends less on the market (most households own their home) and is more related to household characteristics than to business characteristics.

chapter 10 | The household Businesses and the Informal sector in vietnam | 259
Here again, family plays a key role in facilitating access to a professional premises, espe-cially in rural areas and for informal businesses, where more than half of the landlords are family members (see Table 10.3). Formal businesses and urban businesses rely more on the market to get their premises since one out of two has no personal relationship with their landlord.
TABLe 10.3.ReLATIONSHIP BeTweeN THe OwNeR AND THe LANDLORD OF HIS/HeR PROFeSSIONAL PRemISeS BY AReA AND FORmALITY STATUS (PERCENTAGE)
All Rural Urban Informal Formal
Close family members 28.5 38.6 19.8 30.4 25.0
Other family members 20.6 23.7 18.0 23.5 15.7
Neighbours or friends 10.8 9.0 12.3 10.8 10.8
Other contacts 40.1 28.7 49.9 35.3 48.6
Source: 2014/15 HB&IS survey, VASS-CAF & IRD-DIAL; authors’ calculations
TABLe 10.4.ReNTINg CONDITIONS BY CHARACTeRISTICS OF THe TIeS BeTweeN OwNeRS AND THe LANDLORDS OF THeIR PROFeSSIONAL PRemISeS (PERCENTAGE)
Have a problem with Have to pay rent the premises (e.g. a lack of space or it is inadequate)
Close family member 9.7 12.6
Other family member 42.9 49.7
Neighbour or friend 46.9 95.5
Business contact 31.6 95.6
Intimate 29.3 45.6
Not intimate 29.5 90.9
Same neighbourhood 27.5 53.3
Not the same neighbourhood 34.4 81.3
All 29.3 62.5
Source: 2014/15 HB&IS survey, VASS-CAF & IRD-DIAL; authors’ calculations

Table 10.4 shows that a close relationship with the landlord provides the owner with better rental conditions. Owners complain more about their premises when the landlord is a neighbour, a friend, a person with whom they have a business relationship or even a distant relative than when it is a parent, a sibling or a child. Having no family relationship implies having to pay rent. Only half of the distant relatives and 13 per cent of the close relatives ask for rent. Having an intimate relationship with the landlord does not make a difference in terms of whether a premises is adequate or not, but it does al-low one to use the premises free of rent more often (50 per cent of the time, compared to only 10 per cent when the ties are not intimate). Living in the same neighbourhood as the landlord is almost as advantageous as being intimate with the landlord in terms of rent, and this guarantees a more adequate premises as well.
Tools and equipment are another important kind of physical capital for HBs, especially in the manufacturing sector. When tools or machinery break down, HB owners have to borrow other ones from someone else to ensure continuous production. Borrowing tools and machinery is useful as well when a specific and punctual production process is required. For this reason, owners were asked whom they can borrow tools and ma-chinery from when they are in need. In the manufacturing sector it appears that only a minority of the HB owners (19 per cent) have contacts who will lend them this physical capital,10 and this kind of support is more prevalent in rural areas than in urban areas (21 per cent and 17 per cent respectively) and among informal businesses than formal ones (21 per cent and 14 percent respectively). Interestingly, neighbours are the main provider of this kind of support in rural areas and among informal businesses (see Table 10.5). The predominance of clusters of manufacturing activities in rural Vietnam may explain this. In urban areas and among formal businesses, however, family is again the main form of support.
10. The question asked was If you need to borrow tools or machinery for your business, who would you ask (excluding members of your household)? 81 per cent of the owners answered “Nobody.”
| The household Businesses and the Informal sector in vietnam | chapter 10260

Thus, we have shown in this section that personal relationships are a key determi-nant of access to professional premises as the strength of the ties with the landlord shapes the rental conditions as well as the quality of the premises. In contrast, a social network is rarely used for temporary use of tools or machinery, and when it is, geogra-phical proximity conditions this interaction in rural areas and for informal businesses, while family is the main form of support for other businesses.
3.SOCIal NETwORk aND aCCESS TO laBOUR
Most of the workers in the household business sector are family members. Half of the employees (excluding the spouse) are linked to the owner by family relationship, and this proportion is around one third for wage workers (see Figure 10.4). The use of family labour is even more widespread among informal HBs, and it is associated with small businesses (particularly in terms of value added), with longstanding businesses and with trade activity.11 Why do HBs rely so massively on family labour in Vietnam? The literature provides two explanations (Nguyen and Nordman, 2014). First, house-hold businesses hire family labour because the strong ties linking the owner and the worker make the family workers more trustworthy and more flexible than non-related
11. Positive and significant associations were identified by estimating for all the workers at an HB the probability of a worker being a family member versus being a non-family member by the geographical area of the HB, its registration status, the sector it is in, its size in terms of workers, its size in terms of value added, its duration, the education level of the owner and the age of the owner. A probit model was used for this estimation and the results are provided in Table 10.C in the appendix (see Model 7).
chapter 10 | The household Businesses and the Informal sector in vietnam | 261
TABLe 10.5.ReLATIONSHIP BeTweeN THe OwNeRS OF mANUFACTURINg HBS AND THe POTeNTIAL LeNDeRS OF TOOLS AND mACHINeRY BY AReA AND FORmALITY STATUS (PERCENTAGE)
All Rural Urban Informal Formal
Family 31.9 28.6 40.0 29.1 47.9
Neighbour 35.0 39.5 23.7 36.0 28.9
Friend 17.8 11.9 32.4 19.0 10.8
Business contact 15.3 19.9 3.9 15.9 12.3
Total 100 100 100 100 100
Note: The population is the owners of manufacturing HBs who stated that they have someone from whom they can borrow tools and machinery when needed.
Source: 2014/15 HB&IS survey, VASS-CAF & IRD-DIAL; authors’ calculations.

| The household Businesses and the Informal sector in vietnam | chapter 10262
workers. But it might also be the case that HB owners have no other choice than to hire family members. This constraint may be due to a lack of labour market interme-diaries who are able to convey information about workers and jobs, but it may also be due to the fact that HBs sometimes hire family workers as a way to repay them for their past financial support or, more generally, to comply with a social obligation. How employing family members affects an HB’s performance differs substantially accor-ding to these two explanations. According to the first explanation, employing a family member has a positive effect on the performance of a business, and according to the second explanation, the effect would be negative. The 2014/15 HB&IS survey provides evidence of the relative importance of these two channels in Vietnam.
A look at how HB owners perceive the trustworthiness of family workers and the pres-sure put on them by their family to employ family members gives a first insight into this question. Owners were asked whether they agree with the following statements: Among employees, family members are more trustworthy than non-family members and if a family member asks me to help him/her by hiring one of his/her family members, I have to do it if I can. Figure 10.5 suggests that both explanations for the preponderance of family labour in the HB sector hold true in Vietnam. More than half of the owners feel that family workers are more trustworthy than other workers, and this propor-
0 %
10
20
30
40
50
60
70
Employees Wage workers
Informal
59
All
54
Rural
58
Urban
51
Formal
48
All
32
Rural
36
Urban
28
Informal
33
Formal
31
FIgURe 10.4.SHARe OF FAmILY memBeRS AmONg emPLOYeeS AND AmONg wAge wORkeRS BY AReA AND FORmALITY STATUS (PERCENTAGE)
Source: 2014/15 HB&IS survey, VASS-CAF & IRD-DIAL; authors’ calculations

chapter 10 | The household Businesses and the Informal sector in vietnam | 263
tion is even larger when a business has wage workers. Meanwhile, almost the same proportion of owners stated that they have to hire a family member in cases where they feel pressure from their family to do so, thus highlighting the existence of strong obligations towards one’s family.
Objective data on the trustworthiness of family workers allows us to go further in this analysis. Owners with employees were asked who, apart from them, handles the cash in the business, and to whom they can entrust their business when they have to go away for a couple of days.12 Table 10.6 shows that the probability of having a trustwor-thy person to handle the cash or manage the business is higher for HBs where family members work: 76 per cent of the owners with family employees have a trustworthy person to handle the cash compared to 58 per cent of the owners without family employees. 67 per cent of the owners of HBs with family employees have someone whom they can entrust the business to and 53 per cent do not. By looking in greater detail at these results, it appears that in general trustworthy persons are mostly family
12. This latter question was asked of manufacturing, construction and service businesses only, excluding trade businesses.
0
10
20
30
40
70
50
80
90
60
All With a wage worker Without a wage worker
6055
72
80
5852
Family member is more trustworthy Family obligation to hire a familymember
FIgURe 10.5SHARe OF HB OwNeRS wHO AgRee OR STRONgLY AgRee wITH STATemeNTS ABOUT FAmILY LABOUR BY wHeTHeR OR NOT THeY HAVe wAge wORkeRS (PERCENTAGE)
Source: 2014/15 HB&IS survey, VASS-CAF & IRD-DIAL; authors’ calculations

| The household Businesses and the Informal sector in vietnam | chapter 10264
members: When the owner has someone whom he/she can trust, this person is a family member more than 80 per cent of the time. Family members can be mobili-sed by the owner even if they do not work for the business. Considering employees only, including wage workers and unpaid family members, almost three quarters of the trustworthy employees are family members, and half of them are very close family members (a spouse, siblings, parents or children). This suggests that family labour is involved to a greater extent in management and supervisory tasks than hired labour, and, as found by Nguyen and Nordman (2014) using the Vietnamese Household Living Standards Survey (VHLSS) panel data, hired labour is not a substitute for family labour.
Finally, we explore the explanation that the preponderance of family labour in the HB sector is due to a lack of labour market intermediaries to find workers. The use of an intermediary to recruit a worker is marginal in the Vietnamese HB sector. Only 11 per cent of the businesses with at least one employee have found employees through
TABLe 10.6.INDICATORS OF TRUSTwORTHINeSS OF emPLOYeeS ACCORDINg TO THeIR ReLATIONSHIP wITH THe OwNeR AmONg HBS wITH emPLOYeeS, eXCLUDINg THe SPOUSe (PERCENTAGE)
At least one family No family All worker other than workers the spouse
Someone else can handle cash in the business 75.9 57.4 70.4The person who can handle cash is… An employee and close family member 39.2 0.0 29.6
An employee and other family member 11.7 0.0 8.9
An employee and not a family member 1.6 54.0 14.4
Not an employee/is a family member 46.8 42.7 45.8
Not an employee and not a family member 0.8 3.3 1.4
Total 100 100 100
HB can be entrusted to someone else 67.1 52.5 62.3The person to whom the business can be entrusted is… An employee and close family member 45.6 0.0 34.2
A employee and other family member 13.9 0.0 10.4
An employee and not a family member 7.2 48.7 17.6
Not an employee/is a family member 32.5 47.8 36.4
Not an employee and not a family member 0.7 3.5 1.4
Total 100 100 100
Source: 2014/15 HB&IS survey, VASS-CAF & IRD-DIAL; authors’ calculations

chapter 10 | The household Businesses and the Informal sector in vietnam | 265
an intermediary, and this intermediary was a relative in more than a quarter of the cases (friends, neighbours and middlemen otherwise). The main method of recruit-ment is direct contact between the employer and the employee (88 per cent of the employees were recruited directly). Thus, the bulk of the owners have to find the workforce that they need among the people they know. Limited use of intermediaries to find workers was confirmed by the answer to a question asked of owners without workers: If you needed to recruit a worker, who would you ask to help you find one? Only 5 per cent of them would ask someone to help them, and they would most often request assistance from family members (in 58 per cent of the cases).
This section demonstrates the predominance of using one’s family network to access labour. It suggests that three kinds of explanation are at play simultaneously. House-hold business owners recruit mostly family members because they are more trustwor-thy, but also because they face family obligations to do so and because the use of an intermediary to access workers outside the family is almost non-existent.
4.SOCIal NETwORk aND aCCESS TO INfORmaTION
In the context of a lack of institutional support to enter the labour market or to improve their production conditions, the strategy of HBs could be to rely on social networks to access information about market opportunities, innovation, suppliers and clients. By using innovative questions introduced in the 2014/15 HB&IS questionnaire, this subsection aims to stress how and to what extent information is conveyed through social networks.
Three types of information are examined here. The first type is information needed at the start of a business to evaluate market opportunities or the requirements of the targeted market. Owners were asked whether they had received advice when they started their business and from whom. Secondly, personal contacts who provided information about innovation were identified among HBs which have introduced innovative measures at their business during the past year (see Chapter 8). Finally, the use of a social network to create business relationships, more precisely to find new suppliers or customers, was determined by asking owners whether they have someone to help them with that. Table 10.7 presents the extent of the use of a social network for these three types of activity.

| The household Businesses and the Informal sector in vietnam | chapter 10266
One fourth of the household businesses use their social network to access informa-tion. However, a social network is primarily used for collecting information at the start of a business. Meanwhile information about innovation or the creation of business relationships is rarely provided by personal contacts, and only 5 per cent of the HBs have a resourceful person who can act as an intermediary and reach new customers or suppliers. This proportion is very low considering that almost half of the HBs sta-ted that they face problems selling their products, and 18 per cent have problems with the supply of raw materials (see Chapter 11). Therefore, almost no information is channelled through a social network, except at the start of a business. We will focus our analysis on the role of social networks in conveying information at the start of a business.
There is no big gap in accessing information through a social network at the start of a business among different types of HBs. The only significant difference among HBs is observed across industries. Social networks play a less significant role in the trade sector as only 16 per cent access information through this channel compared to 26 per cent in the manufacturing sector and 21 per cent in the service sector. To better understand the characteristics of HBs associated with this channel of information, an estimation of the probability of using a social network to access information at the start of a business is applied.13 While HBs in the trade sector appear to use this channel of information less often than HBs in other sectors of activity, formal HBs are associa-ted with higher use of social networks than informal ones once other characteristics are controlled for, and young entrepreneurs rely more on social networks to collect information. Other characteristics are not significantly associated with the likelihood of having access to advice at the start through one’s social network.
13. These characteristics are the geographical area of the HB, its registration status, its industry, its size in terms of workers, its size in terms of value added, it duration, the education level of the owner and the age of the owner (see Table 10.C, Model 8 in the appendix).

As a social network is a channel for information at the start of a business, the question then is to know who in the social network provides such information. It is clear from Table 10.8 that one’s family network is the main provider of such information (60 per cent), especially in the trade sector and in the formal sector. In a family network, the parents of the business owners are the main source of information, and they account for 22 per cent of the contacts used to collect information at the start. However, the importance of bu-siness partners is not insignificant as they account for 20 per cent of the connections who provide advice at the start, followed by friends (13 per cent) and neighbours (7 per cent).
chapter 10 | The household Businesses and the Informal sector in vietnam | 267
TABLe 10.7.ACCeSS TO INFORmATION THROUgH A SOCIAL NeTwORk AmONg HOUSeHOLD BUSINeSSeS (PERCENTAGE)
All Rural Urban manuf. Trade Service Informal Formal
Information at start of business 20.4 21.6 18.9 25.4 15.7 21.3 19.6 22.4
Creation of business relationships 5.1 6.5 3.4 6.0 5.1 4.4 4.4 7.0
Innovation in products and technology 2.2 2.1 2.3 4.5 0.3 2.5 2.1 2.6
Information in general 25.3 27.1 23.1 31.9 20.4 25.5 24.0 28.9
Source: 2014/15 HB&IS survey, VASS-CAF & IRD-DIAL; authors’ calculations
TABLe 10.8.COmPOSITION OF THe SOCIAL NeTwORk THAT PROVIDeS INFORmATION AT THe START OF A BUSINeSS (PERCENTAGE)
All manuf. Trade Service Informal Formal
Family network 60.5 61.1 67.5 55.5 57.1 68.4In which
Parent 22.2 13.4 35.6 21.4 20 27.2
Spouse and children 9.3 14.5 4.9 7.4 8.3 11.5
Sibling 13.2 14 12.7 12.9 11.8 16.5
Other family member 15.8 19.2 14.3 13.8 17 13.2
Non-family network 39.5 38.9 32.5 44.6 43 31.6In which
Neighbor 6.8 7.7 5.8 6.7 8 4
Friend 13.1 11.3 9.4 17 13.8 11.5
Business contact 19.6 19.9 17.3 20.9 21.2 16.1
Total 100 100 100 100 100 100
Source: 2014/15 HB&IS survey, VASS-CAF & IRD-DIAL; authors’ calculations

| The household Businesses and the Informal sector in vietnam | chapter 10268
It is interesting to see what characterizes the relationships within the non-family network that provides advice at the start of a business. Neither level of intimacy nor frequency of contact is particularly high, as illustrated in Table 10.9. The same holds true for the strength of the ties, which are measured by invitations to important events like celebration of the New Year (Tet), building a new house and weddings. Advice is provided by established acquaintances who knew the owner before the start of the HB (83 per cent), from working together elsewhere (21 per cent) or by people who are introduced by another acquaintance (11 per cent). In addition, 70 per cent of the contacts who provide information are in a better economic situation than the owner.
To sum up, the survey shows that almost no information is channelled through social networks, except at the start of a business, and then the transmission of information is mostly through family members. The fact that there is almost no other source of in-formation than one’s social network (for example, formal associations do not provide any help collecting information ) stresses the urgency to develop other channels of information, particularly those that are able to convey innovative information and not mostly information related to the experience of past generations.
TABLe 10.9.CHARACTeRISTICS OF NON-FAmILY CONNeCTIONS wHO PROVIDe ADVICe AT THe START OF A BUSINeSS (PERCENTAGE)
The contact Yes No
Lives in the same neighbourhood 32.1 67.9
Sees the owner at least once a week 35.9 64.1
Is intimate with the owner 63 37
Is invited to visit the HB family during Tet 46.6 53.4
Is invited by the HB to a family event like building a new house 54.6 45.4
Invites the HB to visit during Tet 58.5 41.5
Knew the HB owner before the business started 83 17
Is in a better position 70.1 29.9
Source: 2014/15 HB&IS survey, VASS-CAF & IRD-DIAL; authors’ calculations

chapter 10 | The household Businesses and the Informal sector in vietnam | 269
5.SOCIal NETwORk aND VUlNERaBIlITy
As shown in Chapter 9, HBs are highly vulnerable to others shocks, especially a health shock. In this context, one’s social network may be an essential element of resilience to shock among HB owners, e.g. through risk-sharing arrangements or self-insurance. One question examined here then is to what extent HBs can rely on their social network to cope with shocks in Vietnam.
In addition, expanding the coverage of the social security systems for the informal sector in Vietnam is a core objective of the new master plan. Social networks may play a key role in the attainment of this objective, as informal insurance may crowd out the demand for formal insurance. This section will investigate these two questions.
To find out whether HBs can rely on their social network to cope with shocks, three risk-sharing mechanisms based on social networks are examined. The first is to ask per-sonal contacts for financial support if the business experiences difficulty. Unlike infor-mal loans, this support usually does not require paying interest, and when it does, the interest rate is very low. But this kind of support requires knowing people who have the necessary financial resources and having an intimate or reciprocal relationship with them. HBs owners answered the following question: Who could provide you with financial support for your business (i.e. lend you money and either not charge interest or charge only low interest)? The proportion of owners who can rely on such support from their network is very low, only a third (see Table 10.10), highlighting the high degree of vulnerability of HBs. Urban HBs are even more vulnerable than rural ones. In addition, this support comes mainly from the family (74 per cent of the time), and support from friends or business contacts accounts for only 12 per cent and 6 per cent respectively.
A second form of support from one’s social network that can help a HB cope with shocks is receiving a non-negligible amount of money for a very short term, whatever the interest rate may be. HB owners were asked whether they could borrow 5 million VND within a week. This amount is nearly twice the median monthly value added among informal HBs (see Chapter 6). The conditions for this support may be different than the previous kind because it does not necessarily entail strong or reciprocal ties. This may be the reason why the proportion of owners benefiting from this support is higher, as half of them are able to collect this amount in seven days. However, 50 per cent of the owners do not have a social network that helps to cover unexpected expenditures on a short-term basis.

| The household Businesses and the Informal sector in vietnam | chapter 10270
A third form of financial support to deal with shocks are informal rotating savings and credit associations (ROSCAs). In these associations, members pool their money into a common fund, generally structured around monthly contributions, and money is withdrawn from it as a lump sum by a single member at the beginning of each cycle. This kind of informal financial institution is often considered as a form of informal insurance as it regularly provides a large amount of money that can help one face medium or long-term shocks (Calomiris and Rajaraman, 1998). Only 10 per cent of the HB owners benefit from this kind of informal insurance.
By taking into consideration these three risk-sharing mechanisms simultaneously, it appears than 36 per cent of the HB owners are highly vulnerable as their social network does not provide them with any risk-sharing or informal insurance mecha-nisms to cope with shocks. In addition, vulnerability is more widespread in urban areas, where 41 per cent of the HB owners are vulnerable, highlighting the erosion of supportive networks in urban areas. Finally, as expected, informal HB owners are more vulnerable to shocks than formal ones, mostly because of their weak ability to borrow a large amount of money in the event of a shock. In fact, informal HBs are not more vulnerable than formal ones once their size and their level of value added are taken into account.14 Female owners are more vulnerable than males once other characte-ristics are taken into account, and owners who are older than 45 are more vulnerable than owners who are 45 or younger.
14. Again, we use a probit model to estimate the probability of not benefiting from support by the geographical areas of the HB, its registration status, its industry, its size in terms of workers, its size in terms of value added, its duration, the education level of the owner and the age of the owner. In this model, we add the sex of the owner as well (see Table 10.C, Model 9 in the appendix).
TABLe 10.10.PROPORTION OF OwNeRS wHO BeNeFIT FROm A SUPPORTIVe NeTwORk BY FORmALITY STATUS AND AReA (PERCENTAGE)
Proportion of owners who All Informal HBs Formal HBs Rural UrbanCan receive financial support for their business 33.9 33.4 35.4 37.7 29.2
Are able to borrow 5 million within a week 50.0 46.4 60.1 52.7 46.6
Belong to a rotating credit and saving association 10.2 9.7 11.5 11.6 8.5
Do not benefit from any of these 3 kinds of support 35.7 38.1 28.7 31.7 40.6
Source: 2014/15 HB&IS survey, VASS-CAF & IRD-DIAL; authors’ calculations

chapter 10 | The household Businesses and the Informal sector in vietnam | 271
To what extent supportive a social network is a substitute for a formal social security scheme is the second question addressed in this subsection. It seems that there is no negative correlation between having a supportive network and a subscription to a social security scheme. The proportion of owners who have a health insurance card or subscribe to a voluntary Vietnamese social security scheme is more or less the same among owners who have a supportive network and owners who do not have such a network (55 per cent and 54 per cent respectively). However, a look in greater detail at the type of risk-sharing mechanisms reveals that some substitution between informal rotating credit associations and social security subscription seems to be at play. 56 per cent of the owners who do not belong to an informal credit association have formal health insurance coverage, and only 45 per cent of those who do belong to such an association have such coverage.15
CONClUSION
To summarize, this chapter has highlighted the importance of the use of social networks in the functioning of HBs. HBs are anchored in social networks, and these personal relationships are critical for accessing the main production inputs, which are capital and labour, and coping with the uncertainty that characterizes the acti-vities of HBs. As far as capital is concerned, HBs rely on their social network to get initial credit or informal and formal loans. While the frequency of using informal loans obtained from personal contacts is comparable to that for formal loans in the financing of HBs, access to formal loans is associated with having a close relationship with bank employees and government officials. Another source of short-term credit is trade credit, and it depends on the strength of the ties between the owners of the HBs and their suppliers. In addition, personal relationships shape the rental conditions and the quality of a professional premises. Concerning labour, most of the employees are not recruited through market mechanisms but through family networks. Finally, a majority of HBs benefit from supportive networks that help them face shocks and unexpected expenditures.
Although the use of a social network facilitates the functioning of some HBs, there are three major drawbacks. The first is the fact that most of the social networks mobilized for HB activities are related to family networks. This may hamper social mobility because credit constraints, the quality of the labour, access to information and the capacity to
15. However, more in-depth analysis should be conducted to assess whether there is substitution between informal rotating credit associations and social security subscription by controlling for unobserved characteristics of the owners.

| The household Businesses and the Informal sector in vietnam | chapter 10272
cope with shocks are partly determined by the social background of the owners. Thus, the association between the wealth and resources embedded in a family and the performance of an HB may be strong. The second drawback is that a non-negligible portion of the HBs do not have a social network to rely on. These HBs are disadvan-taged and highly vulnerable, in particular the one third of the HB owners who are excluded from risk-sharing mechanisms and are most likely to be informal, to be female and to live in urban areas. The third drawback is related to innovation and efficiency in the household business and informal sectors. Innovation may be limi-ted by the use of a social network because the information it conveys may not be in line with a rapidly changing environment. The use of a social network to recruit workers does not guarantee worker productivity as the widespread recruitment of family members is associated with family obligations and a lack of intermediaries. In addition, social networks may constitute entry barriers for potentially efficient entrepreneurs who cannot rely on family support at the start of their business and do not benefit from longstanding relationships with business contacts that facilitate the building of trust and cooperation agreements.
These results call for the need for public policies to mitigate the negative conse-quences of the prevalent use of social networks and, more specifically, family networks in terms of inequality of opportunity, of vulnerability and of limitation of the potential for growth. Developing mechanisms aimed at providing reliable information about businesses and workers may facilitate access to credit and labour for HBs regardless of their social network. Expanding the coverage of the social protection system, inclu-ding insurance against risks, should be a major concern for public policy, in particular in the context of urbanization, which seems to go hand in hand with the erosion of traditional family-based supportive networks.

chapter 10 | The household Businesses and the Informal sector in vietnam | 273
appENDIx
TABLe 10.A. eSTImATION OF THe PROBABILITY OF OBTAININg A LARge LOAN FROm A PeRSONAL CONTACT
Probit model multitlogit model (model 1) (ref. Probability of having a large loan from a personal contact) (model 2)
Probability of Probability of Probability of not obtaining a large obtaining a large obtaining a large loan from a personal loan from a formal loan/using own contact market or usurer resources Formal HB (ref. informal) 0.395** -0.580 -0.856** (0.131) (0.339) (0.247)
Urban (ref. rural) -0.128 0.0495 0.356 (0.117) (0.260) (0.216)
Sector of activity (ref. manufacturing & construction)
Trade -0.0345 0.211 -0.0206 (0.0964) (0.217) (0.187)
Service -0.239** 0.485* 0.434** (0.0747) (0.186) (0.146)
Number of workers (ref. 1 worker)
Two workers -0.0566 0.0655 0.199 (0.0666) (0.193) (0.135)
3-5 workers -0.0141 0.188 0.0168 (0.133) (0.376) (0.257)
6-18 workers 0.212 -0.0341 -0.412 (0.246) (0.430) (0.488)
Quartile of value added (ref. 1st quartile)
Quartile 2 0.270* -0.506* -0.624 (0.122) (0.216) (0.293)
Quartile 3 0.119 0.143 -0.364 (0.135) (0.278) (0.318)
Quartile 4 0.307* 0.00254 -0.820** (0.119) (0.246) (0.277)
Duration of the business (ref. 0-4 years)
5-9 years 0.0903 -0.341 -0.143 (0.0892) (0.210) (0.173)
10-16 years -0.404** 0.558* 0.907** (0.0944) (0.233) (0.202)
More than 16 years -0.0109 -0.366 0.0864 (0.107) (0.348) (0.195)
education level of the owner (ref. no diploma/certificate)
Primary 0.214 -0.0999 -0.594 (0.127) (0.257) (0.283)
Lower secondary 0.231 -0.132 -0.567 (0.159) (0.319) (0.341)
Upper secondary 0.199 0.115 -0.590 (0.128) (0.329) (0.281)

| The household Businesses and the Informal sector in vietnam | chapter 10274
Superior 0.0137 0.414 -0.0132 (0.307) (0.815) (0.622)
Age of the owner (ref. <26 years old)
26-35 -0.307* 0.614 0.622* (0.111) (0.326) (0.264)
36-45 -0.275* 0.506 0.578* (0.0997) (0.357) (0.244)
46-55 -0.619*** 1.175** 1.259** (0.133) (0.298) (0.330)
56-65 -0.544** 0.802 1.195* (0.176) (0.406) (0.470)
> 65 -1.307*** 2.674** 3.045*** (0.159) (0.801) (0.429)
Constant -1.237*** 0.0618 2.076*** (0.181) (0.404) (0.396)
Observations 3,370 3,370 3,370
TABLe 10.B. eSTImATION OF THe PROBABILITY OF OBTAININg A LARge FORmAL LOAN VS NOT OBTAININg A LARge LOAN OR OBTAININg A LARge LOAN BUT FROm AN INFORmAL CReDIT SOURCe
Probability of obtaining a large formal loan (probit model))
(model 3) (model 4) (model 5) Close relationship with
Bank employee 0.492** (0.151)
Communist Party member 0.254** (0.0794)
Mass organization 0.288** (0.0865)
Formal HB (ref. informal) 0.152 0.149 0.163 (0.106) (0.108) (0.108)
Urban (ref. rural) -0.133 -0.120 -0.106 (0.0800) (0.0813) (0.0802)
Sector of activity (ref. manufacturing & construction)
Trade 0.0426 0.0552 0.0464 (0.0724) (0.0803) (0.0804)
Service -0.00827 -0.00304 -0.00157 (0.0559) (0.0568) (0.0563)
Number of workers (ref. 1 worker)
Two workers -0.0656 -0.0596 -0.0522 (0.0645) (0.0580) (0.0582)
3-5 workers 0.0629 0.0914 0.0991 (0.151) (0.174) (0.173)
6-18 workers 0.144 0.237 0.260 (0.125) (0.132) (0.126)
Note: Standard errors in parentheses; *** p<0.01, ** p<0.05, * p<0.1
Source: 2014/15 HB&IS survey, VASS-CAF & IRD-DIAL; authors’ calculations

chapter 10 | The household Businesses and the Informal sector in vietnam | 275
Quartile of value added (ref. 1st quartile)
Quartile 2 0.0842 0.0713 0.0859 (0.105) (0.0985) (0.101)
Quartile 3 0.168 0.180 0.190 (0.106) (0.106) (0.105)
Quartile 4 0.442*** 0.452*** 0.452*** (0.0916) (0.0969) (0.0929)
Duration of the business (ref. 0-4 years)
5-9 years -0.193** -0.158* -0.181** (0.0644) (0.0654) (0.0626)
10-16 years -0.315** -0.306** -0.314** (0.0768) (0.0724) (0.0743)
More than 16 years -0.370* -0.341* -0.357* (0.147) (0.149) (0.151)
education level of the owner (ref. no diploma/certificate)
Primary 0.329* 0.303* 0.296 (0.127) (0.139) (0.141)
Lower secondary 0.242 0.208 0.193 (0.157) (0.173) (0.168)
Upper secondary 0.387 0.361 0.330 (0.219) (0.225) (0.223)
Superior 0.241 0.292 0.321 (0.407) (0.399) (0.404)
Age of the owner (ref. <26 years old)
26-35 -0.0338 -0.00645 -0.0414 (0.240) (0.236) (0.231)
36-45 -0.0998 -0.0678 -0.0917 (0.255) (0.253) (0.245)
46-55 0.0662 0.0695 0.0447 (0.230) (0.230) (0.222)
56-65 -0.132 -0.144 -0.174 (0.283) (0.287) (0.275)
> 65 -0.0374 -0.0797 -0.115 (0.474) (0.483) (0.477)
Constant -1.324*** -1.333*** -1.336*** (0.249) (0.273) (0.273)
Observations 3,370 3,370 3,370
Note: Standard errors in parentheses; *** p<0.01, ** p<0.05, * p<0.1
Source: 2014/15 HB&IS survey, VASS-CAF & IRD-DIAL; authors’ calculations

| The household Businesses and the Informal sector in vietnam | chapter 10276
TABLe 10.C. eSTImATION OF THe PROBABILITY OF OBTAININg TRADe CReDIT, OF BeINg A FAmILY wORkeR, OF USINg A SOCIAL NeTwORk TO ACCeSS INFORmATION AND OF NOT BeNeFITINg FROm FINANCIAL SUPPORT
Probability of Probability of Probability of Probability of obtaining trade being a family using a social not benefiting credit among HBs worker versus network to from financial with one main being a non-family access information support from supplier (probit) worker (probit) at the start a social network (probit) (probit)
(model 6) (model 7) (model 8) (model 9)
Closeness of the relationship
Meets the supplier at least once a week 0.252* (0.107)
Is intimate with the supplier 0.599*** (0.0921)
Formal HB (ref. informal) 0.367** -0.196* 0.189* -0.176 (0.112) (0.0762) (0.0728) (0.107)
Urban (ref. rural) -0.261** -0.0483 -0.0715 0.281*** (0.0804) (0.116) (0.0656) (0.0485)
Sector of activity (ref. manufacturing & construction)
Trade 0.165 0.813*** -0.341* 0.0221 (0.142) (0.156) (0.127) (0.157)
Service -0.191 0.298 -0.0850 0.0288 (0.118) (0.147) (0.113) (0.174)
Number of workers (ref. 1 worker)
Two workers 0.0107 (reference) -0.0445 -0.00361 (0.109) (0.0912) (0.0850)
3-5 workers 0.182 -0.0488 0.00275 0.140 (0.144) (0.0788) (0.0787) (0.0677)
6-18 workers 0.0161 -0.416** 0.181 0.130 (0.397) (0.0929) (0.155) (0.188)
Quartile of value added (ref. 1st quartile)
Quartile 2 -0.148 -0.592** -0.170 -0.234 (0.149) (0.170) (0.120) (0.141)
Quartile 3 -0.0608 -0.717*** -0.170 -0.302 (0.181) (0.105) (0.104) (0.146)
Quartile 4 -0.306* -1.292*** 0.0972 -0.575** (0.127) (0.173) (0.123) (0.176)
Duration of the business (ref. 0-4 years)
5-9 years 0.0254 0.0428 -0.0782 -0.133 (0.147) (0.0871) (0.0789) (0.0719)
10-16 years 0.246 0.0222 0.0309 -0.0706 (0.155) (0.0860) (0.0853) (0.0652)
More than 16 years 0.132 0.374*** 0.131 -0.0357 (0.114) (0.0781) (0.163) (0.0816)
education level of the owner (ref. no diploma/certificate)
Primary -0.203 -0.0711 0.0498 0.0636 (0.117) (0.260) (0.0904) (0.113)
Lower secondary -0.210 -0.163 -0.0924 -0.0949 (0.108) (0.267) (0.120) (0.126)
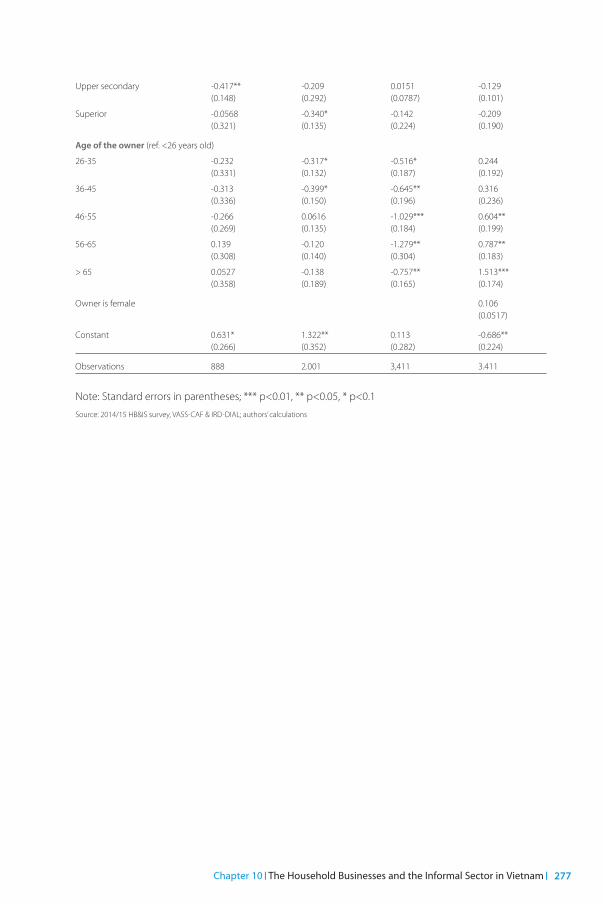
chapter 10 | The household Businesses and the Informal sector in vietnam | 277
Upper secondary -0.417** -0.209 0.0151 -0.129 (0.148) (0.292) (0.0787) (0.101)
Superior -0.0568 -0.340* -0.142 -0.209 (0.321) (0.135) (0.224) (0.190)
Age of the owner (ref. <26 years old)
26-35 -0.232 -0.317* -0.516* 0.244 (0.331) (0.132) (0.187) (0.192)
36-45 -0.313 -0.399* -0.645** 0.316 (0.336) (0.150) (0.196) (0.236)
46-55 -0.266 0.0616 -1.029*** 0.604** (0.269) (0.135) (0.184) (0.199)
56-65 0.139 -0.120 -1.279** 0.787** (0.308) (0.140) (0.304) (0.183)
> 65 0.0527 -0.138 -0.757** 1.513*** (0.358) (0.189) (0.165) (0.174)
Owner is female 0.106 (0.0517)
Constant 0.631* 1.322** 0.113 -0.686** (0.266) (0.352) (0.282) (0.224)
Observations 888 2.001 3,411 3.411
Note: Standard errors in parentheses; *** p<0.01, ** p<0.05, * p<0.1
Source: 2014/15 HB&IS survey, VASS-CAF & IRD-DIAL; authors’ calculations

| The household Businesses and the Informal sector in vietnam278

chapter 11 | The household Businesses and the Informal sector in vietnam | 279
moTIvaTIon, proBlems and assIsTance needed
Tran ngo Thi minh Tam le Thuy linh
This chapter examines the motivation for setting up a HB, the problems that HBs encounter and their need for assistance. Given the particularity of these issues, the questions and responses principally reflect the subjective conceptions and opinions of the HB owners. The analyses in this chapter are therefore helpful in assessing the welfare and behaviours of HBs and in facilitating policy proposals.
By examining the motivation for creating a HB and the level of job satisfaction among HB owners, the first section of this chapter illustrates the fact that in general working at a HB and in the informal sector is not a second choice. It points out that HBs are mainly set up for positive reasons and that HB owners are generally satisfied with their work. However, it must be taken into account that the choice of running a HB is often made when other occupational opportunities seem to be limited.
The second section highlights the difficulties encountered by owners in running their business. Eight out of ten informal HB owners mentioned having at least one difficulty, and difficulty selling production was the most cited problem in both 2007 and 2014. As far as manpower is concerned, a large majority of the respondents stated that they do not have any problems, and those who do said that a shortage of skilled labourers and the instability of employees are the greatest problems. There is a massive call for assistance among HBs and in the informal sector, and it is presented in the fourth section. Access to credit appears to be the most frequent type of support needed by informal HBs.
The final section investigates the allocation behaviours of HBs with respect to extra earnings. It shows that HBs are more inclined to use this income for non-productive purposes.
11

| The household Businesses and the Informal sector in vietnam | chapter 11280
1. wORkINg aT a HOUSEHOlD BUSINESS aND IN THE INfORmal SECTOR IS gENERally NOT a SECOND CHOICE
1.1. motivation for setting up a HB
A majority of the HB owners in Vietnam set up their business for positive reasons: to earn a better income (29 per cent), to be independent (18 per cent) or to reconcile family life with business activity (15 per cent). This is true for both rural and urban HBs (see Table 11.1).
Only 22 per cent of the HB owners started their business for a negative reason (e.g. they were unable to find a job elsewhere), meaning that they did not have any other choice. Running an informal business appears to have been the default choice for 28 per cent of the owners in rural areas. This proportion is much lower among formal HBs in general (16 per cent) and to a lesser extent among informal HBs in urban areas (22 per cent). This reflects a greater number of opportunities in urban labour markets and better income prospects for formal HBs compared to informal HBs, as shown in Chapter 6.
However, although some HB owners stated that they set up their business to have a better income, it is still possible that they were constrained in their choice. They earn a better income compared to other choices that we do not know about, and the spectrum of these choices may be very limited. This will be further investigated in the next section.

The reasons to be independent, to reconcile family life and business and family tradition reflect a clear preference for running a HB rather than having another occupation. Two out of five HB owners stated one of these reasons as their main motivation. Among urban formal HBs, the proportion is 54 per cent, meaning that most of the formal HBs in urban areas consider their activity to be the best option. In rural areas and in the trade sector, the percentage of HB owners with a high preference for running a HB is lower because being independent is less valued.
To reconcile family life and business is an important reason among owners of infor-mal HBs (17 per cent) more often than among owners of formal ones (10 per cent). Family tradition, in contrast, was the reason stated by a larger percentage of formal and manufacturing HBs (13 per cent and 14 per cent respectively) than informal HBs (9 per cent) such as traditional craft village HBs.
chapter 11 | The household Businesses and the Informal sector in vietnam | 281
TABLe 11.1.mOTIVATION FOR SeTTINg UP A HB (PERCENTAGE)
Unableto find wage work
Unable to work on a farm
To earn a better income
To be inde-pendent
Family tradi-tion
To reconcile family life and business
Other Total
Rural areas
Informal HBs 20.3 1.9 31.4 15.1 8.9 16.3 6.2 100
Formal HBs 12.0 4.0 44.4 13.0 13.9 8.3 4.5 100
All HBs 18.5 2.3 34.1 14.6 9.9 14.6 5.8 100
Urban areas
Informal HBs 24.6 3.1 21.7 18.1 9.6 17.0 5.9 100
Formal HBs 13.7 2.8 25.5 30.0 13.0 10.8 4.0 100
All HBs 21.0 3.0 23.1 22.1 10.8 14.9 5.3 100
whole country
Manufact. 13.3 2.1 28.6 20.5 14.2 15.3 5.9 100
Trade 21.2 3.1 34.2 13.8 9.7 14.5 3.6 100
Service 22.6 2.6 24.5 20.3 8.2 14.6 7.3 100
Informal HBs 22.0 2.4 27.5 16.3 9.2 16.5 6.1 100
Formal HBs 13.0 3.3 33.7 22.7 13.4 9.7 4.2 100
All HBs 19.6 2.6 29.1 18.0 10.3 14.7 5.6 100
Source: 2014/15 HB&IS survey, VASS-CAF & IRD-DIAL; authors’ calculations.

| The household Businesses and the Informal sector in vietnam | chapter 11282
Further examination reveals implicative insights into gender differences in Vietnam. On the one hand, the reconciliation of family and professional life among HB owners is much more relevant for women (23 per cent) than for men (6 per cent). On the other hand, while males largely seek independence (27 per cent), females seem to care little about this (10 per cent). These facts are consistent with traditional Vietnamese culture, according to which women are expected to be dependent on their husband and do the housework.
1.2. Setting up a HB to complement other activities
As the prospect of higher earnings is generally the main motivation for creating a HB, further investigation to determine what is actually behind this reason is warranted. A first way to do that is to study whether people run a HB as a means to complement other earnings.
Indeed, three out of ten HBs owners have a second job or activity. They constitute a large percentage of those who stated that they started their business to have a better income (41 per cent). Having a second activity is more common among owners of informal HBs (31 per cent) than owners of formal ones (24 per cent) (see Figure 11.1). Moreo-ver, owners of small HBs in terms of number of workers, value added and profit more frequently have a second activity that complements their income, as the cœfficients of correlation between having a second activity and these variables are positive and significant (and not reported here). The second activity can provide a significant extra income, especially among the poorest HBs owners. This is analysed in Chapter 6.
Owners of HBs who work in the manufacturing sector are also more likely to have a second activity (see Figure 11.1). In rural areas, around half of the HB owners in the manufacturing sector have a second activity. Only 32 per cent of the HB owners in the trade sector and 39 per cent in the service sector have a second activity. This is also the case in urban areas, but to a lesser degree.

Having a second job is primarily a rural phenomenon due to the prevalence of far-ming as a second activity. Around 40 per cent of the HB owners in rural areas and only 17 per cent of those in urban areas have a second job. There is a marked difference between the owners of HBs in rural and urban areas in all economic sectors, and this confirms the role of the informal sector in the diversification of activity among farmers that was highlighted in Chapter 2. It also shows that the motivation for a non-negli-gible number of HB owners is to complement their income through farm activity. Indeed, the distribution of secondary activities presented in Figure 11.2 shows that a majority (56 per cent) of the HB owners who have a second activity work as farmers or breed animals.
chapter 11 | The household Businesses and the Informal sector in vietnam | 283
0
5
10
15
20
35
25
40
50
45
30
Manufacturing Trade InformalHBs
FormalHBs
Service
Rural AllUrban
Source: 2014/15 HB&IS survey, VASS-CAF & IRD-DIAL; authors’ calculations
FIgURe 11.1.PROBABILITY OF A HB OwNeR HAVINg A SeCOND jOB BY AReA, INDUSTRY AND FORmALITY STATUS

Thus, those who have a secondary activity and whose motivation for setting up their business was to have a better income feel that the HB sector is the best choice for them. The HB owners whose motivation was either to be independent, to reconcile family life or family tradition and the ones who have a secondary activity and set up their business in order to have a better income (a combined total of 55 per cent) have a clear preference for running a HB over having a different occupation. For them, ha-ving a HB is not a second choice.
1.3. job satisfaction
Another way to understand the “raison d’être” of the HB sector and the motivation of the owners to set up a business is to look at their satisfaction with their job. A specific question about job satisfaction was included in the 2014/15 HB&IS survey question-naire: All things considered, how satisfied are you with this job? Five options were offered: “very unsatisfied,” “unsatisfied,” “normal,” “satisfied” and “very unsatisfied.”
The data show an overall high level of satisfaction among those who work at HBs and in the informal sector (see Table 11.2).1 Over half of the owners of HBs are satisfied and near-ly one third of them think it is normal to work in the HB sector, leaving a mere 12 per cent of the HB owners feeling unsatisfied with their job. The informal HB owners expressed no less satisfaction than the formal HB owners, with 57 per cent feeling satisfied or very satisfied with their business. This figure is close to that presented by Razafindrakoto et al. (2012): 54 per cent, which was determined using information from the 2009 LFS.
1. As the proportion of those who answered “very unsatisfied” is minimal (1.1 per cent), in our statistical analysis they are combined with those who stated that they were “unsatisfied.”
| The household Businesses and the Informal sector in vietnam | chapter 11284
Agriculture
Manufacturing
Trade
Service18.7
9.256.3
15.7
Source: 2014/15 HB&IS survey, VASS-CAF & IRD-DIAL and LFS 2014, GSO; authors’ calculations
FIgURe 11.2.SeCONDARY ACTIVITIeS BY SeCTOR (PERCENTAGE)

An ordered logit regression shows that the level of job satisfaction significantly in-creases along with the economic performance of a HB, while, all other things being equal, job satisfaction is unaffected by the size of a HB, the geographical area in which it is located or whether it is formal or informal (see Table 11.A in the appendix).2
The association between the motivation for being a HB owner and job satisfaction generally corroborates the interpretation of the reason for setting up a business in terms of best choice or constrained choice. Those who said they became a HB owner because they were unable to find wage work or work on a farm are less satisfied on average. Reversely, owners who started their business to be independent or because of family tradition have a higher rate of satisfaction (around 70 per cent) (see Figure 11.3). Wanting to have a better income is associated with a low level of satisfaction, lower than the levels of satisfaction associated with most of the other reasons for starting a HB. Interestingly, working at a HB in order to reconcile family life and bu-siness provides less satisfaction than working in order to be independent or because of family tradition. This reflects the high social pressure on women to take care of their family at the expense of their career.
2. The control variables include: formality, urban/rural area, main sector of activity, size, value added and duration of the HB, education level and age of the HB owners.
chapter 11 | The household Businesses and the Informal sector in vietnam | 285
0
10
20
30
40
70
50
80
60
Unable to�nd wage
work
Unable towork ona farm
To havea betterincome
To beindependant
Familytradition
To reconcilefamily life
and business
Source: 2014/15 HB&IS survey, VASS-CAF & IRD-DIAL; authors’ calculations.
FIgURe 11.3.SHARe OF SATISFIeD AND VeRY SATISFIeD OwNeRS BY mOTIVATION (PERCENTAGE)

| The household Businesses and the Informal sector in vietnam | chapter 11286
Due to a high level of satisfaction at work and constrained opportunity in the labour market, few HB owners (18 per cent) are considering changing their activity (see Table 11.2). Only one fifth of the people who own a formal HB would prefer to work as an employee for a private company for a monthly income of five million VND. However, this proportion is higher among the owners of informal HBs (36 per cent), reflecting the higher level of instability and lower level of income in the informal sector compa-red to the formal sector.
However, merely a quarter of all HB owners want their children to take over their business, and the percentage is even less among HB owners in the informal sector (21 per cent). Among the respondents who do not want their children to take over their business, the majority said that they want their children to work in the public sector (59 per cent), followed by the private enterprise sector (10 per cent) (see Table 11.3).3 This reveals that HB owners, especially owners of informal HBs, integrate the constraints they face in the labour market when they express their satisfaction: They are generally satisfied with their job, but only because they know that they cannot access other sectors, e.g. the public sector, and they do not think of their business as something their children will run in the future.
3. This subjective perception of different economic sectors coincides with the level of job satisfaction stated by workers who work in these sectors (Razafindrakoto et al., 2012).
TABLe 11.2.LeVeL OF SATISFACTION AS A HB OwNeR AND POSSIBLe OPTIONS FOR THe FUTURe (PERCENTAGE)
Level of satisfaction Possible options for the future All Formal Informal Is thinking Prefers wants his/her of changing working as children to activity an employee take over the businessUnsatisfied 11.7 8.7 12.8 51.9 61.7 16.7
Normal 30.8 32.5 30.1 24 41.3 19.3
Satisfied 49.3 50.9 48.8 8.1 20.5 29.2
Very satisfied 8.2 7.9 8.3 6.6 13.7 44.9
All 17.6 31.1 26
Formal HBs 16 19.1 38.7
Informal HBs 18.2 35.8 21.3
Source: 2014/15 HB&IS survey, VASS-CAF & IRD-DIAL; authors’ calculations

1.4. motivation from the perspective of past trajectories
Previous sections have shown that setting up a HB was not a second choice for most of the owners, although when making their choice they took into account that their opportunities in the labour market are restricted. They generally work in the HB sector not because they cannot find a job elsewhere but because according to their charac-teristics and their past trajectory, the HB sector is the best option compared to the other options open to them. To have a full picture of the motivation and the “raison d’être” for setting up a HB, it would be necessary to know what their other options are. Direct observation of these options is not possible, but studying the past trajectory of HB owners is a way to approximate these options and to better understand the constraints HBs owners face when choosing an occupation. Past trajectory is approa-ched here by looking at the previous jobs held by owners and their social origin.
Household business: the most common previous workplaceFor three quarters of the HBs owners, their present occupation is not their first job, and the proportion of those who had another job before was similar among owners of formal and informal HBs.
About two thirds of those who had previous work experience worked at a household business (see Table 11.4). This reflects the permanency of working in the HB sector and suggests that the spectrum of occupational choices among HB owners is restric-ted. Most of those who had previous jobs in the HB sector were either self-employed (39 per cent) or a wage worker (20 per cent). Differences in status in the HB sector are correlated to the age of the owner. The majority of the owners who were self-employed in their previous jobs are older than 45, and two thirds of those who were wage workers at a HB are younger than 45.
chapter 11 | The household Businesses and the Informal sector in vietnam | 287
TABLe 11.3.INSTITUTIONAL SeCTOR wHeRe HB OwNeRS wANT THeIR CHILDReN TO wORk (PERCENTAGE)
Public Private Foreign Household Unknown Total sector enterprise enterprise business Informal HBs 57.8 10.2 3.4 6.8 21.8 100
Formal HBs 64.6 7.4 6.6 3.4 18.0 100
Rural 62.0 9.4 3.3 6.3 18.9 100
Urban 56.0 9.8 5.0 5.8 23.4 100
All 59.2 9.6 4.1 6.0 21.0 100
Source: 2014/15 HB&IS survey, VASS-CAF & IRD-DIAL; authors’ calculations

| The household Businesses and the Informal sector in vietnam | chapter 11288
One quarter of the previous jobs were in the formal enterprise sector (mainly the public sector, but also at domestic and foreign private enterprises). This relatively high incidence of HB owners with previous experience in the public sector is explained by the changes in the labour market that occurred after the Doi Moi policy was launched. Many SOEs were restructured in the 1990s and they dismissed workers, who then began to work for themselves or at their family’s business. Most of the owners who previously worked in the public sector are older than 45 (70 per cent of them). This career pattern is particularly prevalent among the owners of formal HBs in urban areas, almost one third of them. Reversely, this career pattern is much less common in rural areas. As shown in Table 11.5, this trajectory is a source of dissatisfaction, and the rate of satisfaction among these owners is lower than average and primarily reflects a constrained choice. The main reason people become a HB owner is because they are unable to find wage work.
The owners in the private enterprise sector are mostly young people (40 per cent are under 35) who started their career as a wage worker in this sector. Their main reason for working at a HB is to reconcile family life and business, reflecting a lack of flexibility in the management of time in the private enterprise sector, and two thirds of them are satisfied with their new occupation.
TABLe 11.4.PReVIOUS OCCUPATION STATUS AmONg HOUSeHOLD BUSINeSS OwNeRS BY geOgRAPHIC AReA AND FORmALITY STATUS (PERCENTAGE)
Rural Urban Total IHB FHB Total IHB FHB Total IHB FHB TotalWage worker in the public sector 9.7 12.2 10.2 19.3 28.4 22.3 13.6 21.5 15.7
Wage worker at a private enter. 6.0 10.8 7.0 15.8 12.9 14.8 10.1 12.0 10.6
Employer at a HB 4.9 8.5 5.7 3.5 5.2 4.0 4.3 6.6 4.9
Self-employed at a HB 45.7 39.7 44.5 32.5 31.6 32.2 40.2 35.0 38.8
Wage worker at a HB 23.3 13.4 21.2 21.1 14.3 18.9 22.4 13.9 20.1
Unpaid worker 10.5 15.5 11.5 7.9 7.7 7.8 9.4 11.0 9.8
Source: 2014/15 HB&IS survey, VASS-CAF & IRD-DIAL; authors’ calculations.

motivation varies across social originA long-term trajectory provides an interesting insight into motivation as well.
A look at the occupations of the fathers of HB owners (see Figure 11.4) shows that nearly half of the HBs owners come from a farming family, a proportion that is not surprising seeing as how 30 years ago 75 per cent of the labour force worked in agri-culture, fishing and forestry.
About 30 per cent of the owners’ fathers were employed in the public sector, mostly in the civil service sector, but also at state-owned enterprises. Here again, that is not surprising when one considers the share of the labour force in the public sector one generation ago. However, this is a characteristic of the informal sector and the HB sec-tor in general in Vietnam that is not found in other countries. Most likely this is linked to the specificities of recent history in Vietnam and will not be reproduced in the next generation. The share of owners whose father also owned and worked at a non-farm HB is less than 20 per cent, and the percentage is similar for both formal and informal HBs. In comparison, the proportion is 26 per cent among informal HB owners in the urban West African context (Pasquier-Doumer, 2012).
chapter 11 | The household Businesses and the Informal sector in vietnam | 289
TABLe 11.5.mOTIVATION FOR SeTTINg UP A HB AND SATISFACTION BY PReVIOUS OCCUPATION (PERCENTAGE)
Unableto find wage work
Unable to work on a farm
To earn a better income
To be inden-pedent
Family tradi-tion
To reconcile family life and business
Total Share of satisfied/ very satisfied
Public sector 29.7 2.7 27.7 20.4 7.8 11.7 100 54.2
Private enter-prise sector
16.8 0.0 21.1 23.0 6.5 32.5 100 64.3
HB sector 17.9 3.3 34.6 18.1 10.2 15.9 100 60.2
All 19.6 2.9 32.2 19.0 9.5 17.0 100 59.7
Source: 2014/15 HB&IS survey, VASS-CAF & IRD-DIAL; authors’ calculations.

According to these long-term trajectories, the motivations to become a HB owner are not the same as shown in Table 11.6. While children of civil servants and farmers run a HB mostly to earn better income, reflecting partial involuntary engagement in the HB sector (see sections 1.2 and 1.3 of this chapter), children of HB owners and employees are more likely to choose to run a HB for a positive reason, family tradition or to be independent respectively.
| The household Businesses and the Informal sector in vietnam | chapter 11290
0 %
10 %
20 %
30 %
40 %
50 %
60 %
70 %
100 %
80 %
90 %
Informal Formal Total
Farmer
Self-employed, employer
Civil servant
Employee at a HB orprivate enterprise
Source: 2014/15 HB&IS survey, VASS-CAF & IRD-DIAL; authors’ calculations
FIgURe 11.4.SeCTOR OF ACTIVITY OF THe FATHeRS OF HB OwNeRS BY FORmALITY STATUS (PERCENTAGE)
TABLe 11.6.mOTIVATION FOR SeTTINg UP A HB BY OCCUPATION OF THe FATHeR (PERCENTAGE)
Unableto find wage work
Unable to work on a farm
To earn a better income
To be indepe-dent
Family tradition
To reconcile family life and business
Total
Civil servant 20.4 3.8 38.8 16.9 6.1 14 100
HB self-employed 19.4 1.5 14.9 17 31.1 16.1 100
Employee (HB, private enterprise)
17.5 1.3 17.8 36.4 11.4 15.7 100
Farmer 20.8 3.1 35.4 18.8 6.1 15.9 100
Source: 2014/15 HB&IS survey, VASS-CAF & IRD-DIAL; authors’ calculations.

To summarize the findings about the motivation to run a HB, we have shown that over half of the HB owners have a clear preference for running a HB over having another occupation, and they are satisfied with their job. One fifth of the HB owners would like to change their occupation, and three out of four do not wish for their children to take over their business. Thus, while setting up a HB is not a second choice for most of the owners, they took into account their limited opportunities in the labour market when they made their choice. They generally work in the HB sector not because they cannot find a job elsewhere but because according to their characteristics and their past tra-jectory, the HB sector is the best option compared to the other options open to them. Working as a farmer provides them with insufficient earnings, as shown by crossing their level of satisfaction and their motivation with their past trajectories and their secondary activity. Given their characteristics, working in the private enterprise sector is not a panacea, because it generally impedes them from reconciling their family life and their occupation. Working in the public sector would be preferable to running a HB for some, but often this is not an option for them. Consequently, working in the HB sector results in very little mobility out of this sector, and the labour market seems to be segmented in Vietnam as it is in other developing countries.
2. COmpETITION REmaINS THE maIN pROBlEm, BUT aCCESS TO CREDIT IS aN ISSUE aS wEll
Approximately eight out of ten informal HB owners say that they encounter problems that make it difficult to do business, and almost one third of them have at least one severe problem (see Table 11.7). It appears that HBs in the trade sector have the most problems (see Figure 11.5).
chapter 11 | The household Businesses and the Informal sector in vietnam | 291

The most prevalent problem among HBs is related to the sale of products. A lack of market outlets is particularly acute for HBs in the trade sector. Almost two thirds of them (57 per cent) complained about the difficulties they face selling their products. This reflects the high competition among the HBs in the trade sector and a lack of information about market opportunities. The prevalence of difficulties in accessing raw materials in the trade sector (24 per cent of the HBs in the trade sector complai-ned about this issue) is another sign of high competition in that sector as long as it is interpreted as being due to the high prices of the products they purchase. Accor-ding to these two criteria, almost three quarters of the formal HBs in the trade sector (72 per cent) suffer from high competition. This reflects an increase in the number of formal enterprises in the trade sector and calls for policy aimed at orienting HBs in the trade sector towards niches.
Interestingly, a greater share of formal HBs complained about a lack of market outlets than their informal counterparts despite the fact that the former perform better eco-nomically than the latter (see Chapter 6). On the one hand, this could be attributed to the fact that formal HBs operate on a larger scale and in a broader market, where
| The household Businesses and the Informal sector in vietnam | chapter 11292
In�ation
Raw materials
Sale of products
Financial cash �ow
Access to credit
Lack of machines,equipment
Inadequate premises
0
10
20
30
40
50
60
Trade ServiceManuf. & constr.
Source: 2014/15 HB&IS survey, VASS-CAF & IRD-DIAL; authors’ calculations.
FIgURe 11.5.mAIN PROBLemS eNCOUNTeReD BY HBS BY INDUSTRY (PERCENTAGE)

the number of competitors is also higher, as shown in Chapter 5. On the other hand, formal HBs tend to be more ambitious than informal HBs, as a greater share of them were planning to expand their activity over the following 12 months (37 per cent and 28 per cent respectively).
The comparison of the perception of problems faced selling products between 2007 and 2014 in Hanoi and Ho Chi Minh City presented in Figure 11.6 shows the extent of the problem in Hanoi, and the situation did not improve during that period. The problem was less severe in HCMC and the prevalence decreased slightly.
In addition to the difficulty of selling their products, HBs are confronted with a lack of liquidity and credit. Around one third of the HBs are hindered in their activity because they lack a cash flow. The lack of liquidity is the second biggest problem formal and informal HBs face. The lack of a cash flow reflects a short-term financial constraint that may reduce the activity of the HBs and limit their prospects for growth. Formal and informal HBs complained in nearly the same proportion about the difficulty accessing credit, and this proportion is 38 per cent among formal HBs in rural areas. This is the third biggest problem for formal HBs and the fourth biggest problem for informal ones. Limited access to credit is a mid- or long-term financial constraint that entails a weak capacity to invest and innovate and thus to increase productivity. All in all, almost half of the HBs (43 per cent) complained about financial constraints.
chapter 11 | The household Businesses and the Informal sector in vietnam | 293

The productivity of HBs is also constrained by a lack of machines and equipment, but mostly in the manufacturing sector (see Figure 11.5). One out of five HBs in the manufacturing sector are restricted in their activity by a lack of machines or equipment. A lack of machines is associated with a limited capacity to invest. Almost half of the for-mal HBs in the manufacturing and construction sectors (44 per cent) are limited in their activity because of their limited capacity to invest and a lack of access to credit. There is an urgent need to develop a mid-term credit market for HBs, especially for the formal HBs in the manufacturing sector. This is all the more important since the perception of difficulties accessing credit or machines and equipment increased between 2007 and 2014 in both Hanoi and HCMC (see Figure 11.6). This may be explained by a higher demand for credit and investment among HBs, as the credit market was developed during that period, as suggested in Chapter 7.
Informal HBs seem to be more vulnerable to health risks, as shown by the popularity order of health problems among informal HBs. Three out of ten consider health risk
| The household Businesses and the Informal sector in vietnam | chapter 11294
TABLe 11.7.mAIN PROBLemS eNCOUNTeReD BY FORmALITY STATUS (PERCENTAGE OF HBS)
Informal HBs Formal HBs All HBs Problem Severe Problem Severe Problem Severe problem problem problem
1. Sale of products 41.7 10.5 56.4 21.1 45.5 13.3
2. Financial cash flow 32.1 7.7 31.1 7.5 31.8 7.7
3. Health issues 31.3 9.3 25.5 4.5 29.8 8.1
4. Access to credit 25.2 6.3 28.5 6.7 26.1 6.4
5. Supply of raw materials 15.7 3.5 25.1 3.1 18.2 3.4
6. Lack of space/land, inadequate premises 15.7 6.1 17.9 4.3 16.3 5.6
7. Inflation 15 3.1 16.1 4.2 15.3 3.4
8. Lack of machines or equipment 13.2 2.3 11.5 1.3 12.7 2.1
9. Crime, theft and disorder 8.4 2.2 11.4 2.3 9.2 2.2
10. Transportation 7.7 1.8 11 1.9 8.6 1.8
11. Corruption 3.2 0.4 4.1 0.3 3.5 0.4
12. Other 2.9 2.1 2.1 0.8 2.7 1.7
At least one severe problem . 31 . 34 . 31.8No problems 21.3 . 17.6 . 20.4 .
Note: Since each HB could mention more than one problem, the sum for each column could be greater than 100 per cent.Source: 2014/15 HB&IS survey, VASS-CAF & IRD-DIAL; authors’ calculations.

chapter 11 | The household Businesses and the Informal sector in vietnam | 295
to be an important issue that concerns their activity (see Table 11.7). They rank it as the third biggest problem, while owners of formal HBs say it is their fourth biggest problem. Their higher vulnerability may be due to the fact that they often operate alone and that they would stop their business activity if they had a health problem (see Chapter 9).
Interestingly, HBs do not see a lack of space or land or inadequate premises as a major problem. It is ranked the sixth biggest problem, and although only 16 per cent of the HBs said it is a problem (see Table 11.7), one third of the informal HBs operate in a precarious location, as shown in Chapter 3. This suggests that a lack of a premises or the precariousness of a premises is inherent to the activities of HBs, especially informal ones, and this allows them more flexibility.
The problems of inflation, crime, transportation, theft and disorder are minor for HBs. Corruption seems to be minimal, with less than four per cent of the HBs citing corrup-tion as a major problem.
0
10
20
30
50
70
60
40
Sale ofproducts
Supply ofraw materials
Lack ofmachines orequipment
Lack of space/land inadequate
premises
Access to credit
Hanoi 2007 Hanoi 2014 HCMC 2007 HCMC 2014
Source: 2007 HB&IS survey (IRD-DIAL & GSO); 2014/15 HB&IS survey (VASS-CAF & IRD-DIAL); authors’ calculations.
FIgURe 11.6.TReND IN THe mAIN PROBLemS FACeD BY HBS IN HANOI AND HCmC, 2007-2014 (PERCENTAGE OF OWNERS FACING DIFFERENT PROBLEMS)

| The household Businesses and the Informal sector in vietnam | chapter 11296
For HBs with employees, the manpower issue is further addressed in questions that ask about the types of problems (and their level of seriousness) they face with workers. Only HBs that have or have had employees answered these questions. They represent one third of the sample (one quarter of the informal and nearly half of the formal HBs), and they are on average larger than the HBs that do not have employees.
Fortunately, two thirds of the respondents stated that they do not have any pro-blems with manpower. Having a problem with manpower is, however, more frequent among formal HBs (42 per cent) than informal ones (27 per cent). Among those who face manpower issues, instability of employees and a lack of skilled manpower are the two most salient (25 per cent and 19 per cent respectively). Only a few HBs complai-ned about salaries being too high, disciplinary problems and a lack of reliability and honesty.
In general, the manufacturing sector suffers the most from labour force problems. Around one third of the manufacturing HBs that have employees face a shortage of skilful workers and/or instability among their employees. This appears to be associa-ted with a high level of ambition among manufacturing businesses to expand their activity, as shown in the previous section. Manpower issues also appear to be more noticeable in urban areas than in the countryside. However, difficulty with manpower is a marginal problem when considering the HB sector as a whole. This may be ex-plained by the predominance of self-employed and family workers in that sector (see Chapters 3 and 4).
TABLe 11.8.mANPOweR PROBLemS eNCOUNTeReD BY HBS BY FORmALITY STATUS, geOgRAPHICAL AReA AND SeCTOR OF ACTIVITY (PERCENTAGE OF HBS WITH EMPLOYEES)
Informal Formal All Rural Urban manuf. Trade Service HBs HBs HBsInstability of employees 19.8 32.3 24.7 21.8 28.0 34.3 15.9 21.4
Lack of skilled manpower 14.1 25.7 18.6 14.7 23.2 27.9 10.0 15.6
Salaries are too high 8.9 21.4 13.7 10.3 17.7 19.2 8.1 12.4
Disciplinary problems 8.8 18.6 12.6 7.8 18.1 17.0 8.0 11.5
Lack of reliable and honest workers 7.0 16.0 10.5 5.5 16.3 13.5 6.2 10.8
Source: 2014/15 HB&IS survey, VASS-CAF & IRD-DIAL; authors’ calculations.

chapter 11 | The household Businesses and the Informal sector in vietnam | 297
3.a HUgE DEmaND fOR SUppORT amONg HBS, NOTaBly fOR CREDIT
There is a massive call for assistance from HB owners due to the prevalence of difficul-ties encountered by the HB sector. Table 11.9 shows that 70 per cent of the owners of informal HBs need assistance running their business, and the demand is higher in rural areas than in cities. Owners of informal manufacturing HBs expressed the greatest need for assistance (75 per cent), possibly due to the large scale of their operation. The informal and the formal sectors expressed a roughly equal call for assistance.
To finely assess the correlation between the demand for assistance and the charac-teristics of HBs, a logit regression was performed (see Table 11.B in the appendix).4 The results show that large-scale HBs are indeed more likely to ask for assistance, all other things being equal. Even when the size of the HBs is controlled for, rural HBs still express a higher need for support than urban HBs. However, when various HB charac-teristics are held fixed, there is no correlation between the demand for assistance and whether a HB is formal or informal.
4. The control variables include: formality, urban/rural area, main sector of activity, duration of the HB, education level and age of the HB owners.
TABLe 11.9.ASSISTANCe ReQUIReD BY HB OwNeRS (PERCENTAGE OF HBS)
Informal HBs Formal All HBs HBs manu. Trade Service Rural Urban All Access to loans 46 49 47 53 38 47 46 47
Access to big orders 37 32 28 33 29 32 30 34
Access to market information 33 24 17 27 19 24 22 26
Supply of raw materials 30 25 17 26 18 23 20 25
Access to premises 18 21 22 21 19 20 20 20
Access to modern machines 33 8 20 22 17 20 28 20
Technical training 25 10 15 18 13 16 20 16
Advertising for new products 18 11 7 13 9 11 10 13
Registration of business 11 8 8 11 6 9 9 9
Training in organization and accounting 5 6 2 4 4 4 3 5
At least one type of assistance 75 67 68 75 63 70 71 71No need for assistance 25 33 32 25 38 30 29 30
Source: 2014/15 HB&IS survey, VASS-CAF & IRD-DIAL; authors’ calculations.

| The household Businesses and the Informal sector in vietnam | chapter 11298
Support accessing loans is the most frequent type of assistance needed by both for-mal and informal HBs. Nearly half of the informal HBs require better access to credit, and this requirement is substantially more pronounced in rural areas (53 per cent) than in urban areas (38 per cent). Almost the same proportion of formal HBs asked for support accessing loans. The huge need for assistance accessing loans is consistent with the perception of the problem that HBs face, as almost half of the HBs complai-ned about financial constraints, as shown in the previous section. In the same way, a non-negligible share of the HBs, especially in the manufacturing sector (33 per cent of the informal HBs in the manufacturing sector), asked for support accessing (i.e. buying) modern machines, which reflects the need for mid-term credit support.
Assistance was requested to tackle the main difficulty identified by HBs: selling pro-ducts. Both formal and informal HBs asked for help accessing big orders (the second greatest need for assistance) (34 and 32 per cent respectively), accessing market information (24 and 26 per cent respectively) and with the supply of raw materials (23 and 24 per cent respectively). Although a lesser priority, assistance advertising new products was requested as well, especially by owners of formal HBs (13 per cent).
Although the use of bookkeeping and accounting is very limited in the HB sector (see Chapter 3), the demand for training in organization and accounting is very weak (5 per cent), reflecting a lack of awareness about the importance of bookkeeping in management and prospects. Thus, awareness should be raised before implementing large-scale training programmes.
Overall, there was an upward trend in the call for assistance among informal HBs in Hanoi and HCMC over the 2007-2014 period (see Figure 11.7). Whereas in 2007 only 33 per cent of the informal HBs in Hanoi and 27 per cent of those in HCMC required at least one type of support, these figures nearly doubled in 2014 (62 and 50 per cent respectively).
Enormous increases were recorded for a variety of assistance types. The share of infor-mal HBs in Hanoi requiring assistance accessing loans, for example, surged from only 8 per cent in 2007 to 21 per cent in 2014. Similarly, there were many more informal HBs in HCMC that needed better access to large orders in 2014 (27 per cent) than in 2007 (7 per cent).

chapter 11 | The household Businesses and the Informal sector in vietnam | 299
4. HOw HOUSEHOlD BUSINESSES allOCaTE THEIR ExTRa EaRNINgS
The previous sections have shed light on motivations, problems and the demand for assistance among HBs in Vietnam. This section investigates a relevant question concerning the allocation behaviour of HBs with regard to extra earnings. It reveals meaningful insights into the underlying incentives for doing business, current eco-nomic performance and the future vision of HBs, thereby further illustrating or exami-ning the above-mentioned results. Moreover, implications regarding the potential for inclusive growth in this sector can also be drawn.
When asked how they use extra earnings (see Table 11.10), HB owners most often said they use this money to improve their standard of living or they save it (56 per cent), or they reinvest it in order to increase their profit (29 per cent). Informal HBs are more likely than formal HBs to save this money or improve their standard of living,
0
10
20
30
60
40
80
70
50
Access to loan
Access to market info.
Access to big orders
Technical training
Training in manag. & accounting
Supply for raw materials
Access to modern machines
Registration of business
Advertising for new products
At least one type of assistance
No need for assistance
Hanoi 2007 Hanoi 2014 HCMC 2007 HCMC 2014
Source: Cling et al. (2010); 2014/15 HB&IS survey, VASS-CAF & IRD-DIAL; authors’ calculations.
FIgURe 11.7.TReND IN ASSISTANCe ReQUIReD BY INFORmAL HBS, 2007-2014

| The household Businesses and the Informal sector in vietnam | chapter 11300
suggesting higher ambitions among formal HBs. This result is consistent with previous findings in 2007 about how informal HBs would use a loan: About one third of them said they would use that loan for non-productive purposes (Cling et al., 2010). Few HBs think about starting a new business or helping family members. They almost never use such money to increase their employees’ wages. By definition, their business is attached to their household, and earnings from the business are therefore likely to be used for household-related purposes. However, willingness to reinvest in the business in the event of extra earnings is highly correlated to the size of the business. Among the 25 per cent of the HBs with the highest value added (Q4), the proportion of HBs that would reinvest their extra earnings in the business is almost the same as the pro-portion of HBs that would use this money for personal purposes.
Financial assistance aimed at boosting investment in the HB sector should therefore be strictly monitored to avoid a diversion of loans for consumption purposes. This supposes that these loans are granted to HBs which are sufficiently well off. Loans should be adapted according to their finality. Loans for investment require longer terms and specific rules for instalments. There are also specific needs such as supplier credit and an increase in revolving funds. Here again, there should be loans adapted to these needs.
TABLe 11.10.USAge OF eXTRA eARNINgS BY FORmALITY AND QUARTILe OF VALUe ADDeD (PERCENTAGE)
Informal Formal All Value HBs HBs HBs added Q1 Q4Increase standard of living/save 60.1 43.1 55.6 61.9 42.0
Reinvest to increase profit 26.1 36.9 28.9 21.6 40.6
Start a new business 6.7 7.7 6.9 7.4 9.5
Help family members 2.4 7.2 3.6 4.3 3.9
Don’t know 2.8 3 2.8 2.8 1.9
Other 1.9 1.9 1.9 1.9 1.7
Increase employees’ wages 0.1 0.2 0.1 0.1 0.3
Source: 2014/15 HB&IS survey, VASS-CAF & IRD-DIAL; authors’ calculations.

chapter 11 | The household Businesses and the Informal sector in vietnam | 301
CONClUSION
In conclusion, this chapter has investigated several aspects of the subjective well-being of HBs, including motivation, satisfaction, problems, need for assistance and allocation of extra earnings. The main results show that on the one hand, compared to the other activities/opportunities in the labour market, the owners of HBs are able to earn a better income, have greater independence, manage a work-life balance and enjoy a greater level of satisfaction. On the other hand, those difficulties exist and there has been a broad call for assistance from HB owners.
Generally, working in the HB sector and in the informal sector is not a second choice. Firstly, most HB owners start their business for positive reasons, e.g. to be indepen-dent, to reconcile family life with business or to complement their income. Consistent with the traditional roles of women, wanting to reconcile family life with business is more often a reason among women than men for starting a HB. Secondly, work satis-faction in the informal sector is rather high, despite the fact that this sector is made up of micro-businesses that are vulnerable, often operate in poor working conditions and provide a low income on average (see Chapter 6). Rare are the HB owners who think of changing their activity or who would prefer to work as an employee for a monthly income of five million VND. However, most HB owners do not want their children to take over their business; they want them to work in the public sector (their first choice) or the private sector.
This paradox and the past trajectories of the HB owners suggest that although the high flexibility of working in the informal sector makes it a desirable choice, the scope of possibility for HB owners is limited. Other options are mostly working on a farm and earning a lower income or working as an unskilled labourer at a private enterprise, where income can be higher but managers can be very strict and not allow them to reconcile their personal and professional lives or to feel independent. Family tradi-tion, which may provide specific know-how or even a comparative advantage, is also an important motivation for a specific segment of the HB sector, especially in the manufacturing sector and among the owners of formal HBs. Again, this highlights the multi-segmentation of the HB sector and, more generally, of the labour market in Vietnam, where working in the HB sector is a lifelong trajectory.
In addition, most HBs face problems running their business. Eight out of ten infor-mal HBs stated that they still face difficulties, and over one third of them face at least one severe problem. The most prevalent problem for HBs is a high level of competi-

| The household Businesses and the Informal sector in vietnam | chapter 11302
tion, especially in the trade sector. This calls for policy aimed at improving access to information about market opportunities in order to develop niches for the HB sector, especially HBs in the trade sector. A lack of liquidity and credit is the second biggest problem for HBs. Almost half of the HBs complained about financial constraints. This is a huge limitation for the development of HBs and their capacity to invest and inno-vate. The call for assistance accessing loans confirms the need for a policy aimed at the further development of the short- and mid-term credit market for HBs. However, this credit market should be strictly monitored to avoid the use of loans for consumption purposes.
More generally, there has been a massive call for support from HB owners, with an upward trend in the call for assistance among informal HBs in Hanoi and HCMC between 2007 and 2014. This suggests that HBs in general and informal ones in particular no longer perceive themselves as external to the market economy. They demand better access to bank loans and to large orders, which any actor in a market economy should be entitled to. Even if the informal sector is not well integrated into the economy when measured through the purchases and sales of products between sectors (see Chapter 5), the perception of its stakeholders is somewhat different. This also entails a change of vision in the policy towards this sector.
These results directly call for concrete policies that address the difficulties that HBs and the informal sector face, and they correspond to the types of assistance needed, taking into account the specific characteristics of the HB sector and its heterogeneity. The question of formalisation might be less relevant, as formal HBs face no less diffi-culty and are not more satisfied than their informal counterparts. Therefore, the HB and informal sectors may no longer be a residual part of the market economy to be eliminated, but should be seen as a specific realm characterized by a high degree of flexibility.

chapter 11 | The household Businesses and the Informal sector in vietnam | 303
appENDIx
TABLe 11.A. DeTeRmINANTS OF LeVeL OF jOB SATISFACTION AmONg HB OwNeRS (ORDeReD LOgIT mODeL)
Formal HB (ref. informal) -0.150 (0.0805)
Urban (ref. rural) 0.0859 (0.159)
Sector of activity (ref. manufacturing & construction)
Trade -0.289* (0.121)
Service -0.318** (0.0806)
Number of workers (ref. 1 worker)
Two workers 0.120 (0.121)
3-5 workers 0.101 (0.111)6-18 workers 0.434 (0.251)
Quartile of value added (ref. 1st quartile)
Quartile 2 0.379* (0.168)
Quartile 3 0.886*** (0.0965)
Quartile 4 1.122*** (0.154)
Duration of the business (ref. 0-4 years)
5-9 years 0.0996 (0.0777)
10-16 years 0.261 (0.136)
More than 16 years 0.207 (0.175)
education level of the owner (ref. no diploma/certificate)
Primary -0.0160 (0.0940)
Lower secondary -0.0620 (0.118)
Upper secondary -0.0518 (0.0832)
Superior -0.203 (0.340)
Age of the owner (ref. <26 years old)
26-35 -0.574* (0.246)
36-45 -0.709** (0.160)
46-55 -0.768** (0.210)
56-65 -0.926** (0.242)>65 -0.124 (0.405)

| The household Businesses and the Informal sector in vietnam | chapter 11304
Constant cut1 -4.789*** (0.199)
Constant cut2 -2.319*** (0.234)
Constant cut3 -0.527* (0.237)
Constant cut4 2.324*** (0.221)
Observations 3,411
TABLe 11.B. wHICH HBS ARe mOST LIkeLY TO CALL FOR ASSISTANCe? (LOgIT)
Probability of calling for assistance
Total employment (including owner & spouse) 0.013** (0.007)
Formal HB (ref. informal) 0.028 (0.020)
Urban (ref. rural) -0.075*** (0.017)
Sector of activity (ref. manufacturing & construction)
Trade -0.024 (0.021)
Service -0.081*** (0.020)
Duration of the business (ref. 0-4 years)
5-9 years -0.037 (0.023)
10-16 years -0.046** (0.023)
More than 16 years -0.089*** (0.024)
education level of the owner (ref. no diploma/certificate)
Primary -0.044 (0.028)
Lower secondary -0.006 (0.028)
Upper secondary -0.022 (0.029)
Superior -0.084* (0.048)
Age of the owner (ref. <26 years old)
26-35 -0.047 (0.047)
36-45 -0.048 (0.046)
46-55 -0.159*** (0.047)
56-65 -0.208*** (0.051)
> 65 -0.295*** (0.067)
Observations 3,411
Robust standard errors in parentheses; *** p<0.01, ** p<0.05, * p<0.1. The second column reports marginal effects at means
Source: 2014/15 HB&IS survey, VASS-CAF & IRD-DIAL; authors’ calculations.

references | The household Businesses and the Informal sector in vietnam | 305
references
Abernathy w. and Utterback j. (1978), “Patterns of Industrial Innovation”, Technology Review, vol. 80, pp. 41-47.
ADB (2011), “A handbook on using the mixed survey for measuring informal employment and the informal sector”, Mandaluyong City, Philippines: Asian Development Bank.
ADB (2014), “Viet Nam: Financial sector Assessment, Strategy, and Road Map”,Mandaluyong City, Philippines: Asian Development Bank.
ADB (2015), “Sector Assessment: Microfinance-Vietnam”, RRP VIE 42235-023.
Amin, Nurul A.T.m. (2001), “The Informal Sector in Asia from the Decent Work Perspective, International Labour Organization, Employment paper 2002/4”, Geneva.
Aubert j. e. (2005), “Promoting Innovation in Developing Countries: A Conceptual Framework”, World Bank Policy Research Working Paper 3554, World Bank Institute. Available online at http://econ. worldbank.org.
Aubert C., de janvry A. and Sadoulet e. (2009), “Designing credit agent incentives to prevent mission drift in pro-poor microfinance institutions”, Journal of Development Economics, vol. 90 (1), pp. 153–162.
Bacchetta m., ernst e. and Bustamante j-P. (2009), “Globalization and Informal Jobs in Developing Countries”, International Labour Organization and World Trade Organization.
Barslund m. and Tarp F. (2007),”Formal and Informal Rural Credit in Four Provinces of Vietnam”, Discussion paper 07-07, Department of Economics, University of Copenhagen.
Barwa S. D. (1995), ”Structural adjustment programmes and the urban informal sector in Ghana”, International Labor Office, Development and Technical Cooperation Department.

| The household Businesses and the Informal sector in vietnam | references306
Beaver g. and Prince C. (2004), “Management, strategy, and policy in the UK small business sector: a critical review”, Journal of Small Business and Enterprise Development, vol. 11(1), pp. 34-49.
BLS (Bureau of Labor Statistics) (2015), “Employment Projections - 2010-20. Employer reported workplace injuries and illnesses - 2014”, News release, 10/2015.
Blunch N. H., Canagarajah S. and Raju D. (2001), “The informal sector revisited: A synthesis across space and time”, World Bank Social Protection Discussion Papers, No119.
Böhme m. and Thiele R. (2012), “Is the Informal Sector constrained from the Demand Side? Evidence for Six West African Capitals”, World Development, vol. 40(7), pp. 1369-1381.
Boucher S. and guirkinger C. (2007), “Risk, wealth, and sectoral choice in rural credit markets”, American Journal of Agricultural Economics, vol. 89(4), pp. 991-04.
Bryceson D. F. (2002), “The Scramble in Africa: Reorienting Rural Livelihoods”, World Development, vol. 30(5), pp. 725-739.
Calomiris C.w. and Rajaraman I. (1998), “The role of ROSCAs: lumpy durables or event insurance?”, Journal of Development Economics, vol. 56(1), pp. 207-216.
Canagarajah S. and Sethuraman S.V. (2001), “Social Protection and the Informal Sector in Developing Countries: Challenges and Opportunities”. The World Bank, Social Protection Discussion Paper Series No. 0130.
Castel P. and gian T. C. (2010), “Vietnam Informality and Social and Health Insurance Issues”, International Conference “The Informal Sector and Informal Employment: Statistical Measurement, Economic Implications and Public Policies”, Hanoi, May 6-7, 2010.
Castel P., La Hai Anh and Tran N.m. Tam (2014), “Social Protection Programs in Vietnam”, Cash transfers, Social Insurance and Indirect Transfers, Hanoi, mimeo.
Chaudhuri S. (2001), “Interaction of formal and informal credit markets in Backward Agriculture: A theoretical Analysis”, Indian Economic Review, vol. 36(2), pp. 411-428.
Chen m. A. (2007), “Rethinking the Informal Economy: Linkages with the Formal Economy and the Formal Regulatory Environment”, New-York, DESA Working Paper No. 46, United Nations.
Cling j-P., Lagrée S., Razafindrakoto m. and Roubaud F. (eds.) (2014), “The Informal Economy in Developing Countries”, Routledge: London/New York.
references | The household Businesses and the Informal sector in vietnam | 307
Cling j-P., Nguyen Thị Thu Huyen, Nguyen Huu Chi, Phan Thi, Ngoc Tram, Razafindrakoto m. and Roubaud F. (2010),, “The Informal Sector in Vietnam: A focus on Hanoi and Ho Chi Minh City”, Hanoi, The Gioi Publisher.
Cling j-P., Razafindrakoto m. and Roubaud F. (2011), “The informal economy in Vietnam”, Eds: MOLISA, ILO, Hanoi.
De Beer j., Fu k. and wunsh-Vincent S. (2016), “Innovation in the Informal Economy”. In Kraemer-Mbula E. and Wunsh-Vincent S. (Eds): The Informal Economy in Developing Nation”, World Intellectual Property Organization, Cambridge University Press, Cambridge 2016.
Demenet A., Razafindrakoto m. and Roubaud F. (2016), “Do Informal Businesses Gain From Registration and How? Panel Data Evidence from Vietnam”, World Development, vol. 84, pp. 326-341.
Demombynes g. and Vu Linh Hoang (2015), “Demystifying Poverty Measurement in Vietnam”, Vietnam Development Economics Discussion Paper 1, World Bank, Hanoi.
De Paula A. and Scheinkman j. A. (2011), “The informal sector: an equilibrium model and some empirical evidence from Brazil”, Review of Income and Wealth, vol. 57(1), pp. 8-26.
De Soto H. (1989), “The Other Path: The Invisible Revolution in the Third World”, Ed. Harper Row, New York.
Durlauf S.N. and Fafchamps m. (2005), “Social Capital.” In : Handbook of Economic Growth, ed. Aghion Philippe and Steven N. Durlauf. ed1, vol. 1(26), pp. 1639-1699.
Falk A., Fehr e. and zehnder C. (2005), “The behavioral effect of minimum wage”, IZA DP No. 1625 Institute for Labour Studies, Bonn.
gereff g., Humphrey j. and Sturgeon T. (2005), “The Governance of Global Value Chains”, Review of International Political Economy, vol. 12(1), pp. 78-104.
giang Dang. Hoang, Phung Thuanh. Xuan and Hai Ninh Quang (2016), “Corruption risks in Vietnam’s household business sector, Crime”, Law and Social Change Journal, 65:395.
grimm m., knorringa P. and Lay j. (2012), “Constrained gazelles: high potentials in west Africa’s informal economy”, World Development, vol. 40(7), pp. 1352-1368.
gSO (2011), “Results of a survey on non-farm individual business establishments” 2010, Statistical Publishing House, Hanoi.

| The household Businesses and the Informal sector in vietnam | references308
gSO (2012), “Results of the 2011 Rural, Agricultural and Fishery Census”, Statistical Publishing House, Hanoi.
gSO (2013), “Results of the 2012 Establishment Census”, Statistical Publishing House, Hanoi.
gSO (2014), “Statistical Handbook of Vietnam”. Hanoi, Statistical Publishing House.
gSO (2015), “Results of a survey on non-farm individual business establishments 2014”, Statistical Publishing.
guirkinger C. (2008), “Understanding the coexistence of formal and informal credit markets in Piura, Peru”, World Development, vol. 36 (8), pp. 1436-1452.
Hadaya P. (2006), “Determinants of the future level of use of electronic marketplaces: The case of Canadian firms”, Electronic Commerce Research, vol. 6(2), pp. 173-185.
Hadjimanolis A. (2000), “A Resource-based View of Innovativeness in Small Firms”, Technology Analysis and Strategic Management, vol. 12(2), pp. 263-281. House, Hanoi.
Hampel-milagrosa A., Pham, Van Hong, Nguyen Anh, Quoc. and Nguyen Tri Thanh (2010), “Gender related Obstacles To Vietnamese Women Entrepreneurs” Technical report prepared for the UN-GOV Joint Programme on Gender Equality, by the United Nations Industrial Development Organization (UNIDO).
Harris j.R. and Todaro m. P. (1970), “Migration, unemployment, and development: A two-sector analysis,” American Economic Review, vol. 60, pp. 126-142.
Harrison A. and Leamer. e. (1997), “Labor markets in developing countries: an agenda for research”, Journal of Labor Economics, vol.15(3), pp.1-19.
Hart k. (1972), “Employment, income and inequality: A strategy for increasing productive employment in Kenya”. Geneva: International Labor Organization.
Hoang Ha and Antoncic B. (2003), “Network-based Research in Entrepreneurship: A Critical Review”, Journal of Business Venturing, vol. 18(2), pp.165-187.
Hohberg m. and Lay j. (2015), “The impact of minimum wages on informal and formal labor market outcomes: evidence from Indonesia”, IZA Journal of Labor & Development, vol. (2015)4,14, 25 p.
Hussin H., king m. and Cragg P. (2002), “IT alignment in small firms’, European”, Journal of Information Systems, vol. 11, pp. 108-127.
ILO (1972), Employment, Incomes and Equality: A Strategy for Increasing Productive Employment in Kenya, International Labour Office, Geneva.

references | The household Businesses and the Informal sector in vietnam | 309
ILO (1992), “The urban informal sector in Asia: An annotated bibliography”, International Labour Office, Geneva.
ILO (2012), “Measuring Informality: a Statistical Manual on the informal sector and informal employment”, International Labour Office, Geneva.
ILO (2012), “Decent Work Indicators - Concepts and Definitions”, First edition, International Labour Office, Geneva.
ILO (2015), “KILM 3”. Status in Employment, In Key Indicators of the Labour Market”, Ninth Edition, International Labour Office, Geneva.
ILSSA (2015), Social protection for all. Policy brief No.2.
Ioannides Y. and Loury L.D. (2004), “Job Information Networks, Neighborhood Effects, and Inequality”, Journal of Economic Literature, vol. 42(4), pp. 1056-1093.
johannessen j. A., Olsen B. and Lumpkin g. T. (2001), “Innovation as newness: what is new, how new, and new to whom?”, European Journal of Innovation Management, vol. 4(1), pp. 20-31.
kalakota R. and whinston A. (1997), “Electronic Commerce”, Addison-Wesley.
khamis m. (2008), “Does the Minimum Wage Have a Higher Impact on the Informal than on the Formal Labor Market? Evidence from Quasi-Experiments”, IZA DP No. 3911, Institute for Labour Studies, Bonn.
kochar A. (1997), “An empirical investigation of rationing constraints in rural credit markets in India”, Journal of Development Economics, vol. 53 (2), pp. 339-371.
kraemer-mbula e. and wamae w. (2010), The Relevance of Innovation Systems to Developing Countries”, In E. Kraemer-Mbula and W. Wamae (Eds.), Innovation and the Development Agenda Paris, OECD, pp. 39-6.
La Porta R. L. and Shleifer A. (2014), “Informality and Development”, NBER Working Paper No. 20205.
La Porta R. L. and Shleifer A. (2008), “The unofficial economy and economic development”, NBER Working Paper No. 14520.
Le Ngoc T.B. and Nguyen Thang V. (2009), “The Impact of Networking on Bank Financing: The Case of Small and Medium-Sized Enterprises in Vietnam”, Entrepreneurship Theory and Practice, vol.33(4), pp. 867-887.
Levy S. (2008), “Good Intentions, Bad Outcomes: Social Policy, Informality and Economic Growth in Mexico”, Brookings Institution Press.

| The household Businesses and the Informal sector in vietnam | references310
Leontief w. (1986), “Input-Output Economics”, 2nd ed., New York: Oxford University Press.
malesky e.j. and Taussig m. (2008), “Where Is Credit Due? Legal Institutions, Connections, and the Efficiency of Bank Lending in Vietnam”, The Journal of Law, Economics & organization, vol. 25(2), pp.535-578.
maloney w.F. and Nuñez mendez j. (2004), “Measuring the Impact of Minimum Wages: Evidence from Latin America”. In: Pagés C, Heckman J.J. (eds) Lessons from Latin America and the Caribbean. University of Chicago Press, Law and Employment, pp. 109-130.
maloney w.F. (2004), “Informality Revisited”, World Development, vol.32(7), pp. 1159-1178.
mcgaig B. and Pavcnik N. (2015), “Informal employment in a growing and globalizing low-income country”, American Economic Review, vol. 105(5), pp. 545-50.
mcIntyre D., Thiede m., Dahlgren g. and whitehead m. (2006), “What are the economic consequences for households of illness and of paying for health care in low-and middle-income country context?”, Social Science & Medicine, vol. 62, pp. 858-65.
mcmillan j. and woodruff C. (1999), “Interfirm Relationship and Informal Credit in Vietnam”, The Quarterly Journal of Economics, vol. 114(4), pp. 1285-1320.
mead D.C. and morrisson C. (1996), “The Informal Sector Elephant”, World Development, vol. 24 (10), pp.1611-1619.
mincer j. (1958), “Investment in Human Capital and Personal Income Distribution”, Journal of Political Economy, vol. 66(4), pp. 281-302.
ministry of Health and Health Partnership group (2013), Joint Annual Health Review: Towards Universal Health Coverage, Hanoi.
Nguyen Huu Chi (2012), “Informal sector and employment in rural area in the Red River delta (Vietnam) in the process of economic integration: a comparison with the urban area”, PhD thesis, University Paris 13.
Nguyen Huu Chi, Nguyen Thi Thu Huyên, Demenet A., Razafindrakoto m. and Roubaud F. (2010), “Dynamics of the informal sector in Hanoi and Ho Chi Minh city 2009”.
Nguyen Ngoc Anh, Doan Quang Hung and Nguyen Thi Phuong mai (2013), ‘’The Vietnam national innovation system - a diagnostic review’’, Tech Monitor, Apr-Jun 2013, pp. 42-52.

references | The household Businesses and the Informal sector in vietnam | 311
Nguyen Huu Chi and Nordman C.j. (2014), “Household entrepreneurship and Social Networks: Panel Data Evidence from Vietnam”, DIAL Working Paper 2014/22.
Nguyen Thang V., Le Ngoc T.B and Freeman N.j. (2006), “Trust and Uncertainty: a Study of Bank Lending to Private SMEs in Vietnam”, Asia Pacific Business Review, vol.12(4), pp. 547-568.
Nguyen kim Thuy, khuat Oanh Thi Hai, Shuannge ma, Pham Duc Cuong, khuat giang Thi Hong and Ruger j.P. (2012a), “Coping with health care expenses among poor households: Evidence from a rural commune in Vietnam”, Social Science & Medicine, vol. 74(5), pp. 724-733.
Nguyen kim Thuy, khuat Oanh Thi Hai, Shuannge ma, Pham Duc Cuong, khuat giang Thi Hong and Ruger j.P. (2012b), “Impact of health insurance on health care treatment and cost in Vietnam: a health capability perspective”, American Journal of Public Health, vol. 102(8), pp. 1450-61.
Oudin X., Pasquier-Doumer L., Pham minh Thai, Roubaud F. and Vu Hoang Dat (2013), “Adjustment of the Labour Market in Time of Economic fluctuations and Structural Changes”, In Nguyen Duc Thanh (Ed), “Vietnam Annual Economic Report 2013: On the bumpy road to future”, VEPR, pp. 230-262. Published also in Vietnamese.
OeCD (2013), “Vietnam: Innovation Profile, Innovation in Southeast Asia”, OECD Publishing. Available online at http://dx.doi.org/10.1787/9789264128712-12-en.
Pasquier-Doumer L. (2012), “Inequality of Opportunity in the Urban Labour Market in West Africa”, Revue d’Economie du Développement, vol. 26(2), pp. 44-66.
Platteau j-P. and Abraham A. (2002), “Participatory development in the presence of endogenous community imperfections”, Journal of Development Studies, 39(2). pp. 104-136.
Pratap S. and Quintin e. (2006), “The informal sector in developing countries: Output, assets and employment”, Research Paper, UNU-WIDER, United Nations University (UNU), No. 2006/130.
Rand j. (2007), “Credit constraints and determinants of the cost of capital in Vietnamese manufacturing”, Small Business Economics, vol. 29(1), pp 1-13.
Razafindrakoto m. and Roubaud F. (2003), “Two original poverty monitoring tools: the 1-2-3 surveys and the Rural Observatories”, in Cling J.-P., Razafindrakoto M., Roubaud F. (eds), New International Poverty Reduction Strategies, Routledge: London/ New York, pp. 313-339.

| The household Businesses and the Informal sector in vietnam | references312
Razafindrakoto m., Roubaud F. and wachsberger j-m. (2012), “Satisfaction dans l’emploi et le secteur informel au Vietnam”, in: J.P. Cling, S. Lagrée, M. Razafindrakoto and F. Roubaud (eds). L’économie informelle dans les pays en développement, Collections Conférences and séminaires, N°6, Agence Française de Développement, Paris.
Rodrik D. (2014), “Has Sustained Growth Decoupled from Industrialization?”, In Shahid Yusuf and Danny Leipziger (ed.), How Economies Growth?, The Growth Dialogue.
Roubaud F. (1994), “L’économie informelle au Mexique: de la sphère domestique à la dynamique macro-économique”, Paris: Karthala.
Saint-macary C. (2015), “Microeconomic Impacts of Institutional Change in Vietnam’s Northern Uplands: Empirical Studies on Social Capital, Land and Credit Institutions”, Development Economics and Policy Series, vol. 71, Peter Lang Verlag, Frankfurt am Main, Germany.
Sauerborn R., Adams A. and Hien m. (1996), “Household strategies to cope with the economic costs of illness”, Social Science & Medicine, vol. 43(3), pp. 291-301.
Schumpeter j. (1934), “The Theory of Economic Development”, Cambridge, MA: Havard University Press.
Sepehri A., moshiri S., Simpson w. and Sarma S. (2008), “Taking account of context: how important are household characteristics in explaining individual health seeking behaviour? The case of Vietnam”, Health Policy and Planning, vol. 3(6), pp. 397-407.
Sethuraman S.V. (1976), “The Urban Informal Sector: Concept, Measurement and Policy”, International Labour Review, vol. 114 (1), pp. 69-96.
Souza P. R. and P.e. Baltar (1979), “Salário mínimo e taxa de salários no Brasil”, Pesquisa e Planejamento Ecnômico, vol. 9(3), pp. 629-60.
Solow R. m. (1956), “A Contribution to the Theory of Economic Growth”, Quarterly Journal of Economics, vol. 70(1), pp. 65-94.
Stiglitz j. and weiss A. (1981), “Credit Rationing in Markets with Imperfect Information”, American Economic Review, vol. 71(3), pp. 393-410.
Swan T.w. (1956), “Economic and Capital Accumulation”, Economic Record, vol. 32(2), pp. 334-361.
Tarp F. and Rand j. (2012), “Firm-level Competitiveness and Technology in Vietnam: Evidence from a survey in 2011”, Central Institute of Economic Management (CIEM), Hanoi.

references | The household Businesses and the Informal sector in vietnam | 313
Turner S. and Schoenberger L. (2012), “Street Vendor Livelihoods and Everyday Politics in Hanoi, Vietnam: the Seeds of a Diverse Economy?”, Urban Studies, vol. 49(5) pp. 1027-1044.
UNDP and VASS (2016), Growth that Works for All: Viet Nam Human Development Report 2015 on Inclusive Growth. Hanoi: Social Sciences Publishing House.
Utterback j. and Abernathy w. (1975), “A Dynamic Model of Process and Product Innovation”, Omega, vol. 3(6), pp. 639-656.
Van Doorslaer e, O’Donnell O, Rannan-eliya RP, Somanathan A, Adhikari SR, garg CC, Harbianto D, Herrin AN, Huq mN, Ibragimova S, karan A, Lee Tj, Leung gm, Lu jF, Ng Cw, Pande BR, Racelis R, Tao S, Tin k, Tisayaticom k, Trisnantoro L, Vasavid C, zhao Y. (2007), “Catastrophic Payments for Health Care in Asia”, Health Economics, vol. 16(11), pp.1159-1184.
Vescovo A. (2007), “La mesure des revenus et du niveau de vie des ménages: cohérence interne des enquêtes 1-2-3 de sept capitales économiques de l’UEMOA ”, Bamako, Mali: AFRISTAT.
Vu Hoang Nam and Doan Quang Hung (2015), ”Innovation and Performance of Enterprises: The Case of SMEs in Vietnam”, MPRA Paper No. 70589. Available at https://mpra.ub.uni-muenchen.de/70589/
weeks j. (1975), “Policies for Expanding Employment in the Informal Urban Sect or of Developing Economies”, International Labour Review, vol. 111, pp.1-13.
world Bank, Doing Business (2016), Measuring regulatory quality and efficiency, economy profile 2016 - Vietnam, Washington DC.

| The household Businesses and the Informal sector in vietnam314

list of tables | The household Businesses and the Informal sector in vietnam | 315
lIsT of TaBles
01. meASURemeNT OF HOUSeHOLD BUSINeSSeS AND THe INFORmAL SeCTOR: CONCePTS AND SURVeY meTHODOLOgY .......................................... p. 25
1.1.Number of HBs surveyed per province by registrati on and geographical area ...... p. 31
1.2. Number of HBs estimated in the NFIDBE surveys and the 2014 LFS ............................ p. 41
02. eVOLUTION OF THe INFORmAL AND HOUSeHOLD BUSINeSS SeCTORSIN VIeTNAm IN A TIme OF gROwTH AND TRADe LIBeRALIzATION ......... p. 43
2.1. Socio-demographic characteristics of workers in the HB and informal sectors in 2007 and 2014 ........................................................................................................................... p. 54
2.2. Number of working hours per week by institutional sector in 2007 and 2014 ............................................................................................................................................ p. 59
2.3. Real monthly and hourly income of wage workers by institutional sector in 2007 and 2014 ............................................................................................................................. p. 60
03. CHARACTeRISTICS OF HOUSeHOLD BUSINeSSeS AND THe INFORmAL SeCTOR ............................................................................. p. 63
3.1. Size distribution of household businesses by area ................................................................... p. 67
3.2. Average number of workers and structure of HBs by characteristics of employment in Hanoi and Ho Chi Minh City, 2007 and 2014 ..................................... p. 68
3.3. Types of premises among household businesses ..................................................................... p. 70
3.4. Median surface of premises by type and area ............................................................................. p. 71
3.5. Percentage of owners of premises among household businesses by sector and area ......................................................................................................................................... p. 73
3.6. Distribution of HBs by occupancy status ........................................................................................ p. 74
3.7. Evolution of the type of premises among informal HBs in Hanoi and Ho Chi Minh City ................................................................................................................................... p. 75
3.8. Bookkeeping by sector, formality and size of HBs ..................................................................... p. 77
3.9. Types of bookkeeping in Hanoi and Ho Chi Minh City in 2007 and 2014 .................. p. 79
3.10. Administrative registration by sector and geographical area ......................................... p. 80

| The household Businesses and the Informal sector in vietnam | list of tables316
3.11. Tax and social security registration by sector and business registration status .... p. 81
3.12. Types of registration in Hanoi and Ho Chi Minh City in 2007 and 2014 .................... p. 83
3.13. Reasons informal HBs have for not registering ......................................................................... p. 84
3.14. Trend in the perceived advantage of registering a business among informal HB owners in Hanoi and Ho Chi Minh City in 2007 and 2014 ..................... p. 88
3.15. HBs preparing to register in Hanoi and Ho Chi Minh City in 2007 and 2014 ......... p. 88
3.A. Determinants of business registration, tax registration and social security registration ...................................................................................................................................... p. 91
04. wORkeRS IN THe INFORmAL SeCTOR: wHO ARe THeY AND wHAT ARe THeIR wORkINg CONDITIONS? ........................................... p. 93
4.1. Share of migrants in the HB sector by industry and formality status ............................ p. 96
4.2. Seniority of workers and duration of HB, by job status .......................................................... p. 97
4.3. Rate of wage workers by industry and geographical area ................................................ p. 102
4.4. Share of dependent workers without a contract by industry, formality status and employment status ..................................................................................... p. 103
4.5. Share of temporary workers among dependent workers by industry and formality status ................................................................................................................................... p. 104
4.6. Social security and other benefits among dependent workers by formality status ...................................................................................................................................... p. 105
4.7. Working hours per week by job status and formality status ............................................ p. 107
4.8. Earnings by industry in the informal sector ................................................................................ p. 109
4.9. Earnings by job status at informal HBs ........................................................................................... p. 111
4.10. Comparison of the income of wage workers in the informal sector and the minimum wage by region ............................................................................................... p. 112
4.11. Labour conditions of dependent workers in the informal sector .............................. p. 114
4.12. Evolution of the average and median real income by industry 2007-2014 ........ p. 114
4.A. Estimation of the determinants of the logarithm of individual incomes of wage workers by MCO ...................................................................................................................... p. 118
05. CONTRIBUTION OF HBS AND THe INFORmAL SeCTOR TO THe eCONOmY .............................................................................................. p. 121
5.1. Total value added of the HBs and the informal sector and their share of the GDP .................................................................................................................... p. 124
5.2. Distribution of value added and employment by industry in the HB sector ........ p. 129
5.3. Components of the value added in the HB sector by economic sector .................. p. 130
5.4. Components of the value added of informal and formal HBs with wage workers ................................................................................................. p. 130

list of tables | The household Businesses and the Informal sector in vietnam | 317
5.5. Payment of different taxes (percentage of HBs that pay each type of tax) ............. p. 132
5.6. Labour productivity per year and per worker and per hour ............................................ p. 138
5.7. Average productivity per hour by size of the HBs and the number of wage workers .................................................................................................... p. 140
5.8. Labour productivity per hour in Hanoi and Ho Chi Minh City, 2007-2014 ............. p. 141
5.9. Distribution of HBs by the number of non-working months, registration status and area ................................................................................................................... p. 144
5.10. Average ratio between the maximum and minimum levels of production ........ p.145
5.11. Origin of products purchased by HBs .......................................................................................... p. 148
5.12. Percentage of HBs that sell a portion of their products and services to state entities ............................................................................................................. p. 151
5.13. Percentage of HBs working as subcontractors or producing made-to-order goods in the manufacturing industry ....................... p. 153
5.14. Main competitors by formality status and economic sector ........................................ p. 156
06. PeRFORmANCe OF HBS AND THe INFORmAL SeCTOR ....................... p. 159
6.1. Average monthly turnover, value added and profit in the HB sector ........................ p. 161
6.2. Median monthly profit of HBs compared to the minimum wage ................................ p.166
6.3. Distribution of the monthly value added by sector and registration status ............ p.169
6.4. Median and mean assets by main sector ..................................................................................... p. 174
6.5. Median value of initial capital of HBs by economic sector ................................................ p. 178
6.6. Growth since the start of the business in terms of workers by area and registration status ................................................................................... p. 182
6.A. Determinants of the log value added (OLS estimation) ..................................................... p. 186
07. ARe HOUSeHOLD BUSINeSSeS CONSTRAINeD IN THeIR ACCeSS TO CReDIT ? .......................................................................... p. 187
7.1. General loan characteristics by lender and loan size ............................................................ p. 194
7.2. Credit rationing by geographic area and registration status ........................................... p. 203
7.3. Constraint rates among HBs with a demand for credit according to their characteristics and the characteristics of the owners ......................................... p. 205
7.4. Proportion of unsuccessful loan applications by lender type, geographic area and registration status for loans over or equal to 5 million VND ........................ p. 206
7.5. Reasons given for complete rejection of applications for loans over or equal to 5 million VND over the past 3 years ....................................... p. 207
7.6. Use of the loans by source of credit ................................................................................................ p. 210
7.A. Determinants of credit access – Two-stage probit regression model ....................... p. 212

| The household Businesses and the Informal sector in vietnam | list of tables318
08. INNOVATION IN THe HOUSeHOLD BUSINeSS AND INFORmAL SeCTORS ................................................................................ p. 213
8.1. Proportion of HBs that innovated their product/technology within the past 12 months .................................................................................................................... p. 216
8.2. Ratio of labour productivity between product/technology innovators and non-innovators ................................................................................................................................... p. 217
8.3. Proportion of HBs that innovated their input/output market during the past 12 months ................................................................................................................... p. 218
8.4. Ratio of labour productivity between input/output market innovators and non-innovators ................................................................................................................................... p. 219
8.5. Among the innovators: A combination of innovation methods ................................... p. 220
8.6. Ratio of labour productivity between innovators and non-innovators .................... p. 221
8.7. Internet usage among innovators and non-innovators ..................................................... p. 222
8.8. Future innovation among innovators and non-innovators .............................................. p. 223
8.9. Innovation across owner and HB characteristics by registration status and industry ................................................................................................... p. 224
8.A. Factors associated with HB labour productivity: OLS regressions ............................... p. 227
09. UNDeRSTANDINg HOUSeHOLD BUSINeSS VULNeRABILITY AND THe CHALLeNge OF SOCIAL PROTeCTION ......................................... p. 229
9.1. Incidence of sickness among HB owners (in the past 12 months) by age and by profit category ............................................................................................................. p. 233
9.2. Health insurance coverage among household business owners: A comparison with previous findings ............................................................................................ p. 239
9.3. Health insurance coverage and type among household business owners by profit quartile .......................................................................................................................................... p. 241
9.4. Annual health expenditures and share of the annual profits earned by HBs ........ p. 245
9.A. Sickness and labour input: variation (/last year) in the average number of hours worked per worker and the number of days worked in the last month ......................................................................................................................................... p. 248
10. THe USe OF SOCIAL NeTwORkS IN THe FUNCTIONINg OF HOUSeHOLD BUSINeSSeS .......................................................................... p. 249
10.1. Social networks of HB owners by access to formal loans and by area .................... p. 256
10.2. Characteristics of the ties between an owner and his/her main supplier when the supplier offers trade credit and when he/she does not ........ p. 257
10.3. Relationship between the owner and the landlord of his/her professional premises by area and formality status ......................................................................................... p. 259

list of tables | The household Businesses and the Informal sector in vietnam | 319
10.4. Renting conditions by characteristics of the ties between owners and the landlords of their professional premises ................................................................. p. 259
10.5. Relationship between the owners of manufacturing HBs and the potential lenders of tools and machinery by area and formality status ...................................... p. 261
10.6. Indicators of trustworthiness of employees according to their relationship with the owner among HBs with employees ........................... p. 264
10.7. Access to information through a social network among household businesses ........................................................................................................................... p. 267
10.8. Composition of the social network that provides information at the start of a business ...................................................................................................................... p. 267
10.9. Characteristics of non-family connections who provide advice at the start of a business ...................................................................................................................... p. 268
10.10. Proportion of owners who benefit from a supportive network by formality status and area ............................................................................................................ p. 270
10.A. Estimation of the probability of obtaining a large loan from a personal contact ....................................................................................................................... p. 273
10.B. Estimation of the probability of obtaining a large formal loan vs not obtaining a large loan or obtaining a large loan but from an informal credit source .......... p. 274
10.C. Estimation of the probability of obtaining trade credit, of being a family worker, of using a social network to access information and of not benefiting from financial support ........................................................................ p. 276
11. mOTIVATION, PROBLemS AND ASSISTANCe NeeDeD ......................... p. 279
11.1. Motivation for setting up a HB ......................................................................................................... p. 281
11.2. Level of satisfaction as a HB owner and possible options for the future ............... p. 286
11.3. Institutional sector where HB owners want their children to work .......................... p. 287
11.4. Previous occupation status among household business owners by geographic area and formality status ................................................................................... p. 288
11.5. Motivation for setting up a HB and satisfaction by previous occupation ............. p. 289
11.6. Motivation for setting up a HB by occupation of the father ......................................... p. 290
11.7. Main problems encountered by formality status ................................................................. p. 294
11.8. Manpower problems encountered by HBs by formality status, geographical area and sector of activity .................................................................................... p. 296
11.9. Assistance required by HB owners ................................................................................................ p. 297
11.10. Usage of extra earnings by formality and quartile of value added ........................ p. 300
11.A. Determinants of level of job satisfaction among HB owners (ordered logit model) ............................................................................................................................ p. 303
11.B. Which HBs are most likely to call for assistance? (logit model) ....................................... p. xx

| The household Businesses and the Informal sector in vietnam | list of figures320
lIsT of fIGures
01. meASURemeNT OF HOUSeHOLD BUSINeSSeS AND THe INFORmAL SeCTOR: CONCePTS AND SURVeY meTHODOLOgY .......................................... p. 25
1.1. Basic scheme of the 1-2-3 survey ......................................................................................................... p. 30
1.2. Map of household businesses interviewed ................................................................................... p. 32
1.3. The three-stage sampling process of the 2014/15 HB&IS ..................................................... p. 36
02. eVOLUTION OF THe INFORmAL AND HOUSeHOLD BUSINeSS SeCTORSIN VIeTNAm IN A TIme OF gROwTH AND TRADe LIBeRALIzATI ON ........ p. 43
2.1. Number of household businesses in 2007 in 2014 ................................................................... p. 45
2.2. Distribution of main jobs by institutional sector in 2007 and 2014 ................................ p. 46
2.3. Agricultural activity diversification and the informal sector at the household level in 2007 and 2014 ........................................................................................ p. 47
2.4. Distribution of jobs in each sector of non-farm activity by institutional sector in 2007 and 2014 ......................................................................................... p. 48
2.5. Distribution of jobs by sector of activity in the informal sector in 2007 and 2014 ............................................................................................................................................ p. 49
2.6. Intensity of the informal sector by province in 2007 and 2014 ......................................... p. 51
2.7. Socio-demographic characteristics of workers by institutional sector in 2014 ................................................................................................................................................... p. 53
2.8. Share of wage workers by institutional sector in 2007 and 2014 .................................... p. 55
2.9. Share of workers who paid for social security by institutional sector in 2007 and 2014 ............................................................................................................................. p. 56
2.10. Share of workers who work excessively at their main job by institutional sector in 2007 and 2014 ....................................................................................... p. 57
2.11. Underemployment rate by institutional sector in 2007 and 2014 ............................... p. 58

list of figures | The household Businesses and the Informal sector in vietnam | 321
03. CHARACTeRISTICS OF HOUSeHOLD BUSINeSSeS AND THe INFORmAL SeCTOR ............................................................................. p. 63
3.1. Size distribution of household businesses ..................................................................................... p. 65
3.2. Distribution of informal HBs by main economic sector and size in rural and urban areas .............................................................................................................................. p. 66
3.3. Occupancy status of non-owners by area and by main economic sectors ............... p. 74
3.4. Bookkeeping by size of HB ....................................................................................................................... p. 78
3.5. Social security registration by size of HB ......................................................................................... p. 82
3.6. What informal HB owners think about business registration ............................................. p. 86
3.7. Trend in the reasons informal HBs have for not registering in Hanoi and Ho Chi Minh City between 2007 and 2014 .......................................................................... p. 87
04. wORkeRS IN THe INFORmAL SeCTOR: wHO ARe THeY AND wHAT ARe THeIR wORkINg CONDITIONS? ........................................... p. 93
4.1. Distribution of female and male workers by job status and industry ........................... p. 95
4.2. Level of education by job status and formality status ............................................................ p. 98
4.3. Training of workers by industry and formality status ............................................................... p. 99
4.4. Structure of employment by job status in the formal and informal HBs ................. p. 101
4.5. Labour conditions by relationship with the owners in the informal sector ........... p. 106
4.6. Share of part-time workers by formality status and by job status ................................ p. 108
4.7. Income distribution at the HBs ........................................................................................................... p. 110
05. CONTRIBUTION OF HBS AND THe INFORmAL SeCTOR TO THe eCONOmY .............................................................................................. p. 121
5.1. Share of HBs in the non-farm GDP by economic sector ..................................................... p. 126
5.2. Share of value added produced in rural areas by informal and formal HBs and by economic sector ......................................................................................................................... p. 127
5.3. Share of HBs that had contact with the different administrative bodies and the share of HBs that had to pay a bribe ............................................................................ p. 133
5.4. Value added per year and per worker (labour productivity) by institutional sector ............................................................................................................................... p. 137
5.5. Total monthly production by formality status ........................................................................... p. 143
5.6. Distribution of HBs by level of activity each month .............................................................. p. 144
5.7. Median ratio between the maximum and minimum production level, 2007-2014, Hanoi and Ho Chi Minh City ...................................................................................... p. 146
5.8. Distribution of HBs by main supplier of raw materials ......................................................... p. 149

| The household Businesses and the Informal sector in vietnam | list of figures322
5.9. Total amount of sales of HBs by type of customer ................................................................. p. 150
5.10. Percentage of HBs that stated that they have competitors ........................................... p. 155
06. PeRFORmANCe OF HBS AND THe INFORmAL SeCTOR ....................... p. 159
6.1. Characteristics of HBs by level of profit related to the minimum wage ................... p. 167
6.2. Distribution of HBs by category of monthly value added and total number of workers ............................................................................................................... p. 169
6.3. Distribution of informal and formal HBs by category of monthly profit ................... p. 171
6.4. Median profit of the HBs and secondary activities by category of monthly profit ......................................................................................................................................... p. 172
6.5. Distribution of HBs by value of assets ............................................................................................ p. 175
6.6. Structure of capital among HBs by formality status and sector ..................................... p. 176
6.7. Distribution of HBs by category of profit and investment ................................................ p. 179
6.8. Distribution of investment by type of investment and sector ........................................ p. 180
6.9. Mode of financing investment ........................................................................................................... p. 181
6.10. Growth of informal HBs in terms of workers by sector ..................................................... p. 183
07. ARe HOUSeHOLD BUSINeSSeS CONSTRAINeD IN THeIR ACCeSS TO CReDIT ? .......................................................................... p. 187
7.1. Market shares of different lender types in the HB credit market by registration status and geographic area of the HBs ....................................................... p. 190
7.2. Application and self-rejection rates for formal and informal credit according to HB characteristics .......................................................................................................... p. 197
7.3. Application rates for formal and informal credit according to the characteristics of HB owners ....................................................................................................... p. 199
08. INNOVATION IN THe HOUSeHOLD BUSINeSS AND INFORmAL SeCTORS ................................................................................ p. 213
09. UNDeRSTANDINg HOUSeHOLD BUSINeSS VULNeRABI LIT Y AND THe CHALLeNge OF SOCIAL PROTeCTI ON ........................................ p. 229
9.1 Adverse events experienced by HB owners which generated significant expenditures in the past 24 months ....................................................................... p. 232
9.2. Strategies for coping with adverse events among HB owners who experienced adverse events in the past 24 months .................................................. p. 234
9.3. Sources of income on which HB owners plan to rely when they are old ................ p. 237
9.4. Reasons for not contributing to the VSS pension system .................................................. p. 238

list of figures | The household Businesses and the Informal sector in vietnam | 323
9.5. Type of health insurance among HB owners who have a health insurance card ............................................................................................................................................... p. 240
9.6. Reasons for not buying health insurance .................................................................................... p. 242
9.7. Healthcare utilisation among HB owners who had an illness within the past 12 months by health insurance status ................................. p. 243
9.8. Satisfaction with healthcare utilisation among HB owners by health insurance status ..................................................................................................................... p. 244
9.9. Coping strategies of HB operators who have health problems by health insurance status ..................................................................................................................... p. 246
10. THe USe OF SOCIAL NeTwORkS IN THe FUNCTIONINg OF HOUSeHOLD BUSINeSSeS .......................................................................... p. 249
10.1. Source of financial capital among HBs by type of capital ............................................... p. 251
10.2. Composition of social networks by type of informal credit ........................................... p. 254
10.3. Composition of family networks by type of informal credit .......................................... p. 254
10.4. Share of family members among employees and among wage workers by area and formality status ............................................................................................................... p. 262
10.5. Share of HB owners who agree or strongly agree with statements about family labour by whether or not they have wage workers ............................. p. 263
11. mOTIVATION, PROBLemS AND ASSISTANCe NeeDeD ......................... p. 279
11.1. Probability of a HB owner having a second job by area, industry and formality status ................................................................................................................................ p. 283
11.2. Secondary activities by sector .......................................................................................................... p. 284
11.3. Share of satisfied and very satisfied owners by motivation ........................................... p. 285
11.4. Sector of activity of the fathers of HB owners by formality status ............................. p. 290
11.5. Main problems encountered by HBs by industry ................................................................ p. 292
11.6. Trend in the main problems faced by HBs in Hanoi and HCMC, 2007-2014 ....... p. 295
11.7. Trend in assistance required by informal HBs, 2007-2014 ............................................... p. 299

| The household Businesses and the Informal sector in vietnam324

abbreviations | The household Businesses and the Informal sector in vietnam | 325
aBBrevIaTIons
CAF Centre of Analysis and ForecastingeA Enumeration AreaHB Household BusinessHBIS Household Businesses and Informal Sector IRD French National Research Institute for Sustainable DevelopmentgSO General Statistics OfficeHCmC Ho Chi Minh CityISS Institute of Statistical Science (GSO, Vietnam)LFS Labour Force SurveymDRI Mekong Development Research InstitutemFI Microfinance InstitutionNFIDBe Non-farm Individual Business Establishment SurveysNOPOOR Nopoor project funded by the European Union under the 7th Research
Framework ProgrammeOOP Out of Pocket PaymentsPPS Probability Proportional to Size methodPSO Provincial Statistics OfficePSU Primary Sampling UnitR&D Research and DevelopmentROSCA Rotating Savings and Credit AssociationSme Small and Medium EnterprisesSSU Secondary Sampling UnitVASS Vietnam Academy of Social SciencesVBARD Vietnam Bank for Agriculture and Rural DevelopmentVBSP Vietnam Bank for Social PoliciesVCP Communist Party of VietnamVND Viet Nam DongVSS Vietnam Social Security

| The household Businesses and the Informal sector in vietnam326

NHÀ XUẤT BẢN THẾ GIỚITrụ sở chính:Số 46. Trần Hưng Đạo, Hoàn Kiếm, Hà NộiTel: 0084.4.38253841 – Fax: 0084.4.38269578Chi nhánh:Số 7. Nguyễn Thị Minh Khai, Quận I, TP. Hồ Chí MinhTel: 0084.8.38220102Email: marketing@ thegioipublishers.vn Website: www.thegioipublishers.vn
The Importance of household Businesses and the Informal sector for Inclusive Growth in vietnam
Chịu trách nhiệm xuất bảnGIÁM ĐỐC – TỔNG BIÊN TẬPTS. TRẦN ĐOÀN LÂM
Biên tập:Vẽ bìa: ...............................................Trình bày: ........................................ Sửa bản in: .....................................
In 350 bản, khổ 16 cm x 24 cm tại Công ty TNHH Quảng cáo và phát triển thương hiệu Mê LinhĐịa chỉ: Số 10 lô TT2 khu tái định cư Phú Diễn, thôn Phú Diễn, xã Phú Diễn, huyện Từ Liêm, TP HN.Số xác nhận ĐKXB: …..-2017/CXBIPH/06-04/ThG. Quyết định xuất bản số: …../QĐ-ThG cấp ngày ….. tháng ….. năm 2017.In xong và nộp lưu chiểu năm 2017. Mã ISBN: 978-604-77-3038-4

The Nopoor project is funded by the European Union under the 7th Research Framework Programme (Theme SSH.2011.1) Grant Agreement No.:290752.
The ImPOrTaNce Of hOusehOLD BusINesses aND The INfOrmaL secTOr fOr INcLusIve GrOwTh IN vIeTNam
This book draws on an original and innovative data collection to provide new evidence on household businesses and the informal sector in Vietnam. This 2014/15 HB&IS survey conducted in late 2014 and early 2015 is the first national survey ever on this sector in Vietnam with full coverage of its different components.
The purpose of this book is threefold. First, it aims at filling the knowledge gap as to the role of household businesses and the informal sector in the Vietnamese economy. Second, it provides new insights for policymakers to unlock household business potential by identifying the factors blocking their performance and productivity. Thirdly, it identifies the sources of worker vulnerability in household businesses and the informal sector to inform the design of a suitable policy to tackle this vulnerability.