Embed Size (px)
Citation preview

The Importance of good data management and Power BI
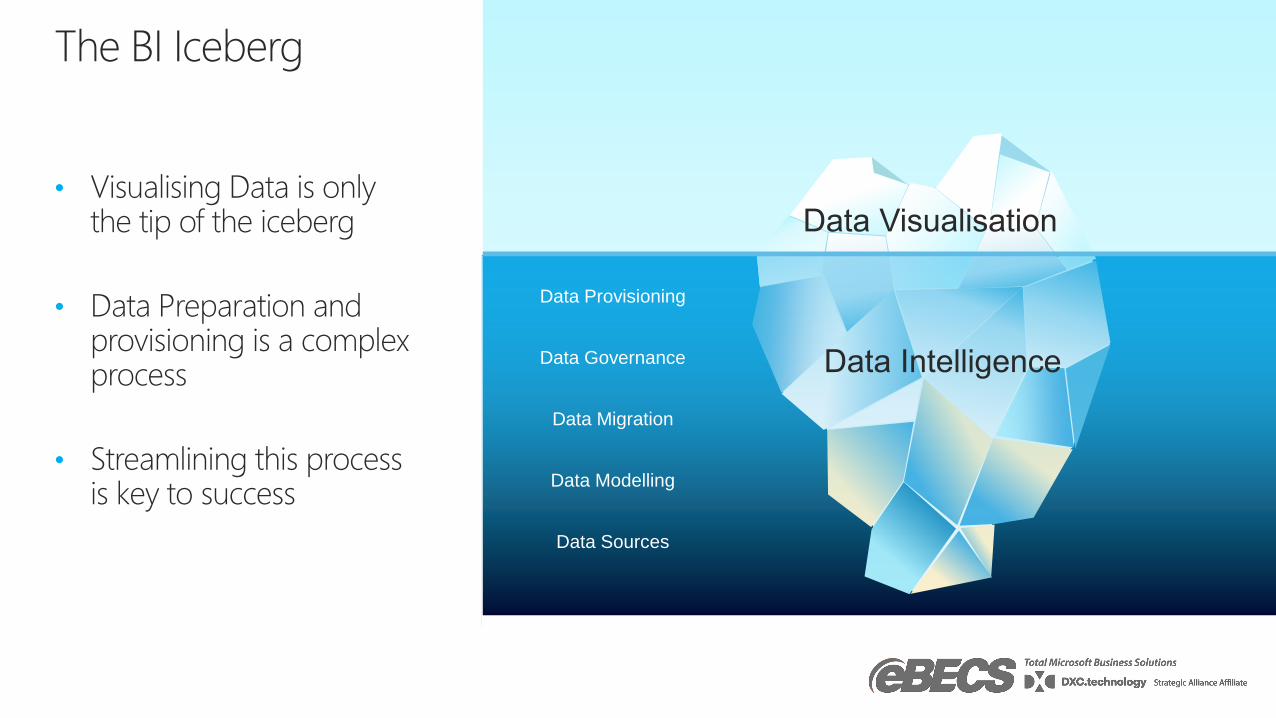
The BI Iceberg
• Visualising Data is only the tip of the iceberg
• Data Preparation and provisioning is a complex process
• Streamlining this process is key to success
Data Governance
Data Migration
Data Sources
Data Modelling
Data Provisioning

Off
eri
ng
s
Rapid Return
Business Intelligence
The more data that is created, the better understanding and
wisdom people can obtain.

Data capabilities at each maturity stage
Make smarter decisions using
self-service tools to separately
display relational and non-
relational data sets available
through a virtualized network.
Plan for the future by analyzing
and modeling diverse data
types integrated in real time
through a hybrid environment.
Trigger automated rules to
respond to analysis of data
sets integrated in real time
through a hybrid environment.
Know your business better
through manual reports
built using structured
department data.
• Manual reports: Request IT to pull
data and build reports
• Historical analysis: Review business
periodically and track against goals
• Departmental data: Combine data
manually for business-level insights
• Self-service & mobile BI: Access
anywhere, on any device
• Visualizations and dashboards:
Answer questions by visualizing data
• External data: Capture big data for
future use
• Real-time insights: Track business
changes up to the minute
• Integrated data sources: Combine
and analyze all kinds of data
• Predictive analytics: Use complex
modeling and analysis for predictions
• Immediate innovation: Make
changes on the fly using real-time
data
• Asset feedback: Monitor IoT data to
identify new business models
• Automated actions: Trigger
automatic actions to changing trends
ACTIVITIES
Relational data Relational & non-relational data, siloed Any data from any source Any data from any source
Descriptive Diagnostic Predictive Prescriptive
+ + +
Capabilities Maturity Model
SQL
TIME-TO-DATA: WEEKS OVERNIGHT MINUTES REAL-TIME


Data is a key strategic asset
$1.6TAdditional business value captured
by companies that are leaders in
using data assets to their advantage
Source: IDC, 2014
10%Percent of organizations expected
to have a highly profitable business
unit specifically for productizing and
commercializing their data by 2020
Source: Gartner, 2016

Widely available
unstructured data
Deliver powerful insights
over big data
Massive
data growth
Build data
into all your apps
50ZB
101001010010
{ }
Analytics driving
digital transformation
Modernize your apps
with built-in analytics
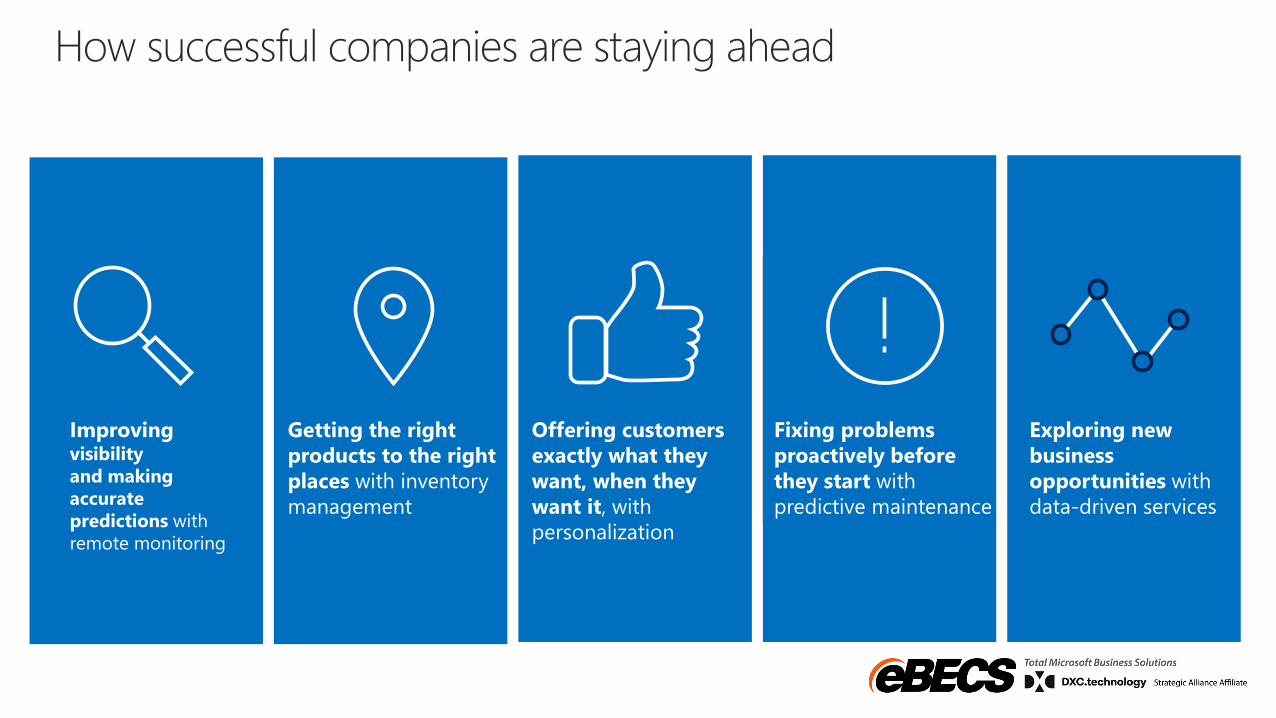
Exploring new
business
opportunities with
data-driven services
Improvingvisibility
and making
accurate
predictions with
remote monitoring
Getting the right
products to the right
places with inventory
management
Offering customers
exactly what they
want, when they
want it, with
personalization
Fixing problems
proactively before
they start with
predictive maintenance

10

Implement Data Warehouse
Physical Design
ETL
Development
Reporting &
Analytics
Development
Install and Tune
Reporting & Analytics Design
Dimension Modelling
ETL Design
Setup Infrastructure
Understand Corporate Strategy
Data sources
Gather Requirements
Business Requirements
Technical Requirements

OLTP Apps Analytics Cubes & Services BI ReportsData Warehouse
Finance
CRM
ERP
Data Mart or
Operational Data Store
Big Data Storage Hive Query
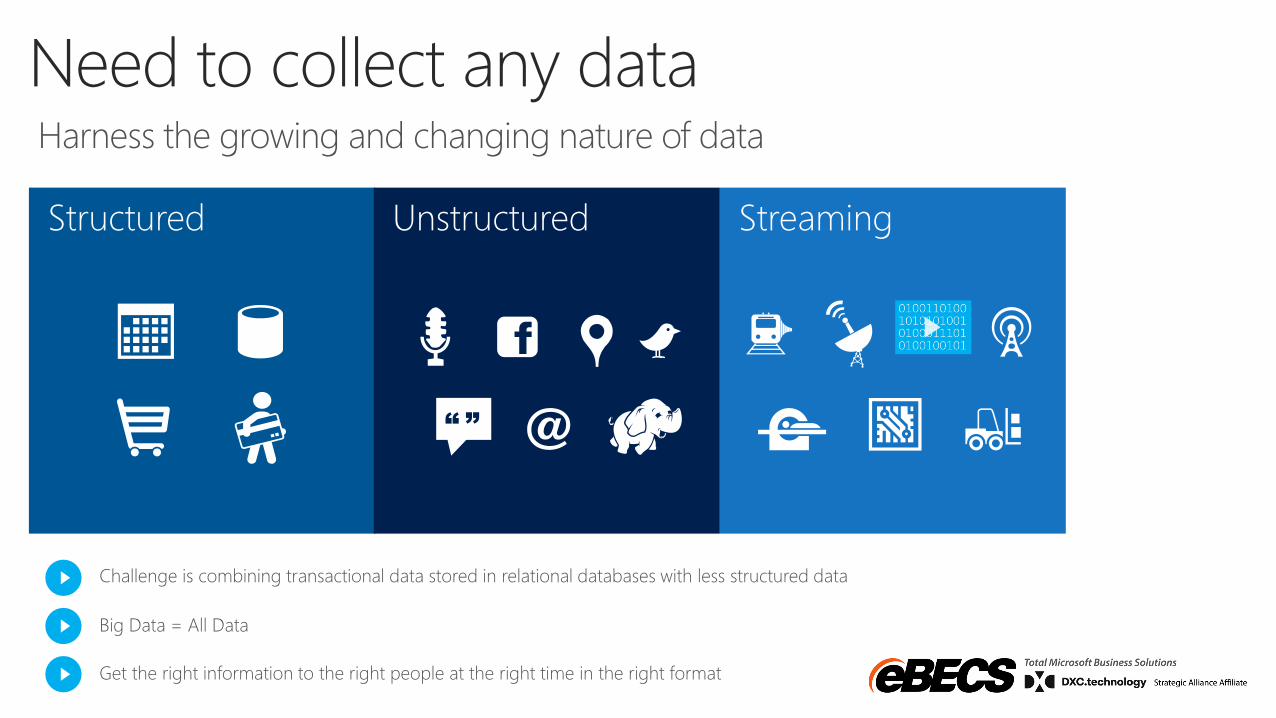
Harness the growing and changing nature of data
Need to collect any data
StreamingStructured
Challenge is combining transactional data stored in relational databases with less structured data
Big Data = All Data
Get the right information to the right people at the right time in the right format
Unstructured
“ ”

Increased data types and volumes
Varied data sources
Added complexity and cost
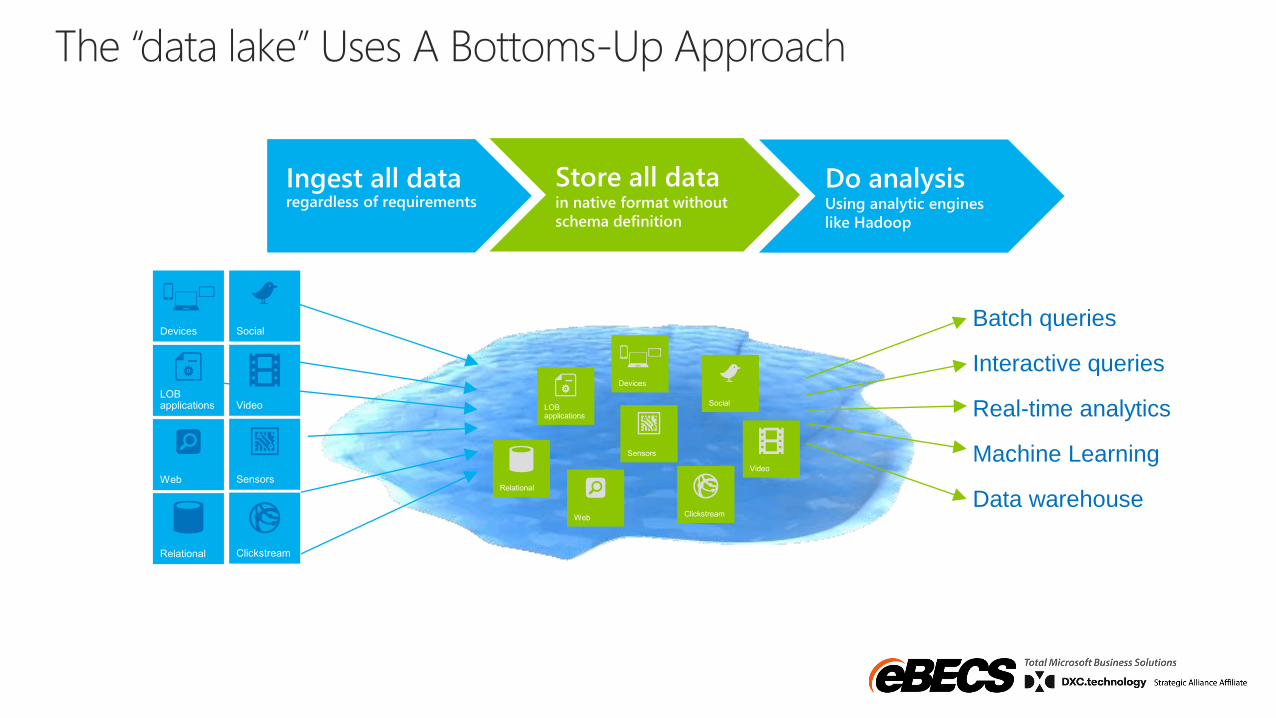
Ingest all data regardless of requirements
Store all data in native format without
schema definition
Do analysisUsing analytic engines
like Hadoop
Interactive queries
Batch queries
Machine Learning
Data warehouse
Real-time analytics
Devices

OLTP Apps Big Data & Analytics Comprehensive BI
Streaming
IoT
Social
Modern Data Warehouse
Big Data Storage
NoSQL
Data Lake
CRM
ERP
Business Analyst
BI Users
IT Pro
Data Mart or
Operational Data
Store
+ other data sources
LOB
Finance
Web

Prepare Analyse and Publish ConsumeIngest
ROLAP/Direct Query
Serialize Raw Data Stream
Data stream queries
Raw Data‘pass-through’
Train
ETL
‘Big Data’ Processing
Data Source
Power BI
Hive/Spark/HBase
Ad-Hoc data for analysis
Excel
Self-S
erv
ice | D
ash
bo
ard
ing
| R
ep
ort
ing
|
Mo
bile
Aggregated Results
In-stream predictions
Direct / Real Time Reporting

DataSources
Apps
Sensors & Devices
People
Data Intelligence
Cortana Intelligence
Action
Apps
Automated systems
Transform data into intelligent action withCortana Intelligence
Intelligence
Cortana
Cognitive
Services
Bot
Framework
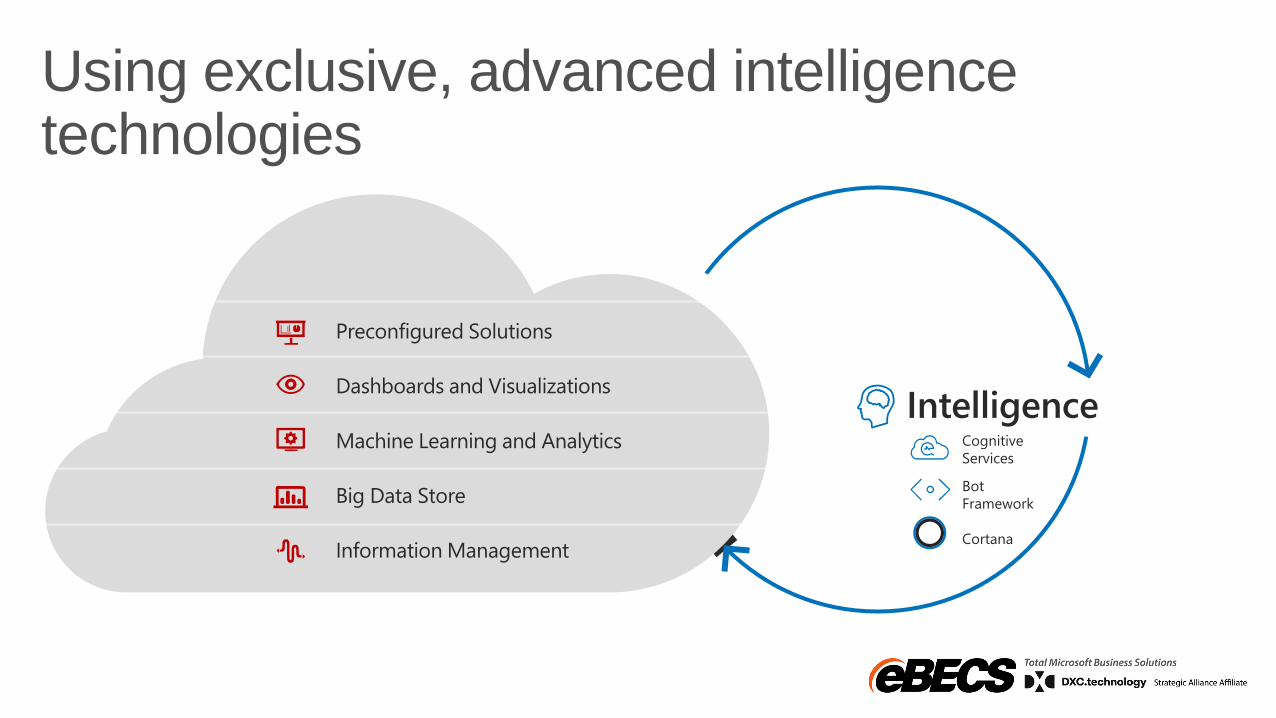
Preconfigured Solutions
Dashboards and Visualizations
Machine Learning and Analytics
Big Data Store
Information Management
Using exclusive, advanced intelligence technologies


Azure Machine Learning
Get started with just a browser Requires no provisioning; simply log on to your Azure subscription or try it for free off azure.com/ml
Experience the power of choice Choose from hundreds of algorithms and packages from R and Python or drop in your own custom code
Take advantage of business-tested algorithms from Xbox and Bing
Deploy solutions in minutes With the click of a button, deploy the finished model as a web service that can connect to any data, anywhere
Connect to the world Brand and monetize solutions on our global Machine Learning Marketplace https://datamarket.azure.com/
Beyond business intelligence – machine intelligence
Microsoft Azure Machine Learning StudioModeling environment (shown)
Microsoft Azure Machine Learning API service Model in production as a web service
Microsoft AzureMachine Learning MarketplaceAPIs and solutions for broad use

Deploy in Minutes
Web Service Gallery DiscoverLearn
Share
Expand your Reach

Today, BI extends to everyone
Everyone
Analyst to end user
IT to end user
2nd waveSelf-service BI
1st waveTechnical BI
3rd waveEnd user BI

Turning data into business insights is challenging
Common BI challenges include…
Multiple data sources Data residing in cloud solutions and on-premise locations is difficult to access and refresh securely
End-to-end view Data often resides in disparate locations, making it difficult to see a complete picture of your business
Right data for the right users at the right time
Different roles have different needs and business users need the latest operational data
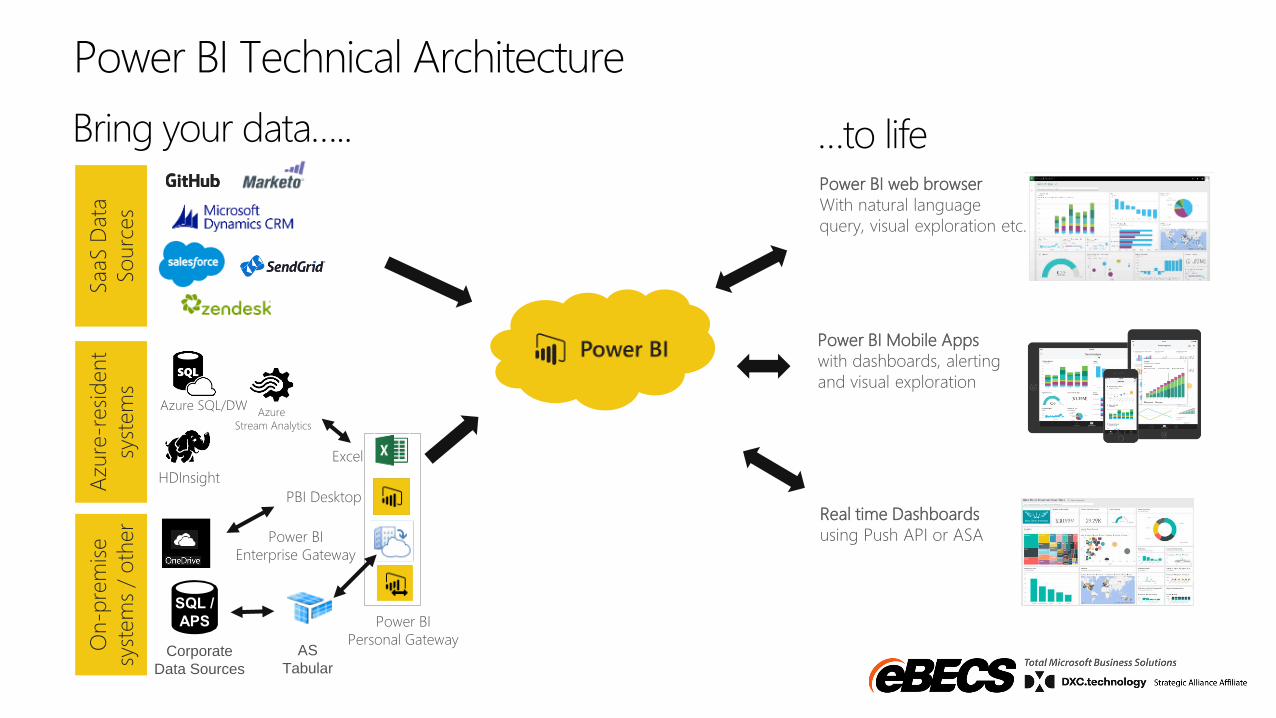
SaaS D
ata
So
urc
es
Power BI web browser
With natural language
query, visual exploration etc.
Power BI Technical ArchitectureA
zure
-resi
dent
syst
em
s
Azure
Stream Analytics
Azure SQL/DW
HDInsight
Power BI Mobile Apps
with dashboards, alerting
and visual exploration
Bring your data….. …to life
AS
TabularCorporate
Data Sources
PBI Desktop
Power BI
Enterprise Gateway
Excel
On-p
rem
ise
syst
em
s /
oth
er
Real time Dashboards
using Push API or ASA
Power BI
Personal Gateway

26
Excel
• The standard among Business Analysts
• Easily migrate the data and underlying
models from Excel
SQL Server Analysis Services
• DAX Compatibility
SQL Server Reporting Services
• SSRS output can be pinned on Power BI
dashboards
POWER BI GATEWAY

Feature
Power BI
• Industry-leading SaaS service
o 5 seconds to sign up, 5 minutes to WOW
• Large Power BI ecosystem
o ISVs, SIs and partners creating unparalleled
momentum
• Integrated across Microsoft products
o Customers benefit from integration with
other Microsoft products
Connecting any user, in any business, anywhere, with their data

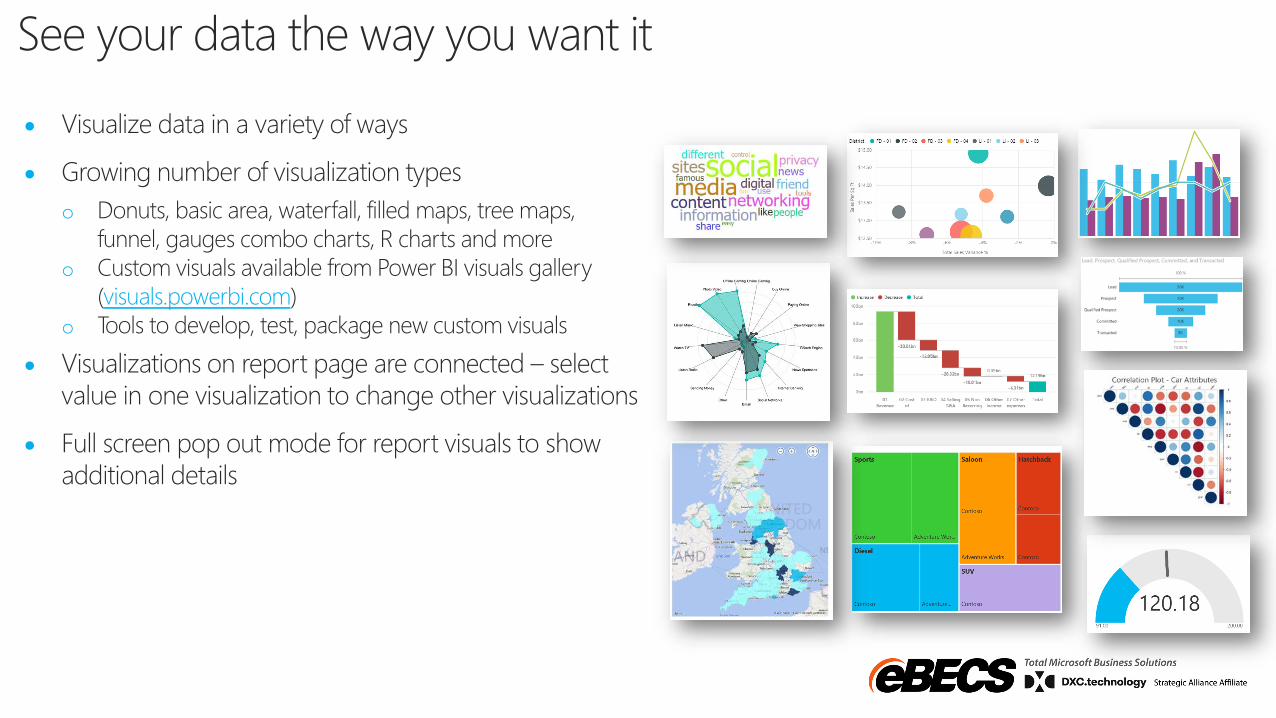
Feature• Visualize data in a variety of ways
• Growing number of visualization types
o Donuts, basic area, waterfall, filled maps, tree maps,
funnel, gauges combo charts, R charts and more
o Custom visuals available from Power BI visuals gallery
(visuals.powerbi.com)
o Tools to develop, test, package new custom visuals
• Visualizations on report page are connected – select
value in one visualization to change other visualizations
• Full screen pop out mode for report visuals to show
additional details
See your data the way you want it

Feature
• Cortana can find answers from data in Power BI, e.g.
“What were our biggest deals that closed last month?”
• Similar to Q&A, ask or type a question in natural language
• Cortana can find answers directly from dataset or from report
pages designed for Cortana (called Answer Pages)
• Interact with the visualizations as you would in Power BI, to
further explore an answer, simply open a result in Power BI
• Cortana ranks the answers from Power BI, giving you one or
more best matches
• Easily create Answer Pages in the Power BI service
Power BI Cortana Integration
Feature
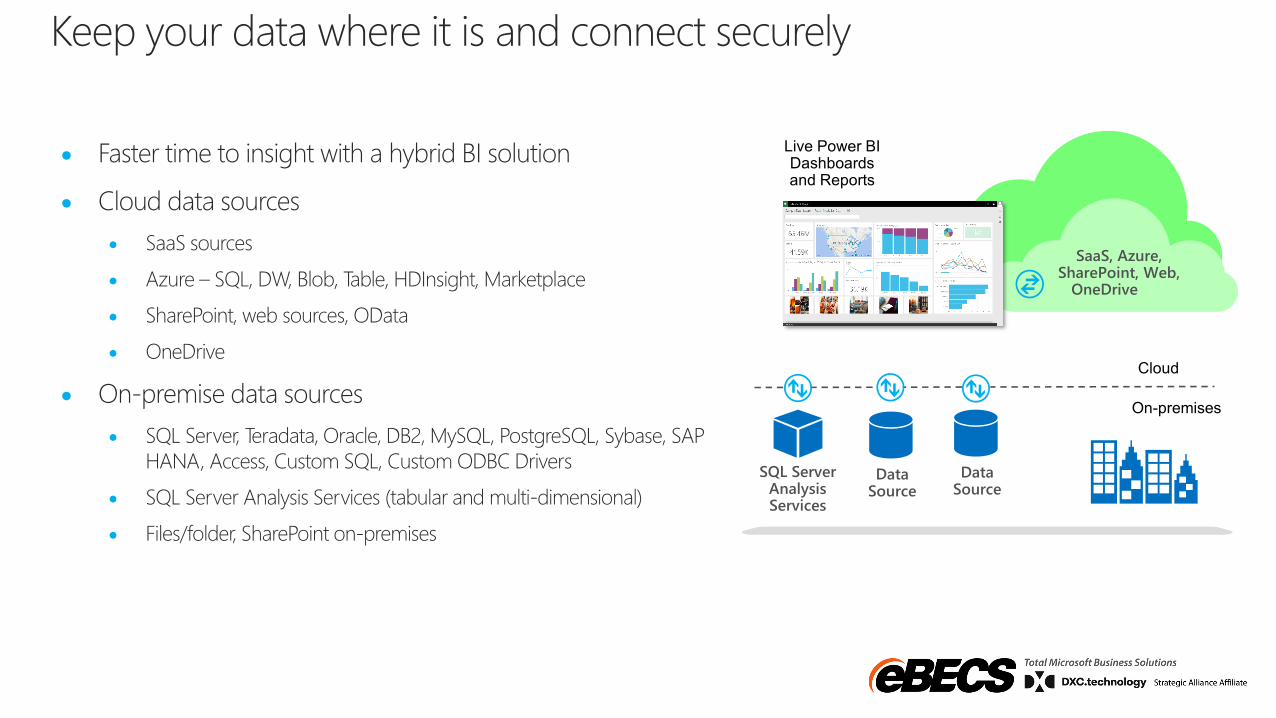
Keep your data where it is and connect securely
• Faster time to insight with a hybrid BI solution
• Cloud data sources
• SaaS sources
• Azure – SQL, DW, Blob, Table, HDInsight, Marketplace
• SharePoint, web sources, OData
• OneDrive
• On-premise data sources
• SQL Server, Teradata, Oracle, DB2, MySQL, PostgreSQL, Sybase, SAP
HANA, Access, Custom SQL, Custom ODBC Drivers
• SQL Server Analysis Services (tabular and multi-dimensional)
• Files/folder, SharePoint on-premises
The above graphics were published by Gartner, Inc. as part of a larger research document and should be evaluated in the context of the entire document. The Gartner document is available upon request from Microsoft. Gartner does not endorse any vendor, product or service depicted in its
research publications, and does not advise technology users to select only those vendors with the highest ratings or other designation. Gartner research publications consist of the opinions of Gartner's research organization and should not be construed as statements of fact. Gartner disclaims all
warranties, expressed or implied, with respect to this research, including any warranties of merchantability or fitness for a particular purpose.
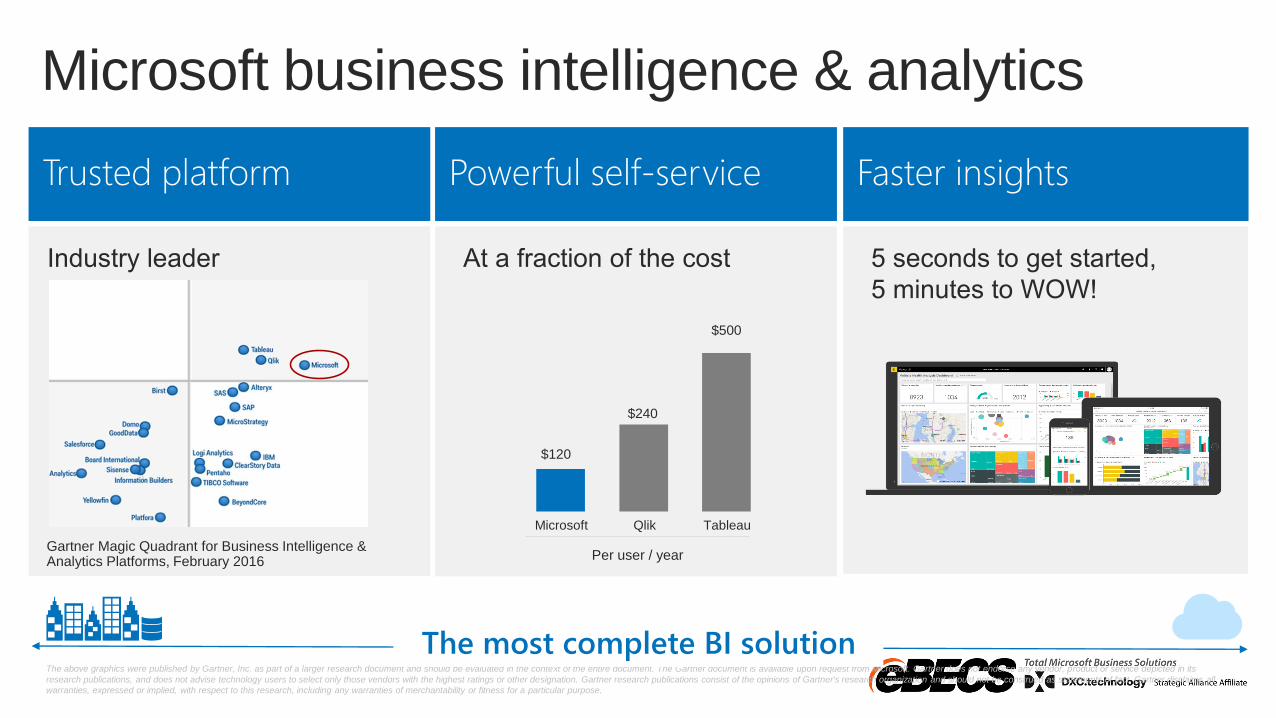
The most complete BI solution
Gartner Magic Quadrant for Business Intelligence & Analytics Platforms, February 2016
Microsoft business intelligence & analytics
$Microsoft
$120
Qlik
$240
Tableau
$500
Per user / year

Power BI DesktopCreate Power BI ContentConnect to data and build reports for Power BI