Embed Size (px)
Citation preview
Resources, Conservation and Recycling 23 (1998) 1–28
The implications of the Basel Convention fordeveloping countries: the case of trade in
non-ferrous metal-bearing waste
Nick Johnstone *
En6ironmental Economics Programme, International Institute for En6ironment and De6elopment,3 Endsleigh Street, London WC1H 0DD, UK
Accepted 16 January 1998
Abstract
The decision to introduce a ban on trade in hazardous waste with secondary valuesbetween Annex VII countries (the OECD, EU and Liechtenstein) and Annex VIII countries(other signatories) could have important implications for developing countries. The specificcase of non-ferrous waste has been chosen for analysis since it is an important component ofwaste trade flows and since a number of reports have been written which argue that the banmay have adverse economic and environmental effects for a number of developing countries.The study examines some of the relevant trade data as well as the underlying economicfactors behind the trade. In particular, the generation of non-ferrous metal (NFM)-bearingwaste, the use of non-ferrous metals in manufacturing sectors, and the production ofsecondary non-ferrous metals in the two areas will be examined. The main findings of thepaper are that: metal-bearing solid waste generation amongst developing countries is lowerin absolute terms, but the rate of growth is much higher than amongst OECD countries;many developing countries are exhibiting much faster rates of growth in demand fornon-ferrous metal than OECD countries due to shifts in the sectoral composition of theireconomies; international trade in NFM-bearing waste and scrap is relatively significant forsome metals, but those types of waste most likely to be affected by the ban do not appearto be important parts of this trade; and, imports of non-ferrous metal waste and scrap helpto explain the production of secondary metals, thus indicating that at least some of the trade
* Tel.: +44 171 3882117; fax: +44 171 3882826; e-mail: [email protected]
0921-3449/98/$19.00 © 1998 Elsevier Science B.V. All rights reserved.
PII S0921-3449(98)00002-0

N. Johnstone / Resources, Conser6ation and Recycling 23 (1998) 1–282
in waste is motivated by demand for the waste for reclamation. The report concludes thatwhile the ban is far from being an ideal environmental policy instrument, it must beunderstood as a reflection of both market failures (in the market for hazardous wastetreatment and reclamation) and policy failures (in previous efforts to control adverse effectsfrom the trade). If appropriate criteria are applied (mainly waste classifications and Annexclassifications) then the environmental implications of the ban may be positive and thenegative economic consequences quite small. However, given the rate of growth in generationin many of the Annex VIII countries, such benefits are likely to be slight relative to theproblem of the treatment and reclamation of waste generated domestically. Thus, it is arguedthat if the ban is to be introduced, the dormant ‘positive’ measures in the Convention relatedto financial and technical assistance need to be revived. © 1998 Elsevier Science B.V. Allrights reserved.
Keywords: Metal recycling; Hazardous waste; International trade
1. Introduction
Since its inception the Basel Convention on the Control of the TransboundaryMovement of Hazardous Wastes has gone through a series of important changes.Most recently, and significantly, some of the initial principles of the Conventionbased on control of trade in hazardous wastes have been superseded by the decisionto introduce an outright ban on trade between Annex VII countries (the OECD,EU and Liechtenstein) and Annex VIII countries (other signatories). Dependingupon how the ban is applied, this could have important implications for developingcountries.
This study will concentrate on the economic and environmental effects of the banon trade in hazardous wastes with secondary values. In addition to examining someof the relevant trade data, this report will also examine the underlying factorsbehind the trade. In particular, the generation of non-ferrous metal-bearing wasteand the production of secondary non-ferrous metals will be examined. This willprovide a conceptual framework through which both the economic and environ-mental implications of bans on different types of hazardous wastes can beexamined.
In order to give the paper a clearer empirical focus the case of non-ferrous metal(NFM)-bearing waste will be examined in more detail. This class of waste has beenchosen since it is an important component of waste trade flows and since a numberof reports have been written which argue that the ban may have adverse effects(economic and environmental) for a number of developing countries due to itseffects on the metal processing sectors and other manufacturing sectors which usesecondary metals [1–5].
The main findings of the paper are that:� Metal-bearing solid waste generation amongst developing countries is lower in
absolute terms, but the rate of growth is much higher than amongst OECDcountries.

N. Johnstone / Resources, Conser6ation and Recycling 23 (1998) 1–28 3
� Many developing countries are exhibiting much faster rates of growth in demandfor non-ferrous metal than OECD countries due to shifts in the sectoralcomposition of their economies.
� International trade in NFM-bearing waste and scrap is relatively significant forsome metals, but those types of waste most likely to be affected by the ban donot appear to be important parts of this trade.
� Imports of copper, lead and zinc waste and scrap help to explain the productionof secondary metals, which would be consistent with the hypothesis that at leastsome of the trade in waste is motivated by demand for the waste for reclamation.However, more direct forms of data are not available to support this definitively.The report concludes that the while the ban is far from being an ideal environ-
mental policy instrument, it must be understood as a reflection of both marketfailures (in the market for hazardous waste treatment and reclamation) and policyfailures (in previous efforts to control adverse effects from the trade). If appropriatecriteria are applied (mainly waste classifications and Annex classifications) then theenvironmental implications of the ban may be positive and the negative economicconsequences quite small. However, given the rate of growth in generation in manyof the Annex VIII countries, such benefits are likely to be slight relative to theproblem of the treatment and reclamation of waste generated domestically. Thus, itis argued that if the ban is to be introduced, the dormant ‘positive’ measures in theConvention related to financial and technical assistance need to be revived.
The report consists of seven sections, including this brief introduction. In Section2 the role of the Basel Convention as an environmental policy instrument isdiscussed. In Section 3, evidence on trends in the generation of hazardous wastes—particularly metal-bearing solid waste—will be examined. In Section 4, some dataon the industrial use of metal-bearing waste will be examined. In Section 5, somedata on NFM waste trade volumes and values is presented. Section 6 provides anempirical analysis of structural characteristics of waste reclamation and the deter-minants of production of secondary metals, thus casting light on the economic basisfor NFM waste and scrap imports. Finally Section 7 reviews the evidence andprovides some policy recommendations.
2. The Basel Convention as an environmental policy instrument
In the 1980s there was a general perception that hazardous waste trade exportsfrom OECD countries had potentially significant adverse environmental impacts ondeveloping countries. As such, many of them began to lobby for internationalmechanisms whereby the trade could be controlled. The OAU in particular pushedfor a complete ban on OECD exports of hazardous waste to its member countries[6]. To some extent this was a reflection of concerns about domestic capacity tomonitor such flows and to institute and enforce domestic regulations to ensureadequate treatment [7]. Thus, while they could ban such imports unilaterally, manydeveloping countries felt that an international agreement would reinforce the effectsof such a ban [3].

N. Johnstone / Resources, Conser6ation and Recycling 23 (1998) 1–284
However, the OECD countries were reluctant to introduce such a ban [8]. Theirreservations were two-fold: firstly, they felt that in many cases international trade inhazardous waste would represent an effective means of treating and disposing ofwaste; and secondly, they felt that a ban on trade in recyclables, in particular,would be counter-productive. The end result was a compromise, composed of thefollowing basic principles1:� Trade between parties and non-parties was banned, unless there was a bilateral
agreement approximately equivalent to the Basel Convention, already in place.� Exports to countries which had explicitly prohibited their import were banned.� Wastes could not be exported to countries in which there was ‘‘reason to believe
that it will not be disposed of in an environmentally sound manner’’.� All exporters had to obtain ‘‘prior informed consent’’ from the country in
question before proceeding.� Requests for a shipment had to be accompanied by sufficiently detailed informa-
tion on the characteristics of the shipment for the importing country to under-take a risk assessment.
� In an effort to reduce the potential for environmental damages en route therewere packaging, labelling and transport requirements.
� If any of the preceding were violated then the exporting state would have a dutyto reimport the waste.These measures were accompanied by a large list of ‘positive’ measures which
were designed to reinforce the regulatory aspects of the Convention. A mechanismwas to be established to assist in the international dissemination of information onhazardous waste management systems, a technical cooperation fund was to beestablished to provide technical and legal assistance for developing countries,assistance was to be provided in the development of regulatory regimes, andcompensation funds and a liability regime were to be established to ensure thatfunds were available for remediation. And finally, a technical working group wasestablished to clarify the concepts of ‘environmentally sound management’, ‘haz-ardous waste,’ ‘disposal’ and other ambiguous terms in the Convention.
More recently, the Convention has been amended radically following the adop-tion of Decision III/1. In 1994 the parties to the Convention agreed to introduce aban on all trade in hazardous waste for final disposal from OECD countries tonon-OECD countries. Trade in recyclable hazardous waste would be banned 3years later. Although its legal status was not clear initially, this was rectified in 1995and the ban will enter into force once three-quarters of the parties to theConvention have ratified the decision.
The ban creates a relatively complicated two-world system for the treatment ofthose wastes which the Technical Working Group (TWG) classifies as beinghazardous. Richer countries can not export their waste to developing countries,although trade in the opposite direction (and within the two groups of countries) isallowed [1,5,10]. At the same time the distinction between OECD and non-OECD
1 The basic characteristics of the Convention (and subsequent amendments) have been reviewed in [9].

N. Johnstone / Resources, Conser6ation and Recycling 23 (1998) 1–28 5
was amended to Annex VII countries (OECD, EU and Liechtenstein) and AnnexVIII countries (all other signatories).
It is this aspect of the Basel Convention which is of particular interest to thisstudy since it has often been argued that trade restrictions are not an effectivemeans of addressing environmental concerns (see [11] for a discussion). Sinceinternational trade is not in and of itself a cause of environmental degradation,restrictions on trade do not address the fundamental determinants of degradation.Regulations should instead be targeted directly at the source of the externality, i.e.the method of transport or the means of treatment. For this reason trade restric-tions may result in significant resource misallocation for little environmental gain[12].
Indeed, in some cases trade restriction may have unexpected and even perverseconsequences. For instance, the ban may drive the trade underground and sincewaste which is traded illegally is much less likely to be treated satisfactorily thanwaste which is traded legally, this might mean that the overall standard oftreatment falls. Similarly, the creation of a ‘dual’ market amongst Annex VII andAnnex VIII countries may mean that efforts to restrict the adverse environmentaleffects arising from one trade flow are more than offset by corresponding exacerba-tion of the effects from another trade flow.
However, it has been recognised that in the absence of an international regula-tory agency there is a case to be made for trade restrictions to address internationalenvironmental problems.2
Baumol and Oates [13] emphasise that in a ‘second-best’ situation where marketsdo not operate perfectly, trade restrictions may approximate the optimal outcome(Beghin et al. [12] discuss a number of studies which review such cases). This latterpoint is by no means incidental since the market for hazardous waste treatment,reclamation and disposal services is characterised by a number of factors which areclearly not consistent with perfect markets. In particular, the existence of imperfectand asymmetrical information between buyers and sellers of waste creates distor-tions in the market. In addition, the uncertain and irreversible environmentalconsequences which arise from inadequate treatment of some forms of hazardouswaste means that even if the characteristics of the waste are known, it may not bepossible to weigh the costs and benefits of the trade in any systematic manner.
In this vein it is interesting to note that the principle means of control of thehazardous waste trade prior to Decision III/1 was through the use of ‘prior-in-formed-consent’ and associated requirements such as manifest and labelling proce-dures. These went some way toward ameliorating some of the imperfections in the
2 Given this context, it is perhaps not coincidental that the negotiators of the Basel Convention framedthe trade in hazardous waste in a manner analogous to the transfrontier diffusion of pollution (see [10]for a discussion). Trade in hazardous waste was seen as the vehicle through which pollution is diffusedinternationally. It is this conception which lies behind the application of the ‘proximity principle’ [10].However, such a case is clearly not tenable since a substance which is contained cannot be said to havean impact upon the ambient environment. Moreover, treatment and disposal in the recipient countrymay or may not have transboundary effects.

N. Johnstone / Resources, Conser6ation and Recycling 23 (1998) 1–286
market by allowing importers to undertake risk assessments on the basis of morecomplete information than had been the case previously. Thus, it appears thatparties to the Convention agreed to the ban only after a period in which lessdraconian—and potentially more effective—measures had been applied. While theprevious system had certainly played a role in making the trade more transparentand obviating some of the information problems3, there continued to be significantproblems in the trade, and when this was recognised some of the parties to theConvention reiterated their original demands for a ban.
2.1. Conclusions
While the Basel Convention was initially developed as a means of regulating andmonitoring trade in order to allow signatories to better control the adverseenvironmental consequences of the trade in hazardous waste, it is fast becoming anexplicit trade ban. Indeed Decision III/1 effectively makes all other aspects of theConvention redundant, at least insofar as they relate to trade between Annex VIIand Annex VIII countries. To some extent, therefore, the advent of the ban is areflection of the failure of the parties to regulate the trade in a coherent manner.While such a policy is clearly not optimal, it may well be the most efficient‘second-best’ instrument available. The rest of this paper is largely concerned withthe consequences of the ban for developing countries.
3. Trends and patterns of NFM-bearing waste generation
Global generation of hazardous waste has been estimated to be in the region of300–500 million tons per annum [15]. The IMO Global Waste Survey [16] con-cluded that 3000–6000 tons of hazardous waste were generated for each $USbillion of output in the OECD. However, comparing generation rates acrosscountries is problematic since countries use different definitions of toxicity indefining hazardous wastes and data collection is often haphazard. In particular,unlike other countries, the United States includes a large variety of mixed wasteswhich have the potential to leach into groundwaters due to their liquidity. Thisinflates US figures substantially relative to other countries (see Appendix A formost recent generation rates within the OECD).
Data on hazardous waste generation for non-OECD countries is even less readilyavailable. It has been estimated that generation by Eastern European countries isaround 19 million tons, while the rest of the non-OECD world generated approxi-mately 16 million tons [15]. Some of the developing country signatories to the BaselConvention have provided data on generation to UNEP and other countries haveprovided data to the International Maritime Organisation (see Table 1). Given thediscrepancies in these figures—i.e. according to the reported volumes Brazil gener-
3 Johnstone [14] reviews the evidence.

N. Johnstone / Resources, Conser6ation and Recycling 23 (1998) 1–28 7
ates 5% of the hazardous waste of Trinidad and Tobago—it is clear that they tellus considerably more about the means of reporting and the definitions applied thanthey do about the actual levels of waste generated.
Recognising the deficiencies in such data the IMO [16] derived a rather simpleindirect proxy to estimate generation rates, using waste/sectoral employment coeffi-cients derived from Canadian data for 11 manufacturing sectors and 14 waste types.This is clearly rudimentary, but is oft-cited in the literature. In an effort to improveupon this, more systematic evidence has been derived using the World Bank’sIndustrial Pollution Projection System (IPPS) in conjunction with UNIDO’s Indus-trial Statistics Database.
The IPPS estimates pollution generation rates for 13 classes of pollutants at aconsiderable degree of sectoral disaggregation (the ISIC 4-digit level includes 79sectors) on the basis of American pollution generation data.4 Most pertinentlyfigures for metal-bearing solid waste arisings are included. These rates (expressed inlbs of waste/$ value added) can be multiplied by UNIDO data on the sectoralcomposition of manufacturing in different countries in order to derive roughestimates of the relative degree of pollution-intensity of manufacturing production.5
Table 1Declared annual hazardous waste generation in non-OECD countries
Year VolumeCountry Source
Latin AmericaArgentina 400 0001993[17]
1993 2 791[17]Brazil[17] 1 800 000Ecuador 1993[16]Mexico NA 5 292 000
Trinidad and Tobago [16] NA 52 000
Eastern Europe[17] 203 0711993Croatia[16]Hungary NA 2 007 000
NA 1 300 000Poland [16][17] 1991Slovenia 56 000
1993[17]Middle East and Mediterranean Cyprus 345 000Saudi Arabia [17] 230 0001993
Asia[16] NAChina 47 000 000[16] 25 023 000Philippines NA
Sub-Saharan Africa[16] 1 057 000Nigeria NA
4 Derived from the US EPA’s Toxic Release Inventory.5 Note that these estimates only relate to waste generation in the course of the production process. For
instance, all waste arising from the disposal of imported manufactured products is not included in theanalysis. In this sense, the inverted-U hypothesis is a consequence not only of changing consumptionpatterns, but also changing trade patterns. This issue has been explored in relation to the ‘so-called’environmental Kuznets’ Curve hypothesis (see [11] for a discussion).

N. Johnstone / Resources, Conser6ation and Recycling 23 (1998) 1–288
Fig. 1. GDP and change in MBSW intensity of manufacturing.
A total of 24 countries6 had data for 1974, 1984 and 1994, and changes in themetal-bearing waste-intensity in the period 1974–1994 were calculated by thefollowing means:
%DMPj=1
−�� % ((VAMi.j.t/VAMj.t)*MPIi)
/ % ((VAMj.j.t−20/VAMj.t−20)*MPIi�n0.05
where i ’s are sectors, j ’s are countries andMPj=metal-bearing solid waste generated per unit of output (lbs/$) in countryjVAMi.j.t/VAMj.t= industry i ’s proportion of total value added in year t incountry jMPIi=metal pollution intensity of sector i (lbs of waste/$ value added)The relationship between the GDP in these 24 countries and the rate of change
in relative waste-intensity over the period 1974–1994 are compared in Fig. 1. Ingeneral those countries with low per capita GDP have had the highest growth ratesin the metal-bearing solid waste (MBSW) intensity of manufacturing. Nine of the10 richest countries included had negative rates, while the six poorest had positivegrowth rates.7 The fastest growth rates in the sample were in Algeria, Malaysia andthe Philippines.
6 Algeria, Austria, Canada, Colombia, Ecuador, Egypt, Finland, Greece, Honduras, Hungary, Japan,Jordan, Korea, Kuwait, Malaysia, Philippines, Portugal, South Africa, Spain, Sweden, Turkey, UnitedKingdom, United States and Uruguay.
7 Note that the analysis was conducted at the 3-digit level since disaggregation varies greatly across the24 countries at the 4-digit level. However, comparisons for selected countries of estimated generationrates using the two levels of disaggregation revealed little difference.

N. Johnstone / Resources, Conser6ation and Recycling 23 (1998) 1–28 9
Table 2 presents this relationship as a correlation coefficient (−0.630). In effect,poorer countries are shifting toward more metal-bearing waste intensive manufac-turing, while richer countries are doing the opposite. (Note however that the levelof metal-bearing waste intensity (rather than the rate of change) remains slightlypositively correlated with GDP.)
Of more relevance to the Basel Convention is the relationship between metal-bearing waste generation and Annex classifications. In this case the relationshipbetween trends in the waste-intensity of manufacturing and annex classification iseven more pronounced (−0.692)—i.e. Annex VII countries are much more likelyto have negative trends in waste-intensity. Only two Annex VII countries (Finlandand South Korea) have positive trends and only three VIII countries (Kuwait,South Africa and Uruguay) have negative trends.
However, this analysis assumes that the waste-intensities of the same sectors indifferent economies are comparable. In effect, it is only changes in sectoralcomposition which are being captured, and not changes in the technology ofproduction itself. While there are good reasons to believe that technology does varymarkedly by country, there is no primary cross-sectional evidence which can beused to explore this issue.
Researchers at the OECD have used the IPPS data in conjunction with input-output data for Brazil, China, Indonesia, Japan, Mexico and the USA to explorethe technological issue in some detail [21]. Estimating emissions on the basis ofmaterial inputs for 14 sectors, they derive coefficients for 13 different classes ofpollutant, including metal-bearing solid waste. Comparing across countries theyfind that Brazil and Mexico tend to have more MBSW-intensive input compositionthan the other economies, while the USA and Japan are generally lower than theother economies. Indonesia and China exhibit considerable variability across differ-ent sectors.
3.1. Conclusions
A review and analysis of the evidence indicates that the Basel Convention banwill restrict exports of metal-bearing hazardous waste from those countries whichare generating less and less of it to those countries which are generating more andmore of it. Effectively, this means that the ban is likely to affect a decliningproportion of total potential trade. It also likely to be of decreasing importance indeveloping countries’ total waste management problem.
Table 2Relationship between GDP, annex classification and metal-bearing waste intensity of manufacturing
AnnexGDP level
0.355MBSW intensity in 25 countries 0.097Level of generation−0.692−0.630Rate of generation
Sources: derived on the basis of Hettige et al. [18], World Bank [19] and UNIDO [20].

N. Johnstone / Resources, Conser6ation and Recycling 23 (1998) 1–2810
Fig. 2. The relationship between wastes destined for final disposal and for recycling.
4. The industrial use of NFM-bearing waste
The distinction between wastes destined for final disposal and wastes destined forrecovery has usually been treated in terms of discrete alternatives. However it isperhaps more accurate to represent it in terms of degrees. In the upper part of Fig.2, the x-axis represents the volume of treatment/processing services and the y-axisrepresents the costs of such services. Three relatively elastic supply curves aredepicted, varying in terms of qualitative characteristics, with each shift downrepresenting an increase in the secondary values embodied in the waste (i.e. higherBTU value, higher metal concentration, etc.). With sufficient secondary value theequilibrium price will be negative—i.e. the treatment/process facility will pay for

N. Johnstone / Resources, Conser6ation and Recycling 23 (1998) 1–28 11
the waste and the roles of buyer and seller will be reversed. (Note that demandis assumed to be perfectly inelastic—i.e. polluting sectors do not respond tochanges in treatment costs by adjusting their generation rates).
This relationship is made more explicit in the bottom part of the diagram, inwhich the equilibrium price curve (not the supply curve) is depicted relative towaste quality on the x-axis. Thus, each point on the curve in the lower partof the diagram represents an equilibrium solution for the schedule of curvesin the upper part of the diagram. As the quality of waste increases (i.e. sec-ondary values rise) the amount paid by the generator to the waste processingfirm decreases until it crosses the x-axis. At this point the waste is more accu-rately defined as a commodity to be used as an intermediate input in othersectors.
However, the supply schedules for waste treatment services are a functionnot only of the characteristics of the waste, but also the economic context inwhich they are generated, treated, and disposed. This is best understood if thesupply curve for waste treatment services is recognised as being analogous toa demand curve for waste with secondary values. Firms which process wastewith secondary values use metal-bearing scrap, dross, slag, ash and residue asinputs into processes which produce secondary metals. Thus demand forsuch waste will be a function of both local capacity to process the waste and thelocal demand for such metals. The latter issue will be dealt with first. Use ofwastes bearing particular metals in a particular country can be decomposed asfollows:
NFMW/Y=% [(Yi/Y)*(NFMIi/Yi)*(SNFMi/NFMI)]
where i is the number of sectors and,NFMW=non-ferrous metal-bearing waste usedYi=output in sector iNFMIi=non-ferrous metal inputs in sector iSNFMi=secondary non-ferrous metal inputs in sector iThe first component inside the brackets reflects the effects of changes in the
sectoral composition of the economy, the second component reflects the effects ofchanges in material usage within individual sectors, and the third componentreflects changes in the proportion of secondary metal usage relative to total metalusage in a given sector. Differences in each of these last three components in AnnexVII and Annex VIII countries will be examined in turn.
The importance of changing sectoral composition can be documented usingAmerican input-output data to determine which sectors use non-ferrous metalsintensively as inputs into their production processes. The figures for 1987 are shownin Table 3 [22] (unfortunately the 1992 input-output tables are not yet available).Ignoring own-industry use, the most important commodity destinations are metalcontainers, heating and plumbing equipment, miscellaneous electrical machineryand various other types of manufacturing equipment and machinery. The top ninesectors account for over 75% of total NFM usage.

N. Johnstone / Resources, Conser6ation and Recycling 23 (1998) 1–2812
The sectoral distribution of non-ferrous metal use highlights the importance ofcapital equipment and some consumer durables in demand for the output from thenon-ferrous metal industry. Indeed it is this aspect of metal use which has largelybeen used to explain the apparent ‘inverted-U’ which is characteristic of metalconsumption across countries at different income levels (see [23] for a discussion).According to this hypothesis metal consumption per unit of output rises withincome levels until a certain point when it starts to decline. The sectoral composi-tion of NFM use illustrates why this is so—as a country industrialises its invest-ment requirements increase and this tends to result in a shift toward metal-intensivesectors. However, as the economy matures demand for physical capital declines.
According to this hypothesis metal consumption per unit of output would behighest for newly-industrialised countries which are investing heavily. In his studyTilton [23] finds a strong link between investment rates and metal consumption.Comparing investment rates, the highest average rates (expressed as a % of GDP)in 1994 were in important Asian Annex VIII countries such as Malaysia (39%),South Korea (38%), Singapore (32%), Thailand (40%) and China (42%). Con-versely, amongst the Annex VII countries Portugal had the highest rate (26%), withmost other countries having investment rates between 15% and 25% [24].
Table 3Distribution of non-ferrous metals in the United States by industry (1987—millions of dollars atproducer prices)
% of NFM valueNFM inputs
Construction 6194 10.72Primary iron and steel 2.541470Primary NFM 17261 29.88Metal containers 5.213008Heating, plumbing, etc 5.533194
980 1.70Screw machine productsOther fab’d metal 2049 3.55
652Engines and turbines 1.13General industrial machinery 1.11639
910 1.58Misc. machineryComputer and office 719 1.24
1.97Service industry 11401214Electrical industrial eqpmt 2.10
Electric lighting 806 1.40Electronic components 1956 3.39
1205Misc. electrical machinery 2.09Truck and bus 3046 5.27Aircraft 3539 6.13Scientific and controlling 1357 2.35
3.181839Misc. manufacturing4595Other 7.95
Source: USDOC SCB [22].

N. Johnstone / Resources, Conser6ation and Recycling 23 (1998) 1–28 13
Fig. 3. Changes in the NFM intensity of downstream sectors in the United States.
However, of potentially more significance are changes in the metal-intensity ofproduction within individual sectors. Reduced metal-intensity can arise from twofactors: substitution away from metals toward other materials and increasedmaterial efficiency in general. An example of the former would be the shift frommetals to plastics in the manufacture of consumer durables, while an example of thelatter would be reduced material wastage in metal finishing. Very few studies havebeen done on this issue (Tilton [23] cites one study done on industrial copper usein South Korea).
Once again using American input-output data, it would appear that there havebeen some shifts away from the use of metals in the metal-intensive sectors in theUnited States [22,25]. For instance five of the 18 most important downstreamsectors showed a decrease in the use of non-ferrous metals per unit of value addedin the period 1977–1987 (see Fig. 3). In some sectors the fall was over 8% perannum. While this may not all be attributable to material savings and/or substitu-tion—i.e. intrasectoral output composition may have played a role—there doesappear to have been a decrease in the NFM-intensity of downstream sectors in thedecade. This is likely to be true of other OECD countries (and thus Annex VIIcountries) as well.

N. Johnstone / Resources, Conser6ation and Recycling 23 (1998) 1–2814
Fig. 4. Production of secondary non-ferrous metals by region.
N. Johnstone / Resources, Conser6ation and Recycling 23 (1998) 1–28 15
Technological change in Annex VIII countries is more difficult to determine sinceinput-output tables are not usually disaggregated to the same degree. However,Tilton [23] examines the case of copper in some detail. Interestingly it is found thatthe poorer countries in the sample exhibited almost equivalent declines in theintensity of use as the richer countries in the sample. Given that the former wouldhave experienced significant shifts toward a more metal-intensive sectoral composi-tion while the latter experienced the opposite, this finding is quite revealing. Ineffect it indicates that much of the rise in intensity of use in Annex VIII countriesis due to the nature of the outputs produced and not the inputs applied forparticular products.
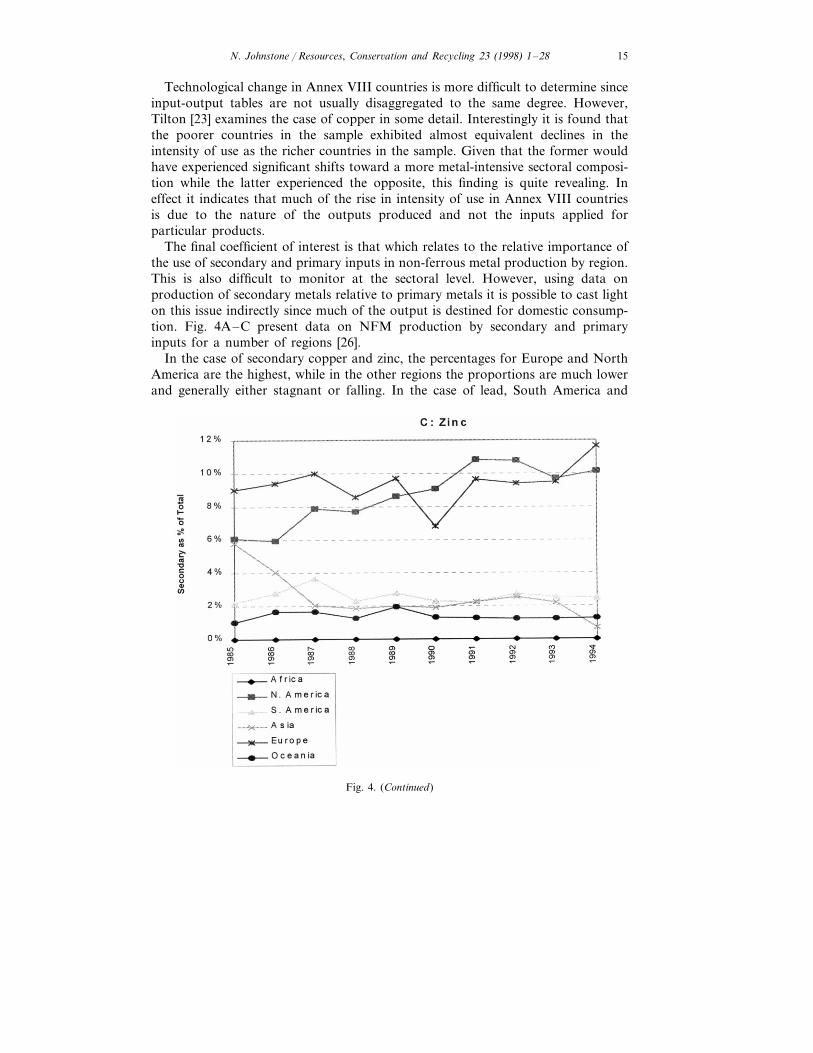
The final coefficient of interest is that which relates to the relative importance ofthe use of secondary and primary inputs in non-ferrous metal production by region.This is also difficult to monitor at the sectoral level. However, using data onproduction of secondary metals relative to primary metals it is possible to cast lighton this issue indirectly since much of the output is destined for domestic consump-tion. Fig. 4A–C present data on NFM production by secondary and primaryinputs for a number of regions [26].
In the case of secondary copper and zinc, the percentages for Europe and NorthAmerica are the highest, while in the other regions the proportions are much lowerand generally either stagnant or falling. In the case of lead, South America and
Fig. 4. (Continued)

N. Johnstone / Resources, Conser6ation and Recycling 23 (1998) 1–2816
Table 4Secondary NFM Production in Annex VII and Annex VIII Countries
Lead (%)Zinc (%) Copper (%)
Annex VII Annex VIII Annex VIIAnnex VIII Annex VIIIAnnex VII
22.73 5.01 27.571985 15.387.10 0.9121.67 5.40 29.151.34 14.571986 6.46
1.766.65 21.42 5.39 29.75 16.4719871.046.03 21.05 4.90 27.40 23.391988
21.97 5.37 28.661.33 19.751989 6.801990 21.245.81 5.54 30.10 19.011.09
20.67 4.72 21.146.66 23.586.3919916.386.65 19.97 4.94 20.23 20.501992
1993 20.196.09 5.02 21.08 20.216.1018.31 5.09 22.32 20.646.131994 6.51
Source: UN Industrial Commodity Statistics Yearbook. Note that the classification by Annex isretrospective. FSU excluded.
Europe have the highest secondary proportions, while the other regions (exceptAfrica) are all stable at around 10%. More pertinently Table 4 presents estimates ofthe percentage of copper, lead and zinc production using secondary metal inputs forAnnex VII and Annex VIII countries in the period 1985–1994. In the case ofcopper the use of secondary metal is much higher in Annex VII countries over theentire period. The same was true of both lead and zinc production in the late 1980s,although the gap has narrowed considerably in recent years.
Moreover, the proportional figures mask the real differences in absolute terms ofproduction of secondary non-ferrous metals in the two regions. Fig. 5 shows theannual growth rates for the three metals in the two regions over the period1985–1994. In the case of lead and zinc the annual changes are negative for AnnexVII countries and for zinc there has been no real change. Conversely, there havebeen increases for all three metals in the Annex VIII region, and in one case (zinc)the annual percentage change exceeds 20%.
4.1. Conclusions
Thus, demand for secondary metals per unit of output is growing faster in AnnexVIII countries than in Annex VII countries for a number of reasons: sectoralcomposition is shifting toward metal-intensive sectors in Annex VIII countries, butaway from metal-intensive sectors in Annex VII countries; improvements in mate-rial efficiency in Annex VIII countries appear to be surprisingly close to thesituation in Annex VII countries; and, the use of secondary materials in non-ferrousmetal production is growing much more quickly in Annex VIII countries thanAnnex VII countries. The combined effect of these factors means that Annex VIIIcountries are likely to have much higher growth rates in demand for secondarymetals for the foreseeable future.

N. Johnstone / Resources, Conser6ation and Recycling 23 (1998) 1–28 17
5. International trade in NFM-bearing waste
Trade in hazardous waste represents a relatively significant proportion of totalgeneration. According to Kummer [10] 10% of total hazardous waste generatedcrosses international borders. In the case of the OECD it has previously beenestimated that as much as 15% of hazardous waste generated is exported [27].However, on the basis of recent OECD data exports of hazardous waste repre-sented 4.3% of wastes generated, while imports represented 6.7% [28] (Table 2). Thevast majority of this is imported by other OECD countries. Thus, it has beenestimated that 80–90% of total international trade in hazardous waste is intra-OECD, with 700000 tons traded within Europe and 200000 tons between theUnited States and Canada [29]. Nonetheless, there are some important trade flowsfrom OECD countries to non-OECD countries. Indeed, prior to the introduction ofconstraints on the trade through the Basel Convention and other measures, it wasestimated that Europe exported approximately 120000 tons of hazardous waste todeveloping countries [29].
Data on trade in waste with secondary values is even sketchier, but it has beenestimated that 95% of waste exports from OECD countries to non-membereconomies is bound for recycling [3,6]. This compares with a proportion of 58% oftotal OECD waste exports which were destined for recovery [28]. This indicates thatwhile intra-OECD hazardous waste trade tends to be for final disposal, theconverse is true of OECD trade with other countries. More specifically, in the caseof metal scrap and residues, trade from OECD countries to other countries isincreasing much more quickly than trade between OECD countries [30]. Much ofthis is destined for relatively rapidly growing countries in East Asia and Latin
Fig. 5. Annual change in secondary NFM production.

N. Johnstone / Resources, Conser6ation and Recycling 23 (1998) 1–2818
America where demand is high (see Hoffmann [30] for a discussion of the evidence,and see Sheales and Cox [5] for a discussion of the specific case of lead-acidbatteries). This is compounded by the fact that the supply of scrap is often quitelow since the available stock of obsolete capital equipment and consumer durablesis small due to the relatively recent nature of widespread industrialisation andincome growth.
Thus, it has been argued that the economic effects of a ban on recyclables will beparticularly significant for developing countries since it will adversely affect theirmanufacturing sectors [1–3,31]. (Hoffmann [31] provides evidence on the relianceof NICs on OECD metal scrap imports.) Using UNCTAD data [32] it is possibleto examine recent trends in the import of NFM waste and scrap imports to‘developed market economy countries’ (DMECs) and to ‘developing countries andterritories’ (DCTs) (see Fig. 6A,B). In both cases copper volumes and growth ratesfar exceed lead and zinc.
However, the relevance of the Basel Convention to these trade flows dependsupon the origins of the imports relative to Annex classifications and the definitionof those wastes which are subject to the ban. The Technical Working Group is inthe process of determining the precise characteristics of the wastes to be included inthe various classifications and their deliberations have been reviewed recently (see[7,9] for discussions). While it is unlikely that all ambiguities will be resolved, it isto be hoped that the degree of uncertainty will be reduced when the lists arecompleted.
In this vein it should be emphasised that most of the studies, which foreseesignificant impacts from the ban have tended to use rather broad interpretations ofthe waste criteria which are to be applied since there has been considerableambiguity about the discussions of which wastes are to be affected. However, it isto be hoped that such broad definitions are not consistent with the final criteriawhich are to be applied by the Technical Working Group. For instance, List Adrawn up by the Technical Working Group (which covers wastes to be controlledby the Convention) explicitly excludes scrap metal waste in ‘massive’ form from theimpacts of the ban.
Thus, in order to obtain a clearer indication of the vulnerability of Annex VIIIcountries to the ban, the proportion of imports from Annex VII countries insecondary non-ferrous metal-bearing waste which was in the form of ash andresidue (HS 2620) relative to that which is in the form of bulk scrap (HS 7404-8002)was calculated (UN COMTRADE data reported in [30]). While the latter isunlikely to be subject to the ban since it is presently on the OECD’s GreenList—which was used as an interim classification in the Convention and continuesto be used as a reference point by the TWG—some of the former will be since itis on the OECD’s Amber list and the Technical Working Group’s preliminary listsas well.
The data indicate that over the period 1990–1994 OECD countries shippedapproximately three times more non-ferrous metal-bearing ash and residue to eachother as to non-OECD countries. However, proportionally exports to non-OECDcountries were considerably more heavily weighted toward ash and residue relative

N. Johnstone / Resources, Conser6ation and Recycling 23 (1998) 1–28 19
Fig. 6. Imports of NFM waste and scrap.

N. Johnstone / Resources, Conser6ation and Recycling 23 (1998) 1–2820
Fig. 7. Percentage of NFM-bearing ash and residue trade in total NFM waste and scrap trade.
to bulk scrap (37.3% and 28.7%) (see Fig. 7). This result is rather surprising giventhat the technology required to process ash and residue is usually more advancedthan that required to process bulk waste [15,33].
Nonetheless this proportion is falling appreciably. Indeed for the last year forwhich data is available (1994) it fell below the intra-OECD proportion. Thisindicates that the proportion of waste which is likely to be subject to the ban isfalling. (Although it must be recognised that some of this fall may be a reflectionof existing restrictions on trade to non-signatories, thus reflecting the effectivenessof the Basel Convention prior to Decision III/1.) In absolute terms the trade in1994 was only 50% the level it was in 1990. While trade in some particular wastesmay be adversely affected (i.e. lead-acid batteries) the majority of NFM waste withsecondary values will not be subject to the ban.
5.1. Conclusions
The available data indicate that while Annex VIII countries import considerablevolumes of NFM-bearing waste and scrap (particularly copper), a small anddecreasing proportion of this is likely to be subject to the ban. Some of this fall mayin fact be attributable to the Basel Convention’s existing trade control mechanismsand/or in anticipation of the forthcoming ban. However, it is also quite likely that

N. Johnstone / Resources, Conser6ation and Recycling 23 (1998) 1–28 21
Annex VIII countries have less demand for NFM-bearing waste which comes in theforms likely to be subject to the ban (i.e. lower-value ash and residue) relative toother types (i.e. bulk scrap).
6. Empirical analysis of secondary non-ferrous metal production
To cast further light on the likely economic and environmental consequences ofDecision III/1, efforts were made to determine the factors behind the trade in NFMwaste and scrap. It is argued that this will provide indirect evidence of the extent towhich the trade can be explained by non-environmental economic factors. If thereis a case for the trade on the basis of its use as an input in the production ofsecondary metals, then fears about its environmental consequences may be over-stated. This is approached in two ways: firstly the structural characteristics ofsecondary metal production is reviewed; and, secondly a statistical analysis of thedeterminants of secondary NFM production is undertaken.
It has been argued that developing countries may well possess a comparativeadvantage in some forms of metal-bearing waste reclamation [30]. Indirect evidencefor this assertion is reflected in the relatively lower value per ton of waste forOECD NFM ash and residue exports destined for non-OECD countries than otherOECD countries (see Fig. 8). Moreover, it does appear that secondary NFM
Fig. 8. The value of NFM-bearing ash and residue imports by trade flow.

N. Johnstone / Resources, Conser6ation and Recycling 23 (1998) 1–2822
Table 5The structural characteristics of non-ferrous metal production
Secondary NFMPrimary NFM
35Employees/plant 199Employees/value added ($m) 10.22 10.69Assets ($m)/plant 44.12 3.26Assets ($m)/value added ($m) 2.27 0.99Earnings ($)/employee 38 500 30 300Energy ($m)/value added ($m) 0.50 0.11
Source: USDOC COM [39].
production is less capital-intensive and skill-intensive than primary NFM produc-tion. For instance, in the United States, assets per plant, capital-intensity relative tovalue added and the proportion of skilled workers are all lower for secondary NFMplants relative to primary plants (see Table 5).
Nonetheless, it does seem unlikely that the value differences can be explainedentirely by the comparative advantage enjoyed by developing countries in sec-ondary metal production. While there may be some forms of labour-intensive NFMreclamation (i.e. some small-scale lead-acid battery recovery) in which this may bethe case, most forms of NFM-bearing waste reclamation are technologically-ad-vanced and capital-intensive in nature (see [15,33,34] for discussions). Thus, thedifference is probably largely a reflection of differences in the composition of thetrade flows by metal type, differences in the metal content of the waste, anddifferences in the quality of treatment and reclamation employed, and differences inthe final destination of the waste.
Thus, the most important environmental issue is to determine whether or not thewaste is in fact being discarded rather than reclaimed. This was approachedindirectly by estimating whether or not waste imports into Annex VIII countrieswere a significant determinant of secondary metal production. If so, then this wouldundermine the widespread assertion that most waste with secondary values isimported for ‘sham’ recycling.
With production of the relevant unwrought secondary non-ferrous metal [26] asthe dependent variables, cross-sectional OLS regressions were estimated using GNPper capita [24], physical capital stocks [35,36]8, imports of NFM waste and scrap[32] and primary non-ferrous mineral reserves [37,38] as the explanatory variables.The first explanatory variable serves as a proxy for structural differences in theeconomies. The latter three reflect resource availability. It is expected that the signson capital stock (reflecting availability of old scrap) and waste and scrap importswould be positive, while the sign on primary metal reserves is ambiguous since itmay be either a substitute in terms of output (through primary metal production)or a complement in terms of factor inputs (since scrap and primary metals are oftenmixed). All variables are expressed in logs.
8 In the case of copper and zinc total estimated physical capital stocks [35] are used. However, sincealmost all recycled lead waste comes from batteries, motor vehicle vehicle stocks [36] were used.

N. Johnstone / Resources, Conser6ation and Recycling 23 (1998) 1–28 23
Table 6Determinants of secondary copper production
Coefficient t Statistic
0.274746 0.135792InterceptGNP PC 0.2869320.064563
−0.37119−0.06629K stock6.7316481.469849Reserves4.6924720.865331Imports
0.797383Adj R2
19.69325F statisticn 20
All of the regression perform relatively well (Table 6 Table 7 Table 8). In all casesthe regressions have considerable explanatory power and the statistically significantcoefficients are of the expected signs. However, given that the sizes of the sampleswere significantly constrained by availability of reported values for all five variablesit would be unwise to attach too much confidence to the results.
Nonetheless, the results are environmentally reassuring insofar as waste andscrap imports for copper, lead and zinc appear to be significant determinants ofsecondary metal production. The coefficients are positive and statistically signifi-cant. In the case of copper and lead, primary reserves are positive and significantindicating complementarity in primary and secondary inputs. In the case of zincphysical capital stock is also positive and significant, perhaps reflecting complemen-tarity of foreign and domestic sources of secondary metal inputs. And finally, giventhe significant and positive relationship between imports of copper, lead and zincwaste and scrap and secondary production of the metals in Annex VIII countriesthere may be adverse economic consequences from the ban. However, it must beemphasised that the waste classifications included in the explanatory variable forimports includes a number of wastes which will clearly not be considered hazardousand as such will not be subject to the ban.
6.1. Conclusions
While it may be the case that some NFM-bearing hazardous waste beingexported from OECD countries to non-OECD countries is being discarded in anunsatisfactory manner (this is also true for OECD countries themselves), the studyreveals that there is considerable economic motivation behind the trade which cannot be explained entirely in terms of cost savings due to inadequate treatment. Insome senses the structural characteristics of secondary metal production may bemore consistent with factor endowments and costs in non-OECD countries thanprimary metal production. Moreover, imports of waste and scrap do appear to besignificant determinants of secondary metal production. As such the economicconsequences of the ban need to be taken into account. There is no reason why thiscan not be done through appropriate waste classification.

N. Johnstone / Resources, Conser6ation and Recycling 23 (1998) 1–2824
Table 7Determinants of secondary lead production
Coefficient t Statistic
−2.60664Intercept −1.479030.193031GNP PC 0.8151420.331284K stock 1.3332540.262093Reserves 3.1437780.570369 2.243388Imports0.549029Adj R2
8.304617F statistic25n
7. Conclusions and policy recommendations
The proposed ban on exports of hazardous waste from Annex VII countries toAnnex VIII countries has been criticised for two reasons: firstly, it is not an efficientway to meet the stated environmental objective; and, secondly it will result inadverse economic consequences for the countries who are no longer able to importwaste with secondary values. Using NFM-bearing waste as a case study, this reporthas examined these issues by looking at relative rates of waste generation, demandfor wastes with secondary values, the extent of affected waste trade flows, and theeconomics of secondary NFM production.
While it is recognised that the ban is far from being an ideal environmental policyinstrument it must be understood as a reflection of both market failures (in thetrade in hazardous wastes) and policy failures (in previous efforts to control adverseeffects from the trade). If appropriate criteria are applied (mainly related to wasteclassifications and Annex classifications) then the environmental implications of theban are likely to be positive.
Table 8Determinants of secondary zinc production
Coefficient t Statistic
−3.57942Intercept −4.818750.834754GNP PC 2.671363
2.2120010.198585K stock3.089781Reserves 0.2043535.0283722.119744Imports
Adj R2 0.723845F statistic 15.41633
23n

N. Johnstone / Resources, Conser6ation and Recycling 23 (1998) 1–28 25
Moreover, as long as those waste streams which are likely to be used forreclamation (rather than those which can potentially be used for reclamation) arenot subject to the ban then the economic consequences may not be negative fordownstream sectors. In this vein, it may be desirable to include economic criteriain the classification of waste streams, and not just environmental criteria. Simi-larly, the means by which countries are classified into the two annexes needs tobe clarified. At present the Convention implicitly assumes that only OECD coun-tries are practising environmentally sound management of hazardous wastewhereas all other countries are not. There are, however, a number of developingcountries which, from a technical, managerial and regulatory point of view meetenvironmentally sound management criteria for specific sectors and/or wastegroups.
Moreover, given the rate of growth in generation in many of the Annex VIIIcountries the relative environmental benefits are likely to be slight even if theTWG is able to develop appropriate classification systems. With or without theban imported waste will represent an increasingly small proportion of the totalwaste management problem in many developing countries. In this light the mosttelling indicator of the success of the Basel Convention is not so much its abilityto reduce trade flows from OECD countries, but the effect that it has on thecapacity of developing countries to manage their own wastes effectively. It canbe argued that some of the aspects of the Convention actually discourage thedevelopment of such capacity. For instance, Sheales and Cox [5] assert thatreduced exports of hazardous waste from OECD countries will reduce incentivesfor OECD countries (who dominate the sector) to transfer waste managementtechnology to non-OECD countries.
Thus it is important to add teeth to the positive measures in the Conventionwhich have lain almost dormant since its inception. In particular the Conven-tion’s ‘Technical Cooperation Trust Fund to Support Developing Countries’ hasreceived almost no financial support. This is in marked contrast to the Multilat-eral Fund in the Montreal Protocol. In addition, the establishment of regionalcentres for training and technology should be expanded and accelerated. Giventhe recent establishment of a number of regional waste agreements with traderestrictions (i.e. in Central America and sub-Saharan Africa) this could be coor-dinated with efforts to coordinate intra-regional specialisation in particular wastestreams.
In the event that such efforts are not supported there is a danger that theoverall environmental consequences of the Basel Convention could indeed proveto be negative. Since developing countries are inevitably going to play an in-creasingly important role as generators of hazardous waste, and since an ill-con-ceived ban—i.e. one which is unrelated to actual capacity—may discourageenvironmentally benign trade in hazardous waste, this outcome is by no meansunlikely. What is required is careful formulation and flexible application of thetechnical guidelines and increased support for those positive measures of theConvention which encourage ESM in developing countries.

N. Johnstone / Resources, Conser6ation and Recycling 23 (1998) 1–2826
Acknowledgements
The author would like to thank Dr. Ulrich Hoffmann of the International Tradeand Commodities Division at UNCTAD for a number of helpful suggestions. Thefinancial support of the Environment and Trade Unit at the United NationsEnvironment Programme and the Department for International Development isgratefully acknowledged.
Appendix A. Estimated generation of hazardous waste in OECD countries
Tons (1000s)YearCountry
Australia 4261992915Austria 1995
27 5301994Belgium1991 5896Canada1992 7000France
90201993GermanyItaly 1991 3387
666NDJapan26001993Netherlands
1987 1708Spain5001985Sweden837Switzerland 1993
19571993UK258 0001993USA
Source: OECD 1997.
References
[1] Bureau of Industry Economics. Implications of a Ban on Trade in Non-Ferrous Metals forRecycling. Australian Government Printing Service, Canberra, 1995.
[2] Cox A, Sheales T. Basel Convention: Economic Issues in the Ban on Shipments of HazardousWaste. Australian Commodities 1996;3(3).
[3] Guevara MIP, Hart M. Trade Policy Implications of the Basel Convention Export Ban onRecyclables from Developed to Developing Countries. ICME, Ottawa, 1996.
[4] Gunasekera D, Whiteman J. Implications of a Ban on Exports of Used Lead Batteries. BIEOccasional Paper 31. Australian Government Publishing Service, Canberra, 1995.
[5] Sheales T, Cox A. The Basel Convention Ban on Shipments of Hazardous Waste: Some EconomicIssues. Paper presented at the ABARE Conference, Canberra, 1996.
[6] Kummer K. Transboundary Movements of Hazardous Wastes at the Interface of Environment andTrade. UNEP Environment and Trade Unit WP 7, Geneva, 1994.

N. Johnstone / Resources, Conser6ation and Recycling 23 (1998) 1–28 27
[7] Adams J. Experience with the Use of the Trade Measures in the Basel Convention on theControl of Transboundary Movements of Hazardous Wastes (mimeo). OECD, EnvironmentDirectorate, Paris, 1997.
[8] Kummer, K. The international regulation of transboundary traffic in hazardous wastes: the 1989Basel Convention. Int Comparative Law Q 1992 (July);41.
[9] Campbell L. The Effects on Trade of the Basel Convention on the Control of TransboundaryMovements of Hazardous Wastes and their Disposal (mimeo). UNEP Environment and TradeUnit, Geneva, 1997.
[10] Kummer K. International Management of Hazardous Wastes: The Basel Convention and Re-lated Legal Rules. Clarendon Press, Oxford, 1995.
[11] Johnstone N. International and Environmental Change: Evidence and Implications for Develop-ing Countries. IIED EEP Gatekeeper 96-01, London, 1996.
[12] Beghin J, Roland-Holst D, van der Mensbrugghe D. A survey of the trade and environmentnexus: global dimensions. OECD Econ Stud 1994;21:167–87.
[13] Baumol WJ, Oates WE. The Theory of Environmental Policy. Cambridge University Press,Cambridge, 1988.
[14] Johnstone N. The Economic and Environmental Effects of the Basel Convention (mimeo).UNEP Environment and Trade Unit, Geneva, 1997.
[15] United States Environmental Protection Agency. Report to Congress on Metal Recovery, Envi-ronmental Regulation, and Hazardous Waste. Publication No. EPA530-R-93-018. USEPA,Washington, 1994.
[16] International Maritime Office. Global Waste Survey: Final Report. IMO, London, 1995.[17] United Nations Department for Economic and Social Information and Policy Analysis. Indus-
trial Commodity Statistics Yearbook: Production and Consumption Statistics. UN, New York,1995.
[18] Hettige H, Martin, P., Singh, M., Wheeler, D. The Industrial Pollution Projection System.World Bank Policy Research Working Paper 1431. World Bank, Washington, 1995.
[19] World Bank. STARS Database. World Bank, Washington, 1995.[20] United Nations Industrial Development Organisation. Industrial Statistics Database. UNIDO,
Vienna, 1997.[21] Dessus S, et al. Input-Based Pollution Estimates for Environmental Assessment in Developing
Countries, Technical Paper No. 101. OECD Development Centre, Paris, 1994.[22] United States Department of Commerce, Interindustry Economics Division. Benchmark Input-
Output Accounts for the US Economy, 1987. Surv Curr Bus 1994;April:73–115.[23] Tilton JE, editor. World Metal Demand: Trends and Prospects. Resources for the Future,
Washington, 1990.[24] World Bank. World Development Report. Oxford University Press, Oxford, 1996.[25] Interindustry Economics Division. The Input-Output Structure of the US Economy, 1977. Sur-
vey of Current Business. United States Department of Commerce, May 1984:42–77.[26] United Nations Industrial Development Organisation. Industrial Commodity Statistics Yearbook.
UNIDO, 1996.[27] Krueger J. Regulating Transboundary Movements of Hazardous Wastes: The Basel Convention
and the Effectiveness of the Prior Informed Consent Procedure. IASA WP 96-113. IASA,Laxenberg, 1996.
[28] OECD. Transfrontier Movements of Hazardous Wastes. OECD, Paris, 1997.[29] Montgomery MA. Reassessing the waste trade crisis: what do we really know? J Environ Dev
1995;4(1).[30] Hoffmann U. A Statistical Review of International Trade in Scrap and Residues: Part II and
Part III. ICME, Ottawa, 1996.[31] Hoffmann U. A Statistical Review of International Trade in Metal Scrap and Residues: Part I.
ICME, Ottawa, 1995.[32] United Nations Conference on Trade and Development. Handbook of World Mineral Trade
Statistics: 1990–1995. UNCTAD, New York, 1997.

N. Johnstone / Resources, Conser6ation and Recycling 23 (1998) 1–2828
[33] European Commission. Study on the Technical and Economic Aspects of Measures to Reduce (onthe Basis of Best Available Technology) The Pollution of Water and Other Environmental Areasfrom the Non-Ferrous Metal Industry. Office for Official Publications of the European Communi-ties, Luxembourg, 1996.
[34] OECD. Recycling of Copper, Lead and Zinc Bearing Wastes. OECD Environment Monograph No.109, 1995.
[35] Nehru V, Dhareshwar A. A new database on physical capital stocks. Rev Analisis Economico1993;8(1):37–59.
[36] International Roads Federation. World Road Statistics. IRF, Geneva, 1997.[37] DiFrancesco CA, Comellisson, G.R., Peterson, G.R. The Availability of Primary Lead and Zinc in
Market Economy Countries. Information Circular 9369. United States Department of the Interior,Bureau of Mines, Washington DC, 1993.
[38] Porter KE, Peterson GR. The Availability of Primary Copper in Market Economy Countries.Information Circular 9310. United States Department of the Interior, Bureau of Mines, Washing-ton, DC, 1993.
[39] United States Department of Commerce, Economics and Statistics Administration. Census ofManufactures: Industry Series (Smelting and Refining of Nonferrous Metals and Alloys). USGPO,Washington, 1995.
.