Embed Size (px)
Citation preview

1THE IMPLICATIONS OF DUMPING OF AGRICULTURAL PRODUCTS IN ASIA: ASIAN FARMERS’ UNTOLD MISERY
The Implications of Dumping ofAgricultural Products in Asia:Asian Farmers’ Untold Misery
IntroductionThe push for tariff reduction worldwide along
with the pressure to eliminate productionsubsidies, which has been largely commandedby the World Trade Organization (WTO), hasbrought serious repercussions to the dominantlyagrarian Asian economies. Across thesecountries, there have been unprecedenteddeclines in agricultural tariffs and other non-tariffbarriers as well as production support as a resultof their commitments to the WTO Agreement onAgriculture (AoA). Compounding the trend are theagreements being introduced either bilaterally orthrough the regional trade blocs, which are meantto ensure and fast-track the trade liberalisationthat has been time and again derailed in the WTOnegotiations.
The AoA has become one of the mostcontentious agreements because of itsfundamental flaws of subjecting subsistenceagriculture to trade liberalisation and increasingthe role of the corporation. Its impact on thelivelihood and survival of the small Asian farmershas been most illustrative of the basic argumentsagainst further agricultural trade reform. But apartfrom these key issues, the AoA and other tradeagreements in agriculture that tend to complementthe AoA have also institutionalised dumping – theunbridled and unprecedented influx of cheapagricultural products in Asia and elsewhere, whichhas hastened the erosion of the agrarianeconomies and their capacity for futureindustrialisation.
WTO Injustice: How Dumping isInstitutionalised
Dumping is the practice of a firm, wherein thefirm exports at a price that is lower than the priceof a similar product in the exporting country. Thedifference between the export price and thedomestic price (the price in the exporting country)is called the dumping margin. It is also considered
WriterRos-b Guzman (IBON Foundation Inc.)
Editor-in-chiefSarojeni Rengam (PAN AP)
Editor and Project CoordinatorGilbert Sape (PAN AP)
Production StaffXin Ying Tan (PAN AP)Norly Grace Mercado (PCFS)
Lay-out and Cover DesignSinag de Jesus (Red Leaf Designs)
ContentsIntroduction
WTO Injustice:How Dumping is Institutionalised
The Subsidy War:Simply an Inter-Imperialist Dispute
Globalising Asian Agriculture
Domestic Support
Market Distortions by the US and EU:Who suffers?
The Myriad of Catastrophes
Notes
Abbreviations
Definition of Terms
1
1
3
5
9
13
21
28
30
30

2 THE IMPLICATIONS OF DUMPING OF AGRICULTURAL PRODUCTS IN ASIA: ASIAN FARMERS’ UNTOLD MISERY
dumping when the export price is a lot lower thanthe combined cost of production, marketingexpenses and a reasonable profit.1
Dumping is an unfair trade practice becausethe firm undercuts its competitors. It is explicitlyprohibited in the WTO. But how exactly a firmmanages to lower its export price without losingits profit margin is one of the most interestingarguments against the WTO. It appears thatdumping prospers mainly through institutionalsupport, which interestingly has been provided bythe WTO.
The AoA has all the elements thatinstitutionalise and strengthen the practice ofdumping. The three main categories ofcommitments in the AoA, namely (1) marketaccess, (2) domestic support and (3) exportcompetition, which are purported to removedistortions to trade have only permitted developedcountries to do the reverse – increase theirdomestic subsidies, retain their export subsidies,and cushion their producers from imports surgesand price fluctuations.
The AoA binds all WTO member countries toreduce their tariff levels, abolish quantitativerestrictions, convert non-tariff barriers into tariffs,reduce domestic support, and reduce exportsubsidies. The developing countries are subjectedto the same rules in agricultural trade liberalisationas the developed countries, the only concessionbeing slightly lower reduction rates and slightlylonger time schedules. Least developed countries(LDCs), on the other hand, are not required toreduce tariffs or subsidies but just the same arenot allowed to raise them.2 In short, all WTOmember countries should go by a programme ofprogressive liberalisation that is supposedlydesigned to ‘level the playing field’ and bring abouthealthy competition in agricultural trade.
But the AoA is inherently imbalanced, the mainform of injustice being in the area of domesticsupport. There are three categories of domesticsupport measures that fall under what the WTOcalls “boxes”:
1. Amber Box – input subsidies and pricesupport – these are viewed to be trade-distorting and have repercussions onproduction2. Green Box – support for research, ruraldevelopment and public stockholding andmarketing – these are assumed to have noeffects on production
3. Blue Box – direct payments to farmers tocompensate them for programmes that limittheir production
Subsidies in the Amber Box are subject toreduction discipline. A certain limit of subsidiesmay be exempted – 5% of the total value ofagricultural production for developed countries and10% for developing countries. But subsidies abovesuch levels have to be reduced – 20% from their1986-88 levels in a period of six years fordeveloped countries and 13% over 10 years fordeveloping countries.
Subsidies in the Green Box and the Blue Box,on the other hand, are viewed as minimally trade-distorting and connected to production-limitingscheme therefore not subject to reduction.
There are two reasons that make the area ofdomestic support unfair. One, to begin with, poorcountries had already used minimal subsidies inthe past or had been asked by the InternationalMonetary Fund (IMF) to reduce subsidies as partof the IMF structural adjustment programme(SAPs) of liberalisation. Their percentages ofreduction, therefore, were already two-thirds oftheir existing subsidies; some even had zero-levelsubsidies, when the WTO-AoA came into force.On the contrary, percentages of reduction for richcountries, which have always used subsidiesheavily to support their agricultural production,represented only a small portion of their existingsubsidies.
As a result, while poor countries are nowprohibited from using or increasing domesticsupport beyond the de minimis level of 10% oftotal agricultural value, rich countries have retainedup to 80% of their subsidies even after the six-year implementation period.
Two, the U.S. and the E.U., by putting in severalsubsidies in the Green Box and the Blue Box, havesucceeded in excluding from reduction severaltypes of subsidies such as U.S. direct paymentsand E.U. compensation payments, along with along list of other non-actionable subsidyprogramme. As a result, the total domesticsubsidies in the rich countries are now even muchhigher compared to their 1986-88 base level.3
For instance, the E.U. 1986-88 subsidy levelwas USD83 billion and increased to USD95 billionin 1996. For the U.S., the base period subsidylevel of USD50 billion increased to USD59 billiononly in the first year of implementation. Accordingto the OECD, the total subsidy and all its

3THE IMPLICATIONS OF DUMPING OF AGRICULTURAL PRODUCTS IN ASIA: ASIAN FARMERS’ UNTOLD MISERY
equivalents rose from USD99.6 billion in 1995 toUSD129.8 billion in 1998 in the E.U. and USD41.4billion to USD46.9 in the same period coverage inthe U.S. Another comprehensive calculation bythe OECD, the Total Support Estimate (TSE) for24 OECD countries, shows domestic supportrising from USD275.6 billion for the base year toUSD326 billion in 1999.4
Developing countries managed to gain minimalspecial and differential treatment (SDT) andexempt four items:
1. input subsidy given to poor farmers2. subsidy for land improvement3. diversion of land from production of illicitnarcotic crops4. provision of food subsidy to the poor
But these are minimal compared with the U.S.and E.U. exemptions, and hardly half a dozen ofthe poor countries use these subsidies.5 Inaddition, the U.S. and E.U. subsidies are alsoexempted from “due restraint” action by the WTOunder its dispute settlement process while thoseused by the poor countries are not immune fromcountervailing measures.
Developed countries have also retained 64%of their budget allocations for export subsidies and79% of their export subsidy coverage. Developingcountries meanwhile had not been using exportsubsidies for a long time, and if ever they hadminimal exceptions, should now reduce and stopusing such.6
With regard to market access, the AoA madelittle progress in reducing agricultural protectionin the developed countries. To illustrate, in the firstyear of AoA implementation, tariff rates for richcountries were so high – 244% for sugar in theU.S.; 213% for beef in the E.U; 353% for wheat inJapan; and 360% for butter in Canada – that evenif their rates were reduced by 36% on average toend-2000 would still be prohibitive.7
One area of inequity in market access is the‘special safeguard’ provision, whereby countriesthat went through tariffication may protect theirfarmers when imports rise above or prices fallbelow specified levels. But only few developingcountries undertook tariffication. Furthermore, thecriteria for the use of ‘special safeguard’ arestringent if not unclear in the WTO, aside fromthe fact that the requirements are hard todemonstrate in household subsistence agriculture.
Still, when the developing country is the
exporter, the developed countries may takesafeguard measures even if the exportingdeveloping country has low import base ordeclining production. Although there is a deminimis provision that says no safeguard actionwill be taken against the exporter as long as itsshare to total imports of the product in theimporting country does not exceed 3%, it is barelyfollowed by the developed countries.
Another area of inequity in the market accessis the ‘minimum access opportunity’, wherecountries, after tariff reduction in certain productshave not provided substantial market access, aremade to import modest amounts of these products.These high-tariff products are usually theabundantly produced and therefore mostprotected agricultural and food products of thedeveloping countries.8
Apart from the inherent imbalances of the AoA,it has the basic flaw of assuming that agriculturalproduction and trade in the developing world couldbe done commercially and that a “fair” tradeagreement could arise from decades of colonialtrade patterns between the developing anddeveloped countries. The combination of theseissues has led to unbridled and unprecedenteddumping of agricultural products in poor countriesand the consequent collapse of rural economies.
The Subsidy War: Simply an Inter-Imperialist Dispute
The AoA has a built-in mechanism that providesfor a scheduled review and renegotiations towardsfurther liberalisation despite protests overimbalances and implementation issues. This iswhy the controversy has not subsided even up tothe time of the collapse of the so-calledDevelopment Round in 2006.
In Doha in 2001, the WTO, despite thornyissues, launched the Development Round thatwas supposed to start in the MinisterialConference in Cancun in 2003 through anundemocratic process called ‘Chairman’sUnderstanding’ as reaching ‘consensus’ and theformation of the Trade Negotiations Committeetasked to prepare all requisites for a new round inCancun.
Cancun collapsed. In agriculture, the collapsewas due to the rejection of the Harbinson Text andthe joint U.S.-E.U. proposal that sparked debateson framework and modalities, summarised into thefollowing:

4 THE IMPLICATIONS OF DUMPING OF AGRICULTURAL PRODUCTS IN ASIA: ASIAN FARMERS’ UNTOLD MISERY
1.Further tariff reduction2.Inclusion of the remaining sensitive cropsof the developing countries in liberalisation3.Further increase in exempted domesticsubsidies enjoyed by the developedcountries4.Continuation of export subsidies enjoyedby the developed countries5.Reduction by 10% the list of products vitalto food security, rural development, andlivelihood security6.Redefinition of SSG measures in order toinclude subsidies of developed countries9
The emergence of clear country groupingsdivided the lines in Cancun. G21, later called G20,led by India and Brazil and composed of countriesactive in agricultural trade such as China,premised further market access on the reductionof subsidies by the developed countries. G33, ledby Indonesia, focused on the issue of dumping byproposing special products (SP) and specialsafeguard mechanism (SSM) provisions thatwould allow further tariff protection and safeguardsfor certain basic food and agricultural products.
The intensity of the debate was mainly broughtabout by increased dumping. Even before the timeof Cancun, developing countries alreadyexperienced devastating changes: skyrocketingworld commodity prices, depressed farmgateprices, massive farmers’ bankruptcies, and ruralunrest. These phenomena also prevented elitegovernments of the Third World from simplyallowing further market access and dumpingwithout clear concessions from the global powers.
But for the Ministerial Conference in Hong Kongin 2005, the Five Interested Parties (U.S., E.U.,Brazil, India and Australia) pushed for the JulyFramework Agreement, summarised as follows:
1.The North still defending their high levelsof subsidies (AoA)2.Bringing down non-agricultural tariffs(NAMA)3.Still pushing for the New Issues(Government Procurement, CompetitionPolicy, Investments, Trade Facilitation)4.Pushing to make offers for theliberalisation of services (GATS)10
In particular in agriculture, the July Frameworkproposed a new formula for further tariff reductionbased on ad valorem and offered milder NAMA
and GATS as compromises for increased marketaccess in agriculture. Rich countries alsoproposed to create a new restrictive categorycalled Sensitive Products, focusing on tariff-ratequotas only, which poor countries do not use. Yet,the July Framework set aside talks on thedemands of poor countries on SPs and SSMs.
Rich countries also skirted the issue of the“boxes”, promising nothing on the target date forthe phase-out of the Amber Box and still not puttingin place an overall ceiling for the Green Box. Yet,they proposed to include in the Blue Box subsidiesnot necessarily limiting production, thereby merelyshifting domestic support from the Amber to theBlue Box. The E.U. even offered to remove itsexport subsidies on the improbable condition thatthe U.S. removes its ‘food aid’, export credits andcredit guarantees, and monopoly of state tradingenterprises. The SDT for the poor countries andstate trading by net food importing countries werenot tackled at all.
Before Hong Kong, especially after the collapseof Cancun, trading and investment corporationswere already growing impatient over the slowWTO process, given endless disputes andinconclusive talks. Yet, despite setbacks, the DohaRound had undoubtedly inched ahead, and HongKong was thus intended not exactly to close theDoha Deal but to set the stage for its completion.
The timetable was that by April 2006 formulascalled modalities would have been incorporatedinto the countries’ tariffs and products. The overallidea was to conclude the talks by the end of 2006so that the Doha Round could be ratified in theU.S. legislature before the legislators’ terms endin mid-2007.11
In agriculture, the idea was to cluster tariffs intobands (or ranges of tariffs) with correspondingreduction for each band, minimizing the chancesof “hiding” low tariffs behind high tariffs. With regardto domestic support, nothing much was achievedin Hong Kong as the principle of “you first” stillprevailed between the U.S. and the E.U. The U.S.proposed to cut its subsidies by 60% if the E.U.would cut its subsidies by 83%, but the E.U. wouldonly go as far as 70 %. Moreover, both the U.S.and the E.U. managed to retain and even includeexemptions in the Blue Box and Green Box. Finally,with regard to the reduction of export subsidies,the compliance is still six years away in which timemuch may still be maneuvered. Still, even if theE.U. eventually complies, the reduction would onlybe around 10% of its total agricultural support.12

5THE IMPLICATIONS OF DUMPING OF AGRICULTURAL PRODUCTS IN ASIA: ASIAN FARMERS’ UNTOLD MISERY
After Hong Kong, talks and several GeneralCouncil meetings were set in Geneva betweenMay and July 2006 to meet the Hong Kongdeadlines. Apart from these, small-groupmeetings, so-called green room sessions andmini-ministerials were happening round the worldto settle issues but in favor only for thoseattending.
The Group of Six (G6) meetings between theU.S., E.U., Japan, Australia, Brazil and India, inparticular, mandated by the heads of the G8,sought to settle issues on farm and industrialgoods. By July 24, however, these talks hadcollapsed as the G6, chaired by the WTO chiefPascal Lamy, failed to agree on the steps towardsfurther trade liberalisation. The failure had signaledthe breakdown of the five-year Doha Round.
The main cause of the WTO collapse was thestalemate on the key area of domestic agriculturalsupport where the U.S. did not budge an inch fromits original position and instead blamed the othersfor being inflexible on their tariff stands. Since then,the U.S. and the E.U. have engaged in a war ofwords and what the U.S. accused the E.U. of –‘blamesmanship’, further illustrating theirirreconcilable dispute.13
The collapse only shows that the majorstumbling block is still the inter-imperialist disputebetween the U.S. and the E.U. on subsidies.Despite having made significant headway towardsdrastic liberalisation of poor markets, toned downthe SP and SSM demands of the poor countries,and neutralized China, to name a few“achievements”, the U.S. and the E.U. still haveto confront each other on their own protectionism.
The collapse also exposes the emptiness ofWTO development rhetoric, with the U.S. and theE.U. dominating the trade body to serve theirnarrow interests, not to mention the arrogant andautocratic streak of the U.S.
On the other hand, although temporarily, theWTO collapse has stymied the fast and sweepingglobalisation process from opening up further themarkets of poor countries. And this provides anopportunity for poor countries to review the paceof agricultural trade liberalisation and its impacton the survival of the farming communities.
Globalising Asian AgricultureAgricultural trade liberalisation happened
drastically in Asia despite longer schedules andlower reduction rates. Asian agriculture was neverready for trade liberalisation due to its non-
commercial nature and subsistence level, and thefact that as a result, agricultural products were notexactly Asia’s relative advantage in world trade.
Prior to the WTO, most of Asian agriculture wasdevoted to domestic and household consumptionwith only about less than 10% of production tradedglobally. Agricultural products were produced onsmall-scale, with very few exceptions for export.Asian agriculture had little protection – lowdomestic support, no export subsidies, and onlyfew agricultural imports were imposed with non-tariff barriers.
In the advent of the WTO, Asia, especiallySouth, East and Southeast Asia, had the steepestdecline in tariff averages for all products. (SeeTables 1 and 2) In agriculture, the applied ratesof selected Asian countries were a lot lower thantheir bound rates, with Indonesia standing out withonly 5 % applied tariff. (See Table 3)
Applied tariffs were low because of tariffreforms that had been ongoing for a decade beforethe WTO, mostly as loan conditionality. But asidefrom being dictated by international creditors toreduce tariffs, as already mentioned, countriesalso committed to continue reducing applied tariffsafter the AoA implementation period by anunweighted average of 24% over 10 years, subjectto a minimum reduction of 10% in each tariff line.Given the big difference between bound andapplied rates, such commitment was notnecessary to reduce applied rates over theimplementation period, but countries havecontinued to reduce their applied tariffs anyway.Indonesia, for instance, has 5 percent averagetariff for agriculture as compared with the targetof 13.2 % for 2003 under its Pakmei ’95Programme. 14
Indonesia focused on non-tariff barriers (NTBs)such as import licensing restrictions in the 1990s,which affected 1,000 items. But the number hadfallen to 200 in 1996 and declined further asIndonesia committed to the WTO. In agriculture,the country bound 100% of its tariff lines andcommitted to remove all NTBs, including theremaining local content rules for soybean meanand dairy products, licensing rules for alcoholicbeverages, and public importation rights given forrice, soybeans, sugar, wheat and wheat flour toBULOG, the National Food Logistics Agency, andto Clove Marketing and Buffer Stock Agency(BPPC) for cloves.
In 1995, Indonesia implemented Pakmei ’95,a long-term tariff reduction package ending in 2003

6 THE IMPLICATIONS OF DUMPING OF AGRICULTURAL PRODUCTS IN ASIA: ASIAN FARMERS’ UNTOLD MISERY
Developing countries
Africa
North Africa
Sub-Saharan Africa
Sub-Saharan Africa lessSouth Africa
america
Central America and theCarribean
South America
Asia
West Asia
South, East and South-EastAsia
South, East and South-EastAsia less China
Developing countries lessChina
Least developed countries
34.4
35.1
38.3
33.8
33.8
24.9
29.5
11.2
36.5
12.5
43.7
4.3
34
41.7
27.3
25.6
31.2
22.8
22.8
26.6
18.4
29.7
29.6
13.9
36.2
35.9
27.1
29.2
27.6
26.1
28.5
25.4
25.4
23.9
25.7
31
13
35.9
35.5
27.2
34.4
21.9
26.5
24.4
32.8
32.8
12.3
12.2
26.8
10.6
29.5
28.8
21.3
48.7
18
20.5
22.3
20
20.2
14
14.9
13.2
21
10.7
22.6
22.6
17.9
23.5
15
20.6
25
19.2
20.2
12.7
12.1
13.5
14.4
8.8
16.5
16.4
15.1
18.2
12.6
25.8
26.1
15
15.3
10.4
8.9
12.1
11.9
10.1
12.6
12.4
12.6
13.4
REGION 1980-1983 1984-1987 1988-1990 1991-1993 1994-1996 1997-1999 2000-2001
TABLE 1. UNWEIGHTED TARIFF AVERAGE IN PERCENT FOR ALL PRODUCTS
Source: UNCTAD
Developing countries
Africa
North Africa
Sub-Saharan Africa
Sub-Saharan Africa lessSouth Africa
america
Central America and theCarribean
South America
Asia
West Asia
South, East and South-EastAsia
South, East and South-EastAsia less China
Developing countries lessChina
Least developed countries
19.7
26.3
26.9
25.8
25.8
24.7
25.1
16.6
23.8
23.8
19.7
42.8
22.2
20.9
21.2
20.3
20.3
28.6
13.2
36.4
20.9
10.3
24
22.6
18.6
37.7
17.9
22.5
20
26.8
26.8
20
24.9
17.1
13.4
17.6
14.9
14.2
42
14.1
19.4
19.4
12.4
12.5
14.2
10.4
14.5
11.5
10.5
11.4
15.5
19.7
12.1
16
11.9
11.6
12.1
11
8.2
11.2
8.7
10
49
9.9
14.8
18.6
10.2
19.3
14.1
14.8
13.1
8.2
7.6
8.3
6.6
9.2
19.1
11
14
22.7
10.7
14.6
13.5
14.7
11.2
9.7
8.3
9.8
7.8
10.4
14.6
REGION 1980-1983 1984-1987 1988-1990 1991-1993 1994-1996 1997-1999 2000-2001
TABLE 2. WEIGHTED TARIFF AVERAGE IN PERCENT FOR ALL PRODUCTS

7THE IMPLICATIONS OF DUMPING OF AGRICULTURAL PRODUCTS IN ASIA: ASIAN FARMERS’ UNTOLD MISERY
with a three-tiered tariff structure of 0, 5 and 10%. Approximately 20% of agricultural items suchas fruits and vegetables were exempted andaverage tariff for agriculture was targeted to bearound 13.2 % in the final year.
But the IMF Letter of Intent in 1998 (in theaftermath of the Asian financial crash) resulted in
a faster pace than that envisioned under Pakmei’95. To reduce the inflationary impact of the rupiahdepreciation on food prices, the Indonesiangovernment agreed to reduce all food tariffs to 5% and phase out all NTBs including BULOG’smonopoly over imports.
TABLE 3. BOUND AND APPLIED TARIFFS
Source: WTO Agreement on Agriculture: The Implementation Experience of Developing Countries, FAO CorporateDocument Repository, UNCTAD
Bangladesh*
Botswana*
Brazil
Costa Rica
Côte d’Ivoire
Egypt
Fiji
Guyana*
Honduras
India
Indonesia
Jamaica
Kenya*
Malawi
Morocco*
Pakistan*
Peru
Philippines
Senegal
Sri Lanka*
Thailand
Uganda
Zimbabwe
200% average (except 50% for13 lines) plus30%. Other duties or charges (ODC) on allproducts
Average n.a. (mostly in the range of 0-100%)
35% average (0-55% range)
n.a.
15% (except between 5 and 75% for 25 items)
62% in the base period, to fall to28% averagein 2004
40% (except for rice and milk powder boundat 60%, to be reduced to 46% by 2005)
100% average plus 40% ODCs
35% with some exceptions
116% average (about half of tariff lines at100%, and one-third at 150%)
Quite variable, averaging more than 70%
100% average plus 15% ODCs(higher ODCson 55 lines and three Harmonized System[HS] chapters)
100% average
125% generally except for a few products withceiling rates of50%, 55% and 65%
65% average (34% for 71% of the tariff lines)plus 15% ODCs
101% average
30% average (68% for 20 food products)
Average 13.26% in 2000; up to100% initiallyon sensitive commodities reducing to 30-50%
30% average + 150% ODCs
50% average
36% average
80% generally, with some between 40-70%
150% (with a few exceptions at25% and 40%)
25% average
Average 6% (typically 0-35%; formula duties for 6 lines
11% average (maximum of 20% linked to maximumMERCOSUR CET rate)
14.8%
16.4% (2001)
18.5% average (21.8% including ODCs)
Most agricultural imports 15%, and maximum rate 27%
Average n.a. (maximum rate is40% - the CARICOMCET rate)
11% with some higher rates
26% average (89% of tariff lines at 50% or lower,74% between25% and 50%)
5%, with 0% tariffs on food items except for rice and sugar
Average 20.2% (maximum applied rate is 40% - theCARICOM CET rate), additional stamp duties
17% average
15% average
n.a.
Maximum rate 35%
12% generally with maximum of20% for somesensitive products
Average n.a., but 10%, 20% or30%
Now range from 10% to 20%, in line with WAEMU CET
Maximum 35%, with some exceptions
32% average
11.2% average, plus ODCs of 6%
Applied rates average 4-6% up to75% by HS chapter
Country Bound rates Applied rates

8 THE IMPLICATIONS OF DUMPING OF AGRICULTURAL PRODUCTS IN ASIA: ASIAN FARMERS’ UNTOLD MISERY
Although rice and sugar wereexempted from Indonesia’s IMFcommitment of zero tariffs for food itemsand BULOG’s monopoly over rice importswas not eliminated, Indonesia lateropened up rice trade to the private sectoras well. Beginning in January 2000, thecountry introduced new import licensingrestrictions to sugar processors but wouldhave to eliminate such under the WTO.15
Similarly, the Philippines went throughthe Tariff Reform Programme (TRP) underthe IMF prior to the WTO, which resultedin substantial tariff reduction. The firstphase of the TRP-I in the 1980s, implemented aspart of an IMF SAP, reduced tariff rates from 100% to between 10 and 50 %. This was interruptedby the political and economic crises at that timebut was continued by the former Philippinepresident Corazon Aquino’s administration in 1986after the ouster of the Marcos dictatorship.Agricultural export taxes were removed andfertiliser and wheat imports were liberalised. From1986 to 1988, a total of 2,287 items wereliberalised and this marked the end of the firstphase. The second phase of TRP-I liberalisedanother 185 items and tariffied QRs, affecting 36tariff lines including agricultural products.16
The Philippine government implemented TRP-II in 1991, which reduced the number of high-tariffcommodity lines over a five-year period ending in1995. Executive Order 8 issued in 1992 tariffiedQRs affecting 153 commodities and liberalisedanother 286 items. By the end of that year, only21 agricultural commodities were left regulated outof 632 in 1970.
This was however reversed by the MagnaCarta for Small Farmers Law in 1993, whichrequired QRs on agricultural products growndomestically in sufficient quantities, otherwisecalled sensitive crops. After the long-termProgramme of import liberalisation, the MagnaCarta (which was a protection mechanism) waspassed and re-instituted QRs on rice, corn, pork,poultry, garlic onion, vegetables, and coffee. Butbeef and sugar remained liberalised. Then lateron, the QRs (except for rice) were removed underthe WTO.17
The Philippine initial and bound tariffs for thesensitive crops were within the range of 95-100 %in 1995 and 1996. By the end of the AoA, boundtariffs for all sensitive agricultural commodities wouldfall within the range of 10-50 % (See Table 4).
The Philippines also committed minimumaccess volumes (MAVs) of 3% of 1986 to 1988domestic consumption for 1995 and 5% for 2004.It also committed to reduce bound tariffs by 24%with minimum 10% cut per tariff line from 1995 to2004.
On the contrary, Thailand had a policy ofprotectionism in agriculture up until the WTO. Thisincluded price intervention policy with publicpurchases at above market prices, lifting of exporttax measures that had burdened farmers,provision of credit incentives and the like.
In 1994, the country had to go through a tariffreform programme, which resulted in deeper tariffcuts than required under the WTO. Following the1997 financial crisis, tariffs were further reducedin 1999 and 2000, resulting in the removal of thebias against agricultural exports caused by theerstwhile protection.18
Under the AoA, Thailand made a commitmentto reduce tariffs on 740 tariff lines by an averagereduction of 24% over the 1995-2004 period, witha minimum reduction of 10% on all tariff lines.Thailand bound tariffs on 994 agricultural products– 100% of its agricultural tariff lines. The averagebound tariff rate was calculated to decline from49 % in 1995 to the final rate of 36 % in 2004.Thailand also tariffied non-tariff measures on 23agricultural products by converting them into tariffrate quotas (TRQs) with in-quota tariff ratesranging from 20 to 65 %. It reserved the right toresort to the SSG provision for 111 products, or11% of the aforementioned 994 agricultural tarifflines.19
Thailand had more drastic tariff reform bothbefore the conclusion of the WTO Uruguay Roundand after the 1997 financial crisis, which resultedin applied tariffs being lower than the WTO boundrates for all but a few tariff lines. The average
TariffRates
10-30
35-50
55-70
75-90
95-100
1995
1
23
14
8
50
1996
1
23
14
8
50
1997
1
36
9
50
0
1998
1
36
9
50
0
1999
1
44
51
0
0
2000
1
44
5
0
0
2001
1
44
1
0
0
2002
1
44
51
0
0
2003
1
90
0
0
0
2004
1
90
0
0
0
TABLE 4. FREQUENCY DISTRIBUTION OF TARIFF RATES ONSENSITIVE AGRICULTURAL PRODUCTS, 1995-2004 (PHILIPPINES)
Source: WTO Agreement on Agriculture: The Implementation Experienceof Developing Countries, FAO Corporate Document Repository, UNCTAD

9THE IMPLICATIONS OF DUMPING OF AGRICULTURAL PRODUCTS IN ASIA: ASIAN FARMERS’ UNTOLD MISERY
Country 1980-81 1985-87 1988-90 1991-92 1993-97mean
Standarddeviation
(%)
ThailandIndonesiaMalaysiaPhilippinesChinaJapanBangladeshIndiaPakistan
26.323.0
4.3---
70.769.665.1
28.014.7
8.6---
57.590.865.5
33.414.8
7.7---
72.569.953.7
26.213.6
7.3---
73.3a
44.954.1
40.312.3
4.128.917.8
9.1---
19.419.421.2
4.518.210.7
---
TABLE 5. TARIFF RATES AND DISPERSION* OF PRIMARYPRODUCTS IN SELECTED ASIAN COUNTRIES (UNWEIGHTED)
a1993Source: UNCTAD* Dispersion is a statistical term that refers to a method of getting average butassigning weights to each product, thus, the result is not actually an averagebut an index.
applied tariff rate for agricultural products hadgradually declined from 43.1 % in 1995 to 32.1 %in 1999 and 28 % in 2000.
But despite all these, interestingly, Thailand’sapplied tariff rate is still much higher than the ratesfor agricultural imports of most other Asiancountries. (See Table 5) This is so because dueto the long history of protection, after tariffliberalisation, Thailand still has 43% of all its tarifflines exceeding 30 % tariff. The tariff peaks arefound in meat and dairy products, sugar, alcoholicbeverages, tobacco, fruits and vegetable sectors.In addition, there are still 550 products whose
applied tariffs are higher than the bound rates.In South Asia, India is an important case.
Bangladesh, on the other hand, is special since itis classified as an LDC therefore not required toreduce tariffs. India had all its agricultural importscovered with QRs for balance of payments (BOP)reasons. For this, India just had to submit ceilingbindings without upper limit as long as the tariffshad not been bound in earlier negotiations. Inaddition, there was no obligation to reduce theseceiling bindings during the AoA implementationperiod.20
India had previously bound only some of itsagricultural tariffs. These included rice, coarsegrains, dairy products and edible oils – rice anddairy products in the Geneva Protocol (1947),maize and millet in the Torquay Protocol (1951),sorghum during the Dillon Round (1962), andsoybean and rapeseed oil in the Tokyo Round(1979). For other products for which no tariffs had
been bound earlier, India submitted very highceiling bindings of 100, 150 or 300 %.
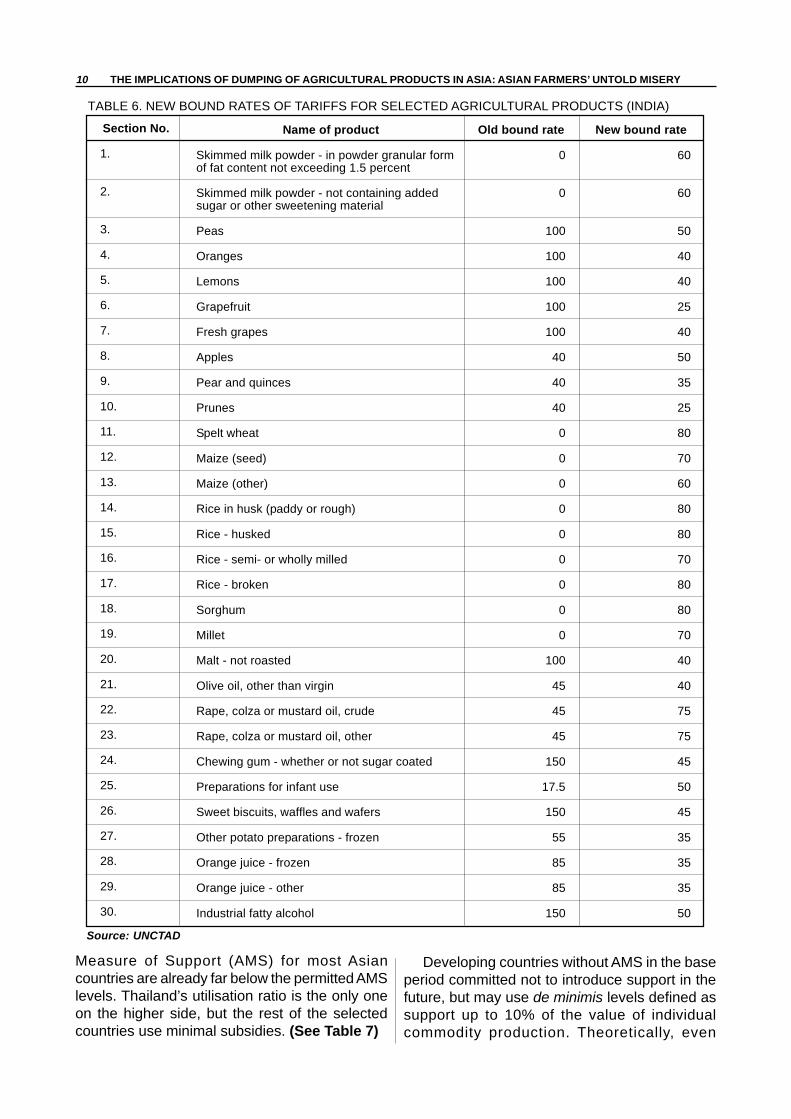
When the QRs were removed, the new boundtariff rates for dairy products were 60 %; cereals,between 70 and 80 %; apples, from 40 to 50 %;rape, colza or mustard oil, from 45 to 75 %; andpreparations for infant use, from 17.5 to 50 %. Inexchange, bound rates for some items were lowered,which included vegetables (peas), fruits (oranges,lemons, grapefruit, pears and quinces, prunes), malt,chewing gum, fruits juices (orange juice), andindustrial fatty alcohols. (See Table 6)
As a consequence, about 82% of tariff lineshave bound rates between 75 and150 % and approximately 4% havebound tariffs of 300 %. Yet, theapplied tariff rates on mostagricultural products are quite low –for a little over 89% of tariff lines, theapplied rates are either below orequal to 50 %. There are only 9.4%of the tariff lines for which the appliedrates range between 50 and 100 %.
Bangladesh, being an LDC, is notrequired to undertake commitmentswith market access. However, it isnot allowed to increase its boundtariff, which was set at a uniformceiling rate of 200 % for allagricultural goods except 13 itemsfor which bound rate is 50 %. Boundtariff rates for two agriculturalproducts, namely green and black
tea are lower than actual tariff. Still, Bangladesh,as will be shown later, cannot take advantage ofthis trade opportunity as its production remainsbackward and costly.21
In sum, Asia in general had little protection priorto the WTO, thus, got its backward agriculturesubjected to extreme competition upon AoAimplementation. Tariffs that were meant to earnprecious revenues for industrialization, let aloneagricultural development, were almost given uplong before the WTO through the neo-liberalpolicies in the IMF SAPs and several otherprogrammes by the World Bank and the AsianDevelopment Bank.
Domestic SupportSuch wholesale restructuring would also
undermine Asian governments’ capacity to supporttheir agricultural sectors. Thus, the levels ofdomestic support as measured by the Aggregate
10 THE IMPLICATIONS OF DUMPING OF AGRICULTURAL PRODUCTS IN ASIA: ASIAN FARMERS’ UNTOLD MISERY
Measure of Support (AMS) for most Asiancountries are already far below the permitted AMSlevels. Thailand’s utilisation ratio is the only oneon the higher side, but the rest of the selectedcountries use minimal subsidies. (See Table 7)
Developing countries without AMS in the baseperiod committed not to introduce support in thefuture, but may use de minimis levels defined assupport up to 10% of the value of individualcommodity production. Theoretically, even
Source: UNCTAD
Section No.
1.
2.
3.
4.
5.
6.
7.
8.
9.
10.
11.
12.
13.
14.
15.
16.
17.
18.
19.
20.
21.
22.
23.
24.
25.
26.
27.
28.
29.
30.
Name of product
Skimmed milk powder - in powder granular formof fat content not exceeding 1.5 percent
Skimmed milk powder - not containing addedsugar or other sweetening material
Peas
Oranges
Lemons
Grapefruit
Fresh grapes
Apples
Pear and quinces
Prunes
Spelt wheat
Maize (seed)
Maize (other)
Rice in husk (paddy or rough)
Rice - husked
Rice - semi- or wholly milled
Rice - broken
Sorghum
Millet
Malt - not roasted
Olive oil, other than virgin
Rape, colza or mustard oil, crude
Rape, colza or mustard oil, other
Chewing gum - whether or not sugar coated
Preparations for infant use
Sweet biscuits, waffles and wafers
Other potato preparations - frozen
Orange juice - frozen
Orange juice - other
Industrial fatty alcohol
Old bound rate
0
0
100
100
100
100
100
40
40
40
0
0
0
0
0
0
0
0
0
100
45
45
45
150
17.5
150
55
85
85
150
New bound rate
60
60
50
40
40
25
40
50
35
25
80
70
60
80
80
70
80
80
70
40
40
75
75
45
50
45
35
35
35
50
TABLE 6. NEW BOUND RATES OF TARIFFS FOR SELECTED AGRICULTURAL PRODUCTS (INDIA)

11THE IMPLICATIONS OF DUMPING OF AGRICULTURAL PRODUCTS IN ASIA: ASIAN FARMERS’ UNTOLD MISERY
Source: Countries marked with an asterisk appeared in the earlier FAO study, and for these countries, the dataare from 1999 or the most recent available year before that date. For other countries, the data are drawn fromthe national case studies commissioned in 2002.
Country
Bangladesh*
Botswana*
Brazil
Costa Rica
Côte d’Ivoire
Egypt
Fiji
Guyana*
Honduras
India
Indonesia
Jamaica
Kenya*
Malawi
Morocco*
Pakistan*
Peru
Philippines
Senegal
Sri Lanka*
Thailand
Uganda
Zimbabwe
Information available
None
GB only
Detailed
GB, SDT, AMS
None
GB and SDT only
None
None
Only SDT
Detailed
GB, SDT, AMS (rice only)
GB only
GB only
None
Detailed
Detailed
GB and SDT only
None
GB and SDT only
None
Detailed
GB and SDT only
GB, SDT, de minimis
Comments
PS AMS negative; NPS AMS about 1% of VoP
GB level about 3% of VoP
PS AMS in 1995 and 1996, respectively, 27% and 23% ofpermitted levels; NPS AMS de minimis, much of it consisting ofcredit subsidies
GB outlays falling; no PS AMS used so far; NPS AMS only for1998 and 1999
Very low
-
-
-
SDT outlays increased
PS AMS negative; NPS AMS about 7.5% of VoP in 1995/96 butfell to about 1% subsequently; SDT not used fully but the rightto use reserved; unofficial estimates suggest this would reduceNPS AMS to 2.3% of VoP
SDT not used; only in 2000, rice AMS
GB outlay about 2% of VoP
-
-
AMS in current years 12-33% of permitted levels
PS AMS negative; NPS AMS about 3% of VoP; PS AMScalculated for one crop in1997-98 and 11 in 1986-88
GB 5 percent of VoP; PSAMS 0 percent; NP AMS 5.0-6.2% of VoP
Very low
85% of GB/SDT on water development
-
Current AMS 60-80% of permitted levels
Minimal support provided
No PS AMS
TABLE 7. SUMMARY OF INFORMATION ON DOMESTIC SUPPORT MEASURES
developing countries without an AMS entitlementcan provide support up to 20% of the value ofproduction – 10% for non-product related supportand 10% for product-related support. As alreadymentioned, they may also exempt subsidies underthe SDT.
However, as already pointed out, developingcountries used minimal subsidies in the past thusstarted from low bases. Except for Thailand, Asian
countries pale in comparison to developedcountries when it comes to domestic support. (SeeTable 8)
Indonesia maintains a number of domesticsupports that include general services,programmes to promote agricultural development,government stockholding, administered pricesystems for some commodities, and domestic foodaid. With the exception of administered prices, most

12 THE IMPLICATIONS OF DUMPING OF AGRICULTURAL PRODUCTS IN ASIA: ASIAN FARMERS’ UNTOLD MISERY
Subsidy
AMS
AMS as a percentageof agricultural GDP
Green Box subsidy
S&D subsidy
De minimis
Total subsidy
Thailand’srank among41 countries
3
7
4
3
10
4
Subsidy(US$ million)
486
(11.6%)
1 290
247
12
2 035
Countries with thelargest subsidy
(1) Republic of Korea(2) Mexico
(1) Republic of Korea(2) Trinidad(3) Venezuela
(1) Republic of Korea(2) Brazil (3) India
(1) India (2) Turkey
(1) India (2) Turkey(3) Republic of Korea
(1) India (2) Republicof Korea (3) Brazil
TABLE 8. THAILAND’S RANK AMONG DEVELOPING COUNTRIES INTERMS OF SUBSIDIES
Note: Several countries did not notify the S&D, de minimis and AMS subsidies.Source: Compiled from ABARE, “Domestic Support of Agriculture”, CurrentIssues, May 2002.
1995366
3-
32401
2 249178
1996407
4-
38450
2 342192
1997557
5-
56618
2 909212
1998622
12411265
1 31010 014
131
1999826
15426347
1 6137 855
205
20001 057
1273 055
334 2728 421
507
General servicesPayments for natural disaster reliefDomestic food aidPublic stock holding of food securityTotal in rupiahExchange rate (Rp/US$)Green Box (US$ million)
Type of measure Monetary value of measure (billion rupiah)TABLE 9. INDONESIA’S GREEN BOX MEASURES
Source: Indonesia’s Notification to the WTO on Domestic Support
of these fall either under the Green Box or underSDT, and need not be reduced. (See Table 9)
But Indonesia did not offer an AMS level, thus,cannot provide support in excess of de minimislevel to any single product. By failing to give anAMS, Indonesia is subject to greater disciplinethan countries that made such commitment eventhough those countries provide far greater levelof support.22
The Philippines maintained trade-distortingdomestic support such as input subsidies andprice support for rice, corn and sugar, but theseare way below the de minimis level, thus, neednot be reduced. Still, there has been a consciouseffort to phase out input subsidies in favour ofprivatised irrigation and market infrastructures.(See Table 10)
Rice price support, on the other hand, hasbecome useless if compared with farmgate prices.
From 1996 to 2000, the government support pricewas a lot higher than farm market prices.Compounding the problem is the limited publicfund and capability to procure rice, estimated atless than 4% of total production.23
India has a product price support system in theform of minimum support prices announced by thegovernment for different commodities. Based onthe computation by the Food and AgricultureOrganization, product-specific support for 18 majorcommodities during the base period amounted toUSD18.1 billion, equivalent to 26% of agriculturaloutput in the crop sector. In the first year of AoAimplementation, the estimated product-specificAMS turned out to be -34.4% of the value ofagricultural output, and by 2000-2001, the samestood at -28.6 %.24
The non-product-specific support, whichincludes subsidies on irrigation, fertilisers,

13THE IMPLICATIONS OF DUMPING OF AGRICULTURAL PRODUCTS IN ASIA: ASIAN FARMERS’ UNTOLD MISERY
electricity, credit and seeds, wasabout 1.3% of the value ofagricultural output during the baseperiod. In 1995-1996, the non-product-specific support was roughly1.9% of the value of agriculturaloutput, and by 2000-2001, the sameworked out to be about 2.3 %. (SeeTable 11)
Thailand has provided all kinds ofdomestic support allowed by theAoA, except for Blue Box measures.Its AMS ceiling was from THB21.8billion in 1995 to THB19 billion in2004 (See Table 12). Thailandstarted with its actual support lowerthan the allowed, but the percentagehas increased rapidly from 72% in1995 to 84% in 1999 and close to100% in 2000. This was bound to gohigher than the commitment becauseof the huge increase in budgetallocation for the paddy pledgingprogramme.
Since the mid-1980s, Thaiagricultural policy has changedalmost completely from taxing theagricultural sector to subsidizing andprotecting farmers, following thedirection of the developed countries.This included price interventionpolicy, lifting of export tax measures.In the late 1980s and 1990s, thisincluded credit incentives that wereprovided to farmers to switch fromcrops that were considered in excesssupply to crops that the governmentlisted as “promising” products under the paddypledging programme.
Market Distortions by the U.S. andE.U: Who suffers?
While Asian countries increased theirparticipation in world trade over the past WTOdecade, with around 40% of the total exports beingtraded amongst them, it is also observable thatthe composition of their exports has movedtowards manufacturing and away from agriculture.At the end of the 1990s, 70% of the exports of thedeveloping countries were manufactures afterhovering around 20% in the 1970s while the shareof agricultural products to total exports further slidfrom 20% to 10% during the same period.
Source: Various Philippine notifications to the WTO and GeneralAppropriations Act for 1999 and 2000.Other domestic supports (Green Box, Amber Box, etc.) are veryinsignificant within the context of the overall national budget.
TABLE 10. PHILIPPINES DOMESTIC PRICE SUPPORT TOAGRICULTURE, 1995-2000 (THOUSAND PESOS)
Year
1995
1996
1997
1998
1999
2000
Total (1995-2000)
Product
Rice
Corn
Rice
Corn
Rice
Corn
Raw sugar
Rice
Corn
Rice and corn
Raw sugar
Rice and corn
Raw sugar
Market support
257 253
257 253
0
920 468
876 766
43 702
1 828 558
617 447
148 463
1 062 648
621 741
72 220
549 521
1 241 993
1 091 993
150 000
1 192 638
592 638
500 000
Total AMS
257 253
257 253
0
920 468
876 766
43 702
1 828 558
617 447
148 463
1 062 648
621 741
72 220
549 521
1 241 993
1 091 993
150 000
1 192 638
592 638
500 000
6 062 651
Although Asian countries are increasinglytrading amongst themselves, their exportopportunities are still hobbled by backwardproduction conditions that are not protected, andmainly determined by market access conditionsin developed countries. As already mentioned, theU.S. and the E.U. continue to be restrictive toexports from the developing world particularly Asia,thus, remain a hindrance to export opportunities.
For instance, developed countries’ weightedaverage tariffs in agriculture are not appreciablyhigher for exporters from their fellow developedcountries than for those coming from thedeveloping countries. Yet, their percentage ofreduction in applied tariffs is a lot higher for thedeveloped countries than the developing

14 THE IMPLICATIONS OF DUMPING OF AGRICULTURAL PRODUCTS IN ASIA: ASIAN FARMERS’ UNTOLD MISERY
countries. This only shows a great bias againstexports from the developing world. On the otherhand, developing countries have always beenrestrictive to the exports from their fellowdeveloping countries, but their average tariffs forboth developed and developing countries arealmost the same. (See Table 13)
According to the UNCTAD, tariff levels evenconceal the level of protection against developingcountries’ exports. Products of particular exportinterest for developing countries are also subjectto specific tariffs, tariff peaks and tariff escalationin developed country-markets.27 In the case ofspecific tariffs, the protection level increases wheninternational prices fall. In the U.S. and E.U.
including Japan, 30% of the agricultural tariff linescontain these specific tariffs. On the other hand,between 1994 and 2005, the number of tariff peakson agricultural exports of developing countries todeveloped countries more than doubled,comprising 29% of total tariff peaks in 2005. Lastly,tariff escalation is extremely applied on processedproducts and more pronounced in commoditiessuch as meat, sugar, fruit, coffee, cocoa and hidesand skins, which are of export interest to manypoor countries.28
In the area of domestic support, progress inreducing subsidies has been limited. As alreadymentioned, due to the existence of the peculiar“boxes”, there has been a shift in the developed
19951996199719981999a
20002001200220032004
21 816.4121 506.6421 196.8720 887.1020 577.3320 267.5619 957.7919 648.0219 338.2519 028.48
15 773.2512 932.4716 756.5816 402.1017 303.37
(20 846.08)b
n.a.n.a.n.a.n.a.
72.360.179.178.584.1
(100.0)(>100)c
---
33 594.3341 145.3147 595.8742 826.8235 948.93
-----
4 310.389 323.354 999.694 600.433 058.70
-----
1 051.512 893.961 902.23
529.2878.22
-----
Year Monetary value of measures exempt from thereduction commitment
Monetary value of measures committed to reduce
Bound AMSceiling
Actual AMS Actual as apercentage of
bound
Greenbox
Subsidy on input ofproduction (S&D)
Subsidy oninvestment (S&D)
(1) (2) (1)/(2)
a The figure is from preliminary data.b Estimated by the author from the Farmer Assistance Fund (THB5 189.1 billion), BAAC (THB9 872.96 billion) and BOT(THB5 784.01). The number is still an overestimate.c Available data suggest that actual support might be much larger than the committed support. The proposed budget wasB5.2 billion from BOT, B6.18 billion from FAF and THB19.96 billion from BAAC.
Source: Department of Business Economics, Ministry of Commerce
TABLE 12. MONETARY VALUE OF DISTORTING AND NON-DISTORTING MEASURES 1995-
Period
Base period (1986-87 to1988-89)
1995-96
1996-97
1997-98
1998-99
1999-2000
2000-01
Product specificsupport (US$
billion)
-18.11
-26.37
-27.67
-25.38
-27.75
-25.50
-26.00
As a percentage ofthe value of output ofthe agricultural sector
-26.10
-34.36
-32.44
-29.52
-30.13
-27.24
-28.58
Non-productspecific support
(US$ billion)
0.87
1.44
1.58
1.84
1.86
2.07
2.11
As a percentage ofthe value of output ofthe agricultural sector
1.25
1.88
1.86
2.14
2.02
2.21
2.32
Source: Computed. WTO Agreement on Agriculture: The Implementation Experience of Developing Countries, FAOCorporate Document Repository, UNCTAD
TABLE 11. DOMESTIC SUPPORT TO INDIAN AGRICULTURE

15THE IMPLICATIONS OF DUMPING OF AGRICULTURAL PRODUCTS IN ASIA: ASIAN FARMERS’ UNTOLD MISERY
Unlike other Asian countries, South Korea’sbound tariff rate on all agricultural products is64.1%, which poses a significant barrier toagricultural trade. South Korea bound 91.7%of its tariff line items.25
South Korea agreed to lower tariffs on morethan 30 agricultural products including mixedfeeds, feed corn, wheat, vegetable oils andmeals, and fruits and nuts between 1995 and2004, and has fully phased in those tariffreductions. But duties remain very high onmany high-value agricultural and fisheryproducts. South Korea imposes tariff rates of30 % or higher on most fruits and nuts, manyfresh vegetables, starches, peanuts, peanutbutter, various vegetable oils, juices, jams, beer,and some dairy products. Products of interestto U.S. suppliers, such as table grapes, beef,canned peaches, canned fruit cocktail, apples,pears, and a variety of citrus fruits are imposedtariff rates of 40% or higher. In many instances
South Korea andthe WTO
Korea applies prohibitively high tariffs despitethe absence of domestic production.26
South Korea also established TRQs meantto provide minimum access to previously closedmarkets. In-quota tariff rates are zero or verylow, but the out-quota tariff rates are prohibitive.Korea also implements QRs through its importlicensing system – it continues to restrictimportation of value-added soybean and cornproducts. Lastly, like Japan and the Philippines,South Korea also received a 10-year exceptionto tariffication of rice imports, and insteadnegotiated an MAV.
In domestic support, Korea agreed to reduceits AMS by 13% by 2004. But the South Koreangovernment substantially increased its level ofdomestic support to the cattle industry in 1997and 1998, consequently raising the overall AMSlevel. In 1999, the issue was raised by the U.S.and Australia in the WTO dispute settlementproceedings. The WTO Appellate Body ruledagainst South Korea, concluding that SouthKorea had not been computing the current levelof domestic support in a manner compatiblewith the requirements of the AoA.
countries in their domestic subsidies from directlyprice-related subsidies to direct payments and other‘indirect’ subsidies, thereby effectively increasingtheir overall level of domestic support withoutdecreasing their profit margin.
According to the OECD, the level of support toOECD countries remains high, having changedonly a little since 1995. As a share of gross farmreceipts, support given to producers fell from anaverage of 37% in 1986-1988 to only an averageof 30% in 1995-1997, and since then hasremained in the same level. In absolute terms, ithas increased from USD243 in billion in 1986-1988to USD279 billion in 2004.29
The E.U. is the bigger user of Blue Boxsubsidies than the U.S. and has substantiallyincreased its usage since 1995. On the other hand,the U.S. is the bigger Green Box user and haspractically maintained the level of subsidies underthis exemption. (See Tables 14 and 15) Yearly,on the average, the E.U. has used USD21 billionin direct payments to producers while the U.S. haspaid almost USD50 billion to so-called ruraldevelopment such as grants and loans to agri-business and rural enterprises.
The E.U. Blue Box payments represent around10% of its value of production. It increased from1995 to 2002 and may have even gone throughthe 1992 ceiling.30 The OECD calculates thesupport given each product in 1992 and comparesthis with those under the Blue Box, which gives abetter idea how subsidies have been shifted tothe Blue Box. (See Table 16) The U.S. on the otherhand had moved its subsidies from the Amber Boxto the Green Box, and Green box subsidies havedominated U.S. subsidies since 1998.
The Common Agricultural Policy (CAP) of theE.U. as well as the U.S. Farm Bill reflect thedirections of both markets towards maintainingtheir subsidies. For instance, 90% of the CAPbudget is for price-based subsidies, but this isbeing reduced to 21% in order to increase directpayments to farmers to 68% of the CAP budget.Examples of direct payments are those madesupposedly to limit production (Blue Box) and arepaid on the basis of area grown and/or a fixednumber of livestock owned, and are thusconsidered not directly linked to production. In fact,the E.U. made early revisions in the CAP, i.e.introducing direct payments in 1992, in order to

16 THE IMPLICATIONS OF DUMPING OF AGRICULTURAL PRODUCTS IN ASIA: ASIAN FARMERS’ UNTOLD MISERY
Sour
ce: U
NC
TAD
, Tra
de A
naly
sis
and
Info
rmat
ion
Syst
em (T
RA
INS)
Dat
abas
e at
the
Wor
ld In
tegr
ated
Tra
de S
olut
ion
(WIT
S).
Not
e: B
ased
on
the
near
est y
ear f
or w
hich
tarif
f dat
a ar
e av
aila
ble.
TABL
E 13
. EFF
ECTI
VELY
APP
LIED
TAR
IFFS
IN D
EVEL
OPE
D A
ND
DEV
ELO
PIN
G C
OU
NTR
IES
BY S
ELEC
TED
PR
OD
UC
T G
RO
UP,
199
4 AN
D 2
005
(PER
CEN
T)
3.80
9.87
3.02
11.5
9
3.94
9.68
8.44
13.8
6
2.13
8.60
-53.
2
-51.
5
2.0
-21.
9
-58.
5
-54.
6
-47.
2
-54.
2
-64.
0
-54.
8
-33.
7
-50.
6
-2.9
-38.
9
-36.
6
-51.
9
-27.
2
-48.
2
-44.
1
-53.
4
3.32
13.1
5
4.88
11.2
0
3.25
13.6
5
8.90
23.5
5
2.98
13.3
6
4.47
14.7
1
2.83
14.0
4
5.18
16.8
3
11.1
9
31.9
6
2.83
14.3
1
1.29
5.85
2.98
12.6
2
1.14
5.13
4.33
6.92
1.03
5.10
2.12
4.88
2.48
12.1
2
2.39
4.38
9.32
7.33
0.88
4.03
-61.
1
-55.
5
-38.
9
12.7
-64.
9
-62.
4
-51.
3
-70.
6
-65.
4
-61.
8
-52.
6
-66.
8
-12.
4
-13.
7
-53.
9
-74.
0
-16.
7
-77.
1
-68.
9
-71.
8
Deve
lopi
ngco
untri
esDe
velo
ped
coun
tries
Deve
lopi
ngco
untri
esDe
velo
ped
coun
tries
Deve
lopi
ngco
untri
esDe
velo
ped
coun
tries
Deve
lopi
ngco
untri
esDe
velo
ped
coun
tries
Deve
lopi
ngco
untri
es
2005
Perc
enta
ge c
hang
e19
9420
05Pe
rcen
tage
cha
nge
Sim
ple
Ave
rage
Wei
ghte
d A
vera
ge
Expo
rtin
g R
egio
ns
5.43
18.8
3
5.09
19.9
2
5.49
18.7
6
9.35
26.0
7
4.56
17.8
5
5.73
19.9
6
3.11
18.9
8
6.21
20.1
3
11.5
9
26.7
4
3.81
18.4
7
2.54
9.14
5.19
15.5
5
2.28
8.52
4.94
11.9
5
1.64
8.06
Deve
lope
dco
untri
esDe
velo
ping
coun
tries
Deve
lope
dco
untri
es
1994
All
prod
ucts
Dev
elop
ed c
ount
ries
Dev
elop
ing
coun
tries
Agr
icul
ture
Dev
elop
ed c
ount
ries
Dev
elop
ing
coun
tries
Man
ufac
ture
s
Dev
elop
ed c
ount
ries
Dev
elop
ing
coun
tries
L
abou
r-in
tens
ive
man
ufac
ture
s
Dev
elop
ed c
ount
ries
Dev
elop
ing
coun
tries
O
ther
man
ufac
ture
s
Dev
elop
ed c
ount
ries
Dev
elop
ing
coun
tries

17THE IMPLICATIONS OF DUMPING OF AGRICULTURAL PRODUCTS IN ASIA: ASIAN FARMERS’ UNTOLD MISERY
TABLE 14.FIGURES AND GRAPHS OF THE DIFFERENT AGRICULTURAL SUPPORT MEASURES FOR THEEUROPEAN UNION, ICELAND, JAPAN, NORWAY, SLOVENIA, THE SLOVAK REPUBLIC AND THE UNITED STATES
Expenditures of domestic supports as classified underthe different boxes in the European Union
De minimisBlue BoxGreen BoxTotal AMS
1995825
208461877950030
1996747
215212213051009
1997544
204431816750194
1998379
205041916846683
1999308
197921993147886
Shares of domestic supports along the different boxes in the European Union
Blue BoxGreen BoxTotal AMSDe minimis
199523.020.855.3
0.9
199622.623.253.5
0.8
199722.920.356.2
0.6
199823.622.153.8
0.4
199922.522.754.5
0.4
Source: UNCTAD, Trade Analysis and Information System (TRAINS) Database at the WorldIntegrated Trade Solution (WITS).
Blue BoxGreen BoxTotal AMSDe minimisTotal
1995208461877950030
82590480.01
1996215212213051009
74795407.4
1997204431816750194
54489347.8
1998205041916846683
37986733.4
1999197921993147886
30887916.5
European Communities (million EUR)

18 THE IMPLICATIONS OF DUMPING OF AGRICULTURAL PRODUCTS IN ASIA: ASIAN FARMERS’ UNTOLD MISERY
TABLE 15. FIGURES AND GRAPHS OF THE DIFFERENT AGRICULTURAL SUPPORT MEASURES FOR THEEUROPEAN UNION, ICELAND, JAPAN, NORWAY, SLOVENIA, THE SLOVAK REPUBLIC AND THE UNITED STATES
Blue BoxGreen BoxTotal AMSDe minimisTotal
19957030
4603362141641
60918.08
19960
5181558981153
58865.86
19970
512526238
81258302
19980
4982010392
475064961.6
19990
4974916862
740574016
United States (million USD)
Expenditures of domestic supports as classified underthe different boxes in the United States
De minimisBlue BoxTotal AMSGreen Box
1995164170306214
46033
19961153
05898
51815
1997812
06238
51252
19984750
01039249820
19997405
01686249749
Shares of domestic supports along the different boxes in the United States
Blue BoxGreen BoxTotal AMSDe minimisTotal
199511.575.610.2
2.7100
19960.0
88.010.0
2.0100
19970.0
87.910.7
1.4100
19980.0
76.716.0
7.3100
19990.0
67.222.810.0100
Source: UNCTAD, Trade Analysis and Information System (TRAINS) Database atthe World Integrated Trade Solution (WITS).

19THE IMPLICATIONS OF DUMPING OF AGRICULTURAL PRODUCTS IN ASIA: ASIAN FARMERS’ UNTOLD MISERY
compensate for cuts in market price supports orsimply to continue supporting a sector.31
The U.S. on the other hand succeeded inincluding its Farm Bill counter-cyclical paymentsin the Blue Box, i.e. subsidies that are expandingwhen world prices fall and vice versa. Thesepayments are provided in 8 sectors, all consideredsensitive crops in the developing countries –cotton, wheat, corn, soybeans, rice, barley, oatsand sorghum- and given to producers based onfixed areas and yields in reference to pastproduction. These cover around USD9-10 billiona year of the Farm Bill budget.32
In the end, with the CAP, agriculture is still thesingle biggest expenditure of the E.U. despitepronouncements of declining price supports. Thelevel of support to producers has even reachedhistoric highs. Meanwhile, with the Farm Bill, theU.S. has increased support spending by 63 %.33
The Farm Bill now includes over USD135 billionin new subsidies over the next 10 years. It isestimated that the rice farmers in the U.S. receiveUSD75,000 per household from the governmentin the form of direct payments.34
On the other hand, from 1995 to 2000, onaverage USD6.2 billion was spent annually onexport subsidies, reaching USD11 billion in 2000for 25 subsidising countries. The E.U. accountedfor almost 90%.
Almost 35% of export subsidies are for dairyproducts and 23% for meat. Beef makes up almost60% of meat subsidies and producers of cerealsand sugar also receive a considerable amount.
Some countries pay export subsidies in orderto dispose of their surplus agricultural productionon world markets – a surplus production that isstimulated by domestic supports and high importtariffs. The E.U. is by far the largest provider of
these export subsidies. Meanwhile, the use ofexport credits, or loans provided to effectagricultural exportation, has been expanding inrecent years. In this connection, the U.S. is thelargest provider.35
Overall, according to the U.S. Department ofAgriculture, market distortions in agriculture are52% caused by tariffs, 13% by export subsidiesand 31% by domestic support. Whether or notsuch summary is accurate, one thing is clear: suchdistortions have had grave impact on Asianagriculture.
The primary outcome of market distortions hasbeen the practice of dumping. Subsidies and hightariff walls have resulted in artificially high farmproduction levels that allow producers to dumptheir surplus in other countries at less than theproduction cost. This has been made even morepossible in the ‘subsidy-shifting’ pulled off by theU.S. and the E.U.
Shifting subsidies from the Amber Box to theBlue Box and Green Box in reality does not lowerthe profit margin of the producer. In fact, it evenallows the producer to have artificially highproduction levels that in turn are so trade distortivethat they could send weaker agricultures into atailspin. Martin Khor of Third World Networkexplained this clearly.
According to Khor, it is not so important for theproducer whether he gets revenue over and abovehis production cost and makes a profit from ahigher price presumably brought about by pricesupport measures or from direct payments. Whatis important for him is to obtain the revenue andprofit, period. Whatever form of subsidy that helpshim make revenue and maintain or increaseprofitability is significant to his production andmarket.
TABLE 16. SUBSIDIES BY COMMODITIES IN 1992 AND FROM 1995 TO 1999 IN THE E.U. (MILLIONS IN EUR)
WheatCoarse grainsCereals Rice Oilseeds Beef and veal SheepmeatTotal
PSE in 199269817940
14921421
299514997
412437458
PSE less OS in 199260186844
12862363
258212927
355532289
1995
12672
238138761321
20486
1996
12910
243933221007
21521
1997
1182240
236930811171
20443
1998
1163781
226429901536
20504
1999
11696124
131829301734
19792
Blue Box payments
Source: UNCTAD
PSE - Producer Support EquivalentOS - Other Support

20 THE IMPLICATIONS OF DUMPING OF AGRICULTURAL PRODUCTS IN ASIA: ASIAN FARMERS’ UNTOLD MISERY
the intervention price. Secondly, this has been madepossible through high tariff barriers imposed on sugarexporters to the E.U. particularly former E.U. colonieswho have the preferential sugar quotas. Lastly, highinternal prices are maintained by exporting thesurplus production of sugar with some form ofsubsidy. Export refunds total around 1.5 billion EUR(the difference between the internal and globalprices), which allows inefficient farms to sell at pricesbelow the internal price and cost of production. Likewith wheat, it is the big farmers, sugar beetprocessing companies and companies getting theexport refunds that benefit from protectionism.37
On the other hand, the U.S. guarantees sugarprices, restricts imports with a quota ceiling of 1.1million tons divided amongst 40 countries and witha tariff on imports above the quota at a little below100 %. This regime affords refiners and growersUSD2 billion a year in higher prices at the expenseof the sugar users.38
Meanwhile, in a study conducted by theInstitute for Agriculture and Trade Policy (IATP), ithas been revealed that the U.S.-based global foodcompanies continue rampant dumping. In 2003,these companies sold super below the cost ofproduction: wheat at an average price of 28%below production cost; soybeans at 10%; corn,10%; and rice, 26%. This has been made possiblethrough the U.S. Farm Bill, which at the behest ofagribusiness, abandoned interventionmechanisms and sent agricultural prices into afreefall. To arrest the downfall of U.S. agriculture,Congress introduced “counter-cyclical payments”.
Before deregulation, the U.S. market had onestructural flaw: there were millions of producersand only few commodity buyers and processors.Intervention therefore set a floor price thatcommodity buyers had to pay farmers. Under theFarm Bill, farms have become expensive butcontradictions between farmers and commoditybuyers and processors have intensified.
More significantly, the U.S. Farm Billinstitutionalised dumping on world markets.Dumping of wheat increased from 27% annuallyin 1990-1996 to 37% per year post-1996; soybeanfrom 2% to 11.8%; maize from an annual averageof 6.8% to 19.2%; cotton, 29.4% to 48.4%; andrice from 13.5 to 19.2 %. Clearly, it is the largestcommodity traders, such as Archer DanielsMidland, Cargill and Bunge Ltd. that dominatefinancing trades, processing and shipping thatbenefit immensely from dumping. They arevertically integrated, buy cheaply and control thevalue-added stages of production.39
Under the Amber Box (price support):
1.The farmer receives a price support.2.Domestic price is pulled up a lot higherthan the world price because of pricesupport.3.This allows the farmer’s revenue to beover production cost, thus resulting in profit.4.Farm is viable even if production cost ishigher than world price.5.If bulk of production is exported, which isusually the case; this is made possiblethrough an export subsidy equal to the worldprice.
Under the Blue Box and Green Box (directpayments):
1.Domestic price is the same or even lowerthan the world price.2.The farmer gets a price that is lower thanthe production cost.3.But then, he receives a high subsidy asdirect payment.4.He thus gets the same revenue and profitas the farmer under the Amber Box.5.Farm remains viable even if it is alreadyinefficient.6.The direct payment allows the farmer tosell at price below the world price and exportat a competitive price that is artificially lowbecause of the subsidy. In effect the farmerdoes not even need an export subsidyanymore in order to sell abroad.
The U.S. is a heavy dumper of wheat,soybeans, maize, cotton and rice while the E.U.dumps sugar, beef and together with the U.K.,wheat. The consequences would be obvious sincethese are agricultural and food products that Asiancountries produce sufficiently for domesticconsumption or export to earn revenues.
In the study done by the Action Aid, it has beenrevealed that in 2000 and 2001 the average worldprice of wheat was only 73 GBP per ton but U.K.’saverage cost of production was about 113-124 GBPand the U.K. price was 70-78 GBP. Thus wheatsold in the global market was about 35-40% belowproduction cost. The biggest 28% of U.K. arablefarms got 78% of the direct payments, with thelargest farms and richest people getting the bulk.36
E.U. sugar prices, on the other hand, aremaintained through three complementarymechanisms: intervention price, import tariffs andexport refunds. Since 1981, however, the E.U. hasnot used the intervention price much since E.U.internal sugar prices have always been higher than

21THE IMPLICATIONS OF DUMPING OF AGRICULTURAL PRODUCTS IN ASIA: ASIAN FARMERS’ UNTOLD MISERY
The Myriad of CatastrophesMarket distortions have had disastrous
consequences on the domestic production andexport opportunities of developing countries. Thesmall-scale farmers who make up around 80% ofthe producers in Asia for instance suffer the impactof dumping the most. They suffer in two ways:shrinking production levels and lost exportopportunities – both result in untold misery not onlyfor the peasantry but also for the general public.
To illustrate, Indonesia is not a wheat producingcountry. But since the Indonesian government hasa long-term policy to veer away from the country’sheavy reliance on rice, it has encouraged theconsumption of wheat-based foods such as noodles,bread, etc. Since the 1970s, Indonesia has importedan increasing quantity of wheat flour and nationalcompanies have increased wheat processing. Withthe increasing demand coupled with tradeliberalisation, wheat imports leapt from 40,000 tonsin 1998-1999 to 220,000 tons in 1999-2000.40
This has sent local rice producers and smalland medium-scale domestic wheat millers tobankruptcy. Cheap wheat imports are depressingdomestic prices and marginalizing rice farmers.In 1999, for instance, imported flour was onlyUSD220 per ton as compared with the local priceof USD280 per ton. The Indonesian Anti-DumpingCommittee (KADI) found Australia, the E.U. andthe United Arab Emirates guilty of dumping andlinked this with the displacement of local flour. Butbusiness lobbied the Indonesian government notto increase duties.41
On the other hand, the price of Indonesiandomestic sugar has always been higher than theworld price. The Indonesian governmentattempted to control this with BULOG’s monopolyover sugar and other important food commodities.But this came to an end in 1998 following the IMFagreement related to the Asian financial crashwherein the IMF required liberalisation of sugarimports and deregulation of sugar production.Although sugar was exempted from zero tariffunder the AoA, the IMF agreement imposed zerotariffs and 48% market access up to 2001. Sugarimports increased from 975,000 tons in 1996 to1.95 million in 1999 and eventually imported sugaraccounted for 60% of national consumption.
The traders such as the distributors andretailers, mostly foreign, have gained immenselyfrom import liberalisation since through monopolypricing they can import sugar cheaply and sellexpensively in the local market. Smuggling andhoarding of sugar stock have also become
rampant due to this traders’ regime. This has putthe farmers and sugar factories to thedisadvantage, recently prompting the Indonesiangovernment to reinstate BULOG’s role in sugarimportation. Unfortunately, however, withoutnotice, BULOG assigned Cargill to do the task.42
Philippine meat importation, on the other hand,has dramatically increased under the AoA, withbeef imports growing three times faster thandomestic production. In 2000, beef importsaccounted for 19% of total supply.
The landed costs of meat imports are a lot lowerthan the price of domestically produced meat.Because of high production and marketing costson one hand and depressed farmgate prices onthe other hand, productivity and profitability oflivestock and poultry raising in the Philippines ismarginal – 56 centavos (10 cents) per kilo forswine, PHP14.02 (27 cents) per kilo for chicken,and PHP 1,590 per head for cattle raised in sixmonths or roughly PHP 53 (USD1) per day. In themain, raisers’ productivity and profitability isdictated by the traders-integrators who monopoliseinputs and trade. With the influx of cheap importedmeat, the traders bid even lower than usual andpit one province against another to get the lowestprice per kilo liveweight, making local productionpractically pointless.43
Because of the subsidy regime, the E.U. hasbrought down meat prices below production cost.The landed costs of beef in 2000 and 2001 fromthe E.U. were a lot lower than the prevailing policyprice or what may be considered the world price.(See Table 17)
TABLE 17. PHILIPPINE LANDED COST VS. POLICYPRICE (IN US DOLLARS PER METRIC TON)
2001
FranceGermanyItalyNetherlandsSpain
2000
BelgiumDenmarkUK
Landed Cost811.18
1,063.79 4,855.77 1,028.32 913.95
Landed Cost 1,260.10 1,264.07 1,053.98
Policy Price3,560.00
Policy Price 3,708.00
Source: Impact of EU Policies: the Case of PhilippineAgriculture, a speech delivered by Rosario BellaGuzman at ASEM4people summit, Copenhagen,Denmark, September 2002

22 THE IMPLICATIONS OF DUMPING OF AGRICULTURAL PRODUCTS IN ASIA: ASIAN FARMERS’ UNTOLD MISERY
Dumping has had direct correlation withproduction shortfalls as well as bankruptcies indeveloping countries. An FAO study shows thatdumping has caused high incidences of importsurges in 1984-2000 for 8 key products in 28developing countries, with the incidence risingafter 1994. Examples are Philippines, 72 casesof import surges; Kenya, 45 cases; Bangladesh,43; Benin, 43;, Botswana, 43; Burkina Faso, 50;Cote d’Ivoire, 41; Dominican Republic, 28; Haiti,40; Honduras, 49; Jamaica, 32; Malawi, 50;Mauritius, 27; Morocco, 38; Peru, 43; Uganda, 41;Tanzania, 50; and Zambia, 41. Import surges wereoften accompanied by production shortfalls in thesame products where there were import surges.The rise in imports caused by dumping led todeclines in production output and farmers’incomes. The FAO put it mildly, “Given the largenumber of cases of import surges and increasingreports of the phenomenon from around the world,this could be potentially a serious problem.”44
Based on the foregoing, it is obvious that theimmediate impact of dumping on Asian agriculture,whose production is backward, backyard, lowtechnology and controlled by transnationalcorporations (TNCs) and whose trade has beenimposed with zero tariffs and zero subsidy, is thebankruptcy of small-scale farmers. Withoutgovernment safety net, Asian agriculture hasshrunk and fluctuated over the years, and thesituation has resulted in farm closures andincreased migration.
The production level of wheat for instance hasbeen erratic for countries such as Bangladesh,India and Thailand, and declining for South Koreaand Mongolia. Paddy rice production has beenfluctuating for most Asian countries; and maizedeclining for South Korea and Thailand. Yet,production costs for these products have gone upsteeply, especially for rice and maize for Indonesia.In addition, except for China, the E.U. and U.S.still have the highest production levels, and toillustrate the imbalance, the U.S. has the lowestproduction cost. (See Tables 18, 19, 20, 21)
Backwardness of production is one of theobvious reasons for the rapid decline of Asianagriculture under trade liberalisation. But it is alsoworth noting that existing exploitative relations inAsian agriculture contribute to the overall impactof trade liberalisation, and vice versa, tradeliberalisation has intensified these exploitativerelations. Because of the competition killed bydumping, traders and middlemen who dominatethe agricultural landscape in most of the Asian
countries stop purchasing the farmers’ produce,and further depress the farmgate prices. But themarket distortion is barely beneficial to theconsumers, as some would argue that cheapimports would translate to cheaper commodities.Trading cartels proliferate in cahoots with foreignagribusiness corporations and their commonpractice is monopoly pricing and speculation.
Governments, on the other hand, havederegulated prices and withdrawn price supportmechanisms and in the process allowed tradingmonopolies and cartels and TNCs to haveabsolute control over agricultural and foodcommodities and to manipulate prices and supply.Governments have also privatised importation andits allocation as well as marketing andstockholding to landlords, traders and TNCs. Thishas increased the already high production costssince cartels also control the trade of importedseeds and fertilisers.
The second impact of dumping – losing exportopportunities – is basically brought about bydeclining world prices for most of the commodities.The developing countries’ exporters are blockedin the developed countries through high tariffs andsubsidies. They are also blocked in third countriessince the subsidising countries are exporting tothese third countries at artificially low prices.45
Developing countries produce two kinds ofagricultural commodities for export: products thatare also produced by the developed countries andproducts that do no compete with the developedcountries. With the first type of commodities, withcotton and sugar as examples, the subsidy regimein the E.U. and the U.S., has depressed worldprices and has elbowed out developing countriesfrom gaining global export revenues. As for thesecond type, with coffee as example, these areusually at the lower end of the value chain, lackingthe capacity to climb up the levels of processingand manufacturing. They are also over-supplied,which places downward pressures on prices,especially since too many developing countriesare being advised by international agencies toexport these commodities. Lastly, TNCs buy theseproducts and since these TNCs are monopsonies,they dictate prices.46
As already mentioned, agricultural exportscoming from poor countries have declined and lostsignificance over the years, and this may begleaned from their low shares in exports of themost market-dynamic agricultural commodities.(See Table 22) Except for the increasedagricultural output and total food production of

23THE IMPLICATIONS OF DUMPING OF AGRICULTURAL PRODUCTS IN ASIA: ASIAN FARMERS’ UNTOLD MISERY
Wheat
Bangladesh
China
India
Korea,Republic of
Mongolia
Thailand
Rice, Paddy
Bangladesh
China
India
Indonesia
Korea,Republic of
Philippines
Thailand
Maize
Bangladesh
China
India
Indonesia
Korea,Republic of
Philippines
Thailand
1995
1244990
102211429
65767400
10262
256700
639
26399000
187297968
115440000
49744140
6387301
10540640
22015500
2000
112361571
8245902
8245902
74465
4161330
4155000
1996
1369130
110569193
62097400
10923
216282
710
28182000
197032897
122500000
51101504
7121421
11283570
22331600
2675
127865412
9307423
9307423
72168
4345010
4532610
1997
1454199
123290085
69350200
7433
237700
750
28152000
202771843
123700000
49337056
7312096
11268000
23580000
3000
104647617
8770851
8770851
86763
4332420
3831647
1998
1802815
109726066
66345000
4781
191836
750
29710000
200571557
129055000
49236700
6779290
8554000
23450000
2660
133197612
10169488
10169488
80203
3823184
4617455
1999
1908000
113880088
71287504
5626
166700
750
34430000
200403308
134495904
50866388
7032757
11786600
24172000
4000
128287195
9204036
9204036
79333
4584600
4286200
2000
1840000
99636127
76368896
2339
138722
800
37627500
189814060
127400000
51898000
7196582
12389400
25844000
10000
106178315
9677000
9677000
64205
4511104
4462000
2001
1673000
93873234
69680896
2841
138700
800
36269000
179304887
139900000
50460800
7406517
12954900
26523000
10000
114253995
9347200
9347200
57000
4525010
4466000
2002
1606000
90290262
72766304
5834
149336
800
37593000
176342195
116500000
51489696
6687225
13270653
26057000
10000
121496915
9654105
9654105
72223
4319262
4230000
2003
1507000
86488264
65100000
10011
180000
800
39090000
162304280
130500000
52137600
6015000
13499900
27241000
10000
115997909
10886442
10886442
70242
4615630
4160000
2004
1253000
91330265
72060000
12000
150000
800
37910000
177434000
129000000
54060816
6800000
14496800
26948000
10000
132160000
11354900
11354900
70000
5413390
4094000
TABLE 18. PRODUCTION OF SELECTED AGRICULTURAL PRODUCTS (IN METRIC TONS)
Source: WTO
some countries such as Brazil, China andThailand, developing countries are losing out inagricultural trade.47
Exporting developing countries face steep andin many cases catastrophic declines in the pricesof their commodities, especially cotton (47%),coffee (64%), rice (61%), cocoa (71%), and sugar(77%).48 While there have been rebounds in theabsolute prices of several agriculturalcommodities, in real terms prices have declinedby an annual average of 2% since 2002. From1997 to 2001 in fact, coffee prices fell almost 70%,plummeting below the cost of production in manycountries and precipitating food emergencies in
several countries in Africa and Central America.49
As a result, chronic trade deficits experiencedin several Asian countries owing to continuingcolonial trade patterns have been exacerbated.Except for Thailand, most of the East, Southeastand South Asian countries continue to be drainedof precious foreign exchange. (See Table 23)
The lack of competitive advantage, whether theproduct is heavily subsidised by competingdeveloped countries or of low value-chain due tocolonial and imbalanced agreements, hashindered the growth of the developing countries’agricultural exports for many years. Still,developing countries are dictated to be export-

24 THE IMPLICATIONS OF DUMPING OF AGRICULTURAL PRODUCTS IN ASIA: ASIAN FARMERS’ UNTOLD MISERY
WheatBangladeshChinaIndiaKorea, Republic ofRice, PaddyBangladeshChinaIndiaIndonesiaKorea, Republic ofPhilippinesThailandMaizeBangladeshChinaIndiaIndonesiaKorea, Republic ofPhilippinesThailand
1995
750014454713
502425
707015374890
468534315000
72404132
765111923903
39408742525
62803546
1996
742015785790
502425
548016015474
481896309000
81305372
756911373893
477614468975
61604420
1997
734014055518
502425
534014124336
541281272667
79205472
748710714112
499048483075
59704190
1998
805013465945
560654
638013664940
939861284170
81106629
821210924628
868854491650
56503930
1999
850011967373
588757
648011986224
1214560257167
80605579
8671942
50961073870
51850053404090
2000
8060979
6649612211
618010805960
1069990234500
81204808
8222847
4981930320549700
63703980
2001
819010506930
636675
603012565400
1152740235607
81504484
8354967
55901230540566775
65003950
2002
842010566956
636675
660011665643
1233432233333
88204425
8589901
56701316678580000
64204142
TABLE 19. PRODUCTION PRICE OF SELECTED AGRICULTURAL COMMODITIES (LC)
Source: WTO
WheatE.U.U.S.Rice, PaddyE.U.U.S.MaizeE.U.U.S.
1995
87831830
277599632
2108903
7887000
30368211
187968992
1996
99925586
335743632
2667330
7793000
35575549
234527008
1997
94879861
336536265
2719996
8300697
39566953
233867008
1998
103927036
349444600
2647898
8364200
36517460
247882000
1999
97485913
335552820
2704106
9343954
37576912
239548992
2000
105691044
342808564
2455387
8657819
38915361
251854000
2001
92094146
325480116
2548034
9764495
41025470
241484864
2002
104434000
298788144
2617848
9568996
40544466
228805088
2003
91013404
348896582
2668513
9033610
33757067
256904560
2004
389067930
10469730
299917120
TABLE 20.PRODUCTION OF SELECTED AGRICULTURAL PRODUCTS
Source: WTO
WheatRice, PaddyMaize
1995167202128
1996158220107
1997124214
96
199897
19676
199991
13172
200096
12473
2001102
9478
2002132
8593
TABLE 21. U.S. PRODUCTION PRICE OF SELECTED AGRICULTURAL COMMODITIES
Source: WTO

25THE IMPLICATIONS OF DUMPING OF AGRICULTURAL PRODUCTS IN ASIA: ASIAN FARMERS’ UNTOLD MISERY
TABLE 22. SHARES OF MAIN EXPORTERS AND OF DEVELOPING ECONOMIES IN WORLD EXPORTS OFTHE MOST MARKET-DYNAMIC AGRICULTURAL COMMODITIES, (a) 1998
Rank
1
2
3
4
5
6
7
8
9
10
11
12
13
14
15
16
17
18
19
20
Rankamong allproducts
6
12
17
23
27
31
33
67
71
72
81
84
97
101
102
106
109
110
122
123
SITCcode
261
111
048
098
062
122
073
036
245
034
269
037
112
054
091
292
431
058
014
024
Product group (b)
Silk
Non-alcoholic beverages
Cereal preparations
Preserved food
Sugar preparations
Manufactured tobacco
Chocolate
Fresh crustaceans
Fuel wood and charcoal
Fresh fish
Waste of textile fabrics
Fish preparations
Alcoholic beverages
Fresh vegetables
Margarine and shortening
Crude vegetable materials
Processed animal andvegetable fats
Fruit preparations
Meat preparations
Cheese and curd
Share ofdevelopingcountries
87
22
14
17
25
24
7
70
41
37
16
58
10
31
25
25
48
37
23
2
China (70)Germany (9)
France (19)Canada (7)United States (7)
Italy (11)Germany (10)
United States (16)France (12)Germany (8)
United Kingdom (10)Germany (9)Spain (9)
United States (29)Netherlands (16)
Germany (16)Belgium/Luxembourg (13)France (11)
Thailand (12)Indonesia (7)Canada (6)
Latvia (15)Indonesia (10)China (10)
Norway (13)United States (7)Denmark (5)
United States (22)Germany (15)
Thailand (20)China (10)Denmark (5)
France (28)United Kingdom (16)
Netherlands (15)Spain (12)United States (9)
Germany (16)Netherlands (11)
Netherlands (31)United States (7)Germany (5)
Malaysia (25)Netherlands (12)Germany (10)
Brazil (11)United States (9)Germany (7)
Denmark (10)Belgium/Luxembourg (10)
France (19)Netherlands (18)
India (3)
Belgium/Luxembourg (7)China (7)
France (10)United Kingdom (8)
China (5)Netherlands (6)
United States (7)Belgium/Luxembourg (6)
United Kingdom (10)
United Kingdom (8)Netherlands (7)
India (6)Ecuador (6)
France (6)Poland (5)
China (5)Taiwan Prov. Of China (5)Chile (5)
United Kingdom (8)Netherlands (8)
Spain (4)Germany (4)
Italy (10)Spain (6)
Mexico (9)Italy (7)
Belgium/Luxembourg (11)United States (7)
Italy (5)Denmark (5)
Indonesia (10)United States (6)
Belgium/Luxembourg (6)Italy (6)
United States (9)France (9)
Germany (15)Denmark (9)
Main exporting countries (Share)
Source: See table 1.1.Note: See UNCTAD, Handbook of Statistics (table 4.4) for the main exporters of these products within the groups of developing countries.a Products groups ranked by growth in export value, 1980-1998.b Bold characters indicate high-value products and/or items with an income elasticity of demand greater than one.

26 THE IMPLICATIONS OF DUMPING OF AGRICULTURAL PRODUCTS IN ASIA: ASIAN FARMERS’ UNTOLD MISERY
oriented and focus on export winners, sometimeseven at the expense of food production, in orderto pay for the increasing imports. But accordingto the FAO, as many as 43 developing countriesdepend on only one commodity for more than 20%of their total exports revenues.50
One of the serious implications of the
TAB
LE 2
3. A
GR
ICU
LTU
RA
L TR
AD
E, U
S $
AT
CU
RR
EN
T P
RIC
ES
(MIL
LIO
NS
)
Sour
ce: W
TO
2000 42
619
2316
384
1954
464
0139
0077
6457
2742
9812
837
148
106
2026
3104
1224
244
7371
408
6911
5
2001 46
418
5216
626
2012
562
6548
2370
2453
5039
4812
504
112
117
1958
3087
1205
748
2670
017
6840
0
2002 69
518
3818
796
2184
870
2550
6990
2052
6939
2413
543 84
1980
3023
1202
150
8568
757
7151
5
2003 41
421
0822
158
3048
279
3564
2699
4254
3843
2414
421 77 120
2385
3158
1508
157
1976
244
7727
3
2004 57
123
6424
121
4227
986
9472
6512
366
6638
4984
1603
6
2569
3441
1626
664
3379
567
8811
2
Cou
ntry
Ban
glad
esh
Ban
glad
esh
Chi
naC
hina
Indi
aIn
dia
Indo
nesi
aIn
done
sia
Kor
ea, R
epub
lic o
fK
orea
, Rep
ublic
of
Mon
golia
Mon
golia
Phi
lippi
nes
Phi
lippi
nes
Thai
land
Thai
land
Uni
ted
Stat
esU
nite
d St
ates
Flow
Exp
orts
Impo
rtsE
xpor
tsIm
ports
Exp
orts
Impo
rtsE
xpor
tsIm
ports
Exp
orts
Impo
rtsE
xpor
tsIm
ports
Exp
orts
Impo
rtsE
xpor
tsIm
ports
Exp
orts
Impo
rts
1993 34
073
111
852
6224
4167
1509
5515
3309
3146
1033
9
1916
1887
9587
4089
6180
644
197
1994 38
778
514
806
1017
343
9929
4470
4742
8536
6711
731
2039
2332
1158
246
3467
327
4872
6
1995 44
611
2414
997
1609
963
2230
0381
9761
0344
4814
727
2457
2979
1391
155
7580
521
5311
9
1996 43
213
2814
944
1530
070
4030
3484
7769
7644
0215
685
127 67
2292
3502
1401
756
0881
979
5692
9
1997 44
215
0515
732
1463
368
6335
6285
4856
5644
9514
013
129 81
2299
3557
1302
149
6077
306
6186
8
1998 45
214
4214
314
1261
062
3546
3277
0647
0440
2293
06 125 83
2201
3199
1152
337
2469
883
6243
1
1999 38
622
1514
209
1385
358
3548
6275
4454
7642
2811
084
132 63
1778
3219
1176
239
6265
941
6613
8
combination of shrinking production andlosing exports is the developingcountries’ increasing dependence onfood imports. National economies haveincreasingly become net importers offood and agricultural products sincethey have purchased increasingly fromcommercial sources and lost access tofood and agricultural products atconcessional prices due to the phase-out of public stockholding. According tothe FAO, which surveyed 14 developingcountries, the average annual value offood imports in 1995-1998 exceededthe 1990-1994 level in all 14 countries,ranging from 30% in Senegal to 168%in India. Moreover, the food import billmore than doubled for India and Braziland increased by 50-100% forBangladesh, Morocco, Pakistan, Peruand Thailand.51
Prior to the AoA, food security forthe developing countries was achievedthrough local production since only 10%of global food production was traded.But due to aggressive tradeliberalisation despite the lack of genuineagricultural development, from a foodsurplus of USD1 billion in the 1980s,developing countries currently incurUSD11 billion deficit and this isexpected to grow to USD50 billion in2030.52
The rising dependence on foodimports is happening in the midst ofdeclining export revenues, which posesserious threats to food security. Thus,the usual argument that poor countriesshould focus on exporting to raiseforeign exchange earnings to enablethem to buy the food they need fromworld markets is not happening. On thecontrary, poor countries are fastbecoming net importers not only of foodbut also of other commodities as well,leading to unprecedented nationalbankruptcies.
In reality, the AoA has eroded traditional Asianagriculture. The shift from subsistence farming toa market and wage economy through tradeliberalisation has marginalised the majority – thefarmers – and left the people less able to affordfood due to declining incomes and loss oflivelihood. Withdrawal of government support

27THE IMPLICATIONS OF DUMPING OF AGRICULTURAL PRODUCTS IN ASIA: ASIAN FARMERS’ UNTOLD MISERY
renders the final blow to the farmers andconsumers, who after having been attacked bydumping are without subsidies and price andproduction support mechanisms to continueoperating the supply-consumption network.
Because of the imbalances in subsidies andAMS, governments have lost the flexibility tobalance out between tariff levels on certainproducts and ensuring that sensitive areas suchas food deficits continue to receive support. Inaddition, governments, through various loanconditionalities by the World Bank and the AsianDevelopment Bank, are made to privatise andderegulate their functions in agriculture in tune withtrade liberalisation introduced by the AoA.
Third World governments had traditionallyplayed a significant role in food distribution byintervening in marketing, subsidising prices thatbenefited both farmers and consumers. This wouldtypically be rice in Asia, but was clipped under theSAPs and made illegal under the WTO.
Depressed global prices, on the other hand,have not benefited importing consumers. Publictrading is being cut and transparency in the marketis being reduced as a result. Now the major grainholders for instance are the trading companiesthemselves, which can control supply and priceinformation and gain immensely from speculationand monopoly pricing. This goes against publicinterest of predicting food shortages and pricefluctuations for the sake of producers andconsumers.
In the end, it is the TNCs that benefit immenselyfrom agricultural trade liberalisation. Subsidy andtariff regimes that rich countries have continuedusing may have cushioned their local producersand processors, but in the end the gainers in thewhole process are the TNCs that conduct tradeand enjoy massive price advantages overproducers and processors not only in their homecountries but also in poor countries. Since theWTO, these TNCs have tremendously increasedtheir scopes and sizes, increasing their exportsdespite inefficient farms, dominated the market,and in the process restricted poor countries fromimplementing national policies of food self-sufficiency.
The AoA, having institutionalised dumping, hasonly frustrated the hopes of developing countriesfor wider market access. On the other hand,continued protectionism on the part of the richcountries has had damaging effects on localcommunities and rural producers in poor countries.The reality is market-oriented agricultural trading
system and industrial and commercial agriculturehas eroded the production system of thesubsistence farmers, threatened food security, andincreased poverty and hunger, all for the benefitof huge transnational agribusinesses of thedeveloped countries.
The buzzword amongst NGOs nowadays,especially with the impasse in the WTOnegotiations, is taking advantage of this ‘policyspace’ to introduce reforms and correct theimbalances in the AoA. But obviously after morethan a decade, this framework of how global tradeshould be analysed is not working. The issue isnot simply an ‘unleveled playing field’ or‘imbalanced agreement’ that can be resolved byintroducing concessions and reforms. The mainissue of colonial trade is that the playersthemselves are grossly uneven.
Paradigms of trade and agriculture are not thesame for all countries. In many backward andlargely agrarian countries, agriculture ispredominantly subsistence and household. Theircapacity is small-scale, productivity is low, andproduction is inefficient. The WTO exposes thisto the attack of the international market andcommercial agriculture, thus, distorts theessentially non-commercial relations insubsistence agriculture. This is the backdropunder which the AoA has been imposed.
The other basic issue, which should beobvious by now after decades of globalisation, isthe immense role and benefit of the corporationin global trade. The dominant world economicorder is in longest recession and most intensecrisis and the role of the WTO has been to passon the crisis to the Third World throughglobalisation, from which it is the corporation thatbenefits immensely.
Following these frameworks of analysis, theimpasse must be taken as an opportunity toexpose the undemocratic character of the WTOand the real corporate interests behind theagreements in order to mobilise the greatestnumber of sectors around the rejection anddelegitimisation of the WTO and whateverundemocratic agreements that may follow.

28 THE IMPLICATIONS OF DUMPING OF AGRICULTURAL PRODUCTS IN ASIA: ASIAN FARMERS’ UNTOLD MISERY
1 Khor, Martin. “The WTO Agriculture Agreement:Features, Effects, Negotiations, and SuggestedChanges” TWN Trade and Development Series19, Third World Network, 2003
2 Ibid.
3 Globalization and its Impact on Food Security, ADiscussion on the WTO-Agreement on Agriculture,Speech delivered by Rosario Bella Guzman inConsumers’ Conference on Food Security, Beijing,China, October 9, 2001
4 Khor, op.cit.
5 Ibid.
6 Globalization and its Impact on Food Security,op.cit.
7 Guzman, Rosario Bella. “The GATT Agreementon Agriculture: The Final Blow to PhilippineFarms?” The Impact of the WTO Agreement onAgriculture, IBON Books, ed. Antonio Tujan Jr.,2000
8 Ibid.
9 The AoA and the Road to Hong Kong, aPowerpoint presentation by Rosario Bella Guzmanon the Women Workshop sponsored by thePesticide Action Network, Penang, 2005
10 Ibid.
11 WTO in 2006 The Finishing Stretch? IBONSpecial Release, 31 March 2006
12 Ibid.
13 Press Release by the third World Network,Geneva, July 26, 2006
14 WTO Agreement on Agriculture: TheImplementation Experience of DevelopingCountries, FAO Corporate Document Repository,UNCTAD
15 Ibid.
16 Guzman, Rosario Bella. “The GATT Agreementon Agriculture: The Final Blow to PhilippineFarms?” The Impact of the WTO Agreement onAgriculture, IBON Books, ed. Antonio Tujan Jr.,2000
17 Ibid.
18 WTO Agreement on Agriculture: TheImplementation Experience of DevelopingCountries, Thailand, FAO Corporate DocumentRepository, UNCTAD
19 Ibid.
20 WTO Agreement on Agriculture: TheImplementation Experience of DevelopingCountries, India, FAO Corporate DocumentRepository, UNCTAD
21 Hossain, Mohabub and Uttam Kumar Deb.Trade Liberalization and the Crop Sector inBangladesh, CPD Occasional Paper Series,Paper 23, Center for Policy Dialog
22 WTO Agreement on Agriculture: TheImplementation Experience of DevelopingCountries, Indonesia, FAO Corporate DocumentRepository, UNCTAD
23 Tujan, Antonio Jr. “The Impact of the WTO onFood Security in the Philippines: Case Study:Philippine Sugar Farm Sector” The Impact of theWTO Agreement on Agriculture, IBON Books, ed.Antonio Tujan Jr., 2000
24 WTO Agreement on Agriculture: TheImplementation Experience of DevelopingCountries, India, FAO Corporate DocumentRepository, UNCTAD
25 Korea Trade Summary, UNCTAD website
26 Ibid.
27 Peters, Ralf. “Roadblock to Reform: ThePersistence of Agricultural Export Subsidies”Policy Issues in International Trade andCommodities Study Series No. 32, UNCTAD 2006
28 Ibid.
Notes

29THE IMPLICATIONS OF DUMPING OF AGRICULTURAL PRODUCTS IN ASIA: ASIAN FARMERS’ UNTOLD MISERY
29 “Export Opportunities for Developing Countries”Changes and Trends in the External Environmentfor Development, UNCTAD 2006
30 Definitions of the Blue Box Domestic SupportMeasures, UNCTAD 2006
31 Farmgate, The Developmental Impact ofAgricultural Subsidies, ActionAid, August 2002
32 WTO Agriculture Agreement ReviewNegotiations: Entrenching Unjust Trade,Undermining Food Sovereignty, IBON SpecialRelease 15 May 2004
33 Impact of EU Policies: the Case of PhilippineAgriculture, A Speech delivered by Rosario BellaGuzman at ASEM4people summit, Copenhagen,Denmark, September 2002
34 Hossain, Mohabub and Uttam Kumar Deb.Trade Liberalization and the Crop Sector inBangladesh, CPD Occasional Paper Series,Paper 23, Center for Policy Dialog
35 Peters, Ralf. “Roadblock to Reform: ThePersistence of Agricultural Export Subsidies”Policy Issues in International Trade andCommodities Study Series No. 32, UNCTAD 2006
36 Farmgate, The Developmental Impact ofAgricultural Subsidies, ActionAid, August 2002
37 Ibid.
38 Dumping on the World, OXFAM Report, 2004
39 WTO Agreement on Agriculture: A Decade ofDumping, United States Dumping on AgriculturalMarkets, Publication No. 1, A series assessing theWorld Trade organization’s first 10 years, 1995-2005, Institute for Agriculture and Trade Policy
40 Farmgate, The Developmental Impact ofAgricultural Subsidies, ActionAid, August 2002
41 Ibid.
42 Nightmare in a Spoonful of Sugar, A study onthe Impact of Liberalization of the Sugar Industryon Consumers in Indonesia, Yayasan LambagaKonsumen Indonesia (YLKI), ConsumersInternational, May 2005
43 Impact of EU Policies: the Case of PhilippineAgriculture, A Speech delivered by Rosario BellaGuzman at ASEM4people summit, Copenhagen,Denmark, September 2002
44 Khor, Martin. The Commodities Crisis and theGlobal Trade in Agriculture: Problems andProposals, Third World Network, 2005
45 Ibid.
46 Ibid.
47 WTO Agreement on Agriculture: TheImplementation Experience of DevelopingCountries, FAO
48 Khor, Martin. The Commodities Crisis and theGlobal Trade in Agriculture: Problems andProposals, Third World Network, 2005
49 Raja, Kanaga. “Decline in Commodity PricesThreatens Food Security” Third World Economics1-15 March 2005, Third World Network
50 Ibid.
51 WTO Agreement on Agriculture: TheImplementation Experience of DevelopingCountries, FAO
52 Raja, Kanaga. “Decline in Commodity PricesThreatens Food Security” Third World Economics1-15 March 2005, Third World Network

30 THE IMPLICATIONS OF DUMPING OF AGRICULTURAL PRODUCTS IN ASIA: ASIAN FARMERS’ UNTOLD MISERY
AbbreviationsAMS – Aggregate Measure of SupportAoA – Agreement on AgricultureBPPC - Clove Marketing and Buffer Stock AgencyBULOG - Badan Urusan Logistik (IndonesianNational Food Logistics Agency)CAP – Common Agricultural PolicyE.U. – European UnionEUR- EuroFAO – Food and Agriculture OrganizationGATS - General Agreement on Trade in ServicesGBP- Pound Sterling (United Kingdom Pound)IMF – International Monetary FundLDCs – Least Developed CountriesNAMA – Non-agricultural Market AccessMAV - Minimum Access VolumeNGOs – Non-governmental OrganisationsNTBs – Non-tariff BarriersOECD - Organisation for Economic Co-operationand DevelopmentPHP- Philippine PesoQRs - Quantitative RestrictionsSAP – Structural Adjustment ProgrammeSDT – Special Differential TreatmentSP – Special ProductsSSG - Special SafeguardSSM – Special Safeguard MechanismTHB – Thailand BahtTNCs – Transnational CorporationsTRP – Tariff Reform ProgrammeTRQs - Tariff Rate QuotasU.K. – United KingdomUNCTAD - United Nations Conference on Tradeand DevelopmentU.S – United StatesUSD – Unite States DollarWTO – World Trade Organization
Definition of Terms1. Ad valorem - Instead of imposing specific taxes(i.e. specific amount applied to a specific unit ofimports, ex. Php 2 per liter of petroleum), or insteadof assigning tariffs on goods regardless of quantityand value, tariffs on ad valorem are applied oncertain ranges of values (ex. 2% on 100-500million US dollars worth; 5% on 501 to 1,000million US dollars, etc.)
2. de minimis - rules permitting exemption fromnotification for state aid to farmers, fishermen, andprocessing and marketing companies, below acertain threshold; the total must make up no morethan 5% of agricultural production for developedcountries and 10% for developing countries.
3. G8 - The Group of eight countries: Canada,France, Germany, Italy, Japan, Russia, the UnitedKingdom, and the United States.
4. G20 - The Group of 20 countries: Egypt, Nigeria,South Africa, Tanzania and Zimbabwe, China,India, Indonesia, Pakistan, Philippines andThailand, Argentina, Bolivia, Brazil, Chile, Cuba,Guatemala, Mexico, Paraguay, Uruguay andVenezuela.
5. G33 – The group of 33 countries: Antigua andBarbuda, Barbados, Belize, Benin, Botswana,China, Congo, Cote d’Ivoire, Cuba, DominicanRepublic, Grenada, Guyana, Haiti, Honduras,India, Indonesia, Jamaica, Kenya, Republic ofKorea, Madagascar, Mauritius, Mongolia,Mozambique, Nicaragua, Nigeria, Pakistan,Panama, Peru, Philippines, Saint Kits and Nevis,Saint Lucia, Saint Vincent and the Grenadines,Senegal, Sri Lanka, Suriname, Tanzania, Trinidadand Tobago, Turkey, Uganda, Venezuela, Zambiaand Zimbabwe.
6. In-quota and out-quota- when tariff reductiondoes not result in significant market access orwhen the country opts not to tariffy and retainsnon-tariff measures, the “minimum accessopportunity” is used – this provides that the countrymust import a certain amount of the productanyway. But when, still, the minimum access isnot enough, the WTO has created options byallowing imports at specified quantities and limited

31THE IMPLICATIONS OF DUMPING OF AGRICULTURAL PRODUCTS IN ASIA: ASIAN FARMERS’ UNTOLD MISERY
volumes at a second lower tariff lower than theusual tariff rate. The lower tariff rate is referred toas “in-quota”; the quantity of goods imported atthis lower tariff rate is called the tariff-rate quotas.Once the quantitative limit is reached, the highertariff (“out-quota”) is applied on subsequentimports.
7. Local content rules - refer to policies that requireproducts should be produced with certain amountof local components. Parts of garments, forinstance, may be sourced from China and othercountries as long as certain percentage or partsof the finished garment should be sourced locally.

Other Publications by PAN AP:Debug Your Home The Natural Way
“Debug Your Home the Natural Way” is published by Pesticide Action Network Asiaand the Pacific (PAN AP) in collaboration with SOS and ERA Consumer. This handylittle book offers simple, non-toxic methods to help keep over 30 household and gardenpests at bay. It also provides simple recipes to make natural pest repellents. Containingimportant information on the health effects of household pesticides, this book is a must-read for all consumers. Start using natural, safer pest control solutions today to protectyourself and your family!
Women’s Wisdom
Through the ages, women have played a crucial role in agriculture and its development,providing food security for millions all over the world. Involved in all aspects ofagriculture from sowing to harvesting and seed management, women have developed avast amount of valuable experience and knowledge. WOMEN’S WISDOM is atestament to the wealth of knowledge of women farmers in Pakistan, Indonesia, and thePhilippines. Pilot studies in these countries uncover real life accounts of women’swisdom in sustainable agriculture in these three countries and compare these with the illeffects of the Green Revolution on agriculture.
Bilateral Free Trade And Investment Agreements And The Us Corporate BiotechAgenda
This special release by PAN AP and PCFS is the first in a series on food sovereigntyissues. It focuses on the bilateral free trade and investment agreements between the USand the South describing how such agreements are being used as a conduit forspreading genetically-modified organisms around the world and promoting USagricultural technology and its corporate and geopolitical interests.
Appetite For Destruction: The Real Issues Behind Bird Flu And Other Outbreaks
In the wake of the fresh avian flu outbreak in Asia, the Middle East and Europe, PANAP has released a new publication entitled “Appetite for Destruction”.This book tackles the overwhelming threat of zoonoses (diseases that can spread fromanimals to humans) such as the avian flu, Nipah virus and mad cow disease (BSE). Thebook identifies unsustainable animal farming practices, the over-use of chemicals andantibiotics, pollution, dwindling biodiversity, and neoliberal globalization in Asia as themain contributing factors in the emergence and unprecedented spread of these diseases.Scientists are especially concerned over the risk of zoonotic influenza viruses becomingtransmittable between humans.